Article

State-of-Health Estimation and Anomaly Detection in Li-Ion Batteries Based on a Novel Architecture with Machine Learning

1
FAW Group, R&D Institute, Changchun 130013, China
2
Department of Computer Science, Chunbuk National University, Cheongju 28644, Republic of Korea
*
Author to whom correspondence should be addressed.
Batteries 2023, 9(5), 264; https://doi.org/10.3390/batteries9050264
Submission received: 10 March 2023 / Revised: 24 April 2023 / Accepted: 4 May 2023 / Published: 8 May 2023
(This article belongs to the Special Issue Advances in Battery Management Systems)

Abstract

:
Variations across cells, modules, packs, and vehicles can cause significant errors in the state estimation of LIBs using machine learning algorithms, especially when trained with small datasets. Training with large datasets that account for all variations is often impractical due to resource and time constraints at initial product release. To address this issue, we proposed a novel architecture that leverages electronic control units, edge computers, and the cloud to detect unrevealed variations and abnormal degradations in LIBs. The architecture comprised a generalized deep neural network (DNN) for generalizability, a personalized DNN for accuracy within a vehicle, and a detector. We emphasized that a generalized DNN trained with small datasets must show reasonable estimation accuracy during cross validation, which is critical for real applications before online training. We demonstrated the feasibility of the architecture by conducting experiments on 65 DNN models, where we found distinct hyperparameter configurations. The results showed that the personalized DNN achieves a root mean square error (RMSE) of 0.33%, while the generalized DNN achieves an RMSE of 4.6%. Finally, the Mahalanobis distance was used to consider the SOH differences between the generalized DNN and personalized DNN to detect abnormal degradations.

1. Introduction

Li-ion batteries (LIBs) are widely used in various applications, and deep neural networks (DNNs) were increasingly adopted to estimate their states, especially as battery management systems are connected to cloud systems. However, the effect of the hyperparameters on the accuracy of the LIB state estimation using DNNs was not adequately studied. While many DNNs can be generated with various hyperparameters outside of models, domain experts can optimize them for specific applications [1]. Nevertheless, the performance of a model depends on the specific problem and data characteristics. Black-box methods [2], such as Bayesian optimization, genetic algorithms, or particle swarm optimization, were used to find the optimal hyperparameters. However, these methods have limitations in practice, since a single hyperparameter can have an impact on multiple other hyperparameters, making it challenging to find the global optimal solution using black-box methods alone. Therefore, it is essential to understand how the hyperparameters affect the model’s accuracy and to develop effective hyperparameter optimization strategies.
LIBs are essential components in electric vehicles, but accurately estimating and verifying their internal states, including the state of charge (SOC), state of health (SOH), state of energy (SOE), state of power (SOP), state of temperature (SOT), and remaining useful life (RUL), remains a challenge in real-world scenarios [3]. Despite the potential of DNNs to address this challenge, their adoption was hindered by several factors, including (1) limitations in the processing power, physical memory, and communication speed of battery management systems (BMSs); (2) difficulty in labeling the internal states of LIBs, as they are not directly measurable; (3) insufficient data to train DNNs due to the lack of logging or transmission of the necessary data by BMSs to internal memory or cloud servers; and (4) the safety-critical nature of BMSs, which are typically mixed-critical systems, while DNNs are nondeterministic algorithms. However, recent advances in architectural design and cloud technologies enabled automotive systems to send large amounts of data and adopt DNNs for the internal state estimation of LIBs [4].
Figure 1 presents a generalized high-level architecture that utilizes data-driven algorithms in the cloud and in a vehicle for various applications in the energy, body, and chassis domains. The architecture consists of three layers: electronic control units (ECUs) for real-time data processing and safety-critical functions, edge computers for temporary data storage and personalized machine learning algorithms, and the cloud for data storage, analysis, and generalized machine learning algorithms. The ECUs, edge computers, and cloud are designed to accommodate different levels of computational power, data storage, and safety criticality. The offline process supports the overall components of three layers by providing initial machine learning algorithms from laboratory data and continually improving these algorithms with historical data from the cloud. The data-driven methods are represented by green boxes, while blue boxes indicate the existing components that are not specific to data-driven techniques. The proposed architecture facilitates the integration of data-driven algorithms into safety-critical automotive systems for improved estimation accuracy and safety.
The proposed architecture for the energy domain, as shown in Figure 2, was derived from the generalized high-level architecture. The energy domain architecture was designed to tackle two key assumptions that arise in real-world scenarios related to catastrophic failures and the limitations of the training dataset. First, catastrophic failures may occur when system components such as LIBs and BMSs exceed the managed tolerance levels. To mitigate these risks, anomaly detection techniques can be employed. It is important to note that some techniques such as distance-based techniques may exhibit worse performance in high-dimensional data [5]. However, our diversified DNNs, which estimate the SOH and reduce dimensionality, allow for outlier detection using their outputs. Second, the training dataset may not encompass all possible variations in the battery state, leading to suboptimal solutions and overfitting [6]. In contrast to the majority of model-based and data-driven methods that assume the observed variance [7,8,9], our approach incorporates the impact of the unobserved variance in the battery state estimation.
The architectural design enhances the estimation accuracy and safety in automotive systems by combining deterministic and nondeterministic algorithms. The cloud manages the energy storage systems of vehicles, utilizing a generalized DNN for the battery state estimation and personalized DNNs for online training, providing scalable computing power and data storage but with potential risks of data loss from vehicles. Personalized DNNs, trained using data from a single vehicle, consider the variations in driving and storage conditions, while a generalized DNN, trained using data from multiple vehicles, accounts for the variations from vehicle to vehicle, cell to cell, module to module, and pack to pack. Continual online training of personalized DNNs keeps the local DNNs on the energy domain control units (e-DCU) in each vehicle up to date, mitigating the risk of data loss. Comparing the results of the generalized DNN and personalized DNNs enables the detection of outliers, considering variations that were not observed in the training data. The effectiveness of detecting the abnormal states of LIBs or systems relies on both the generalizability of the generalized DNN and the accuracy of the personalized DNNs. A Luenberger observer, a deterministic algorithm on the BMS with Automotive Safety Integrity Level (ASIL) D, provides the ASIL D signals. The ASIL rates the potential severity of an automotive system malfunction or failure, with level D being the highest level of risk and A being the lowest level of risk. ASIL D is typically required for BMS in electric vehicles due to the criticality of the battery operation.
Nondeterministic algorithms such as the extended Kalman filter (EKF), recursive least square, and DNN on the e-DCU are passed through a plausibility check or a selection function. The ASIL B signals from these algorithms are bounded by the ASIL D signals to ensure that the estimation results are within the acceptable range as determined by the deterministic algorithm, thereby improving accuracy while maintaining safety [10]. The selection function can incorporate ensemble strategies such as stacking and voting to optimize performance while considering resource constraints. This is particularly useful when training data are limited, and the cloud does not have a large dataset from vehicles [11].
A significant challenge in using DNNs for SOH estimation is the limited availability of complete datasets for LIB degradation. Obtaining this data is a time-consuming process that involves both laboratory testing and data collection from operational vehicles over an extended period. Due to resource constraints and unrevealed variations in development and manufacturing processes, it is impractical to train a DNN using large datasets that account for all variations at the initial stage. To address this challenge, it is essential to improve the generalizability of models trained using small datasets with good cross-validation performance. Generalizability refers to the ability of a model to accurately estimate the SOH when applied to data and conditions that differ from those it was trained on. Enhancing the generalizability of the model ensures that it can perform effectively in real-world scenarios before additional online training.
This paper proposes a novel system software architecture for estimating the state of health (SOH) in lithium-ion batteries intended for use in electric vehicles, incorporating functional safety considerations. The architecture includes a personalized DNN, a generalized DNN, and an outlier detector. Firstly, an overview of the challenges of SOH estimation in batteries is provided, along with a discussion of related work in this area. The approach to data cleansing and feature extraction from the NASA Prognostic Center of Excellence battery data [12] is then described. Subsequently, experiments are presented to evaluate the feasibility of the proposed architecture and to examine the existence of generalized and personalized DNNs through various hyperparameter settings. An outlier detector is also utilized to highlight variations and detect abnormal states in the SOH estimation between the generalized DNN and personalized DNN. Finally, the findings, limitations, and future research directions are discussed. This study makes a significant contribution to the ongoing research in this field, while also providing a roadmap for future studies.

2. Related Works

2.1. SOH and RUL Estimation Using DNNs

Previous research employed various types of DNNs to estimate the SOH and remaining useful life (RUL) of LIBs. For example, Venugopal et al. [13] compared the prediction accuracy of the SOH and RUL among recurrent neural networks (RNNs), convolutional neural networks (CNNs), DNNs, linear regression, and long short-term memory (LSTM) running on the Raspberry Pi. However, they did not provide the specific hyperparameters used for each network. Long et al. [14] compared the prediction accuracy of the RUL among the LSTM, back propagation neural network, and nonlinear autoregressive models. Their experimental results showed that the prediction accuracy of the LSTM was better than the others. However, unfortunately, the results cannot be reproduced due to their not providing the hyperparameters for each network, since the accuracy depends on each network’s hyperparameter configurations.
Hsu et al. [15] proposed a DNN architecture comprising a discharge DNN predicting unknown batteries, a full DNN predicting unknown charging policies, and an RUL DNN predicting for an unknown age of unknown used batteries. The input features were the (1) charge capacity, (2) discharge capacity, (3) running temperature average, (4) temperature min, (5) temperature max, (6) total charge time, (7) End of Life (EoL) and (8) discharge time from discharge direction, (9) EoL and (10) charge time from charge direction, (11) discharge cycle, and (12) charge cycle. The input features from (1) to (8) were used for the discharge DNN to predict the EoL and charge time. The input features from (1) to (10) were used for the full DNN to predict the EoL, charge time with the predicted EoL, and the cycle-by-cycle voltage curve. The input features from (1) to (12) were used for a full and RUL DNN to predict the present age. The feature analysis results by the Deep Taylor Decomposition showed that the most influential features of the EoL were all the data-driven features from (7) to (12). Finally, their result showed a mean absolute percentage error of 6.46% using only one cycle of testing.
Khaleghi et al. [16,17] employed a NARX set by 10 neurons for hidden layers and the series-parallel mode for the feedback to estimate the SOH and RUL. The estimated SOH became a feature to predict the RUL with the dynamic time warping method that calculated the distance between the test and reference components for the pairwise similarity of the health degradation trajectories of various reference components. However, building reference components trained by various conditions may not be easy. In particular, it is impractical to expect training in all variations from the development and manufacturing process across cells, modules, packs, and vehicles in automotive systems.

2.2. Battery State Estimation Using FFNN

In previous research, FFNNs were widely used for estimating the SOC, SOH, and state of power (SOP) of LIBs. For example, Ezemobi et al. [18] used an FFNN with the incremental capacity curve to estimate the SOH, with a notable model execution time of 8.34 μs on the F28379D microcontroller unit. Li et al. proposed an FFNN trained by pulse current injection to estimate the SOC, SOH, and SOP [19]. They used a single hidden layer with five network weight constraints, a 0.1 dropout rate, a 0.001 learning rate, a 64 batch size, 32,000 training epochs, a rectified linear activation unit (ReLU) , and an adaptive moment estimation (ADAM) optimizer. The results showed that the average SOH, SOP, and SOC root mean square errors (RMSEs) were 0.0057, 0.0069, and 0.0072, respectively. However, they did not perform cross validation. Xia et al. employed an FFNN with two hidden layers and two dropout layers, with input features including delta voltage during the constant current charge, delta voltage during the discharge, charge time, delta current during the constant voltage charge, and the delta temperature during the constant voltage charge [20]. Their results showed that the best performance was achieved with 128 neurons in the hidden layers.

2.3. DNNs from the NASA Dataset

In previous research, various types of deep neural networks were employed to estimate the SOH and RUL of LIBs using battery datasets from the NASA dataset. For example, Chemali et al. [21] employed a convolutional neural network to estimate the SOH from the voltage, current, and temperature features in the charging direction. They used ReLU as the activation, the mean square error (MSE) as the loss function, and ADAM as the optimizer and added Gaussian noise to the data for training data augmentation to avoid overfitting.
Navega et al. [22] employed a nonlinear autoregressive model to estimate the SOC with the current, voltage, temperature, and previous SOC features. They used the maximum correntropy criterion as the cost function to train the model. Khan et al. [23] proposed a convolutional LSTM and LSTM hybrid network to estimate the SOH. They showed that the proposed model had better prediction accuracy than other models.
Shi et al. [24] proposed a physics-informed LSTM that combined the calendar and cycle aging model with an LSTM layer to predict the RUL. Their experimental results showed that the prediction accuracy of the LSTM was better than that of the bidirectional LSTM, but they did not provide the hyperparameters for each network. Zhao et al. [25] proposed a fusion neural network model that combined LSTM with the broad learning system algorithm to predict the battery capacity and RUL. They trained the model with various training data sizes but did not perform cross validation.
Toughzaoui et al. [26] combined a CNN with an LSTM to predict the SOH and RUL. They used a K-means clustering algorithm to classify the characteristics of voltage and temperature but did not perform cross validation. Chinomona et al. [27] employed an LSTM to predict the RUL with the proposed forward feature selection method but did not provide a feature analysis. Wu et al. [28] employed a radial basis function neural network with the improved gray wolf optimization but did not provide a feature analysis.
Overall, these previous studies employed various types of DNNs and achieved good results in estimating the SOH and RUL of lithium-ion batteries using the NASA dataset. However, some of these studies did not provide specific hyperparameters or cross-validation results, making it difficult to reproduce their results.

3. Data Cleansing and Feature Extraction

3.1. NASA DATASET

According to the experiment’s report from the NASA Prognostic Center of Excellence, all LIBs were charged using the CC-CV method with a setting of 1.5 A for the CC, 4.2 V for the CV, and 20 mA for the taper current. However, unlike the charging direction, all the LIBs were discharged with 2 A and varying termination voltages of 2.7 V, 2.5 V, 2.2 V, and 2.5 V, respectively. This resulted in the degradation of the LIBs being consistent in the charging direction but varied in the discharge direction. Thus, we believe variations of operation conditions existed in the discharging directions. All lithium-ion batteries (LIBs) with an initial capacity of 2 Ah were subjected to cycling until their rated capacities reached 1.4 Ah at ambient temperatures of 25 °C. The cell temperature varied between 25 °C and 40 °C during the cycling process.
As seen in Figure 3a, there were voltage jumps after the discharge termination. In order to ensure the validity and reliability of the dataset, the voltage jumps occurring after the discharge termination (Figure 3b) were removed. The experimental results suggest that the accuracy of the DNN models in estimating the SOH of the LIBs was poor without appropriate data cleansing. On the other hand, the discharge voltages below the termination voltages, preserved as undervoltages, can have an impact on the degradation of the LIBs. Abnormal voltages at the 84th charging cycle and during the taper charge were detected (Figure 3c). Given that NASA’s experimental reports specify consistent charging conditions, we removed the charge data from the dataset to avoid potential confounding factors. To ensure the data validity, we verified the data size, as it can affect the performance of the models during training and validation. As shown in Figure 3d, the data sizes of the LIB B5, B6, and B7 suddenly increased from 200 to 300 at the 50th cycle, while the data size of the LIB B18 smoothly decreased.
The SOH is defined as the ratio of the present rated capacity value C a p c i t y p r e s e n t to the initial rated capacity C a p c i t y i n i t i a l in Equation (1)
S O H = C a p c i t y p r e s e n t C a p c i t y i n i t i a l
The SOHs of the LIBs decreased with each cycle, as depicted in Figure 3e. It is noteworthy that despite the lowest termination voltage condition, the capacity fade rate in the LIB B7 was slower compared to the other LIBs. This indicated the presence of variations among the LIBs, with LIB B5 exhibiting the slowest capacity fade rate under consistent discharge conditions [29].

3.2. Feature Extraction

The proper selection of features is essential for achieving optimal performance in machine learning models [30]. To mitigate the potential loss of data during transmission from the energy storage system (ESS) to the cloud [31], the Coulomb calculation is widely used as a reliable method to estimate the internal battery state, as in Equation (2). The accumulated capacity is calculated by summing the Coulomb values, as described in Equation (3), and is a vital factor in SOH estimation. The Coulomb calculation incorporates the present current C u r p r e s e n t , previous current C u r p r e v i o u s , present timestamp T i m e p r e s e n t , and the previous timestamp T i m e p r e v i o u s . The accuracy of the Coulomb depends on the frequency of the current measurement.
C o u l o m b C u r p r e s e n t + C u r p r e v i o u s 2 T i m e p r e s e n t T i m e p r e v i o u s 3600
A c c u m u l a t e d   C a p a c i t y i = 0 n C o u l o m b i
The relationships between the SOH and the feature candidates in the NASA dataset are illustrated in Figure 4. The data recorded under a consistent ambient temperature and consistent discharge current conditions may not exhibit a strong correlation with the SOH. The Coulomb feature appears to be more appropriate for classification purposes, as opposed to regression, despite the SOH being a continuous numerical value. The time and accumulated capacity are inverse features, and, therefore, either the time or the accumulated capacity can be selected as a feature. The capacity is linearly related to the SOH due to its calculation using the initial and present capacity.
The observed regeneration of the SOH in the NASA Prognostics Center of Excellence battery dataset does not correspond to the physical behavior of lithium-ion batteries, as the real SOH cannot exhibit such regeneration [3]. Although the partial regeneration phenomenon could potentially have significant implications for SOH estimation, the underlying reason for this phenomenon remains unclear. The available data did not allow for further investigation into this matter. In general, capacity based on integrated current without measurement open circuit voltage can be easily influenced by inconsistent cycle conditions from humans and equipment. Therefore, this study utilizes discharging data to estimate SOH. Furthermore, the degradation factor is expected to be learned by DNN models from discharging data under various conditions. Given the identical charging conditions, it can be assumed that the cells experience the same level of degradation, leading to minimal variation in the results. It is worth noting that the dataset was widely used in previous studies despite the potential training difficulties that may arise from the presence of these regenerations. Additionally, we acknowledge the work of Zhao et al. [32], who studied RUL estimation while taking this regeneration phenomenon into account.
A Pearson correlation analysis was conducted to quantify the inter-feature correlation and its impact on the SOH estimation task, as illustrated in Figure 5. The analysis revealed a perfect linear relationship between the SOH and capacity with a Pearson correlation coefficient of 1.0. This result suggests that the capacity provided no additional information for the estimation of SOH, which was already represented by the SOH measurement. Including capacity in the input feature set may thus lead to redundant information and risk overfitting the model. As such, it is recommended to exclude capacity from the input feature set in the SOH estimation task. The correlation analysis also indicated that the time and the accumulated capacity were inverse features with a coefficient of −1. The correlation between the SOH and the current was low, with a coefficient of 0.0064, while the correlation between the SOH and the Coulomb, calculated by the current and time, was −0.51. Based on these findings, the final input feature set for the SOH estimation was determined to include the voltage, current, temperature, Coulomb, and time, while excluding the capacity and incremental capacity.

4. Experiments and Results

4.1. Training and Testing Method

To evaluate the feasibility of the proposed architecture and demonstrate the necessity for both the generalized and personalized DNN models, we trained and evaluated the DNN models for predicting the SOH. We utilized the Mahalanobis distance [32] as an outlier detector to detect abnormal states by considering variations between cells or a generalized DNN and personalized DNNs, as shown in Figure 6. By evaluating both the generalized and personalized DNN models, we demonstrated their respective strengths and limitations in predicting the SOH.
For the generalized DNNs, each model was trained on one LIB and evaluated by the average prediction accuracy across all the LIBs. In contrast, for the personalized DNNs, all the LIBs were used to train the model, and the prediction accuracy was evaluated for each individual LIB. All the models were trained and validated with 300,000 training epochs, with the best internal parameters recorded automatically to avoid overfitting from prolonged training. To evaluate the accuracy of the models, we utilized the RMSE as the performance evaluation metric during both the training and validation process. The RMSE was chosen due to its widespread usage in similar studies to assess the accuracy of prediction models. The RMSE measures the difference between the predicted and actual values, which allows for comparison with previous research and facilitates a more comprehensive understanding of the model performance.
TensorFlow, Python, and Jupyter Notebook were utilized to develop a model generation and validation program. The model generation section enabled the creation of multiple models by inputting hyperparameters such as loss functions, learning rate, β_1, β_2, and the AMSGrad of the ADAM optimizer, the number of hidden layers and nodes, batch normalization, L_2 regularization, dropout regularization, and Gaussian noise. The best model, as determined by the accuracy during training, was automatically recorded along with its internal parameters, hyperparameters, and training and validation histories. This prevented overfitting issues that may arise from excessive training and allows for complete automation without human intervention by instantiating the model generation and training and validation classes with various hyperparameters. Table 1 summarizes the hyperparameters used in the generalized model (M57) and personalized model (M65) among the 65 models generated and evaluated in Table A1 and Table A2.

4.2. The Generalized Models

The generalized models were trained from LIB B7 and validated using LIB B6. To assess the generalizability of the models, cross validation was performed using LIB B5 and B18, which helped to identify issues with overfitting and poor generalization. By cross-validating the models, it was ensured that the models could accurately predict the SOH of other LIBs beyond those used for training and validation. The best generalized models were selected based on the highest average accuracy among the models. The mean SOH prediction values were used to evaluate the accuracy, since the SOH does not change much within a cycle in real-world applications. The real-time SOH provides insight into the difficulty of training at each cycle, with a significant difference between the minimum and maximum indicating a challenging training process.
Among the DNN models evaluated in this study, models 57, 40, 59, and 41 demonstrate higher average accuracy than the other models. These models were generated using tanh activation and Huber loss functions and did not include batch normalization, dropout regularization, or AMSGrad. Table 2 provides a comparison of the differences between these models. Notably, model 57, which included four hidden layers and did not use L2 regularization, exhibited the highest average accuracy.
The training and validation accuracy, number of training epochs required to optimize the model parameters, as well as the real-time SOH and mean SOH predictions are presented in Figure 7. The model 57 was trained for approximately 6000 epochs. The predictions for the LIB B6 were found to be more accurate compared to the other cells. However, the SOH prediction for the LIB B7 deviated at approximately the 125th cycle, while the overall SOH prediction for the LIB B5 was biased. The convergence of the SOH prediction for the LIB B18 was observed only at approximately the 50th cycle. The accuracy comparison of the four best models in Table 3 reveals similar accuracies, suggesting that the L2 regularization was not a critical factor. However, the low accuracies for LIB B5 and B18 compared to LIB B6 and B7 may be attributed to variations between the different LIBs or the insufficient training of the models.

4.3. The Personalized Models

In contrast to the generalized models, the personalized models were trained and validated using data from all the LIBs without cross validation, with the aim of achieving the highest possible accuracy without consideration for generalizability. The best personalized models were selected based on the highest training and validation accuracy among all models. Among the DNN models evaluated, models 65, 7, 8, and 46 demonstrated higher training and validation accuracy than the other models and were generated using batch normalization, AMSGrad, and Huber loss functions without dropout regularization. The differences between these models are outlined in Table 4. Notably, the ReLU activation function used in models 65, 7, and 18 was found to be more accurate compared to the tanh activation function used in model 46, suggesting that the ReLU activation function was better suited for predicting the SOH.
The experiments demonstrated that model 65, an AMSGrad-batch FFNN, achieved the highest training accuracy among all the models. Figure 8a–d displays the loss during training and the corresponding SOH prediction curves for all LIBs. However, the results for LIB B18 were not obtained using the original dataset, as the SOH predictions for LIB B18 showed a significant improvement in accuracy using a cleaned dataset, with 11.3544% RMSE for the original dataset and 0.2513% RMSE for the cleaned dataset. Comparing model 65 with the improved radial basis function NN [28] using the same dataset, Table 5 demonstrates that model 65 achieved higher accuracy in terms of the SOH prediction for all the LIBs. The LIB 18 results from [28] were not available. These results suggest that the personalized models, particularly model 65, could be effective for predicting the SOH of LIBs in real-world applications.

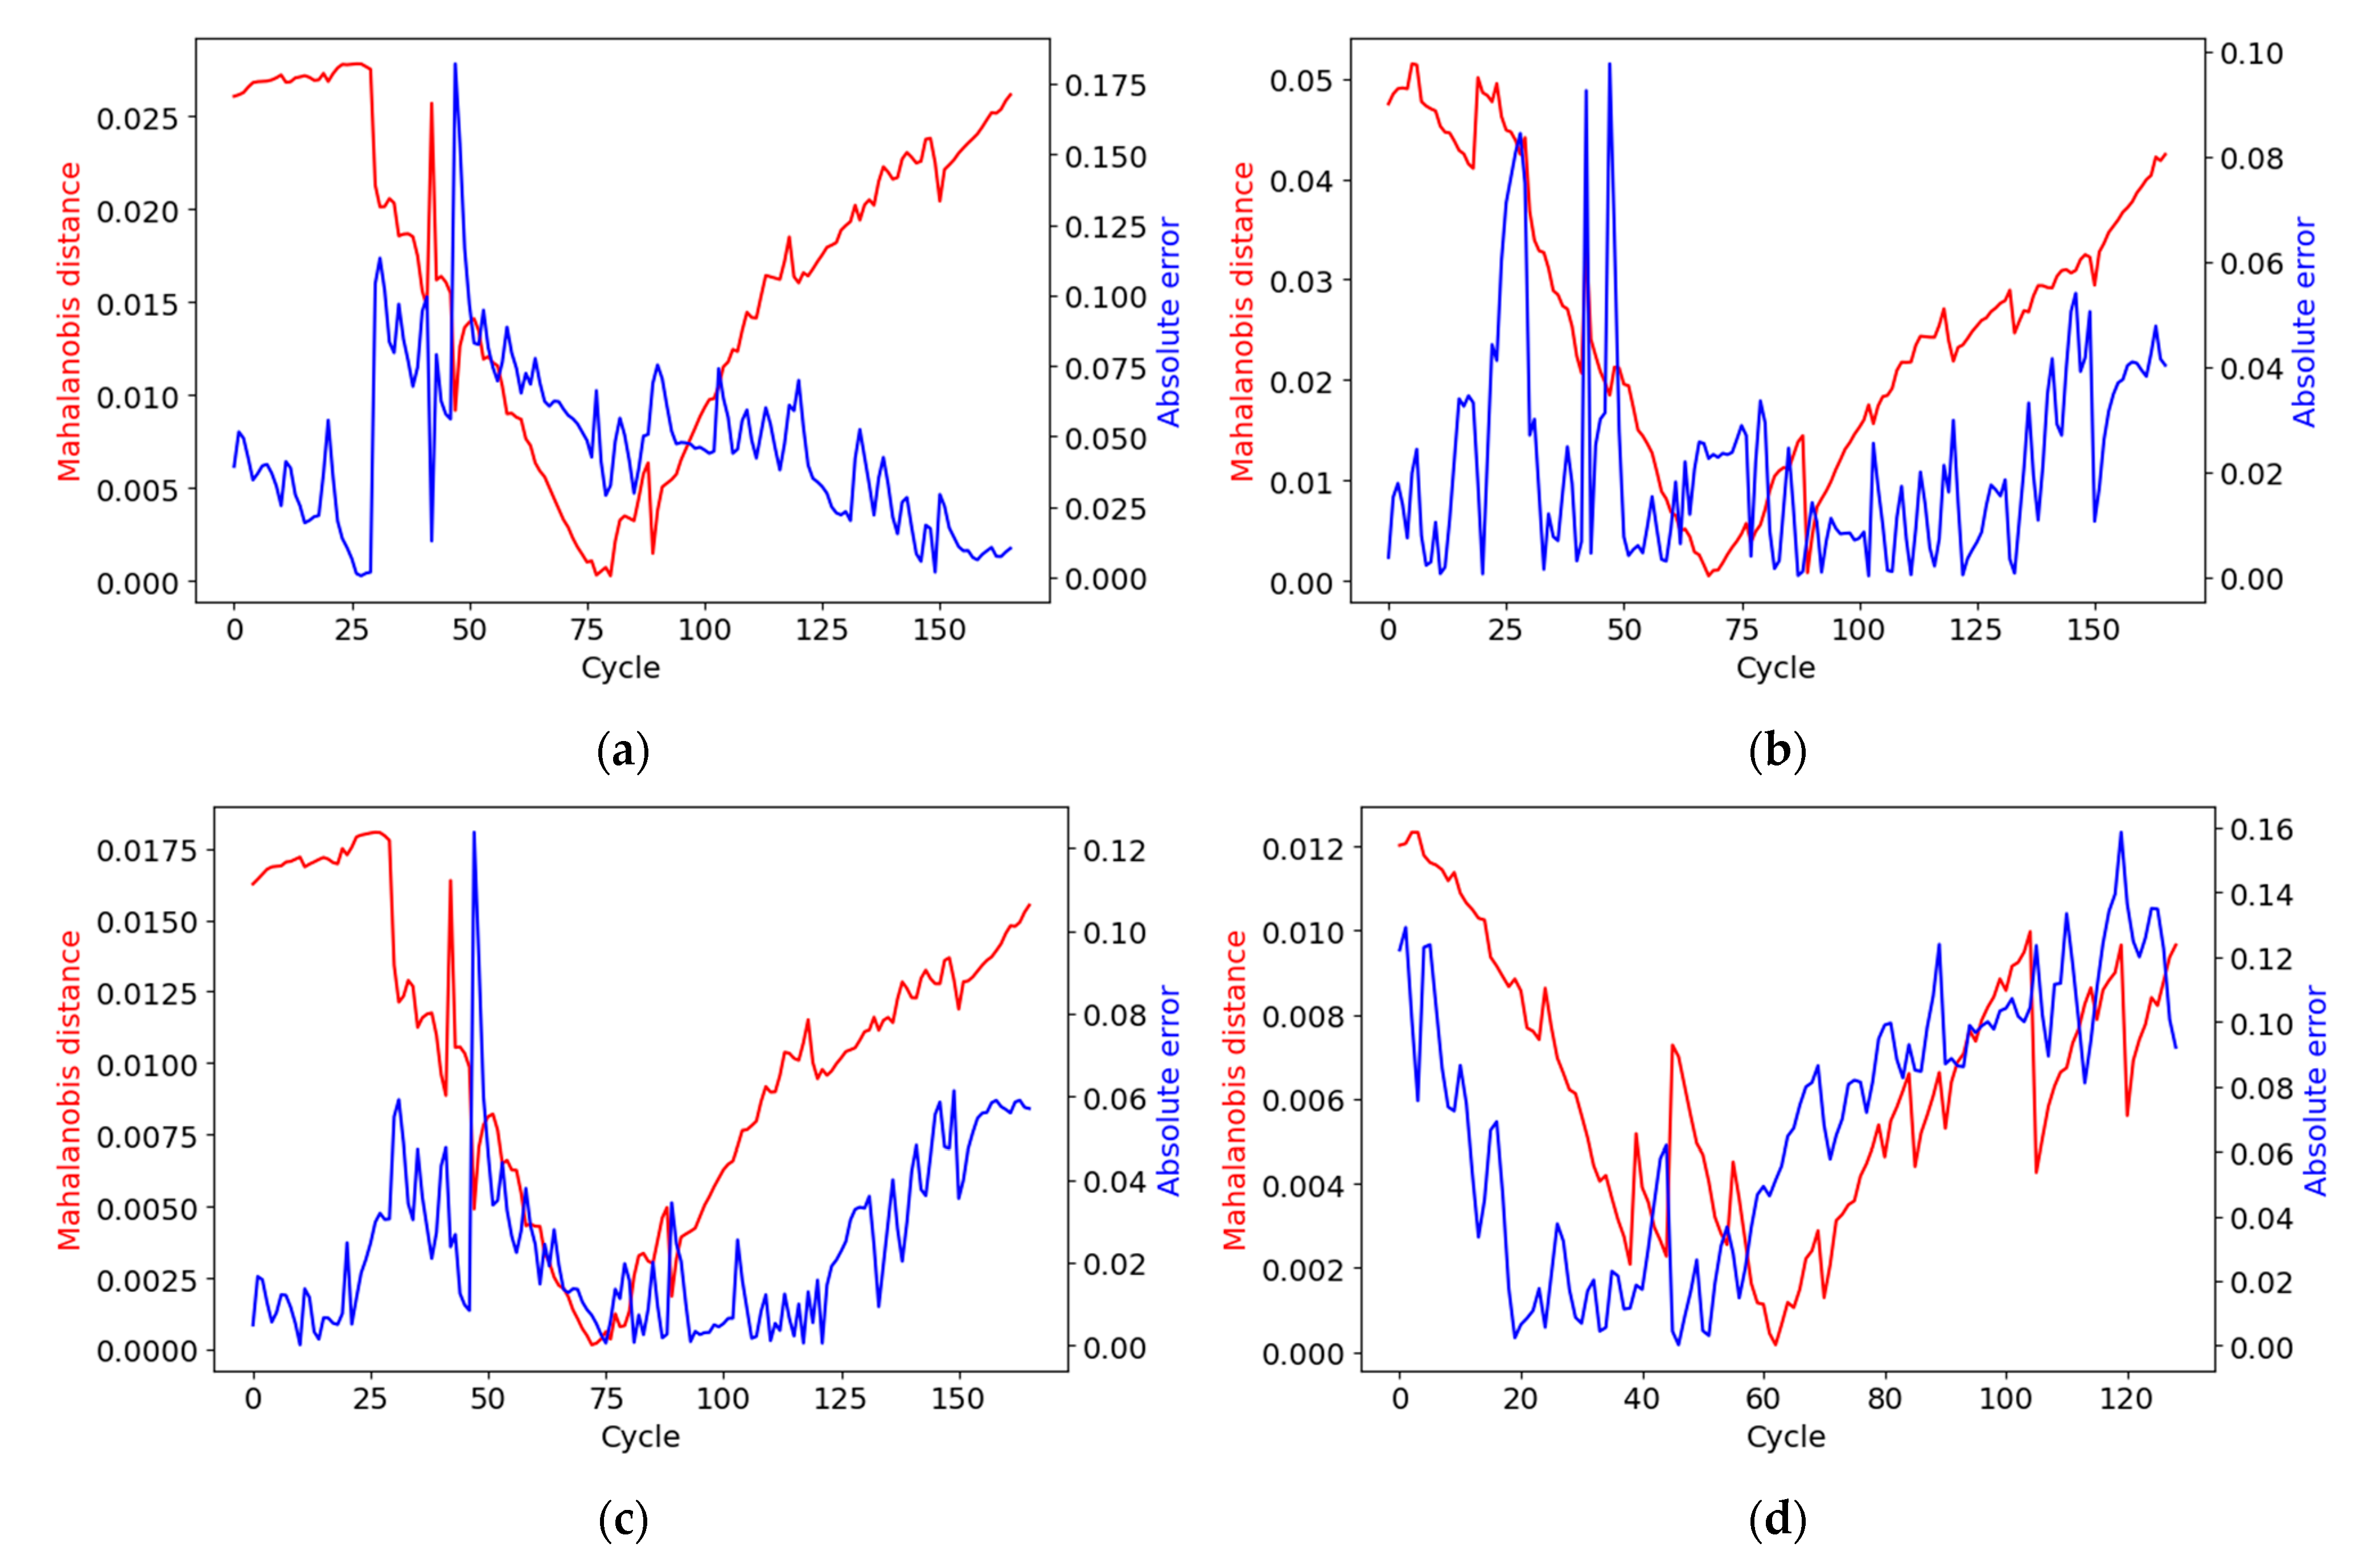
4.4. Outlier Detector

To compare the performance of the two DNNs, we calculated the absolute error between their SOH estimations using the mean absolute error (MAE) metric. A high MAE could indicate the divergence of the two algorithms, which may be caused by either poor training of the neural networks or large cell-to-cell variations in the data. The MAE provides a measure of the overall difference between the two algorithms, but it may not be able to identify the exact reason behind it.
To complement the MAE, the Mahalanobis distance was employed as an additional measure to detect abnormal degradation. The Mahalanobis distance considers the covariance of the data and captures the correlations between different variables. The gradient of the Mahalanobis distance was used to monitor the rate of change of the distance with respect to the SOHs, which could indicate the occurrence of abnormal degradation. By monitoring the rate of change in the Mahalanobis distance, abnormal degradation can be detected in a more nuanced way than using the MAE alone. The use of both the MAE and Mahalanobis distance provides a comprehensive approach to detecting abnormal degradation and ensures the accuracy and safety of the system.
The Mahalanobis distance, shown in Equation (4), which considers the covariance between variables, is a more accurate measure of dissimilarity compared to the Euclidean distance.
d M ( x k ) = x k μ T 1 x k μ
A vector x k consists of two variables, G_SOH and P_SOH, representing the SOH of a generalized DNN and a personalized DNN, respectively, as shown in Equation (5).
x k = ( G _ S O H k , P _ S O H k ) T
Each vector is subtracted by the mean μ = ( G _ S O H ¯ , P _ S O H ¯ ) T ; then, we multiply the deviation vector by the inverse of the covariance matrix for the correlation between G_SOH and P_SOH, as shown in Equation (6).
1 = 1 m k = 1 m C o v ( G _ S O H k , G _ S O H k ) k = 1 m C o v ( G _ S O H k , P _ S O H k ) k = 1 m C o v ( P _ S O H k , G _ S O H k ) k = 1 m C o v ( P _ S O H k , P _ S O H k ) 1
Finally, the gradient of the Mahalanobis can be calculated by Δ d M ( x k ) Δ c y c l e .
Figure 9 presents the comparison of the Mahalanobis distance and the absolute error between the SOH estimations from the generalized DNN and the personalized DNN for all the LIBs. The MAE and covariances between model 57 and model 65 for all the LIBs were as follows:
MAE   0.0467   and   covariance   0.00861843 0.00900839 0.00900839 0.01024332 for LIB B 5
MAE   0.0214   and   covariance   0.01448305 0.01436208 0.01436208 0.01488714 for LIB B 6
MAE   0.024   and   covariance   0.00458561 0.00532588 0.00532588 0.00704912 for LIB B 7
MAE   0.0696   and   covariance   0.0006374 0.00135504 0.00135504 0.00674408 for LIB B 18 .
The results of our analysis revealed that the Mahalanobis distances for LIB B6 were relatively high despite the low absolute errors. This is attributed to the high covariance between the output variables, which may lead to an overestimation of the Mahalanobis distance or an underestimation of the absolute errors. On the other hand, the Mahalanobis distances for LIB B18 were relatively low despite the high absolute errors, which can be explained by the low covariance between the output variables. Additionally, we found that the gradient of the Mahalanobis distance for LIB B5 and B7 at the 38th cycle was approximately 0.005, indicating an abnormal degradation of these batteries. This suggests that the Mahalanobis distance can be a useful tool for detecting abnormal behavior in LIBs.

5. Hyperparameter Configuration

In order to efficiently and effectively find optimal models within limited computational resources, it is crucial to limit the range of hyperparameter configurations to be considered.

5.1. The Number of Hidden Layers and Nodes

Selecting the appropriate number of hidden layers and neurons for a model can be challenging, as it can lead to both overfitting and underfitting issues. However, based on empirical studies [33], models with two, three, four, or five hidden layers and 10 or 20 neurons were found to be effective when the number of input features is five or six.

5.2. Activation Functions

The selection of activation functions is an important aspect of building neural networks. We evaluated three commonly used activation functions: the rectified linear unit (ReLU) [34,35], sigmoid, and tanh. These functions can affect the performance of the model by controlling the nonlinearity and computational time.
s i g m o i d x = 1 1 + e x
T a n h x = e x e x e x + e x
R e L U x = m a x 0 , x = x ,   i f   x 0 0 ,   o t h e r w i s e
Among the activation functions, we selected the sigmoid of Equation (7), the tanh of Equation (8), and the ReLU of Equation (9), according to a recent empirical survey and benchmark [36].

5.3. Loss Functions

Supervised learning can be divided into classification and regression problems. There are several loss functions commonly used for regression problems such as the square loss, absolute loss, Huber loss, Log-cosh loss, Quantile loss, and ϵ-insensitive loss. The most commonly used method is the square loss [37,38]. We adopted the Huber loss function (Equation (10)), which combines both the square and absolute loss making it robust to outliers. The iterative testing may require finding the optimal value for the parameter δ .
L δ y , f x = 1 2 y f x 2 , i f   | y f x | δ δ | y f x | 1 2 δ 2 , o t h e r w i s e ,   w h e r e   δ > 0

5.4. Gradient Descent Optimizer

To mitigate the challenges of slow convergence, becoming trapped in local minima, and not escaping saddle points in the gradient descent for the SOH estimation with the NASA dataset, we used ADAM, which is less sensitive to the setting of parameters compared to traditional stochastic gradient optimizers. The optimizer used Equations (11) to (14) to calculate the first-order momentum (Equation (11)) and second-order momentum (Equation (12)) with setting parameters β 1 and β 2 . These parameters were gradually decayed as t increased, as specified in Equation (13). The internal model parameter vector θ was then updated in Equation (14) with a setting parameter α . This approach allows for the control of the learning rate with α and give updating penalties of the internal model parameter vector θ with β 1 and β 2 . The setting parameter ϵ was included to avoid the denominator becoming 0 when v t ^ is equal to 0. There are two significant variations of ADAM, AMSGrad [39] and Yogi [40], that can be used to improve convergence.
AMSGrad takes the maximum value of v ^ t 1 and v t to avoid increasing the learning rate, while Yogi changes Equations (11)–(15) to control the learning rate. In this study, we focused on evaluating the AMSGrad, which ensures the learning rate does not increase unnecessarily.
m t = β 1 · m t 1 + 1 β 1 · θ f t θ t 1
v t = β 2 · v t 1 + 1 β 2 · θ f t θ t 1 2
m t ^ = m t 1 β 1 t ,   v t ^ = v t 1 β 2 t
θ t = θ t 1 α · m t ^ v t ^ ϵ
v t = v t 1 + 1 β 2 s i g n v t 1 θ f t θ t 1 2 θ f t θ t 1 2

5.5. Batch Normalization, L2, and Dropout Regularization

Batch normalization (BN) improves training by reducing the internal covariate shift, defined as the change in the distribution of network activations due to the change in network parameters during training [41]. The BN normalizes each dimension x k from d-dimensional input x = x 1 x d for a layer (16). A normalized value is scaled and shifted by γ k and β k , as shown in Equation (17), where γ k is equal to V a r x k and β k is equal to E x k .
x ^ k = x k E x k V a r x k
y k = γ k x ^ k + β k
For a mini-batch B = x 1 m , a mean value u B , a variance σ B 2 , and a normalized value x ^ i are calculated by Equations (18)–(20), respectively. Finally, an activation y i is scaled and shifted by γ and β (21).
u B = 1 m i = 1 m x i
σ B 2 = 1 m i = 1 m x i u B 2
x ^ i = x i u B σ B 2 + ϵ
y i = γ x ^ i + β
BN is widely adopted in deep learning to improve training by reducing the internal covariate shift. However, there is ongoing debate as to the exact mechanisms by which BN improves training. Some studies suggest that the smoothness provided by BN may be a key factor in its effectiveness, leading to faster and more stable training although BN can make vanilla DNNs unstable [42]. Additionally, the effectiveness of other regularization techniques such as L 2 and Dropout regularization when used in conjunction with BN was debated [43]. In this study, we evaluated the impact of the BN and regularization techniques within the FFNN in the SOH estimation.

6. Discussion

The findings emphasize the necessity of both the generalized DNN and the personalized DNN, as they exhibited different hyperparameters and achieved generalizability and high accuracy, respectively. In addition, the Mahalanobis distance was utilized as an outlier detector to evaluate the feasibility of the proposed architecture and detect abnormal degradation at specific cycles.
However, there were several limitations to the study. Firstly, due to the limited availability of datasets, the generalized DNNs were not trained and evaluated on various cell types and operation conditions. Secondly, the analysis did not consider variations from module to module, pack to pack, and vehicle to vehicle, since the datasets came from cell tests. Thirdly, it was challenging to distinguish between the reasons for the differences, whether due to variations between cells or training problems of the generalized DNN, as no experiments were conducted on variations between cells.
The limitations of the present study can be addressed in future research by utilizing real-world large datasets from vehicles obtained through the cloud. This would enable the training and evaluation of the generalized DNN on various cell types and degradation conditions, as well as the consideration of variations from module to module, pack to pack, and vehicle to vehicle. Furthermore, conducting experiments to evaluate the variations between cells and packs can help distinguish the reasons for the observed differences highlighted by the Mahalanobis distance, whether they are due to variations in cells and packs or training issues of the generalized DNN.

7. Conclusions

The proposed architecture utilizing machine learning algorithms demonstrated the potential to enhance SOH prediction accuracy, identify unmanaged variations in manufacturing and development processes, and detect abnormal degradation. Through the integration of a generalized DNN trained on small datasets for generalizability, a personalized DNN trained on all datasets for accuracy, and an outlier detector to compare the outputs of the two DNNs, the necessity for both models in achieving high accuracy for all LIBs was demonstrated. The experiments identified two FFNN models with the highest accuracy among 65 models generated, achieving an average cross-validation accuracy of 4.6% RMSE for the generalized model and an average accuracy of 0.33% RMSE for the personalized model. The Mahalanobis distance was utilized to detect abnormal degradation by considering the differences between the outputs of the generalized DNN and the personalized DNN.
However, the study was limited due to the use of limited datasets and the lack of consideration for variations between the module to module, pack to pack, and vehicle to vehicle. As a result, future research will be conducted in four parts based on the feasibility analysis of the proposed architecture in this study. Firstly, data will be acquired from cells and packs used in real vehicles under various charging and discharging conditions in laboratory tests to further train and validate the DNN models and to assess their performance in real-world scenarios. Secondly, an embedded controller running the personalized DNN and outlier detectors will be prototyped, with a focus on optimizing its performance for use in electric vehicles. Thirdly, SOH labeling will be performed on the cloud data from vehicles, since the real SOH value is not easily measurable under real vehicle data. This process will involve developing new labeling techniques and validating them against existing methods. Finally, we will train a generalized DNN and personalized DNNs using labeled data from multiple vehicles and individual vehicles, respectively. We anticipate that the generalized DNN will improve with larger datasets, and the outlier detector will become more robust. These additional research efforts will allow for a comprehensive evaluation of the potential benefits of the proposed architecture for battery state estimation and anomaly detection in real-world scenarios.

Author Contributions

Conceptualization, J.L.; formal analysis, J.L.; funding acquisition, H.S.; investigation, J.L. and X.L.; methodology, J.L.; project administration, J.L. and H.S.; resources, X.L. and Y.L. (Yixin Liu); software, J.L.; supervision, M.K.; validation, Y.L. (Yuxia Liu), J.L. and X.L.; visualization, J.L.; writing—original draft, J.L.; writing—review and editing, J.L. All authors have read and agreed to the published version of the manuscript.

Funding

This research was funded by the key scientific and technological program of Jilin Province, China, grant number 20210301027GX.

Data Availability Statement

The data of this paper are available on the following website: https://github.com/jhrrlee/pack_digitalization.git (accessed on 3 May 2023).

Conflicts of Interest

The authors declare no conflict of interest.

Appendix A

Table A1. Hyperparameter configurations of 65 models.
ModelsNetworkOptimizer (ADAM)Cost FunctionBatch NormL2Dropout
LayersNodeActivationab1b2Amsgrad
1220ReLU0.0010.90.999YHuberN0.01
2210ReLU0.0010.90.999YHuberN0.01
3310ReLU0.0010.90.999YHuberN0.01
4320ReLU0.0010.90.999YHuberN0.01
5320ReLU0.010.90.999YHuberN0.01
6220ReLU0.0010.90.999YMSEN0.01
7220ReLU0.0010.90.999YHuberY0.01
8320ReLU0.0010.90.999YHuberY0.01
9420ReLU0.0010.90.999YHuberY0.01
10220tanh0.0010.90.999YHuberY0.01
11220tanh0.0010.90.999YHuberN0.01
12220tanh0.0010.90.999YHuberN0.010.7, 0.5
13220tanh0.0010.90.999YHuberN0.010.5, 0.3
14220tanh0.0010.90.999YHuberN0.010.3, 0.1
15220tanh0.0010.90.999YHuberY0.010.7, 0.5
16220tanh0.0010.90.999YHuberY0.010.5, 0.3
17220tanh0.0010.90.999YHuberY0.010.3, 0.1
18220ReLU0.0010.90.999YHuberN0.010.7, 0.5
19220ReLU0.0010.90.999YHuberN0.010.5, 0.3
20220ReLU0.0010.90.999YHuberN0.010.3, 0.1
21220ReLU0.0010.90.999YHuberY0.010.7, 0.5
22220ReLU0.0010.90.999YHuberY0.010.5, 0.3
23220ReLU0.0010.90.999YHuberY0.010.3, 0.1
24320tanh0.0010.90.999YHuberN0.010.7, 0.5
25320tanh0.0010.90.999YHuberN0.010.5, 0.3
26320tanh0.0010.90.999YHuberN0.010.3, 0.1
27320tanh0.0010.90.999YHuberY0.010.7, 0.5
28320tanh0.0010.90.999YHuberY0.010.5, 0.3
29320tanh0.0010.90.999YHuberY0.010.3, 0.1
30320ReLU0.0010.90.999YHuberN0.010.7, 0.5
31320ReLU0.0010.90.999YHuberN0.010.5, 0.3
32320ReLU0.0010.90.999YHuberN0.010.3, 0.1
33320ReLU0.0010.90.999YHuberY0.010.7, 0.5
34320ReLU0.0010.90.999YHuberY0.010.5, 0.3
35320ReLU0.0010.90.999YHuberY0.010.3, 0.1
36220ReLU0.0010.90.999NHuberN0.01
37320ReLU0.0010.90.999NHuberN0.01
38420ReLU0.0010.90.999NHuberN0.01
39220tanh0.0010.90.999NHuberN0.01
40320tanh0.0010.90.999NHuberN0.01
41420tanh0.0010.90.999NHuberN0.01
42320tanh0.0010.90.999YHuberY0.01
43320tanh0.0010.90.999YHuberN0.01
44420tanh0.0010.90.999YHuberY0.01
45420tanh0.0010.90.999YHuberN0.01
46220tanh0.0010.90.999YHuberY1
47220tanh0.0010.90.999YHuberN1
48320tanh0.0010.90.999YHuberY1
49320tanh0.0010.90.999YHuberN1
50420tanh0.0010.90.999YHuberY1
51420tanh0.0010.90.999YHuberN1
52220tanh0.0010.90.999NHuberY1
53220tanh0.0010.90.999NHuberN1
54320tanh0.0010.90.999NHuberY1
55320tanh0.0010.90.999NHuberN1
56420tanh0.0010.90.999NHuberY1
57420tanh0.0010.90.999NHuberN1
58220tanh0.0010.90.999NHuberY0.1
59220tanh0.0010.90.999NHuberN0.1
60320tanh0.0010.90.999NHuberY0.1
61320tanh0.0010.90.999NHuberN0.1
62420tanh0.0010.90.999NHuberY0.1
63420tanh0.0010.90.999NHuberN0.1
64420ReLU0.0010.90.999YHuberY0.01
65420ReLU0.0010.90.999YHuberY0.1
Table A2. Training and cross-validation accuracy of 65 models.
ModelsB5 (%)B6 (%)B7 (%)B18 (%)Mean (%)ModelsB5 (%)B6 (%)B7 (%)B18 (%)Mean (%)
17.983.042.756.835.15345.688.692.8012.067.31
28.723.293.255.905.29358.265.091.9313.397.17
38.763.803.155.635.33368.683.163.225.805.21
47.263.602.956.985.20379.443.682.925.155.30
59.133.202.956.485.44387.303.563.027.655.38
68.725.993.135.315.79398.702.832.585.174.82
713.508.670.3615.319.46407.732.592.685.774.69
813.967.540.3711.208.27417.342.472.866.434.77
916.4810.321.1719.5311.87425.306.584.199.686.44
1016.939.021.9819.6911.904312.715.365.5619.3810.75
116.412.973.096.644.78445.426.534.209.556.43
126.298.935.259.167.41459.032.706.048.716.62
135.568.564.699.457.064614.768.100.5914.789.56
145.108.564.359.696.92475.686.324.199.256.36
156.485.866.229.607.044811.234.063.6811.527.62
164.986.123.7314.827.41494.546.453.949.866.20
175.433.624.8411.356.31505.326.644.209.626.44
187.7912.044.618.978.35515.526.454.209.466.41
1910.8411.649.538.3210.085211.377.0010.0415.2310.91
207.259.915.459.678.07538.072.692.665.704.78
2111.619.0910.1911.2310.535412.846.110.928.116.99
226.592.676.0611.616.73558.372.902.685.804.94
239.974.074.439.577.015613.868.622.026.287.69
245.218.844.1413.507.92576.782.392.846.414.61
255.718.494.779.107.025816.057.310.905.897.54
265.178.024.369.446.75597.662.392.825.924.70
276.496.183.7112.877.316012.807.040.8320.5010.29
284.696.333.8215.397.56618.423.152.595.564.93
295.936.404.988.566.476213.238.031.903.506.67
307.3211.884.8810.298.59638.273.002.705.714.92
317.5910.403.7111.308.256411.846.110.7322.9410.41
327.0211.133.589.207.736519.6211.060.2915.5411.63
3311.2912.079.928.5410.45

References

  1. Alibrahim, H.; Ludwig, S.A. Hyperparameter Optimization: Comparing Genetic Algorithm against Grid Search and Bayesian Optimization. In Proceedings of the 2021 IEEE Congress on Evolutionary Computation (CEC), Kraków, Poland, 28 June 2021; pp. 1551–1559. [Google Scholar]
  2. Yang, L.; Shami, A. On Hyperparameter Optimization of Machine Learning Algorithms: Theory and Practice. Neurocomputing 2020, 415, 295–316. [Google Scholar] [CrossRef]
  3. Wang, Y.; Tian, J.; Sun, Z.; Wang, L.; Xu, R.; Li, M.; Chen, Z. A Comprehensive Review of Battery Modeling and State Estimation Approaches for Advanced Battery Management Systems. Renew. Sustain. Energy Rev. 2020, 131, 110015. [Google Scholar] [CrossRef]
  4. Lee, J.; Wang, L. A Method for Designing and Analyzing Automotive Software Architecture: A Case Study for an Autonomous Electric Vehicle. In Proceedings of the 2021 IEEE International Conference on Computer Engineering and Artificial Intelligence (ICCEAI), Shanghai, China, 27–29 August 2021; pp. 20–26. [Google Scholar]
  5. Pang, G.; Shen, C.; Cao, L.; Hengel, A.V.D. Deep Learning for Anomaly Detection: A Review. ACM Comput. Surv. 2022, 54, 1–38. [Google Scholar] [CrossRef]
  6. Alwosheel, A.; van Cranenburgh, S.; Chorus, C.G. Is Your Dataset Big Enough? Sample Size Requirements When Using Artificial Neural Networks for Discrete Choice Analysis. J. Choice Model. 2018, 28, 167–182. [Google Scholar] [CrossRef]
  7. Hasib, S.A.; Islam, S.; Chakrabortty, R.K.; Ryan, M.J.; Saha, D.K.; Ahamed, M.H.; Moyeen, S.I.; Das, S.K.; Ali, M.F.; Islam, M.R.; et al. A Comprehensive Review of Available Battery Datasets, RUL Prediction Approaches, and Advanced Battery Management. IEEE Access 2021, 9, 86166–86193. [Google Scholar] [CrossRef]
  8. Stojanovic, V.; Nedic, N.; Prsic, D.; Dubonjic, L. Optimal Experiment Design for Identification of ARX Models with Constrained Output in Non-Gaussian Noise. Appl. Math. Model. 2016, 40, 6676–6689. [Google Scholar] [CrossRef]
  9. Stojanovic, V.; Nedic, N. Robust Kalman Filtering for Nonlinear Multivariable Stochastic Systems in the Presence of Non-Gaussian Noise: Robust filtering for nonlinear stochastic systems. Int. J. Robust. Nonlinear Control 2016, 26, 445–460. [Google Scholar] [CrossRef]
  10. Lee, J.; Kim, M. Isolation of Shared Resources for Mixed-Criticality AUTOSAR Applications. J. Comput. Sci. Eng. 2022, 16, 129–142. [Google Scholar] [CrossRef]
  11. Mohammed, A.; Kora, R. A Comprehensive Review on Ensemble Deep Learning: Opportunities and Challenges. J. King Saud Univ. -Comput. Inf. Sci. 2023, 35, 757–774. [Google Scholar] [CrossRef]
  12. Saha, B.; Goebel, K. NASA Ames Prognostic Data Repository. Available online: https://ti.arc.nasa.gov/tech/dash/groups/pcoe/prognostic-data-repository/#battery (accessed on 6 January 2020).
  13. Venugopal, P.; Shankar, S.S.; Jebakumar, C.P.; Agarwal, R.; Alhelou, H.H.; Reka, S.S.; Golshan, M.E.H. Analysis of Optimal Machine Learning Approach for Battery Life Estimation of Li-Ion Cell. IEEE Access 2021, 9, 159616–159626. [Google Scholar] [CrossRef]
  14. Long, B.; Li, X.; Gao, X.; Liu, Z. Prognostics Comparison of Lithium-Ion Battery Based on the Shallow and Deep Neural Networks Model. Energies 2019, 12, 3271. [Google Scholar] [CrossRef]
  15. Hsu, C.-W.; Xiong, R.; Chen, N.-Y.; Li, J.; Tsou, N.-T. Deep Neural Network Battery Life and Voltage Prediction by Using Data of One Cycle Only. Appl. Energy 2022, 306, 118134. [Google Scholar] [CrossRef]
  16. Khaleghi, S.; Hosen, M.S.; Karimi, D.; Behi, H.; Beheshti, S.H.; Van Mierlo, J.; Berecibar, M. Developing an Online Data-Driven Approach for Prognostics and Health Management of Lithium-Ion Batteries. Appl. Energy 2022, 308, 118348. [Google Scholar] [CrossRef]
  17. Khaleghi, S.; Karimi, D.; Beheshti, S.H.; Md Hosen, S.; Behi, H.; Berecibar, M.; Van Mierlo, J. Online Health Diagnosis of Lithium-Ion Batteries Based on Nonlinear Autoregressive Neural Network. Appl. Energy 2021, 282, 116159. [Google Scholar] [CrossRef]
  18. Ezemobi, E.; Silvagni, M.; Mozaffari, A.; Tonoli, A.; Khajepour, A. State of Health Estimation of Lithium-Ion Batteries in Electric Vehicles under Dynamic Load Conditions. Energies 2022, 15, 1234. [Google Scholar] [CrossRef]
  19. Li, A.G.; Wang, W.; West, A.C.; Preindl, M. Health and Performance Diagnostics in Li-Ion Batteries with Pulse-Injection-Aided Machine Learning. Appl. Energy 2022, 315, 119005. [Google Scholar] [CrossRef]
  20. Xia, Z.; Qahouq, J.A.A. Lithium-Ion Battery Ageing Behavior Pattern Characterization and State-of-Health Estimation Using Data-Driven Method. IEEE Access 2021, 9, 98287–98304. [Google Scholar] [CrossRef]
  21. Chemali, E.; Kollmeyer, P.J.; Preindl, M.; Fahmy, Y.; Emadi, A. A Convolutional Neural Network Approach for Estimation of Li-Ion Battery State of Health from Charge Profiles. Energies 2022, 15, 1185. [Google Scholar] [CrossRef]
  22. Navega Vieira, R.; Mauricio Villanueva, J.M.; Sales Flores, T.K.; Tavares de Macêdo, E.C. State of Charge Estimation of Battery Based on Neural Networks and Adaptive Strategies with Correntropy. Sensors 2022, 22, 1179. [Google Scholar] [CrossRef]
  23. Khan, N.; Haq, I.U.; Ullah, F.U.M.; Khan, S.U.; Lee, M.Y. CL-Net: ConvLSTM-Based Hybrid Architecture for Batteries’ State of Health and Power Consumption Forecasting. Mathematics 2021, 9, 3326. [Google Scholar] [CrossRef]
  24. Shi, J.; Rivera, A.; Wu, D. Battery Health Management Using Physics-Informed Machine Learning: Online Degradation Modeling and Remaining Useful Life Prediction. Mech. Syst. Signal Process. 2022, 179, 109347. [Google Scholar] [CrossRef]
  25. Zhao, S.; Zhang, C.; Wang, Y. Lithium-Ion Battery Capacity and Remaining Useful Life Prediction Using Board Learning System and Long Short-Term Memory Neural Network. J. Energy Storage 2022, 52, 104901. [Google Scholar] [CrossRef]
  26. Toughzaoui, Y.; Toosi, S.B.; Chaoui, H.; Louahlia, H.; Petrone, R.; Le Masson, S.; Gualous, H. State of Health Estimation and Remaining Useful Life Assessment of Lithium-Ion Batteries: A Comparative Study. J. Energy Storage 2022, 51, 104520. [Google Scholar] [CrossRef]
  27. Chinomona, B.; Chung, C.; Chang, L.-K.; Su, W.-C.; Tsai, M.-C. Long Short-Term Memory Approach to Estimate Battery Remaining Useful Life Using Partial Data. IEEE Access 2020, 8, 165419–165431. [Google Scholar] [CrossRef]
  28. Wu, J.; Fang, L.; Dong, G.; Lin, M. State of Health Estimation of Lithium-Ion Battery with Improved Radial Basis Function Neural Network. Energy 2023, 262, 125380. [Google Scholar] [CrossRef]
  29. Birkl, C.R.; Roberts, M.R.; McTurk, E.; Bruce, P.G.; Howey, D.A. Degradation Diagnostics for Lithium Ion Cells. J. Power Sources 2017, 341, 373–386. [Google Scholar] [CrossRef]
  30. Ramyachitra, D.D.; Manikandan, P. Imbalanced Dataset Classification and Solutions: A Review. Int. J. Comput. Bus. Res. 2014, 5, 1–29. [Google Scholar]
  31. Yan, W.; Zhang, B.; Zhao, G.; Tang, S.; Niu, G.; Wang, X. A Battery Management System With a Lebesgue-Sampling-Based Extended Kalman Filter. IEEE Trans. Ind. Electron. 2019, 66, 3227–3236. [Google Scholar] [CrossRef]
  32. Zhao, L.; Wang, Y.; Cheng, J. A Hybrid Method for Remaining Useful Life Estimation of Lithium-Ion Battery with Regeneration Phenomena. Appl. Sci. 2019, 9, 1890. [Google Scholar] [CrossRef]
  33. De Maesschalck, R.; Jouan-Rimbaud, D.; Massart, D.L. The Mahalanobis Distance. Chemom. Intell. Lab. Syst. 2000, 50, 1–18. [Google Scholar] [CrossRef]
  34. Stathakis, D. How Many Hidden Layers and Nodes? Int. J. Remote Sens. 2009, 30, 2133–2147. [Google Scholar] [CrossRef]
  35. Nair, V.; Hinton, G.E. Rectified Linear Units Improve Restricted Boltzmann Machines. In Proceedings of the 27th International Conference on Machine Learning (ICML-10), Haifa, Israel, 21–24 June 2010; pp. 807–814. [Google Scholar]
  36. Glorot, X.; Bordes, A.; Bengio, Y. Deep Sparse Rectifier Neural Networks. In Proceedings of the International Conference on Artificial Intelligence and Statistics, Fort Lauderdale, FL, USA, 11–13 April 2011; pp. 315–323. [Google Scholar]
  37. Dubey, S.R.; Singh, S.K.; Chaudhuri, B.B. Activation Functions in Deep Learning: A Comprehensive Survey and Benchmark. Neurocomputing 2022, 503, 92–108. [Google Scholar] [CrossRef]
  38. Wang, Q.; Ma, Y.; Zhao, K.; Tian, Y. A Comprehensive Survey of Loss Functions in Machine Learning. Ann. Data Sci. 2022, 9, 187–212. [Google Scholar] [CrossRef]
  39. Reddi, S.J.; Kale, S.; Kumar, S. On the convergence of Adam and beyond. In Proceedings of the 6th International Conference on Learning Representations (ICLR 2018), Vancouver, BC, Canada, 30 April–3 May 2018; 1–23; pp. 1–23. [Google Scholar]
  40. Zaheer, M.; Reddi, S.; Sachan, D.; Kale, S.; Kumar, S. Adaptive methods for non-convex optimization. In Proceedings of the 32nd Conference on Neural Information Processing Systems (NeurIPS 2018), Montréal, QC, Canada, 3–8 December 2018; 9793–9803; pp. 9793–9803. [Google Scholar]
  41. Ioffe, S.; Szegedy, C. Batch Normalization: Accelerating Deep Network Training by Reducing Internal Covariate Shift. arXiv 2015, arXiv:1502.03167. [Google Scholar]
  42. Santurkar, S.; Tsipras, D.; Ilyas, A.; Madry, A. How Does Batch Normalization Help Optimization? In Proceedings of the 32nd Conference on Neural Information Processing Systems (NeurIPS 2018), Montréal, QC, Canada, 3–8 December 2018; pp. 2483–2493. [Google Scholar]
  43. Wager, S.; Wang, S.; Liang, P.S. Dropout Training as Adaptive Regularization. In Proceedings of the Advances in Neural Information Processing Systems 26, Lake Tahoe, NV, USA, 5–10 December 2013; Volume 1, pp. 351–359. [Google Scholar]
Figure 1. An architectural design for key components to use data-driven methods.
Batteries 09 00264 g001
Figure 2. An architectural design improves estimation accuracy and safety.
Batteries 09 00264 g002
Figure 3. NASA data analysis: (a) discharge voltage curves at each discharge cycle of LIB B5, B6, B7, and B18 from left to right. (b) Discharge curves at each discharge cycle in the cleaned dataset. (c) Taper voltage curves at each charge cycle of LIB B5, B6, B7, and B18 from left to right. (d) Data sizes at each discharge cycle of LIB B5, B6, B7, and B18 from left to right. (e) Capacity on the left and SOH on the right for LIB B5, B6, B7, and B18.
Batteries 09 00264 g003
Figure 4. Relationship between the feature candidates and the target SOH.
Batteries 09 00264 g004
Figure 5. Pearson correlation between the feature candidates.
Batteries 09 00264 g005
Figure 6. An architectural design improves estimation accuracy and safety.
Batteries 09 00264 g006
Figure 7. SOH prediction of M57: (a) LIB B5. (b) LIB B6. (c) LIB B7. (d) LIB B18.
Batteries 09 00264 g007
Figure 8. The loss and state-of-health (SOH) prediction for the Li-ion batteries (LIB): (a) LIB B5. (b) LIB B6. (c) LIB B7. (d) LIB B18.
Batteries 09 00264 g008
Figure 9. Mahalanobis distance (red) and absolute error (blue) between the SOHs from the generalized DNN and personalized DNN: (a) LIB B5. (b) LIB B6. (c) LIB B7. (d) LIB B18.
Batteries 09 00264 g009
Table 1. Hyperparameters for a generalized model and the best accuracy model.
HyperparametersM57M65
NetworkStructureFFNNFFNN
Hidden layers44
Nodes2020
Activation functiontanhReLU
Gradient DescentOptimizerADAMADAM
A0.0010.001
b10.90.9
b20.9990.999
AMSgradNY
NormalizationCost functionHuberHuber
Batch normalizationNY
RegularizationL2NY
DropoutNN
Table 2. Hyperparameter comparison among the four best models.
HyperparameterM57M40M59M41
Hidden layers4424
L2N0.010.10.01
Table 3. Accuracy comparison among the four best models.
ModelsB5 (%)B6 (%)B7 (%)B18 (%)Mean (%)
M576.772.392.846.414.60
M407.732.592.685.764.69
M597.652.392.815.924.69
M417.342.472.856.424.77
Table 4. Hyperparameter comparison among the four best models.
HyperparametersM65M7M8M46
Hidden layers4232
Activation functionReLUReLUReLUtanh
L20.10.010.1N
Table 5. Accuracy comparison between model 65 and the improved radial basis function NN [24].
ModelsB5 (%)B6 (%)B7 (%)B18 (%)
M650.330.440.290.25
[22]0.520.930.59NA
Disclaimer/Publisher’s Note: The statements, opinions and data contained in all publications are solely those of the individual author(s) and contributor(s) and not of MDPI and/or the editor(s). MDPI and/or the editor(s) disclaim responsibility for any injury to people or property resulting from any ideas, methods, instructions or products referred to in the content.

