Article

Descriptor-Based Graded Electrode Microstructures Design Strategies of Lithium-Ion Batteries for Enhanced Rate Performance

Hubei Key Laboratory of Electrochemical Power Sources, Department of Chemistry, Wuhan University, Wuhan 430072, China
*
Author to whom correspondence should be addressed.
Batteries 2023, 9(4), 227; https://doi.org/10.3390/batteries9040227
Submission received: 14 February 2023 / Revised: 24 March 2023 / Accepted: 10 April 2023 / Published: 14 April 2023
(This article belongs to the Special Issue Materials Design for Electrochemical Energy Storage)

Abstract

:
Microstructure engineering of electrodes is one of the efficient routes to improve rate performance of lithium-ion batteries (LIBs). Currently, there is a lack of descriptors to rationally guide the regional electrode design. Here, we propose two descriptors, the time differential of the average state of lithium (SoL) and the span of SoL in individual particles, to identify the rate performance constraints across the electrode depth. 3D microstructure-based electrochemical simulations are performed on a homogeneous electrode, and the predictability of the microstructure-based model is verified with the experimental measurement on a LiNi1/3Mn1/3Co1/3O2 electrode. At electrode level, the descriptors divide the electrode into four regions, namely, a solid-state transport (SST)-controlled region, two mixed SST and liquid-state transport (LST)-controlled regions (SST-dominant and LST-dominant, respectively), and an LST-controlled region. Based on these insights, dual-gradient electrodes are designed with smaller particles in the SST-controlled region and graded porosity increasing from current collector to the separator. Results show that the optimized dual-gradient electrode has significantly more excellent LST capability compared to the homogeneous electrode, thus improving the utilization of particles near the collector. As a result, the capacity performance of the optimized dual-gradient electrode increases by 39% at 5C without sacrificing the gravimetric energy density.

1. Introduction

Vehicle electrification is a key strategy to reduce global carbon dioxide emissions. Lithium-ion batteries (LIBs) are the leading energy storage and conversion technology in electric vehicles (EVs) because of its unparalleled combination of high energy and power density [1]. Compared to petrol vehicles, the unsatisfactory rate and cruising capabilities limit further development of EVs [2]. Therefore, maintaining a long-driving range performance of LIBs at high C-rates has become an urgent problem to be addressed.
In addition to active materials of LIBs [3,4], the electrode microstructures are also a crucial element in determining the rate performance [5,6,7,8]. LIBs exhibit complex interactions between ions transport and electrochemical reactions, which depend heavily on the heterogeneous spatial arrangement of electrode structures [9,10]. Therefore, some exploratory researches of advanced electrode architectures are conducted currently to ameliorate rate capability [11], especially, using electrodes with graded particle size and porosity, which can be experimentally fabricated with phase inversion and ice-templating methods [12,13]. For examples, Zhang et al. [14] presented a graded trapezoidal porous channels design and found that larger openings near the separator brought superior capacity retention; Liu et al. [15] manufactured a bilayer LiNi0.5Mn1.5O4 cathode with different porosity, and similarly found that the cathode with a larger porosity near the separator reduces the capacity fading by 8.285%; Wu et al. [16] fabricated the LiFePO4 cathode with a graded particle size, reporting that the particle gradient can compensate for the heterogeneous reaction kinetics and reduce the concentration polarization along the depth direction, thus improving rate capability. Despite these efforts, it is very difficult to find optimal electrode microstructure merely through experimental exploration, due to the time and labor constraints [17], as well as the challenge in flexible control of microstructures [18]. By contrast, theoretical simulations with flexible construction of digital electrode structures could be an effective and economical approach [19].
Currently, theoretical simulations in electrode design mostly use the mean-field pseudo-two-dimension (P2D) model [20,21], in which the effects of the microstructural features on the electrochemical behaviors of porous electrodes are inadequately considered by volume-averaging method. This is inherently contradictory to the emphasis on the importance of electrode microstructures. Recent advance in structure characterization techniques [22] and numerical computation methods have made microstructure-based (no volume-averaging) simulations of LIBs possible [7,8,23]. The latest representative work is by Lu et al. [7], who analyzed the state of lithium (SoL) of individual particles in the active layer and the deviation magnitude of SoL as a function of the electrode depth, which they called the standard deviation of SoL. They found that the standard deviation of SoL decreased with depth from the separator and converged at a certain depth, which is assigned as the solid-state transport (SST)-controlled depth (the electrode penetration depth), beyond which the discharge of particles is severely limited by the liquid-state transport (LST). Using this penetration depth as descriptor, an electrode with a layered particle size distribution was proposed, and the results show that the electrode can further enhance the rate performance without sacrificing the gravimetric energy density. This pioneering work emphasizes the significance of using the depth-dependent SoL as a descriptor in graded microstructure design of LIB electrodes for improved rate performance.
It is noted that at a certain depth of discharge (DoD), the standard deviation of SoL actually exhibits continuous variation with depth rather than having an obvious convergence, which inhibits precise identification of the SST-controlled depth. This vague understanding of the kinetic constraints along the electrode depth direction seriously hinders the refined design of electrode structures. Therefore, there is an urgent need to find more sensitive descriptors to precisely indicate the depth-dependent kinetic features in LIB electrodes. In this work, we use the time differential of SoL (dSoL) of individual particles and the span of SoL ( Δ SoL ) in individual particles as dual descriptors to indicate the depth-dependent kinetics. The dSoL represents the intercalation/de-intercalation rate of lithium ions in a particle; therefore, it should more accurately manifest the contribution of the particle to the electrode performance than the SoL itself. On this basis, the dSoL of individual particles should be a rational descriptor of electrode penetration depth. The ΔSoL, the difference between the SoL values at the surface and center of a particle, which manifests the interfacial charge transfer rate of lithium ions in each particle surface, would provide more detailed kinetic features in a particle, we in this work use the dSoL of individual particles as the descriptor to identify the dominant factors in the intermediate mixed region. Using the two descriptors, at electrode level, the electrode is divided into four regions, namely, a solid-state transport (SST)-controlled region, two mixed SST and liquid-state transport (LST)-controlled regions (SST-dominant and LST-dominant, respectively), and an LST-controlled region. Based on these insights, gradient electrodes are designed with smaller particles in the SST-controlled region to reduce the limitation of SST and graded porosity increasing from current collector to the separator to reduce the limitation of LST. Therefore, we design a graded particle sizes electrode, a graded porosity electrode, and a dual-gradient electrode incorporating graded particle size and porosity. The 3D simulations are performed on these electrodes and the capacity performance of the graded particle sizes electrode, graded porosity electrode, and dual-gradient electrode increase by up to 5.4%, 37.5%, and 39% at 5C (C-rate is the measurement of the charge and discharge current with respect to its nominal capacity, 5C means the discharge can last 1/5 h), respectively, compared to the homogeneous electrode without sacrificing the gravimetric energy density. This study identifies more refined division strategies of electrode by the proposed descriptors, which is highly practical for the rational design of the regional electrode. This study also highlights the utility of gradient electrode design and provides valuable descriptor-based regional electrode design strategies to rationalizing fabrication of next-generation LIBs.

2. Experimental and Numerical Methods

2.1. Materials and Electrochemical Tests

An uncalendared LiNi1/3Mn1/3Co1/3O2 (NMC111) cathode was used in this study. The weight ratio of the constituents is 94:3:3 for the active material, conductive carbon, and binder (PVDF), respectively. The thickness of the electrode is 92 µm with 46% macro-porosity. The half-cells underwent a step composed of constant currents (CC) charge and CC discharge at C/20, C/10, C/5, C/2, 1C, 2C, and 5C (4.3 V cut-off and 2.3 V cut-off, respectively) at 30 °C. The particle size distribution data of NMC111 and electrochemical test datasets used in the study are derived from the ETH Zurich library, which is available open source from download at http://dx.doi.org/10.5905/ethz-iis-1 (accessed on 28 June 2022); and the experimental details please refer to the literature [24].

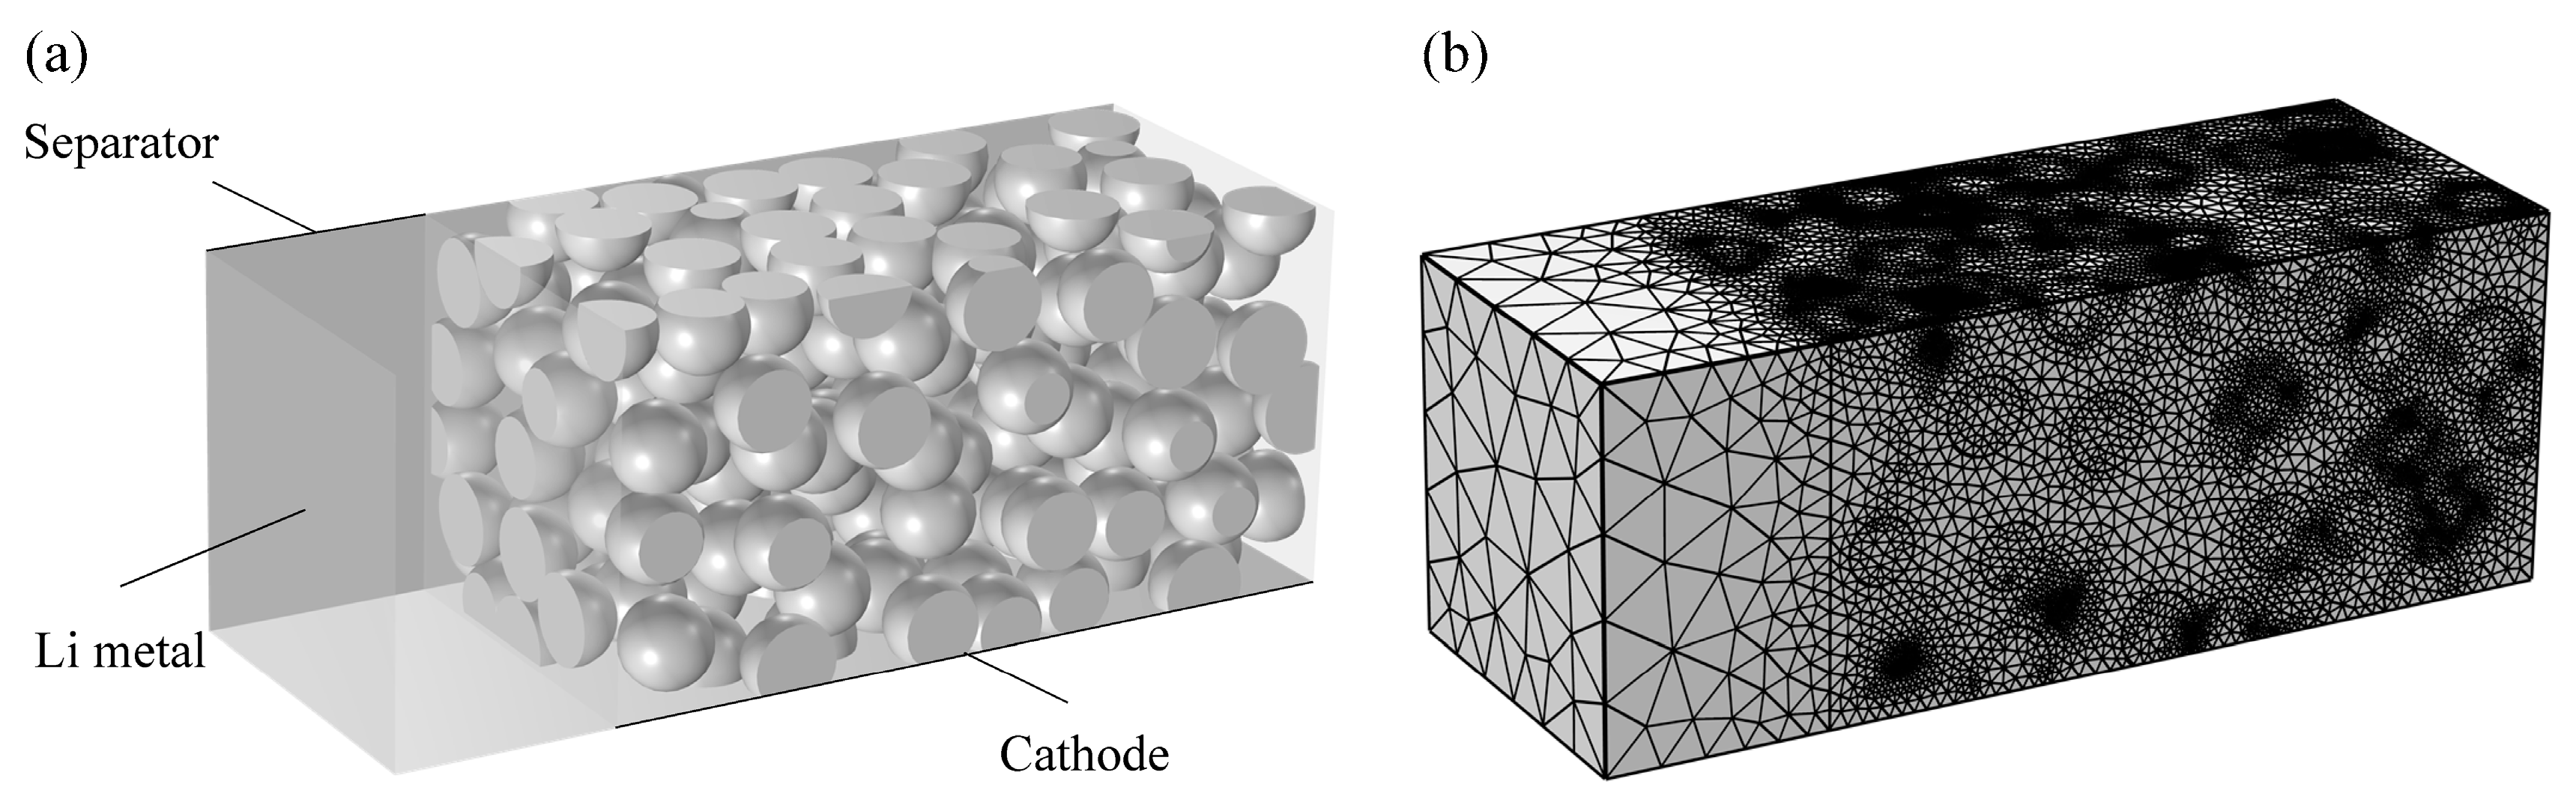
2.2. Electrode Microstructures

A stochastic algorithm based on volume exclusion was used to generate 3D electrodes with different particle sizes, where porosity and particle size are the main parameters. The overlapping of particles is allowed, which helps to generate electrodes with low porosity and accelerate the construction of 3D electrode. The specific generation process follows the steps below: (i) select the particle shape (sphere or ellipsoid) and size distributions, and calculate the number of particles according to the electrode size and porosity; (ii) generate the individual particle with the required shape and size, and place them randomly into an empty structure space with the same size as the electrode according to the principle from the largest to the smallest. For each particle placed, the surrounding particles are then identified and the overlap rate is calculated. The particles become part of the electrode only when the overlap rate is less than a threshold value (5% in the study); (iii) the generation process of (ii) is repeated until the desired porosity is satisfied.

2.3. Microstructure-Based Electrochemical Model

Detailed information on the governing equations, boundary conditions, and material parameters can be found in the Supplementary Information (Supplementary Tables S1–S3). Briefly, the mass conservation equations for lithium ions transport in the active materials and electrolyte are described by Fick’s law and the generalized Nernst-Planck equation, respectively. The charge conservation in the active materials and electrolyte are described by Ohm’s law and the electroneutrality equation, respectively. The Butler-Volmer equation is used for the interfacial charge transfer reaction; and the exchange current density is concerned with the surface concentration of lithium ions in the electrolyte, the surface lithium concentration, and the concentration of unoccupied lithium ions sites in the active materials. The above partial differential governing equations were solved for the lithium concentration in the active materials and the electrolyte, and potential in the carbon binder domain (CBD) and electrolyte, respectively. It should be noted that the conducting network is virtual and the CBD is uniformly dispersed within the porous domain, namely, the impact of heterogeneous CBD distribution is ignored. In addition, the realistic electrode microstructure is used in the microstructure-based electrochemical model, the influence of porous electrode structure, which is usually described by effective physical parameters in the macro-volume-averaging model, is included. Therefore, no volume-averaged parameters (equivalent porosity, tortuosity, and equivalent particle size) were used in the study.

2.4. Parameters and Simulation Details

The homogeneous electrode (Figure 1) is 50 μ m × 50 μ m × 100 μ m in size and 0.52 in porosity. The radii of uniform spherical particles that are uniformly distributed in the electrode is 6 μ m . The volume ratio of the constituents is 60:40 for the electrolyte and CBD in the porous domain. The separator thickness is 30 μ m and the porosity is 0.4. In addition, though the impact of local heterogeneous CBD distribution is ignored, the impeding effect of the CBD domain on the diffusion of lithium ions in the electrolyte is considered, with the tortuosity being 3. The half-cells underwent a discharge simulation with CC at 5C (3.0 V cut-off) and 25 °C.
The spatial particle distribution (coordinates and size) datasets were imported to COMSOL Multiphysics (v6.0, Sweden) through the Java code module in the APP developer. Subsequently, the reaction interface, the active particles, and the electrolyte domain were identified by Boolean segmentation. Using the built-in meshing tool for adaptive meshing (Figure 1b) with the minimum and maximum mesh sizes are 0.25 μ m and 12.5 μ m , respectively. The segregated approach and parallel direct sparse solver (PARDISO) were chosen to solve partial differential equations of LIBs, and time stepping was handled using 2nd order backward Euler differentiation.
The physical quantities, such as SoL, DoD, and average Cey , that are used in the study are described here. The SoL is the normalized value of the concentration of lithium ions in the active materials, which is a measure of the particle’s available intercalated lithium capacity, and it is calculated according to Equation (1):
SoL = V particle c s / V particle c s , max ,
The DoD in the study is the alternative value of time, which is a statistical average parameter for the whole electrode, and it is calculated according to Equation (2):
DoD = V ( c s c s , 0 ) / V ( c s , max c s , 0 ) ,
where V is the volume of active material within the electrode; V particle is the volume of an individual particle; c s is the average intercalated lithium concentration at a specific time; c s , 0 is the initial intercalated lithium concentration; and c s , max is the maximum intercalated lithium concentration.
The heterogeneous lithium ions concentration distribution is converted as a function of distance from the separator across the depth of electrode. The electrodes were sliced at a resolution of 1 µm and then averaged in-plane, and it is calculated according to Equation (3):
Average   Cey = s Cey / ( A s · ε ) ,
where Cey is the lithium ions concentration in the electrolyte, A s is the area of the slice, and ε is the porosity of the slice.

3. Results and Discussion

We first verify the microstructure-based electrochemical model by comparing the simulated voltage response of the NMC111 electrode with the experimental results given in benchmark datasets of the ETH Zurich library (http://dx.doi.org/10.5905/ethz-iis-1 (accessed on 28 June 2022)), which show that the model-predicted discharge curves are in good agreement with the experimental results (Supplementary Figure S4b), demonstrating the validity of the model prediction.

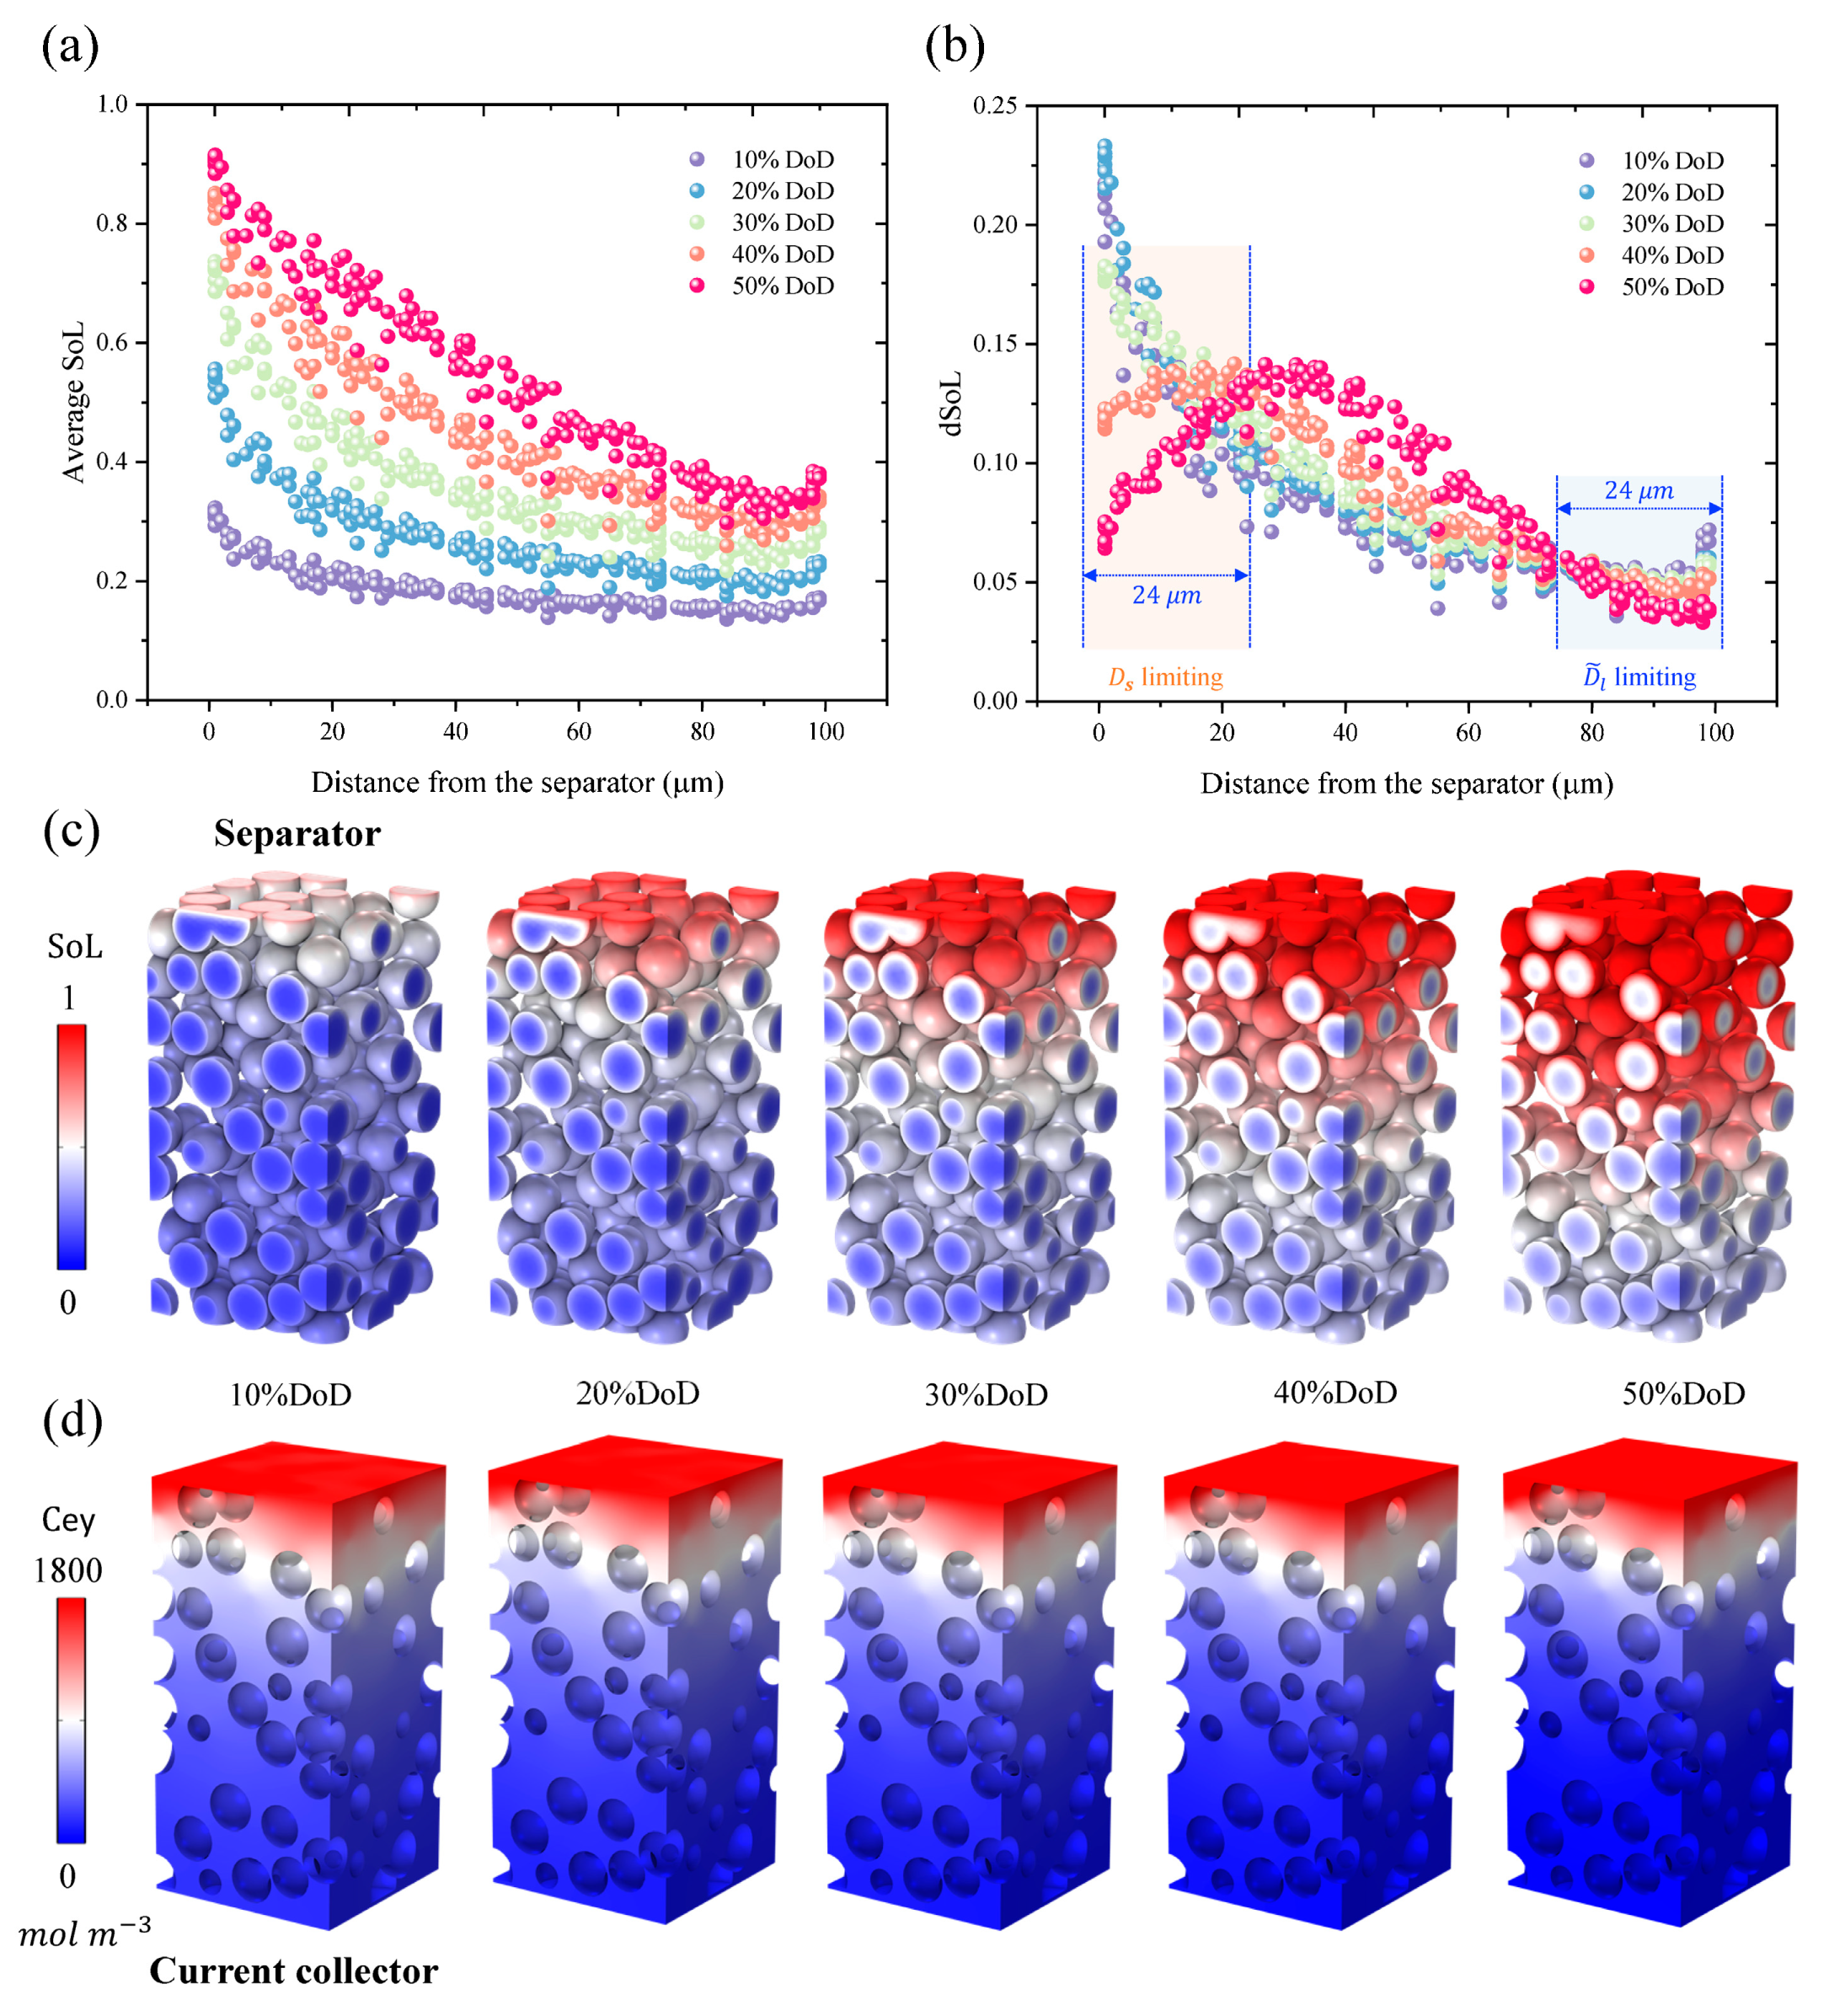
3.1. Quantification of the Electrode Penetration Depth

To calculate the time differential of the average state of lithium (dSoL), the heterogeneous concentration evolution of lithium ions in the active materials over time at five different time steps (10% DoD, 20% DoD, 30% DoD, 40% DoD, and 50% DoD) at 5C (the maximum DoD achievable for the homogeneous electrode at 5C and 25 °C is 56%) are shown in Figure 2a. The SoL of particles is relatively uniform at the initial stage of discharge (10% DoD); as the discharge continues until 50% DoD, the SoL of particles near the separator is almost saturated, while the particles near the collector are only 0.4, indicating the increasingly important effect of the LST resistance. The dSoL is then calculated as SoL end   DoD SoL initial   DoD . For instance, the dSoL at 10% DoD is calculated as the average SoL of all individual particles within the electrode at 10% DoD; subtract that at 0% DoD (the initial SoL). As seen in Figure 2b, the dSoL shows a continuous decreasing distribution at the early stage of the discharge; and as the discharge continues to the end stage of the discharge, it shows a left-skewed peak distribution, indicating that the main reaction front propagates with DoD, from the separator to the current collector side, which helps to reduce the SoL gradient across the electrode thickness. It is clear that the dSoL divides the electrode into three regions across the electrode depth. Within a certain depth (24 μm) from the separator, dSoL dramatically increases and becomes the maximum contrast to dSoL at other DoDs, the corresponding depth is defined as the SST-controlled depth, which is the start depth of the main reaction front. As seen in Figure 2c, within the depth the particles suffer from larger polarization attributed to the slow SST, and the surface SoL of particles is larger than 0.96, which results in an electrochemical shielding effect that lithium ions are difficult to react in the surface of particles. In the depth range of 24 μm to 76 μm, dSoL increases to a peak and then decreases rapidly. During this process, the main polarization suffered by particles changes from SST to LST, and it is hard to distinguish the dominant factors in this mixed region. Beyond the depth (76 μm), dSoL continues to decrease and becomes the minimum contrast to dSoL at other DoDs; the corresponding depth (76 μm) is defined as the electrode penetration depth, which is the end depth of the main reaction front. As seen in Figure 2d, beyond the depth the concentration of lithium ions is lower than 10 mol m−3, indicating that it is difficult for lithium ions to transport into the region. In conclusion, we can clearly divide the electrode into three regions across the electrode depth using the dSoL descriptor, namely, the SST-controlled region near the separator, the intermediate mixed SST and LST-controlled region, and the LST-controlled region near the cathode current collector.

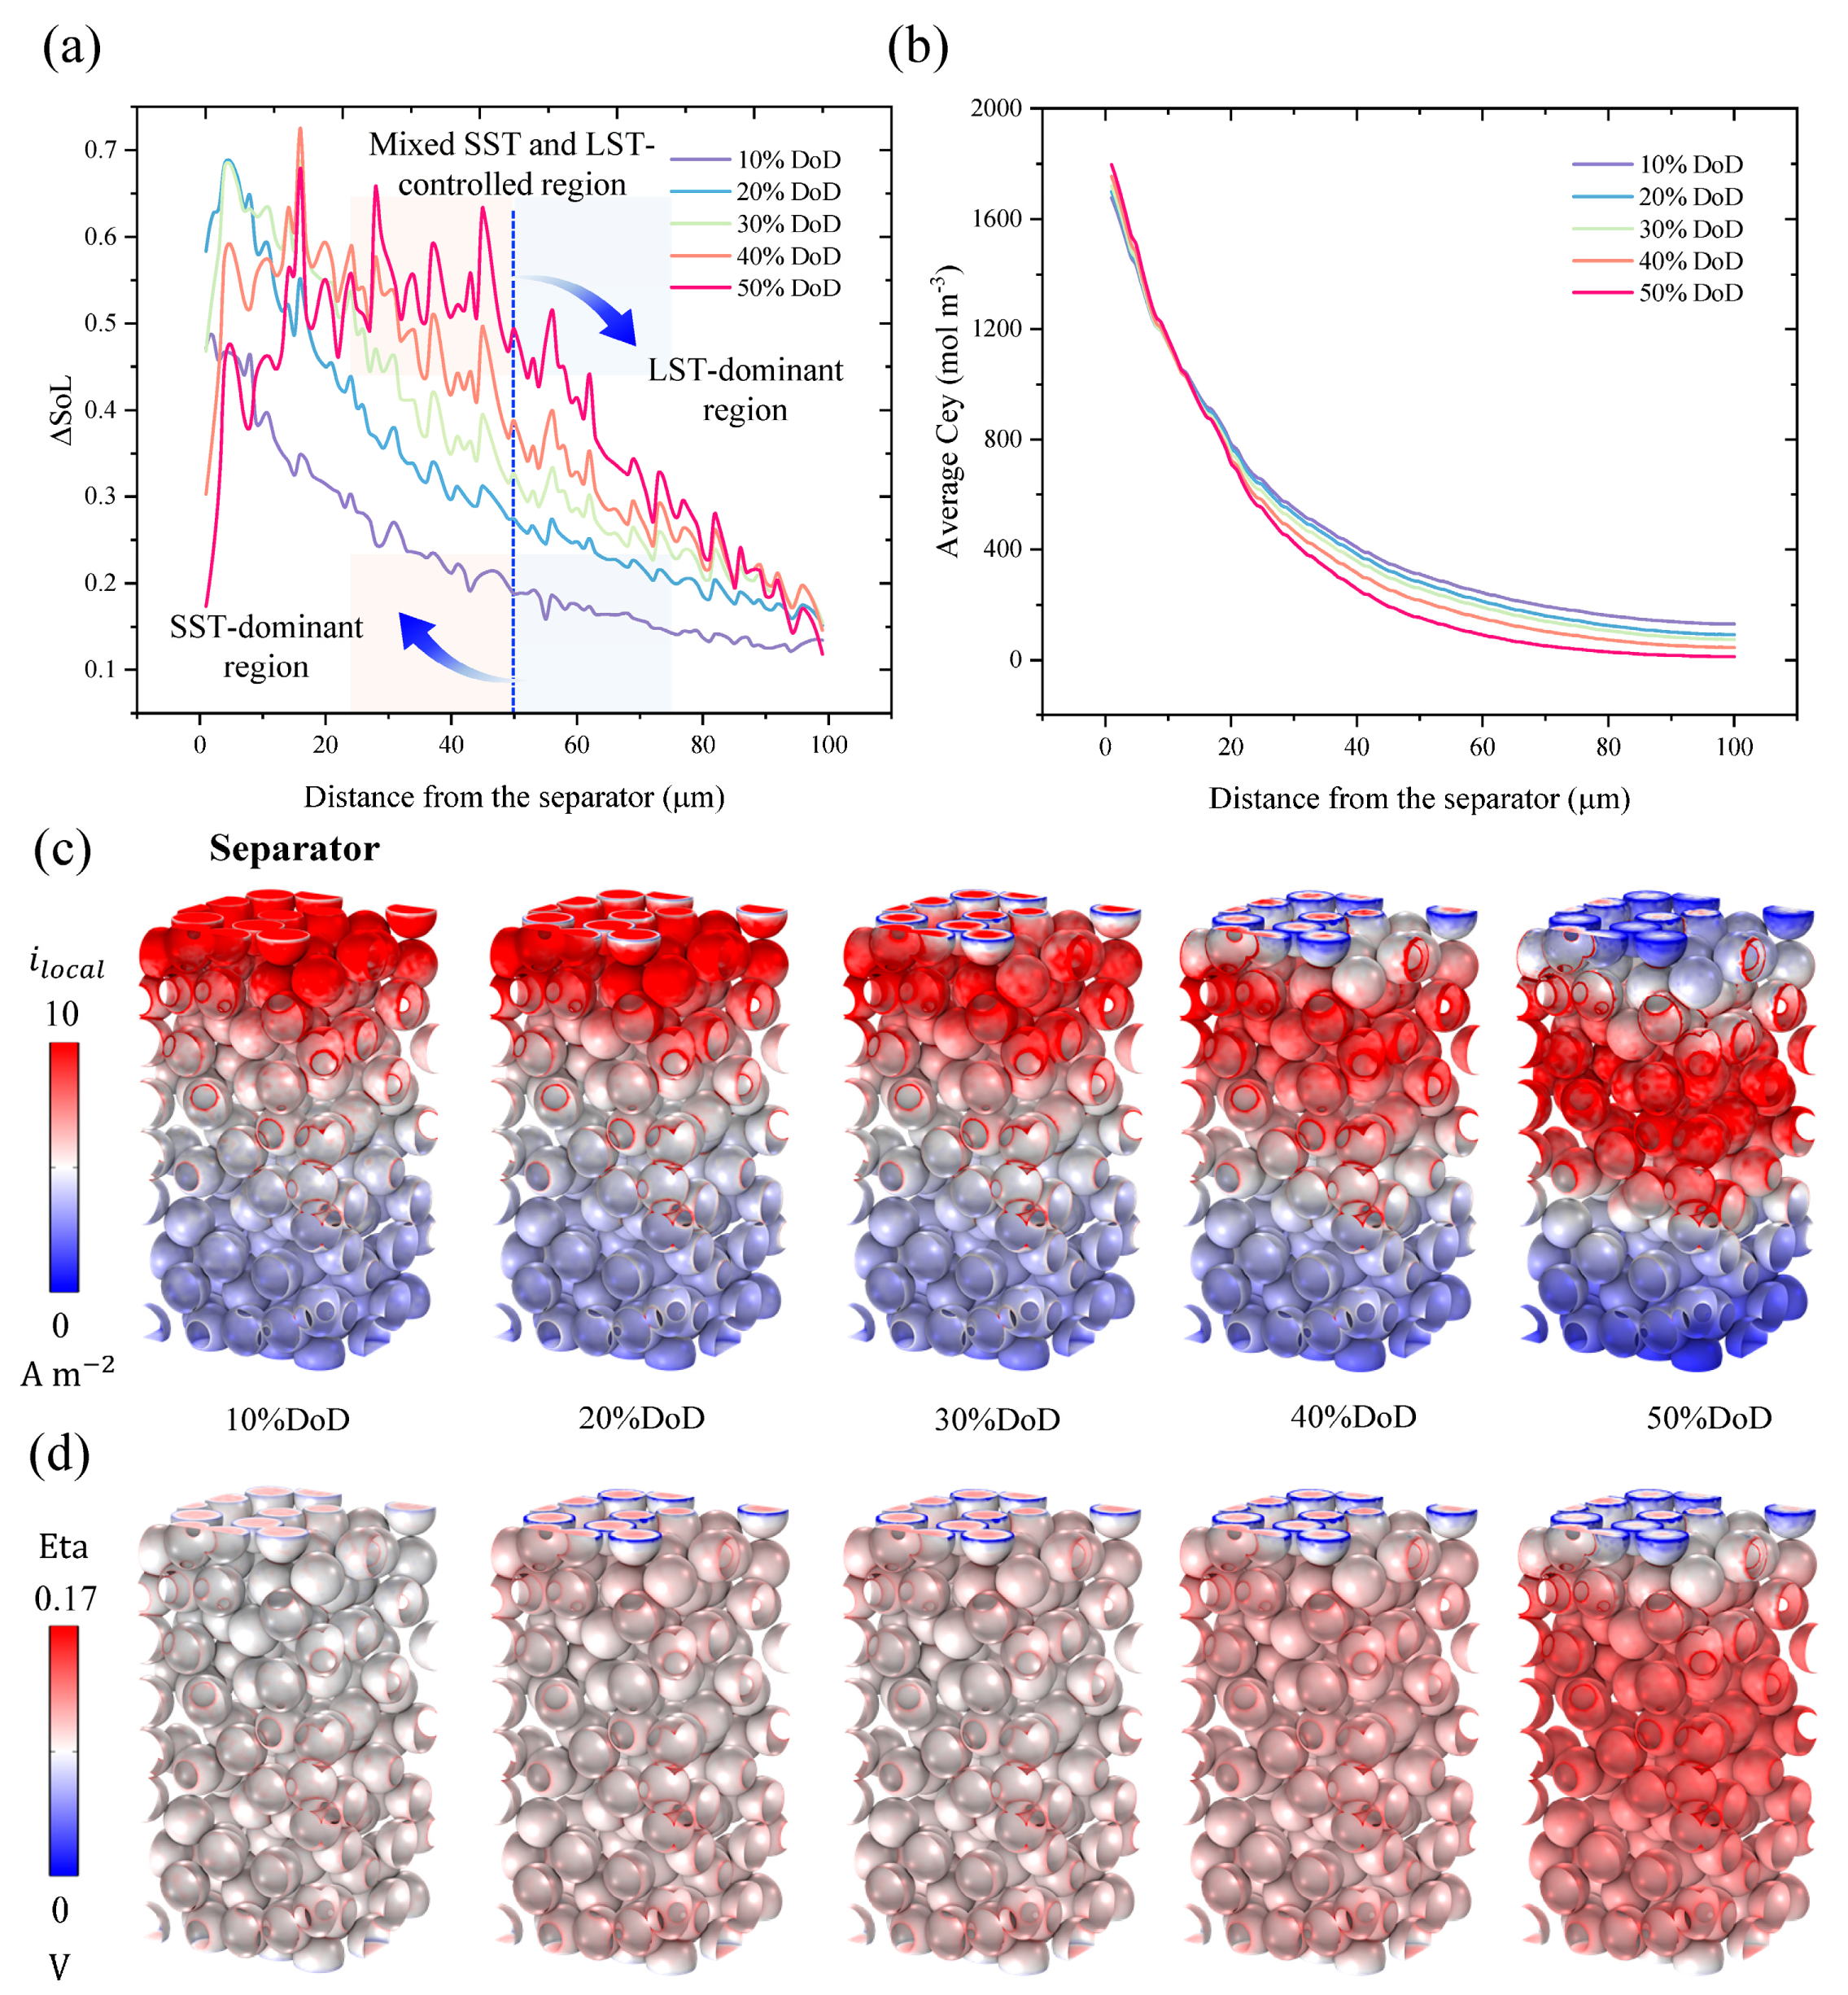
3.2. Analysis of Mixed SST and LST-Controlled Region

To distinguish the dominant factors in the intermediate mixed SST and LST-controlled region, the span of SoL ( Δ SoL , the difference between the maximum and minimum SoL) for individual particles at five different time steps (10% DoD, 20% DoD, 30% DoD, 40% DoD, and 50% DoD) at 5C are shown in Figure 3a. The Δ SoL shows a left-skewed peak distribution and as the discharge continues, the peak propagation towards the cathode current collector side, also indicating the propagation of the reaction front with the DoD, which helps to reduce the Δ SoL . It is obvious that the reaction front does not propagate beyond the left half of the electrode even during the whole discharge process, revealing that the current comes mainly from the particles near the separator, as evidenced in Figure 3c. Within the left half of the electrode, Δ SoL is high, the overpotential is homogeneous, and the lithium ions concentration in the electrolyte is larger than 200 mol m−3, indicating that SST is dominant in the mixed region range of 24 μm to 50 μm. In addition, beyond the left half of the electrode, Δ SoL decreases rapidly, as shown in Figure 3b, the lithium ions concentration in the electrolyte also decreases rapidly to 10 mol m−3; however, as shown in Figure 3d, the overpotential is homogeneous, indicating that the rapid decrease in lithium ions concentration leads to a rapid decrease in Δ SoL . Thus, LST is dominant in the mixed region range of 50 μm to 76 μm.

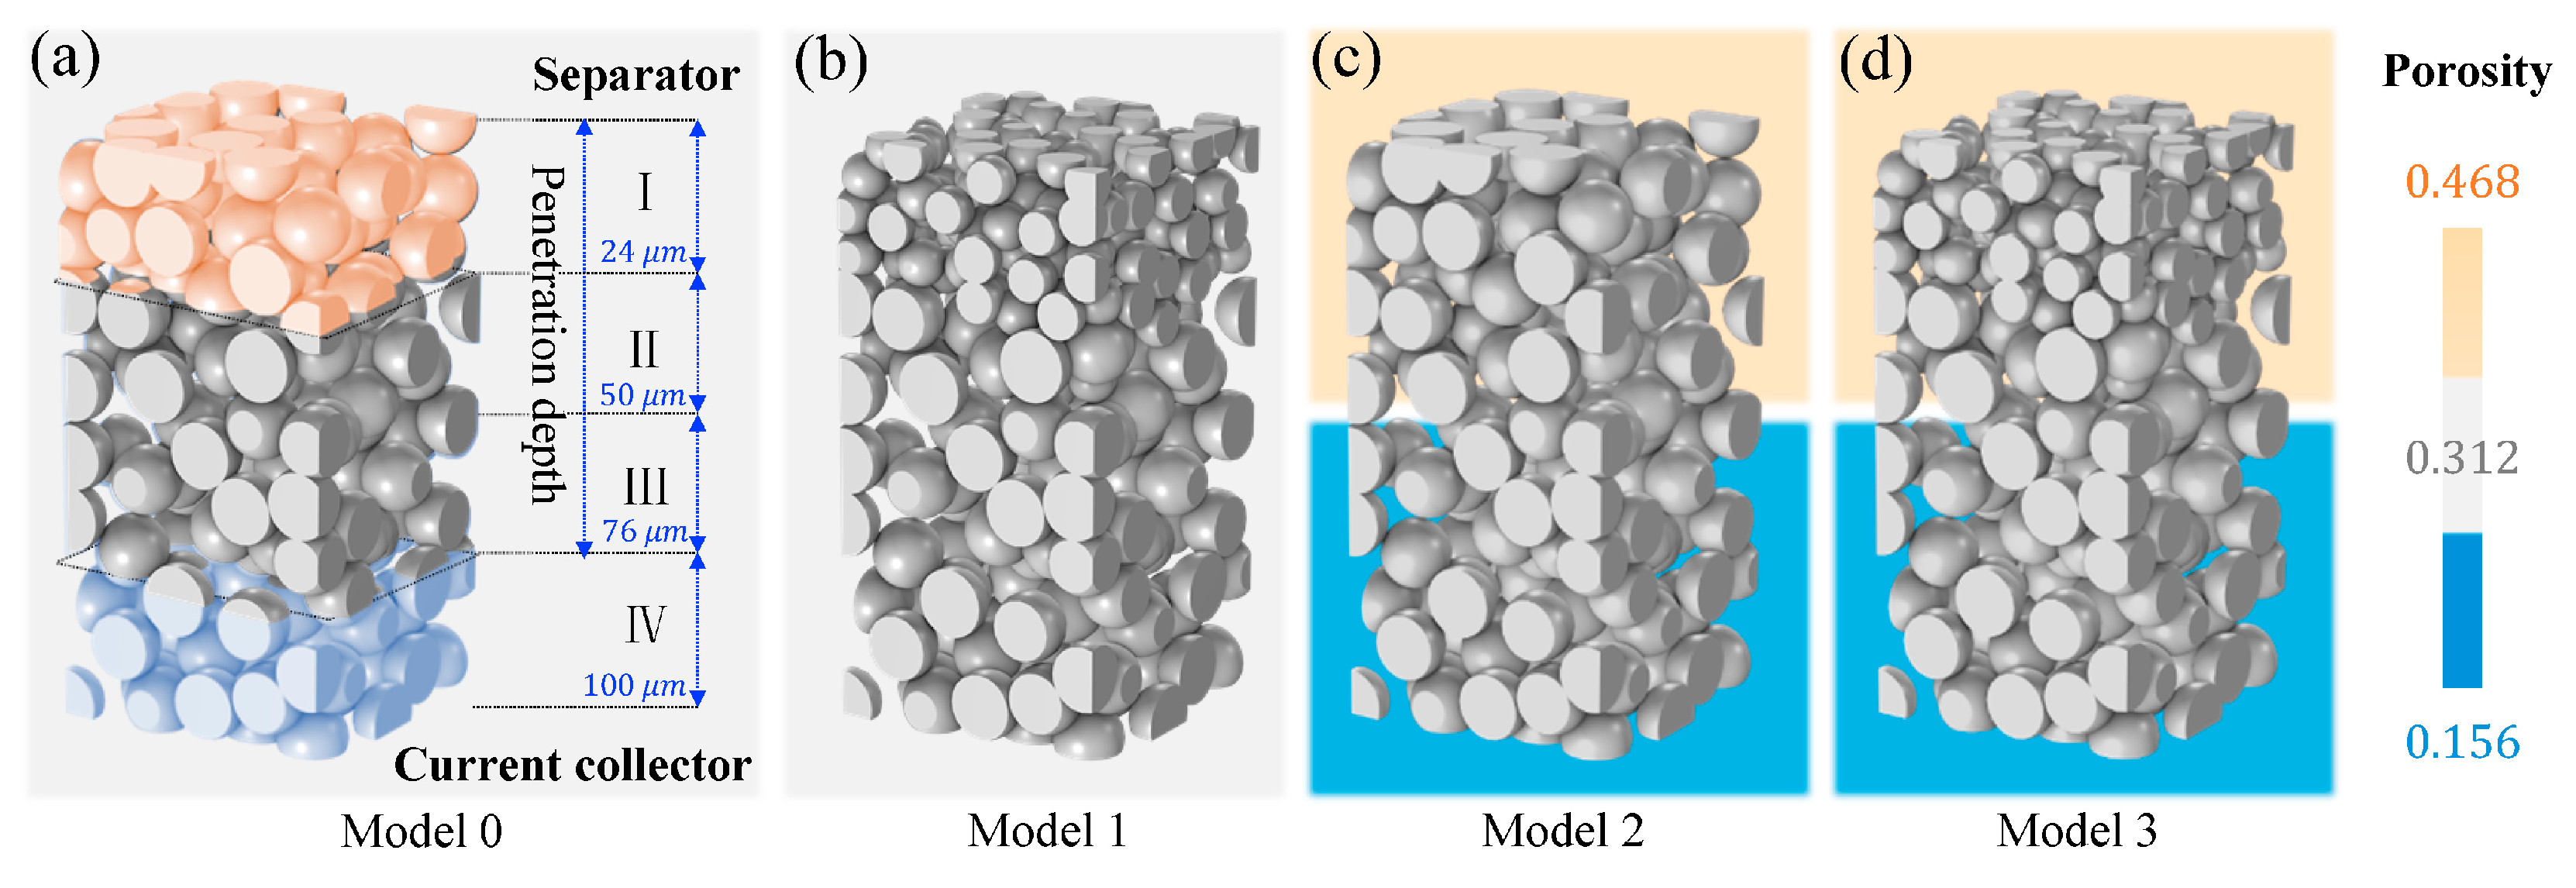
3.3. Regional Graded Electrode Design Strategies

Based on these insights, the electrode is divided into four regions as shown in Figure 4a: (i) the SST-controlled region (region I) with a thickness of about 24 μm near the separator; (ii) the mixed SST and LST-controlled region (SST-dominant, region II) ranging between 25 and 50 μ m ; (iii) the mixed SST and LST-controlled region (LST-dominant, region III) ranging between 51 and 76 μ m ; and (iv) the LST-controlled region (region IV) with a thickness of about 24 μm near the cathode current collector. In this study, two structural optimization schemes are proposed. (i) The particles in the region I are replaced with small particles to reduce the limitation of SST. As shown in Figure 4b (Model 1), the uniform spherical particle size is reduced from 6 μ m to 4 μ m . (ii) The porosity of regions I and II is increased, and that of regions III and IV is reduced to reduce the limitation of LST from separator to the cathode current collector side. The porosity increases/reduces by shrinking/expanding CBD, while the NMC111 particles remain unchanged. As shown in Figure 4c (Model 2), the porosity increases to 0.468 for regions I and II (orange region), and decreases to 0.156 for regions III and IV (blue region); in addition, the details of porosity scheme selection can be found in the SI (Supplementary Table S6). The electrode in Figure 4d (Model 3) is designed to a dual-gradient electrode incorporating graded particle size and porosity.
Figure 5a compares the voltage response of different microstructural designs. It shows that the capacity performance of the graded particle sizes electrode (Model 1) and the graded porosity electrode (Model 2) increases by up to 5.4% and 37.5% at 5C, respectively. The dual-gradient electrode incorporating graded particle size and porosity (Model 3) has the highest capacity and power density, with up to 39% increase in capacity performance at 5C compared to the homogeneous electrode (Model 0) without sacrificing the gravimetric energy density. This is an exciting improvement in discharge rate performance, showing the importance of the descriptor-based microstructural design of LIBs electrodes.
To understand the influence of the improved electrode microstructure (graded particle size and porosity) on the discharge rate performance, the SST-controlled depth and the LST-controlled depth (the electrode penetration depth) are analyzed for different microstructural designs, as shown in Figure 5b; and the details of determining the above parameters can be found in the SI (Supplementary Figure S5). It is obvious that there is a significant increase in the SST-controlled depth for the electrode with the reduced particle size, revealing an increase in the utilization rate of particles near the separator. The result of the average SoL in Figure 5c (Model 1) gives evidence to the explanation, where the SoL of purple particles is significantly higher than that of orange particles near the separator. As seen in Figure 5b,d, there is almost no difference in the electrode penetration depth and the average lithium ions concentration profiles in the electrolyte between Model 0 and Model 1, which indicates that the particles near the cathode current collector remain unutilized, and the details of 3D SoL distribution of particles at the end stage of discharge can be found in the SI (Supplementary Figure S6). Therefore, we can conclude that the improved graded particle size has a limited improvement on the discharge rate performance. As seen in Figure 5b (Models 2 and 3), the electrode with improved graded porosity has not only an increased SST-controlled depth, but also a longer penetration depth. The electrode penetration depth increases up to 100 μm (the thickness of the electrode). This indicates that the improved graded porosity brings about a substantial improvement in LST, which is seen from the increased average lithium ions concentration in the electrolyte compared with the homogeneous electrode in Figure 5d. In addition, there is a significant increase in the SST-controlled depth of the electrodes, revealing an increase in the utilization rate of particles near the separator caused by the improved graded porosity. As shown in Figure 5c, the SoL of blue and green particles is significantly higher than that of purple and orange particles. In conclusion, the electrode structure design with graded particle size and porosity is important to improve the capacity and power performance at high C-rates, especially the graded porosity design, which is a practical way to break the limits of unsatisfactory rate capability in sight.

4. Conclusions

Two descriptors including dSoL and Δ SoL are proposed, which clearly divide the electrode into four regions across the electrode depth, namely, an SST-controlled region, two mixed SST and LST-controlled regions (SST-dominant and LST-dominant, respectively), and an LST-controlled region. Based on these insights, the smaller particles are placed in the SST-controlled region to reduce the limitation of SST; graded porosity increasing from the current collector to the separator is assigned to reduce the limitation of LST. Then, a graded particle sizes electrode, a graded porosity electrode, and a dual-gradient electrode incorporating graded particle size and porosity are designed. The 3D simulations are performed on these electrodes and results show that the capacity performance increases by up to 5.4%, 37.5%, and 39% at 5C, respectively, at 5C compared to the homogeneous electrode without sacrificing the gravimetric energy density. The graded porosity has a greater effect on the rate performance than the graded particle size. This study identifies more refined division strategies of electrode regions by the proposed descriptors, which is highly practical for the rational design of the regional electrode. On the basis, the study provides valuable descriptor-based regional electrode design strategies to rationalizing the fabrication of next-generation LIBs.

Supplementary Materials

The following supporting information can be downloaded at: https://www.mdpi.com/article/10.3390/batteries9040227/s1, Figure S1: the concentration dependence of transference number; Figure S2: the concentration dependence of thermodynamic factor; Figure S3: the OCV vs. DoD used for the modelling; Figure S4: the comparison of the experimental and simulated discharge response; Figure S5: the time differential of the average state of lithium (dSoL) for different models; Figure S6: the 3D SoL distribution of particles for different models at the end stage of discharge; Table S1: model equations for each domain in the 3D microstructure-based electrochemical model; Table S2: boundary conditions; Table S3: material properties and model parameters [25,26,27,28,29,30,31]; Table S4: nomenclature; Table S5: Abbreviation; Table S6: Graded porosity design schemes.

Author Contributions

Conceptualization, Q.S., Y.L. and S.C.; methodology, Q.S., Y.L. and S.C.; software, Q.S.; validation, Q.S.; investigation, Q.S.; data curation, Q.S.; writing—original draft preparation, Q.S.; writing—review and editing, S.C.; supervision, S.C.; project administration, Y.L. and S.C.; funding acquisition, Y.L. and S.C. All authors have read and agreed to the published version of the manuscript.

Funding

This research was funded by the National Natural Science Foundation of China (Grant Nos. 21773175, 21832004).

Data Availability Statement

Data will be made available on request.

Acknowledgments

We gratefully acknowledge the library of ETH Zurich for providing the open source datasets including the materials and electrochemical test datasets. We thank the Supercomputing Center of Wuhan University for providing numerical calculation support.

Conflicts of Interest

The authors declare no conflict of interest.

References

  1. Cano, Z.P.; Banham, D.; Ye, S.; Hintennach, A.; Lu, J.; Fowler, M.; Chen, Z. Batteries and fuel cells for emerging electric vehicle markets. Nat. Energy 2018, 3, 279–289. [Google Scholar]
  2. Xu, J.; Cai, X.; Cai, S.; Shao, Y.; Hu, C.; Lu, S.; Ding, S. High-Energy Lithium Ion Batteries: Recent Progress and A Promising Future in Applications. Energy Environ. Mater. 2022, e12450. [Google Scholar] [CrossRef]
  3. Armand, M.; Axmann, P.; Bresser, D.; Copley, M.; Edström, K.; Ekberg, C.; Guyomard, D.; Lestriez, B.; Novák, P.; Petranikova, M. Lithium-ion batteries–Current state of the art and anticipated developments. J. Power Sources 2020, 479, 228708. [Google Scholar] [CrossRef]
  4. Liu, Y.; Zhu, Y.; Cui, Y. Challenges and opportunities towards fast-charging battery materials. Nat. Energy 2019, 4, 540–550. [Google Scholar] [CrossRef]
  5. Harris, S.J.; Lu, P. Effects of Inhomogeneities—Nanoscale to Mesoscale—On the Durability of Li-Ion Batteries. J. Phys. Chem. C 2013, 117, 6481–6492. [Google Scholar] [CrossRef]
  6. Dillon, S.J.; Sun, K. Microstructural design considerations for Li-ion battery systems. Curr. Opin. Solid State Mater. Sci. 2012, 16, 153–162. [Google Scholar] [CrossRef]
  7. Lu, X.; Zhang, X.; Tan, C.; Heenan, T.M.; Lagnoni, M.; O’Regan, K.; Daemi, S.; Bertei, A.; Jones, H.G.; Hinds, G. Multi-length scale microstructural design of lithium-ion battery electrodes for improved discharge rate performance. Energy Environ. Sci. 2021, 14, 5929–5946. [Google Scholar] [CrossRef]
  8. Lu, X.; Bertei, A.; Finegan, D.P.; Tan, C.; Daemi, S.R.; Weaving, J.S.; O’Regan, K.B.; Heenan, T.M.; Hinds, G.; Kendrick, E. 3D microstructure design of lithium-ion battery electrodes assisted by X-ray nano-computed tomography and modelling. Nat. Commun. 2020, 11, 2079. [Google Scholar] [CrossRef] [PubMed]
  9. Stephenson, D.E.; Walker, B.C.; Skelton, C.B.; Gorzkowski, E.P.; Rowenhorst, D.J.; Wheeler, D.R. Modeling 3D microstructure and ion transport in porous Li-ion battery electrodes. J. Electrochem. Soc. 2011, 158, A781. [Google Scholar] [CrossRef]
  10. Shearing, P.R.; Howard, L.E.; Jørgensen, P.S.; Brandon, N.P.; Harris, S.J. Characterization of the 3-dimensional microstructure of a graphite negative electrode from a Li-ion battery. Electrochem. Commun. 2010, 12, 374–377. [Google Scholar]
  11. Chowdhury, R.; Banerjee, A.; Zhao, Y.; Liu, X.; Brandon, N. Simulation of bi-layer cathode materials with experimentally validated parameters to improve ion diffusion and discharge capacity. Sustain. Energy Fuels 2021, 5, 1103–1119. [Google Scholar] [CrossRef]
  12. Huang, C.; Leung, C.L.A.; Leung, P.; Grant, P.S. A solid-state battery cathode with a polymer composite electrolyte and low tortuosity microstructure by directional freezing and polymerization. Adv. Energy Mater. 2021, 11, 2002387. [Google Scholar] [CrossRef]
  13. Lv, Z.; Yue, M.; Ling, M.; Zhang, H.; Yan, J.; Zheng, Q.; Li, X. Controllable Design Coupled with Finite Element Analysis of Low-Tortuosity Electrode Architecture for Advanced Sodium-Ion Batteries with Ultra-High Mass Loading. Adv. Energy Mater. 2021, 11, 2003725. [Google Scholar] [CrossRef]
  14. Zhang, X.; Hui, Z.; King, S.T.; Wu, J.; Ju, Z.; Takeuchi, K.J.; Marschilok, A.C.; West, A.C.; Takeuchi, E.S.; Wang, L. Gradient Architecture Design in Scalable Porous Battery Electrodes. Nano Lett. 2022, 22, 2521–2528. [Google Scholar] [CrossRef] [PubMed]
  15. Liu, L.; Guan, P.; Liu, C. Experimental and simulation investigations of porosity graded cathodes in mitigating battery degradation of high voltage lithium-ion batteries. J. Electrochem. Soc. 2017, 164, A3163. [Google Scholar] [CrossRef]
  16. Wu, J.; Ju, Z.; Zhang, X.; Xu, X.; Takeuchi, K.J.; Marschilok, A.C.; Takeuchi, E.S.; Yu, G. Low-Tortuosity Thick Electrodes with Active Materials Gradient Design for Enhanced Energy Storage. ACS Nano 2022, 16, 4805–4812. [Google Scholar] [CrossRef] [PubMed]
  17. Niu, Z.; Pinfield, V.J.; Wu, B.; Wang, H.; Jiao, K.; Leung, D.Y.; Xuan, J. Towards the digitalisation of porous energy materials: Evolution of digital approaches for microstructural design. Energy Environ. Sci. 2021, 14, 2549–2576. [Google Scholar] [CrossRef]
  18. Zhang, X.; Ju, Z.; Zhu, Y.; Takeuchi, K.J.; Takeuchi, E.S.; Marschilok, A.C.; Yu, G. Multiscale understanding and architecture design of high energy/power lithium-ion battery electrodes. Adv. Energy Mater. 2021, 11, 2000808. [Google Scholar] [CrossRef]
  19. Boyce, A.M.; Lu, X.; Brett, D.J.; Shearing, P.R. Exploring the influence of porosity and thickness on lithium-ion battery electrodes using an image-based model. J. Power Sources 2022, 542, 231779. [Google Scholar] [CrossRef]
  20. Dai, Y.; Srinivasan, V. On graded electrode porosity as a design tool for improving the energy density of batteries. J. Electrochem. Soc. 2015, 163, A406. [Google Scholar] [CrossRef]
  21. Hui, Z.; Mayilvahanan, K.S.; Ganko, K.; Yang, Y.; Zhang, X.; Ju, Z.; Takeuchi, K.J.; Marschilok, A.C.; Yu, G.; Takeuchi, E. Optimal electrode-scale design of Li-ion electrodes: A general correlation. Energy Storage Mater. 2021, 39, 176–185. [Google Scholar] [CrossRef]
  22. Zielke, L.; Hutzenlaub, T.; Wheeler, D.R.; Chao, C.W.; Manke, I.; Hilger, A.; Paust, N.; Zengerle, R.; Thiele, S. Three-phase multiscale modeling of a LiCoO2 cathode: Combining the advantages of FIB–SEM imaging and X-Ray tomography. Adv. Energy Mater. 2015, 5, 1401612. [Google Scholar]
  23. Wiedemann, A.H.; Goldin, G.M.; Barnett, S.A.; Zhu, H.; Kee, R.J. Effects of three-dimensional cathode microstructure on the performance of lithium-ion battery cathodes. Electrochim. Acta 2013, 88, 580–588. [Google Scholar] [CrossRef]
  24. Ebner, M.; Geldmacher, F.; Marone, F.; Stampanoni, M.; Wood, V. X-ray tomography of porous, transition metal oxide based lithium ion battery electrodes. Adv. Energy Mater. 2013, 3, 845–850. [Google Scholar] [CrossRef]
  25. Nyman, A.; Behm, M.; Lindbergh, G. Electrochemical characterisation and modelling of the mass transport phenomena in LiPF6-EC-EMC. Electrochim. Acta 2008, 53, 6356. [Google Scholar] [CrossRef]
  26. Zavalis, T.G.; Behm, M.; Lindbergh, G. Investigations of Short-Circuit Scenarios in a Lithium-Ion Battery Cell. J. Electrochem. Soc. 2012, 159, A848. [Google Scholar] [CrossRef]
  27. Cai, L.; White, R.E. Mathematical modeling of a lithium ion battery with thermal effects in COMSOL Inc. Multiphysics (MP) software. J. Power Sources 2011, 196, 5985–5989. [Google Scholar] [CrossRef]
  28. Zheng, W.; Shui, M.; Shu JI, E.; Gao, S.; Xu, D.; Chen, L.; Feng, L.; Ren, Y. GITT studies on oxide cathode LiNi1/3Co1/3Mn1/3O2 synthesized by citric acid assisted high-energy ball milling. Bull. Mater. Sci. 2013, 36, 495–498. [Google Scholar] [CrossRef]
  29. Park, M.; Zhang, X.; Chung, M.; Less, G. A review of conduction phenomena in Li-ion batteries. J. Power Sources 2010, 195, 7904–7929. [Google Scholar] [CrossRef]
  30. Danner, T.; Singh, M.; Hein, S.; Kaiser, J.; Hahn, H.; Latz, A. Thick electrodes for Li-ion batteries: A model based analysis. J. Power Sources 2016, 334, 191–201. [Google Scholar] [CrossRef] [Green Version]
  31. Liu, G.; Zheng, H.; Kim, S.; Deng, Y.; Minor, A.M.; Song, X.; Battaglia, V.S. Effects of various conductive additive and polymeric binder contents on the performance of a lithium-ion composite cathode. J. Electrochem. Soc. 2008, 155, A887. [Google Scholar] [CrossRef] [Green Version]
Figure 1. (a) The homogeneous electrode used in the study; (b) the corresponding unstructured mesh.
Batteries 09 00227 g001
Figure 2. The concentration distribution dynamic evolution of lithium ions in the active materials and electrolyte over time at 5C. (a) Average SoL at different DoDs; (b) dSoL across the depth of electrode; (c) the 3D SoL distribution of particles; and (d) the 3D lithium ions concentration profiles in the electrolyte at the corresponding DoD. Note: the maximum DoD achievable for the homogeneous electrode with constant currents discharge at 5C (3.0 V cut-off) and 25 °C is 56%.
Batteries 09 00227 g002
Figure 3. Analysis of mixed SST and LST-controlled region. The dynamic evolution of (a) Δ SoL distribution, (b) average lithium ions concentration distribution in the electrolyte, (c) the 3D local reaction current density distribution, and (d) the 3D local overpotential distribution. Note: the maximum DoD achievable for the homogeneous electrode with constant currents discharge at 5C (3.0 V cut-off) and 25 °C is 56%.
Batteries 09 00227 g003
Figure 4. The regional graded electrode design. (a) Electrode region division strategies for homogeneous electrode; (b) a graded particle sizes electrode for improved SST capability; (c) a graded porosity electrode for improved LST capability; (d) a dual-gradient electrode incorporating graded particle size and porosity.
Batteries 09 00227 g004
Figure 5. Comparison of (a) voltage response; (b) the SST-controlled depth, and the LST-controlled depth (penetration depth) for different microstructural designs; (c) average SoL; and (d) lithium ions concentration profiles in the electrolyte at the end stage of discharge.
Batteries 09 00227 g005
Disclaimer/Publisher’s Note: The statements, opinions and data contained in all publications are solely those of the individual author(s) and contributor(s) and not of MDPI and/or the editor(s). MDPI and/or the editor(s) disclaim responsibility for any injury to people or property resulting from any ideas, methods, instructions or products referred to in the content.

