
The Effects of Silicon Anode Thickness on the Electrochemical Performance of Li-Ion Batteries


Abstract
1. Introduction
2. Experimental
2.1. Electrode Preparation
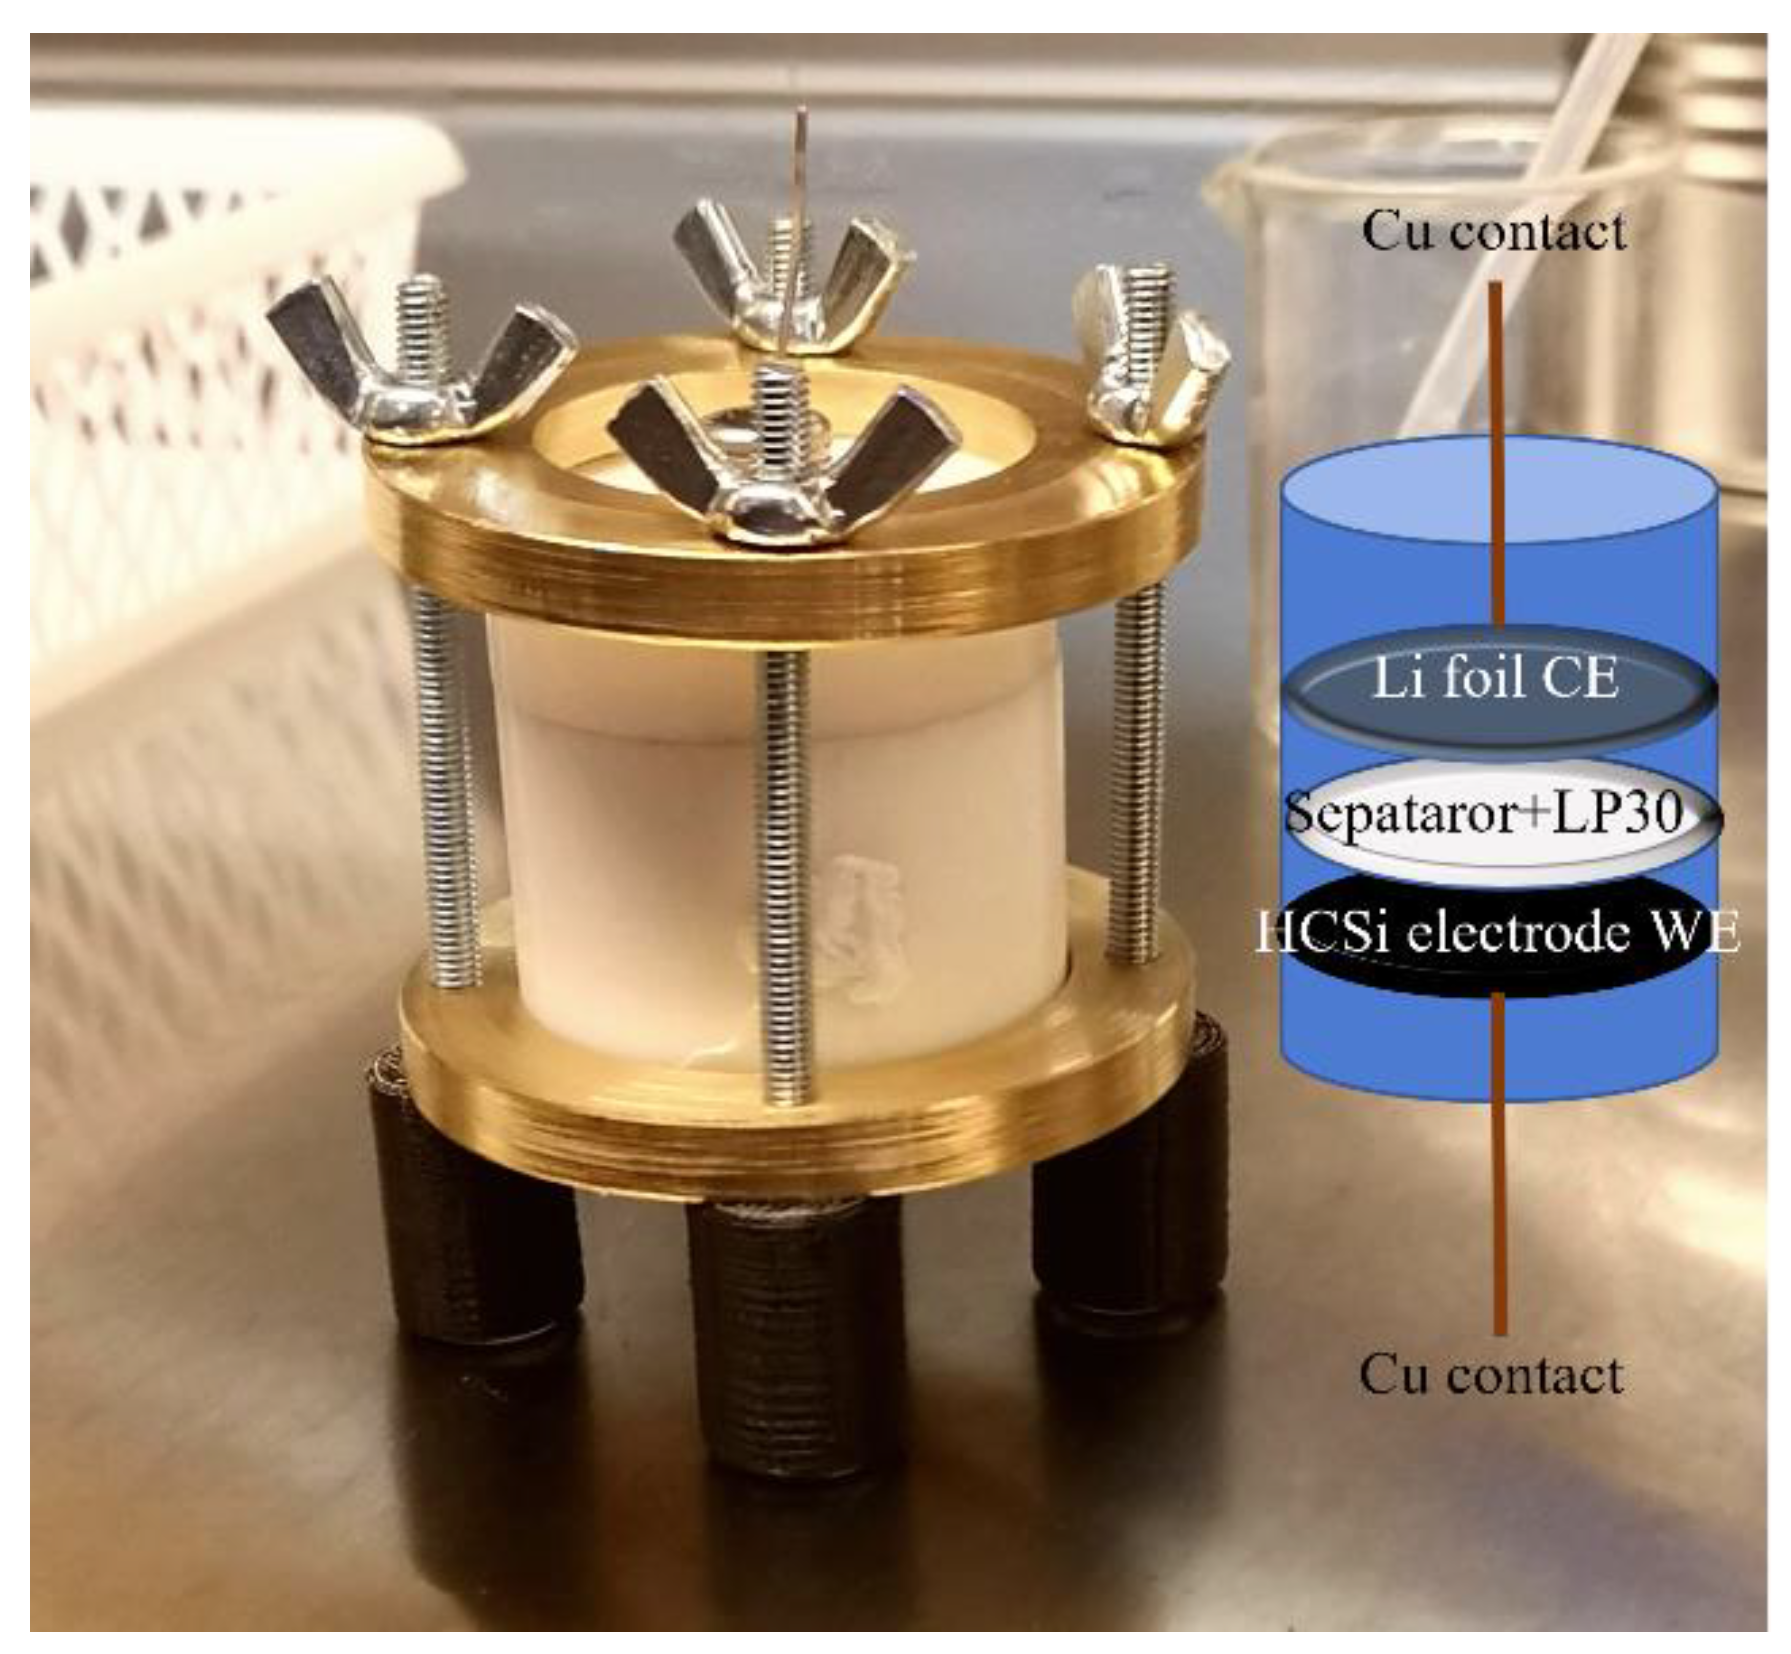
2.2. Electrochemicall Cell Preparation
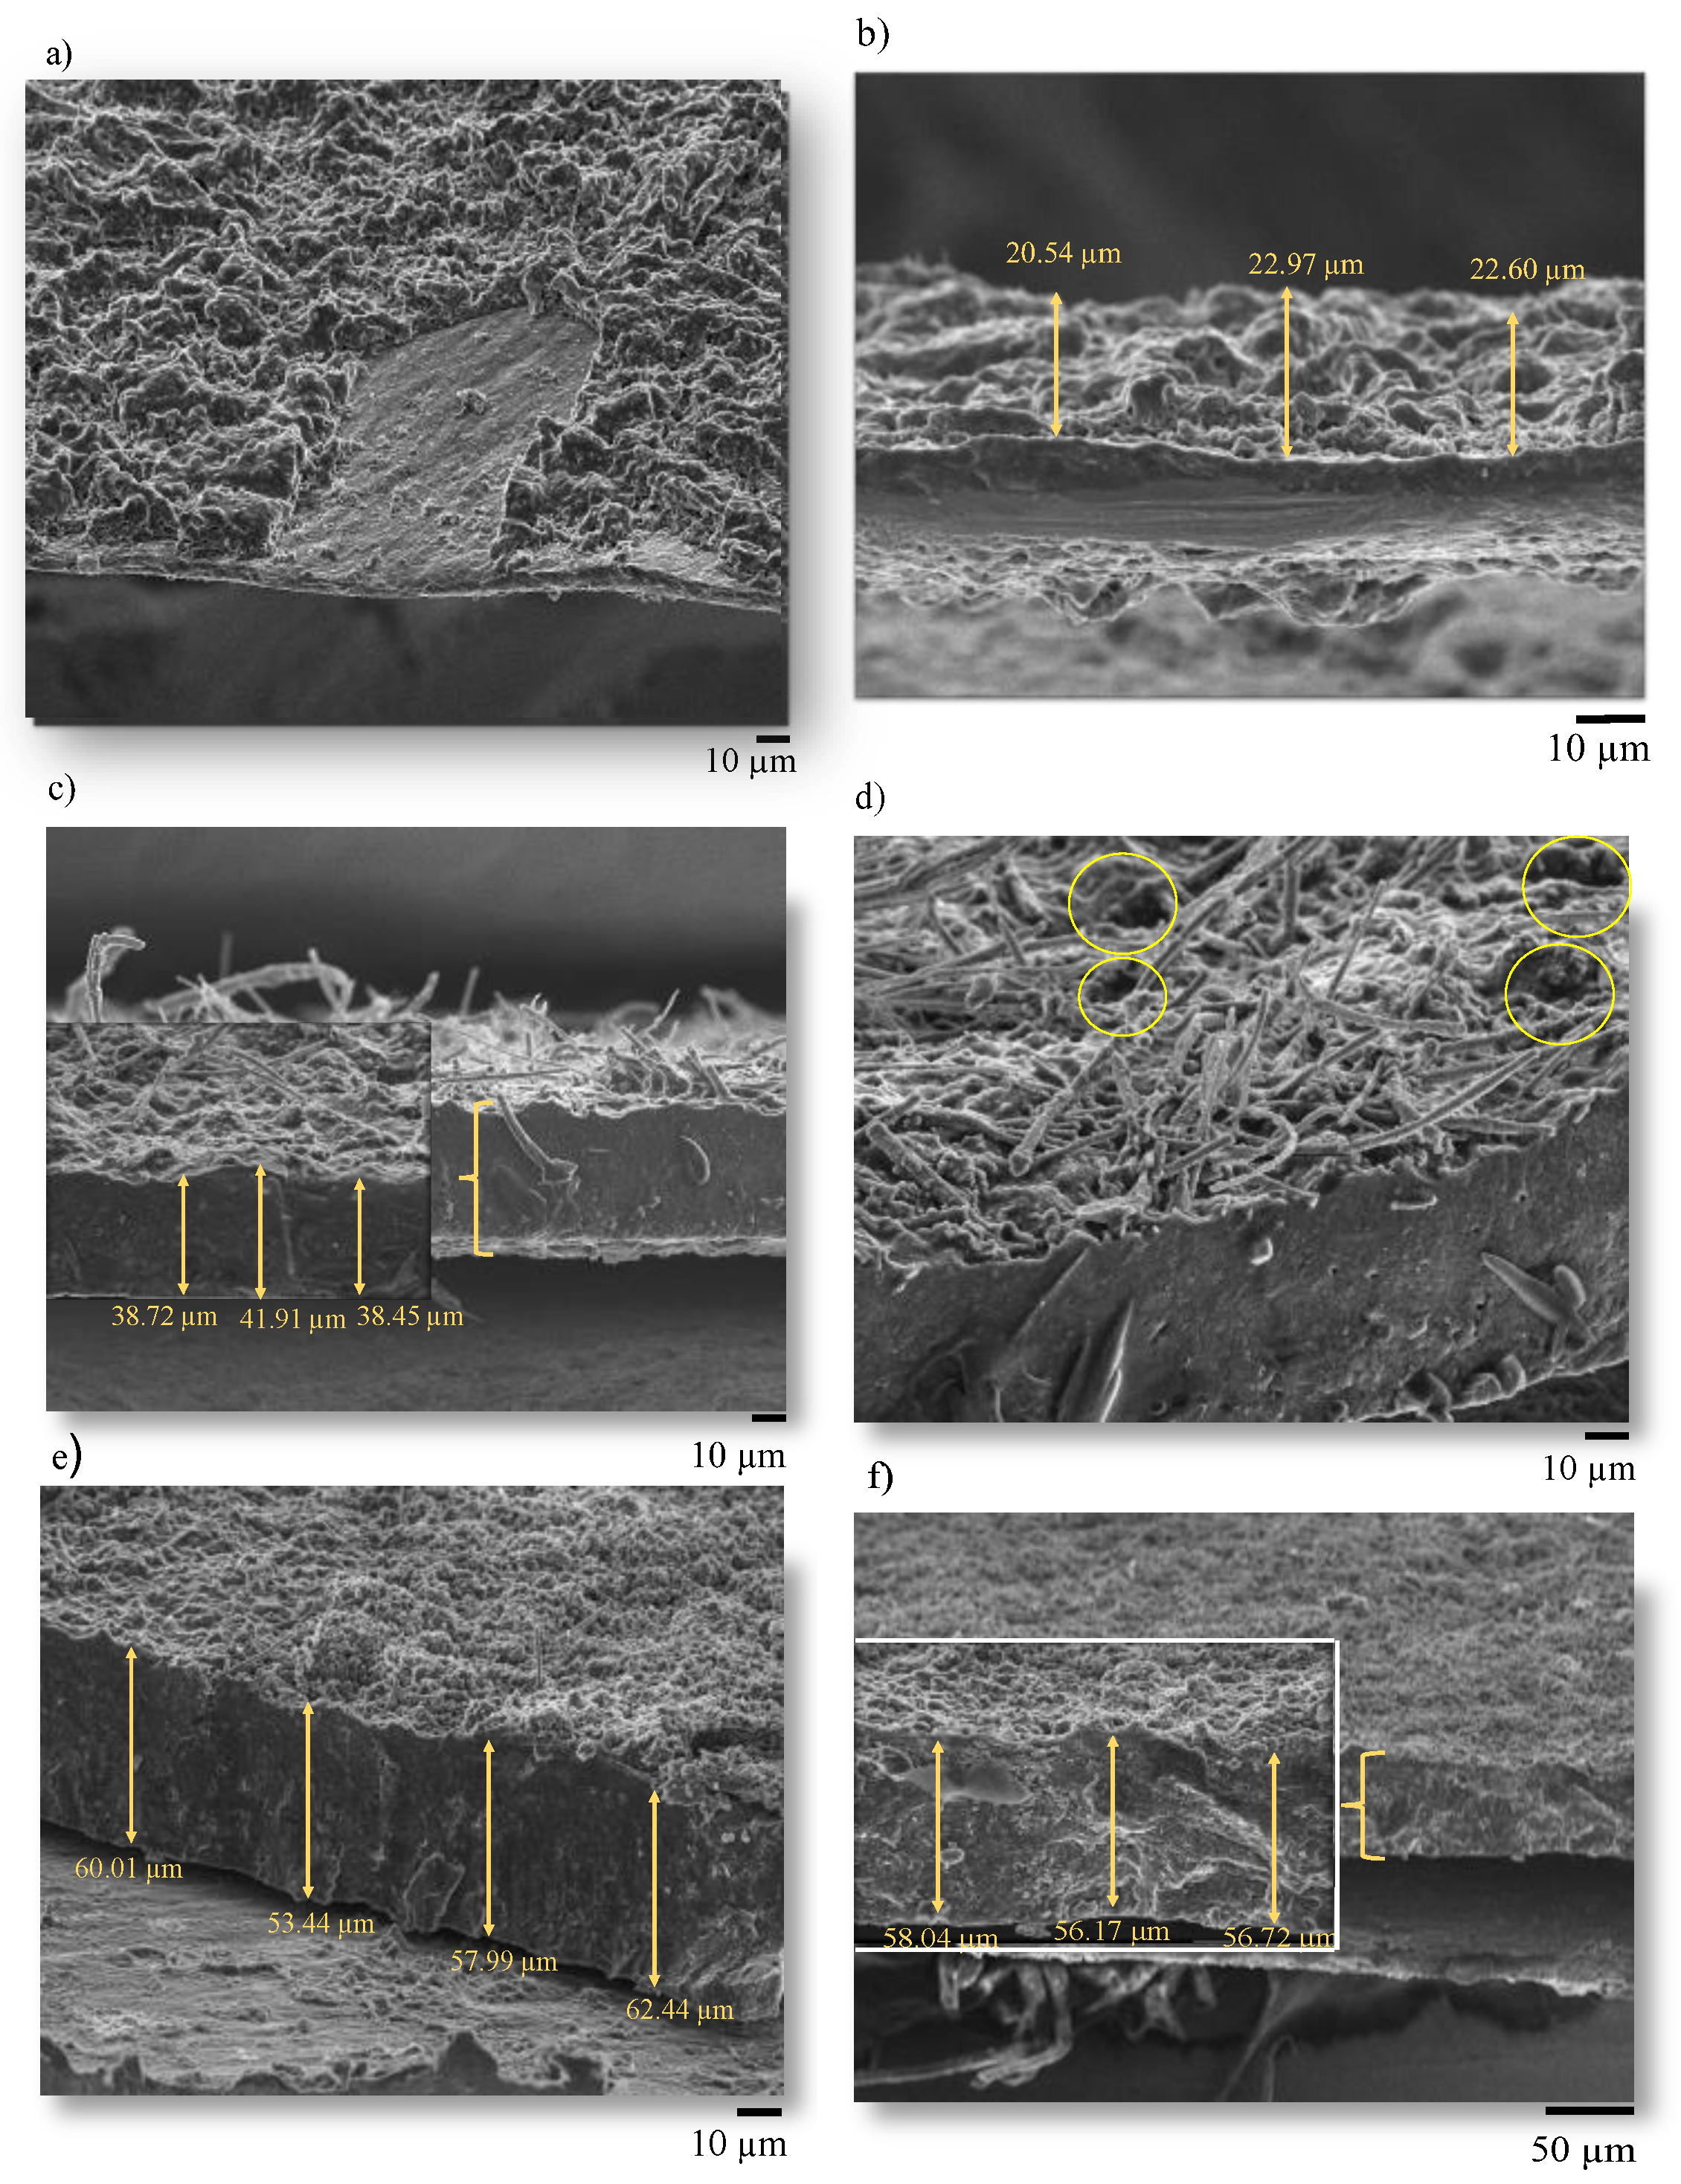
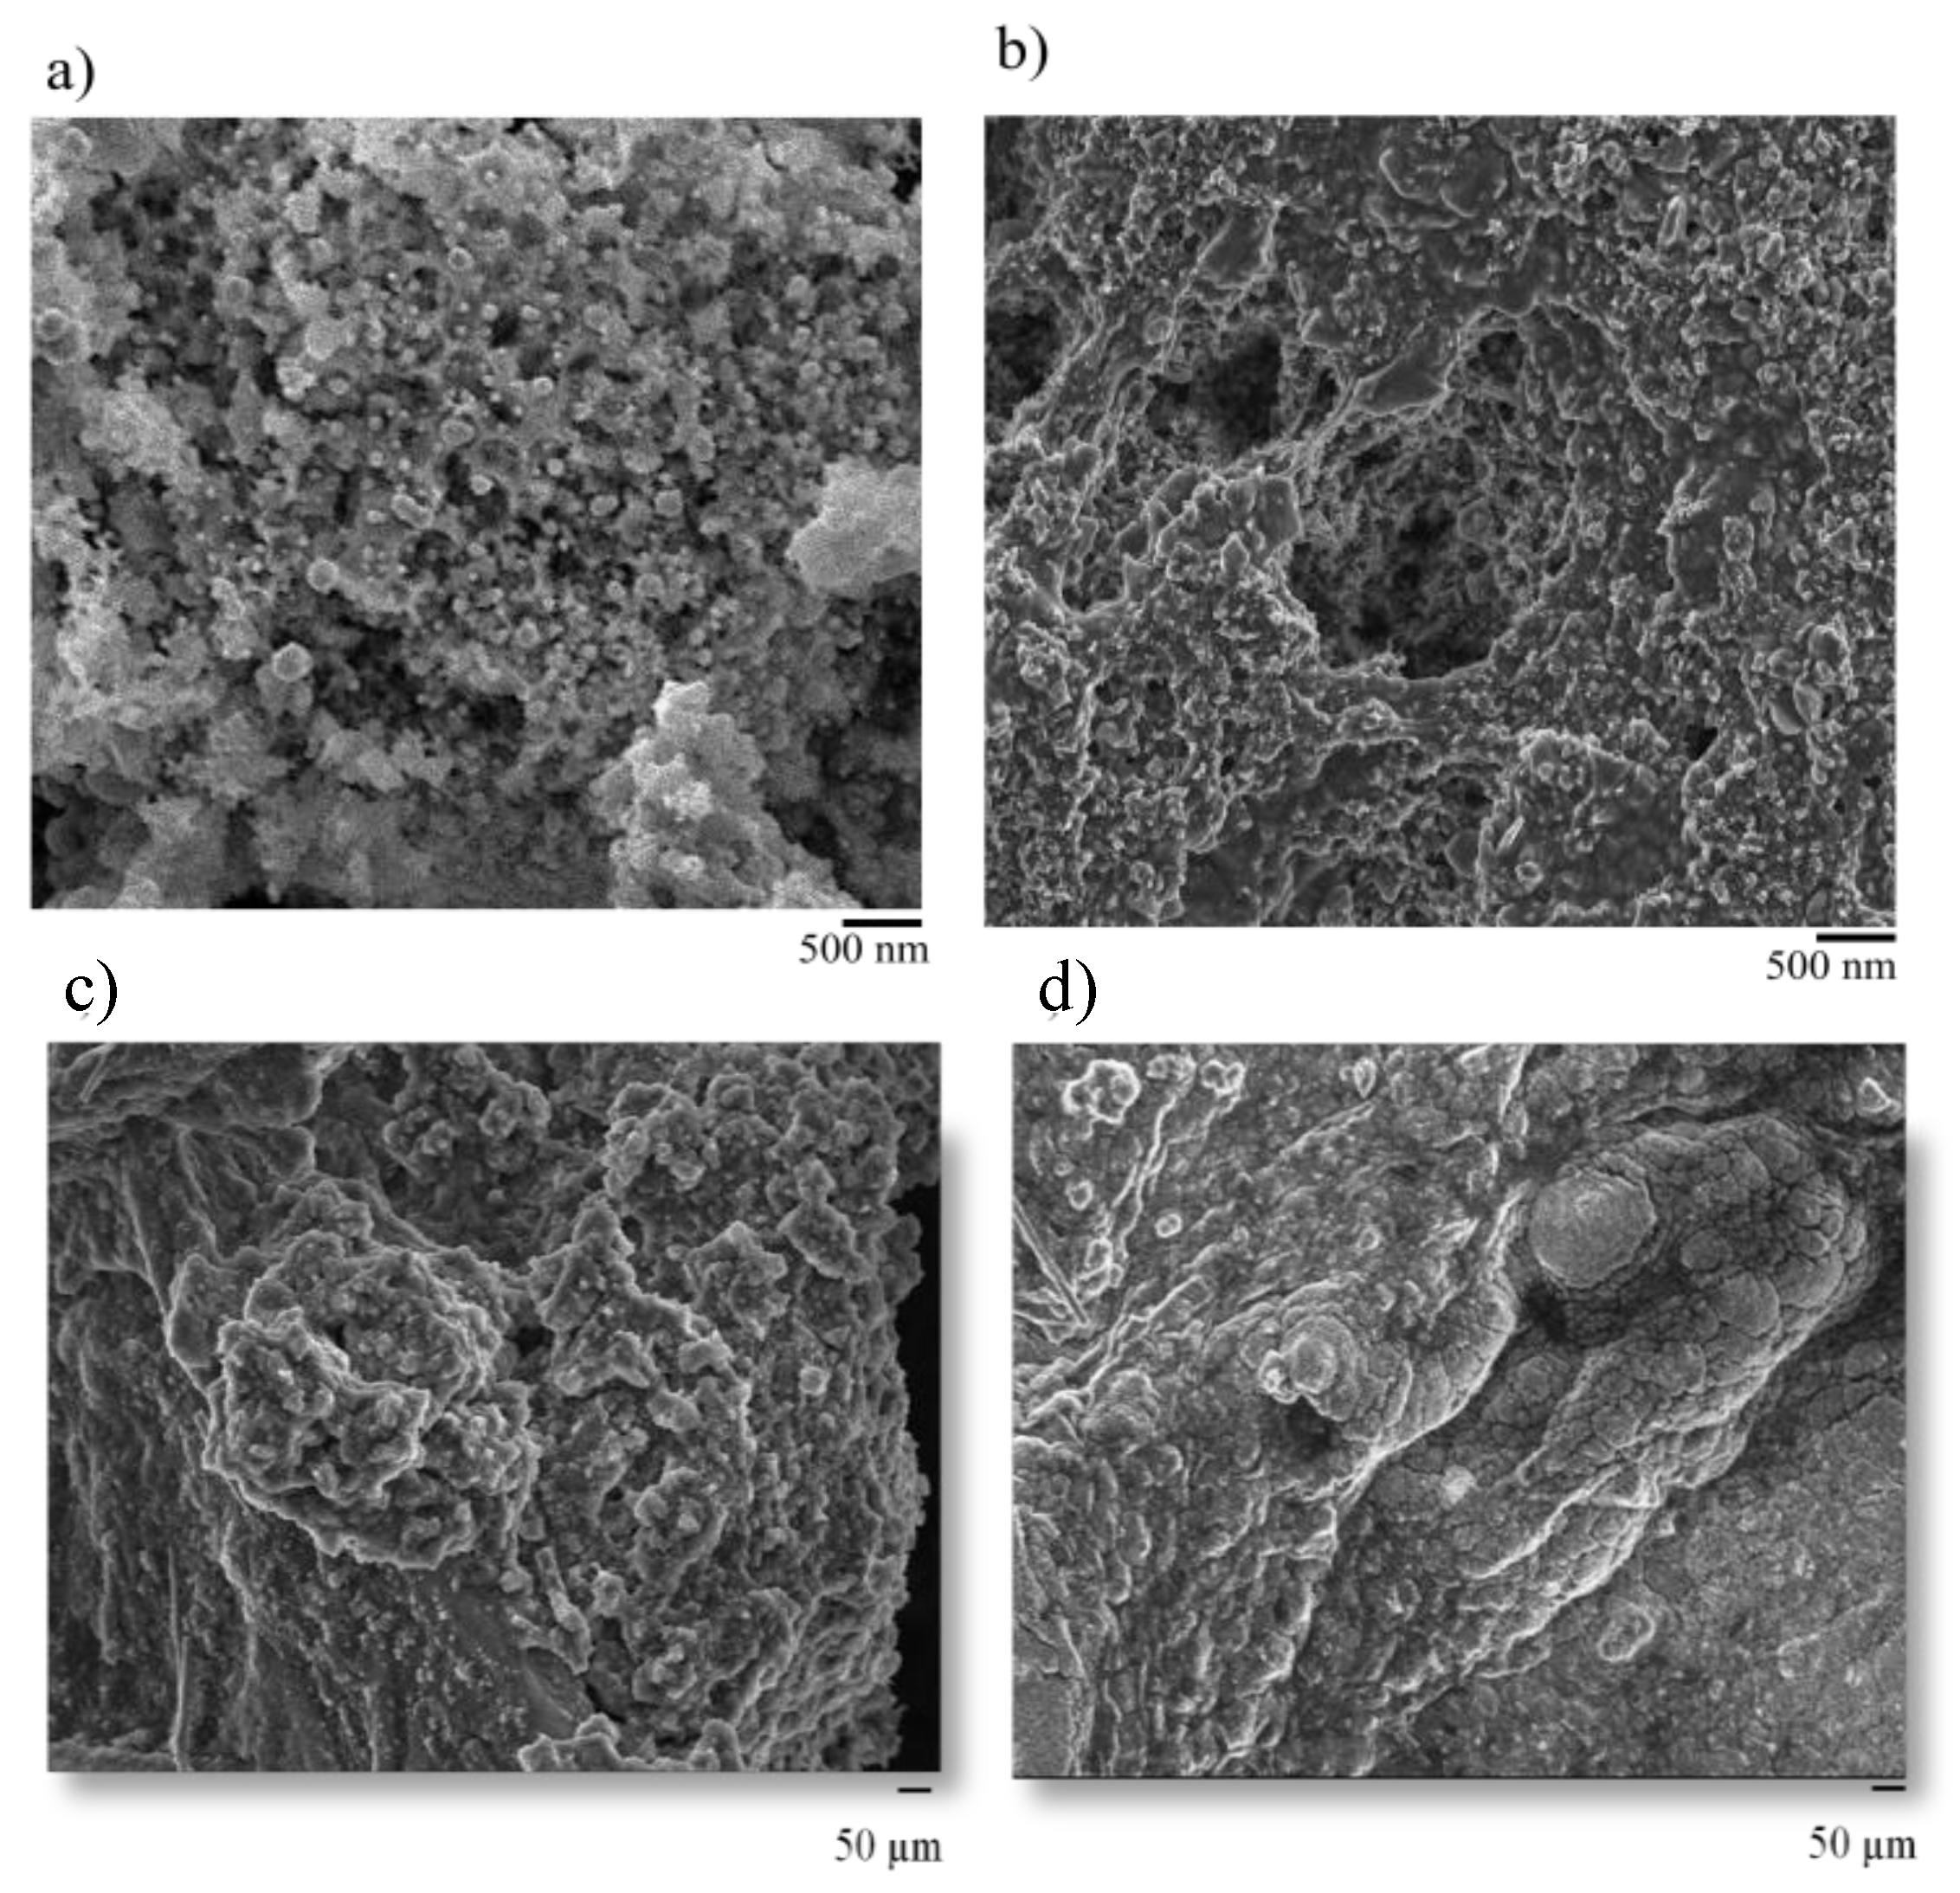
2.3. Instrumental Analysis
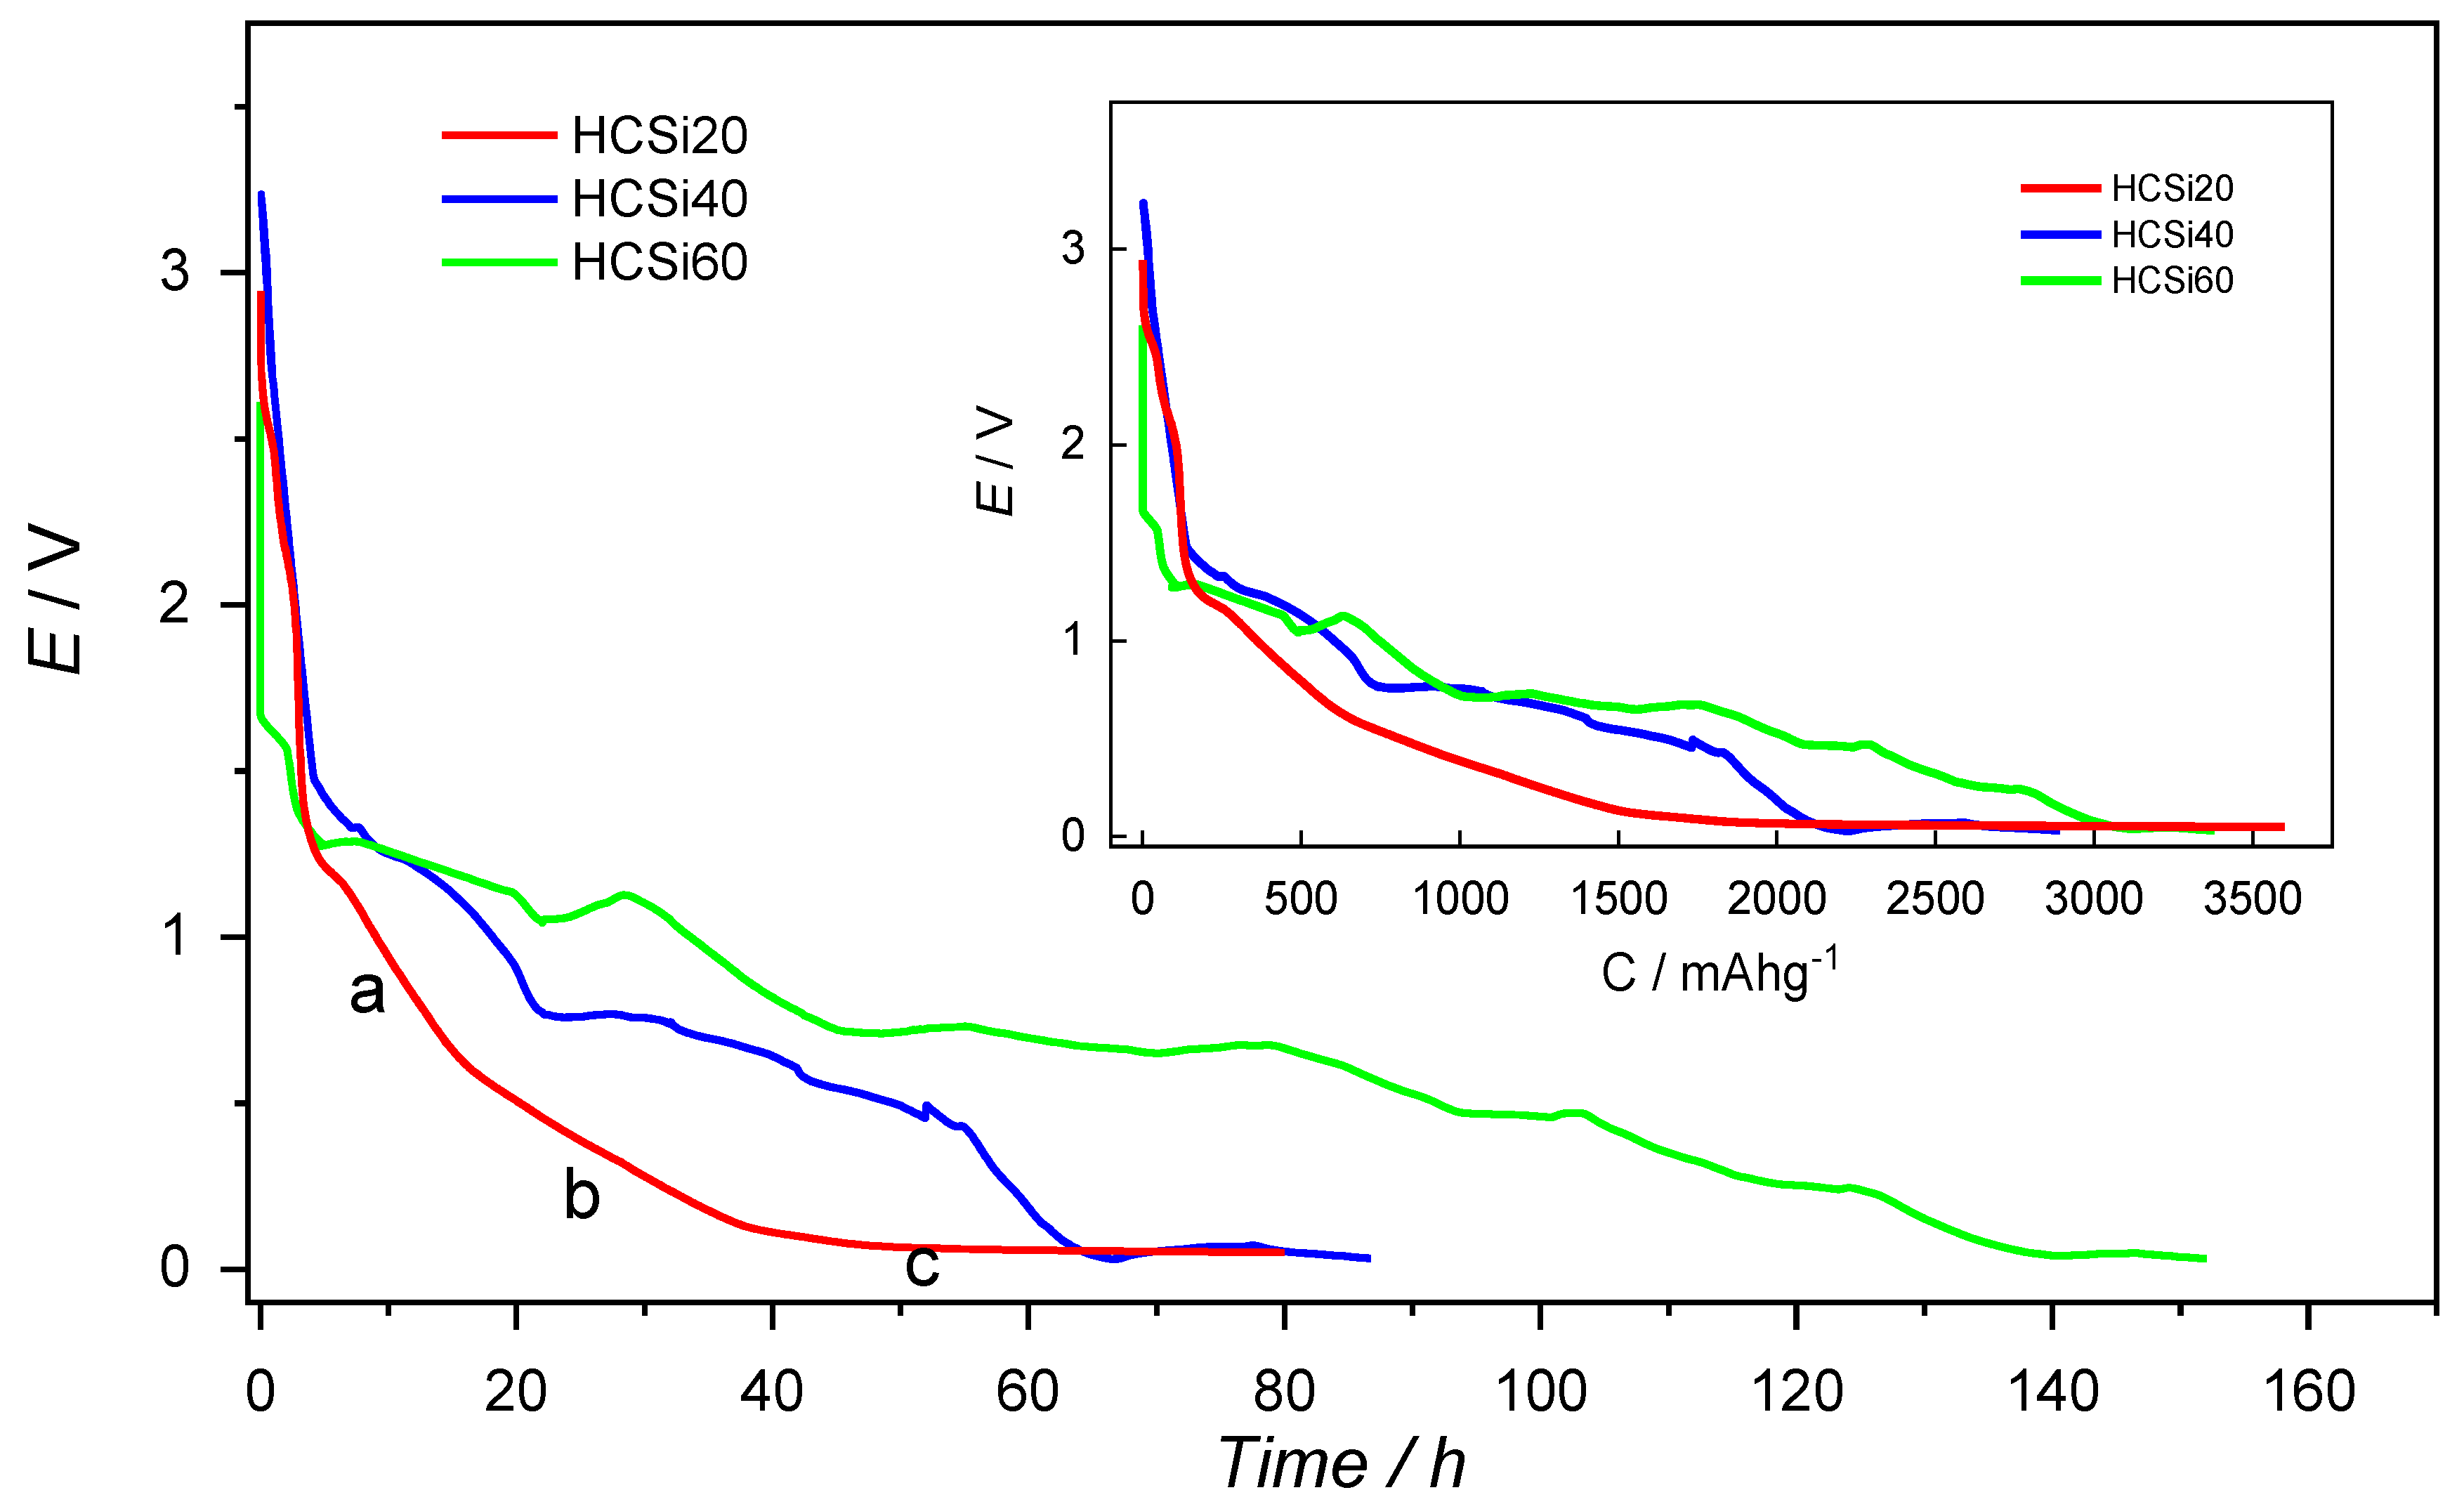
3. Results
4. Conclusions
Author Contributions
Funding
Data Availability Statement
Conflicts of Interest
References
- Ashuri, M.; He, Q.; Shaw, L.L. Silicon as a Potential Anode Material for Li-Ion Batteries: Where Size, Geometry and Structure Matter. Nanoscale 2016, 8, 74–103. [Google Scholar] [CrossRef] [PubMed]
- Salah, M.; Murphy, P.; Hall, C.; Francis, C.; Kerr, R.; Fabretto, M. Pure Silicon Thin-Film Anodes for Lithium-Ion Batteries: A Review. J. Power Sources 2019, 414, 48–67. [Google Scholar] [CrossRef]
- Raić, M.; Mikac, L.; Marić, I.; Štefanić, G.; Škrabić, M.; Gotić, M.; Ivanda, M. Nanostructured Silicon as Potential Anode Material for Li-Ion Batteries. Molecules 2020, 25, 891. [Google Scholar] [CrossRef] [PubMed]
- Wei, Q.; Liu, G.C.; Zhang, C.; Hong, X.J.; Song, C.L.; Yang, Y.; Zhang, M.; Huang, W.; Cai, Y.P. Novel Honeycomb Silicon Wrapped in Reduced Graphene Oxide/CNT System as High-Stability Anodes for Lithium-Ion Batteries. Electrochim. Acta 2019, 317, 583–593. [Google Scholar] [CrossRef]
- Li, P.; Zhao, G.; Zheng, X.; Xu, X.; Yao, C.; Sun, W.; Dou, S.X. Recent Progress on Silicon-Based Anode Materials for Practical Lithium-Ion Battery Applications. Energy Storage Mater. 2018, 15, 422–446. [Google Scholar] [CrossRef]
- Devaux, D.; Leduc, H.; Dumaz, P.; Lecuyer, M.; Deschamps, M.; Bouchet, R. Effect of Electrode and Electrolyte Thicknesses on All-Solid-State Battery Performance Analyzed With the Sand Equation. Front. Energy Res. 2020, 7, 168. [Google Scholar] [CrossRef]
- Eshetu, G.G.; Zhang, H.; Judez, X.; Adenusi, H.; Armand, M.; Passerini, S.; Figgemeier, E. Production of High-Energy Li-Ion Batteries Comprising Silicon-Containing Anodes and Insertion-Type Cathodes. Nat. Commun. 2021, 12, 5459. [Google Scholar] [CrossRef]
- Singh, M.; Kaiser, J.; Hahn, H. Thick Electrodes for High Energy Lithium Ion Batteries. J. Electrochem. Soc. 2015, 162, A1196–A1201. [Google Scholar] [CrossRef]
- Bo, Z.; Cheng, X.; Yang, H.; Guo, X.; Yan, J.; Cen, K.; Han, Z.; Dai, L. Ultrathick MoS2 Films with Exceptionally High Volumetric Capacitance. Adv. Energy Mater. 2022, 12, 2103394. [Google Scholar] [CrossRef]
- Bo, Z.; Yi, K.; Yang, H.; Guo, X.; Huang, Z.; Zheng, Z.; Yan, J.; Cen, K.; Ostrikov, K. More from Less but Precise: Industry-Relevant Pseudocapacitance by Atomically-Precise Mass-Loading MnO2 within Multifunctional MXene Aerogel. J. Power Sources 2021, 492, 229639. [Google Scholar] [CrossRef]
- Zheng, H.; Li, J.; Song, X.; Liu, G.; Battaglia, V.S. A Comprehensive Understanding of Electrode Thickness Effects on the Electrochemical Performances of Li-Ion Battery Cathodes. Electrochim. Acta 2012, 71, 258–265. [Google Scholar] [CrossRef]
- Zhao, R.; Liu, J.; Gu, J. The Effects of Electrode Thickness on the Electrochemical and Thermal Characteristics of Lithium Ion Battery. Appl. Energy 2015, 139, 220–229. [Google Scholar] [CrossRef]
- Bisquert, J. Influence of the boundaries in the impedance of porous film electrodes. Phys. Chem. Chem. Phys. 2000, 2, 4185–4192. [Google Scholar] [CrossRef]
- Umeda, M.; Dokko, K.; Fujita, Y.; Mohamedi, M.; Uchida, I.; Selman, J.R. Electrochemical Impedance Study of Li-Ion Insertion into Mesocarbon Microbead Single Particle Electrode: Part I. Graphitized Carbon. Electrochim. Acta 2001, 47, 885–890. [Google Scholar] [CrossRef]
- Levi, M.D.; Levi, E.A.; Aurbach, D. The Mechanism of Lithium Intercalation in Graphite Film Electrodes in Aprotic Media. Part 2. Potentiostatic Intermittent Titration and in Situ XRD Studies of the Solid-State Ionic Diffusion. J. Electroanal. Chem. 1997, 421, 89–97. [Google Scholar] [CrossRef]
- Levi, M.D.; Aurbach, D. The Mechanism of Lithium Intercalation in Graphite Film Electrodes in Aprotic Media. Part 1. High Resolution Slow Scan Rate Cyclic Voltammetric Studies and Modeling. J. Electroanal. Chem. 1997, 421, 79–88. [Google Scholar] [CrossRef]
- Zhu, P.; Slater, P.R.; Kendrick, E. Insights into Architecture, Design and Manufacture of Electrodes for Lithium-Ion Batteries. Mater. Des. 2022, 223, 111208. [Google Scholar] [CrossRef]
- Ogihara, N.; Itou, Y.; Sasaki, T.; Takeuchi, Y. Impedance Spectroscopy Characterization of Porous Electrodes under Different Electrode Thickness Using a Symmetric Cell for High-Performance Lithium-Ion Batteries. J. Phys. Chem. C 2015, 119, 4612–4619. [Google Scholar] [CrossRef]
- Raić, M.; Mikac, L.; Gotić, M.; Škrabić, M.; Baran, N.; Ivanda, M. Ag Decorated Porous Si Structure as Potential High-Capacity Anode Material for Li-Ion Cells. J. Electroanal. Chem. 2022, 922, 116743. [Google Scholar] [CrossRef]
- Aurbach, D.; Zaban, A. Impedance Spectroscopy of Lithium Electrodes. Part 1. General Behavior in Propylene Carbonate Solutions and the Correlation to Surface Chemistry and Cycling Efficiency. J. Electroanal. Chem. 1993, 348, 155–179. [Google Scholar] [CrossRef]
- Bordes, A.; Eom, K.S.; Fuller, T.F. The Effect of Fluoroethylene Carbonate Additive Content on the Formation of the Solid-Electrolyte Interphase and Capacity Fade of Li-Ion Full-Cell Employing Nano Si-Graphene Composite Anodes. J. Power Sources 2014, 257, 163–169. [Google Scholar] [CrossRef]
- Xu, C.; Lindgren, F.; Philippe, B.; Gorgoi, M.; Björefors, F.; Edström, K.; Gustafsson, T. Improved Performance of the Silicon Anode for Li-Ion Batteries: Understanding the Surface Modification Mechanism of Fluoroethylene Carbonate as an Effective Electrolyte Additive. Chem. Mater. 2015, 27, 2591–2599. [Google Scholar] [CrossRef]
- Etacheri, V.; Haik, O.; Goffer, Y.; Roberts, G.A.; Stefan, I.C.; Fasching, R.; Aurbach, D. Effect of Fluoroethylene Carbonate (FEC) on the Performance and Surface Chemistry of Si-Nanowire Li-Ion Battery Anodes. Langmuir 2012, 28, 965–976. [Google Scholar] [CrossRef] [PubMed]
- Moškon, J.; Talian, S.D.; Dominko, R.; Gaberšček, M. Advances in Understanding Li Battery Mechanisms Using Impedance Spectroscopy. J. Electrochem. Sci. Eng. 2020, 10, 79–93. [Google Scholar] [CrossRef]
- Raccichini, R.; Amores, M.; Hinds, G. Critical Review of the Use of Reference Electrodes in Li-Ion Batteries: A Diagnostic Perspective. Batteries 2019, 5, 12. [Google Scholar] [CrossRef]
- Meddings, N.; Heinrich, M.; Overney, F.; Lee, J.S.; Ruiz, V.; Napolitano, E.; Seitz, S.; Hinds, G.; Raccichini, R.; Gaberšček, M.; et al. Application of Electrochemical Impedance Spectroscopy to Commercial Li-Ion Cells: A Review. J. Power Sources 2020, 480, 228742. [Google Scholar] [CrossRef]
- Ko, Y.; Hwang, C.; Song, H.K. Investigation on Silicon Alloying Kinetics during Lithiation by Galvanostatic Impedance Spectroscopy. J. Power Sources 2016, 315, 145–151. [Google Scholar] [CrossRef]
- Ji, X.; Nazar, L.F. Advances in Li-S Batteries. J. Mater. Chem. 2010, 20, 9821–9826. [Google Scholar] [CrossRef]
- Zhou, X.; Li, P.; Tang, Z.; Liu, J.; Zhang, S.; Zhou, Y.; Tian, X. FEC Additive for Improved SEI Film and Electrochemical Performance of the Lithium Primary Battery. Energies 2021, 14, 7467. [Google Scholar] [CrossRef]
- Schellenberger, M.; Golnak, R.; Quevedo Garzon, W.G.; Risse, S.; Seidel, R. Accessing the Solid Electrolyte Interphase on Silicon Anodes for Lithium-Ion Batteries in-Situ through Transmission Soft X-ray Absorption Spectroscopy. Mater. Today Adv. 2022, 14, 100215. [Google Scholar] [CrossRef]
- Klink, S.; Höche, D.; La Mantia, F.; Schuhmann, W. FEM Modelling of a Coaxial Three-Electrode Test Cell for Electrochemical Impedance Spectroscopy in Lithium Ion Batteries. J. Power Sources 2013, 240, 273–280. [Google Scholar] [CrossRef]
- Hoshi, Y.; Narita, Y.; Honda, K.; Ohtaki, T.; Shitanda, I.; Itagaki, M. Optimization of Reference Electrode Position in a Three-Electrode Cell for Impedance Measurements in Lithium-Ion Rechargeable Battery by Finite Element Method. J. Power Sources 2015, 288, 168–175. [Google Scholar] [CrossRef]
- Costard, J.; Ender, M.; Weiss, M.; Ivers-Tiffée, E. Three-Electrode Setups for Lithium-Ion Batteries. J. Electrochem. Soc. 2017, 164, A80–A87. [Google Scholar] [CrossRef]
- Baker, D.R.; Verbrugge, M.W.; Hou, X.X. A Simple Formula Describing Impedance Artifacts Due to the Size and Surface Resistance of a Reference-Electrode Wire in a Thin-Film Cell. J. Electrochem. Soc. 2017, 164, A407–A417. [Google Scholar] [CrossRef]
- Thevenin, J.G.; Muller, R.H. Impedance of Lithium Electrodes in a Propylene Carbonate Electrolyte. J. Electrochem. Soc. 1987, 134, 273–280. [Google Scholar] [CrossRef]
- Zaban, A.; Zinigrad, E.; Aurbach, D. Impedance Spectroscopy of Li Electrodes. 4. A General Simple Model of the Li-Solution Interphase in Polar Aprotic Systems. J. Phys. Chem. 1996, 100, 3089–3101. [Google Scholar] [CrossRef]


Disclaimer/Publisher’s Note: The statements, opinions and data contained in all publications are solely those of the individual author(s) and contributor(s) and not of MDPI and/or the editor(s). MDPI and/or the editor(s) disclaim responsibility for any injury to people or property resulting from any ideas, methods, instructions or products referred to in the content. |
© 2023 by the authors. Licensee MDPI, Basel, Switzerland. This article is an open access article distributed under the terms and conditions of the Creative Commons Attribution (CC BY) license (https://creativecommons.org/licenses/by/4.0/).
Share and Cite
Raić, M.; Kvastek, K.; Mikac, L.; Baran, N.; Ivanda, M. The Effects of Silicon Anode Thickness on the Electrochemical Performance of Li-Ion Batteries. Batteries 2023, 9, 173. https://doi.org/10.3390/batteries9030173
Raić M, Kvastek K, Mikac L, Baran N, Ivanda M. The Effects of Silicon Anode Thickness on the Electrochemical Performance of Li-Ion Batteries. Batteries. 2023; 9(3):173. https://doi.org/10.3390/batteries9030173
Chicago/Turabian StyleRaić, Matea, Krešimir Kvastek, Lara Mikac, Nikola Baran, and Mile Ivanda. 2023. "The Effects of Silicon Anode Thickness on the Electrochemical Performance of Li-Ion Batteries" Batteries 9, no. 3: 173. https://doi.org/10.3390/batteries9030173
APA StyleRaić, M., Kvastek, K., Mikac, L., Baran, N., & Ivanda, M. (2023). The Effects of Silicon Anode Thickness on the Electrochemical Performance of Li-Ion Batteries. Batteries, 9(3), 173. https://doi.org/10.3390/batteries9030173