Abstract
Multi-layer coating of electrodes with different material compositions helps unlock the full potential of high-loaded electrodes. Within this work, LiNi0.8Mn0.1Co0.1O2 (NMC811) cathodes with an areal capacity of >8.5 mA h cm−2 and tuned binder concentrations were fabricated by using an industrially relevant roll-to-roll process. Rate capability tests revealed an increase in practical specific discharge capacity independent from the C-rate for cathodes with reduced binder concentration in the top layer. At high current densities (C-rate of 1C) an improved performance of up to 27% was achieved. Additionally, at lower C-rates, binder gradients perpendicular to the current collector have beneficial effects on thick electrodes. However, surface analysis and electrochemical impedance spectroscopy revealed that without an adequate connection between the active material particles through a carbon-binder domain, charge transfer resistance limits cycling performance at high current densities.
1. Introduction
Maximizing energy densities in Li-ion batteries is a desirable goal in energy storage production that has emerged as a major challenge in the automotive sector. The increase in practical energy densities plays a central role for achieving low-price and long-range batteries for xEVs of the future. A possible solution to reaching that target is the fabrication of thick electrodes, thus keeping the ratio of active and inactive materials high within assembled cells [1,2]. However, the complexity of the manufacturing process increases with high loading electrodes and, thus, needs to be adapted. Coating parameters require thorough fine-tuning in order to suppress major defects within the coated layer. Uneven distribution of material components in the coating can affect its mechanical integrity, as well as electrochemical performance. Binder migration is a common problem, occurring during the drying process of thick electrodes, which can cause unfavorable results. A binder particle gradient with low concentrations next to the substrate foil can lead to delamination on the one hand, but also to an ion-blocking layer at the coating–separator interface. These phenomena have been documented by multiple research groups in the past [3,4,5,6,7]. Optimized drying parameters can suppress binder migration, which originates from inhomogeneous solvent evaporation. This is a consequence of loss of liquid pathways linking the upper and lower part of the coating [5]. However, especially for electrodes with high material loading, ensuring gentle drying conditions is not realistic for production throughput on an industrial scale. Multi-layer (ML) coating has proven itself as a possible technique to prevent unwanted coating defects. The improved material distribution within the coating not only has positive effects on the mechanical integrity of the electrode, but is also accompanied by higher specific discharge capacities and reduced cell impedance [8,9].
Applying the multi-layer technique to the coating process comes with additional room for customizing electrode production if one utilizes the opportunity to use different slurry formulations for each individual layer. These variations can be realized, e.g., in terms of varying particle sizes of the active material [10,11], active material blends [12], or porosity gradients [13,14,15,16]. Another possibility arising from multi-layering is tuning the material ratio in the slurry formulation. In particular for high-loading electrodes, regional material dependencies are more relevant—either for increased mechanical stability or higher ionic and electric conductivity [13,17].
Every material component of the electrode slurry has a specific purpose and their ratios and position in the mixing sequence have a large impact on the behavior of the resulting laminate after coating [18,19]. Firstly, one can distinguish between active and inactive materials—only the former contribute to the capacity of the electrode. Inactive materials can roughly be separated into those enhancing conductivity, and components which help by mechanically stabilizing both slurry and coating. Together they form a so-called carbon-binder domain (CBD) [20,21,22]. The interaction between carbon entities and binder particles and how they are embedded in the dry coating depends on their ratio and drying parameters. Carboxy methyl cellulose (CMC) is commonly used as a binder in aqueous electrode systems. It acts as a thickening agent in the slurry and stabilizes dispersion [23,24,25]. High viscosity is particularly important when depositing thick layers of coating. In general, the sole use of CMC as a binder is not recommended due to its brittleness after solvent evaporation. To enhance the flexibility of the coating, additional, mostly polymeric, binders are added to the slurry. A common combination in an aqueous system is with styrene butadien rubber (SBR) [26,27], but acrylic-based binders can also be found in literature, such as polymethyl methacrylate (PMMA) [28,29], polymethyl acrylate (PMA) [8,30], or polyacrylic acid (PAA) [31]. Among inactive materials, there are components that help to increase the electrical conductivity of the electrode. Carbon black (CB) contributes essentially to the conductivity in the electrode matrix by connecting active material particles ensuring optimal capacity utilization in all depths of the coating. For thick electrodes, this is a critical feature to fully exploit higher capacities. Due to its high porosity, CB is often partially replaced by graphite additives to ensure high volumetric capacities for high loading electrodes [32]. The carbon binder domain is necessary to guarantee good adhesion of the coating to the substrate and to provide enough cohesion between the particles, whilst simultaneously sustaining sufficient electrical conductivity on a micro- and macroscopic level.
In addition to the demand for higher energy densities, sustainable processing is a key parameter in today’s battery manufacturing. In particular for cathode fabrication, the usage of toxic solvents such as N-methyl-2-pyrrolidone (NMP) in combination with polyvinylidene fluoride (PVDF) binder is still the state of the art [19]. While for anodes, water-based systems are already commercialized, aqueous processing of cathode materials is still challenging [33]. Unfortunately, a rise in pH can occur during slurry mixing through Li-ions leaching out of the active material and forming lithium hydroxide with water [34,35,36,37]. The protective oxide layer of the aluminum current collector can be dissolved when it is exposed to solutions with a pH lower than 4, or higher than 8.6, causing detrimental corrosion to the substrate [38]. Therefore, with rising alkalinity of the slurry caused by Li+/H+ exchange, the morphology and mechanical integrity of the electrode coating can be compromised. Various different acidic additives are used to counteract this detrimental effect [39,40,41,42,43,44,45]. Particle coating can also be chosen as another method to minimize the degradation of the active material particles and to prevent extensive Li-leaching [46].
In a previous study [8], we have shown the principle of the multi-layer technique and its general benefits when applied to high loading NMC811 cathodes. The promising results suggested that further optimization of the electrodes can be achieved with this method. In this work, we extend these initial findings via the implementation of a binder gradient to (1) further reduce the amount of inactive materials compared to state-of-the-art, and (2) increased inter-particle connection and correlated higher conductivity and high current capability. Due to its high Ni content and thus high energy density, Ni-rich NMC811 cathode active material was processed in this work. The combination of PMA and CMC showed well-dispersed, agglomerate-free slurries in the past and, therefore, was chosen as binder combination. PMA has a high number of functional groups in the acrylic binder and, thus, can form hydrogen bonds with the graphite additive [30], increasing the connection between the active material and the conductive agents. The aim of this work is to show possible effects of tuning the binder content in water-based thick cathodes by making use of the multi-layer coating technique. Investigations of how ML electrodes benefit from consecutive reduction in the binder material in the top layer are described. The simplicity and flexibility of this unconventional electrode manufacturing technique and its usage in a roll-to-roll (R2R) coating process of industrial relevance are demonstrated in this work. To the authors’ knowledge, this is the first work that covers aqueous multi-layered NMC811 cathodes with integrated binder gradients and comparatively high loadings (up to 45 mg cm−2 of active material), and high discharge capacities.
2. Materials and Methods
Three decreases in binder content were implemented in the slurry formulation in Ni-rich lithium nickel manganese cobalt oxide (NMC811) multi-layer coatings of comparable thickness. To evaluate possible effects of reduced binder content in the top layer, physical properties, as well as electrochemical performance were analyzed in coin cell configuration.
2.1. Electrode Preparation
All samples have the same coating as a basis, which consists of NCM811 powder (BASF SE, Ludwigshafenam Rhein, Germany; davg = ) as active material, carbon black (C-NERGY™SUPER C65, TIMCAL Ltd., Bodio, Switzerland; davg = 37 ), artificial graphite (C-NERGY™KS6L, TIMCAL Ltd.; davg = 3.5 µm), CMC (WALOCEL™CRT 2000 PA, DuPont de Nemours Inc., Wilmington, DE, USA) and poly(methyl)acrylate (PMA)(ENEOS Cathode Binder, ENEOS Materials Belgium BV, Belgium) in a 92/3/2/1/2 wt% composition. Then, 0.16 g of 1 M phosphoric acid (HPO) (Sigma Aldrich, Saint Louis, MO, USA) was used for each gram of NMC811 to counteract the increase in pH due to leaching of Li+ ions from the active material. To remove residual water, solid components were dried for approximately 8 at 105 .
Slurries were mixed in a 250 container with a dissolver blade (DISPERMAT CV3-PLUS, VMA GETZMANN GMBH, Reichsdorf, Germany). Firstly, CB and KS6L were added to a 2 wt% CMC aqueous solution under constant stirring at slow speed, ending in 10 of stirring at 2000 rpm. To lower the pH value, HPO was added before incorporating the NMC811 powder into the slurry at 3000 rpm for 8 . PMA was added at low speed (500 rpm) to ensure the integrity of the binder molecules. To prevent corrosion at the current collector, pH values of the slurry were measured using a pH-meter (SevenCompact S210, Mettler Toledo). Three electrode slurries were prepared to show the effect of reduced PMA concentration within multi-layer coated cathodes. The amount of PMA was reduced in comparison to the bottom layer, to 50%, 25%, and 0% of the initial amount of acrylate. In the remainder of this work, these samples will be abbreviated as 50PMA, 25PMA, and 0PMA. The resulting amounts of active materials and PMA binders used are listed in Table 1. The final solid content of the slurry was determined to be around 60%, slightly varying due to the the amount of PMA solution added to the mixture.

Table 1.
Amount of active material and PMA in the slurry formulations of all samples.
The roll-to-roll coating process was conducted via doctor blade coating method (SC 30, COATEMA Coating Machinery GmbH, Dormagen, Germany) with a gap size of 250 for the base layer. Gentle drying was ensured by the combination of three sequential drying phases at 45 , 55 , and 50 and a line speed of −1. After drying of the bottom layer, a second layer of slurry—with modified PMA content—was deposited with a wet thickness of 330 . 22 thick aluminum foil (Norsk Hydro ASA, Oslo, Norway) was used for all cathode coatings as current collector. The resulting layer thicknesses after drying for bottom and top layers are listed in Table 2. An additional 12 drying step at 80 under vacuum was performed to remove residual solvent. The porosity of the as-coated multi-layer electrodes was calculated on the basis of the physical densities of the individual materials and the coating itself. The calculations were conducted in analogy to a previous study [8]. All electrode types were compacted at room temperature to a porosity of 40% with a hot roller press (MSK-HRP-1A, MTI Corporation, Richmond, CA, USA) and a final thickness of ∼200 .

Table 2.
Electrode parameters after coating, drying, and compacting.
Graphite anodes were fabricated as counter electrodes to enable investigations on a full cell level. The anode coatings consist of high energy density graphite (HED graphite 918-A2, Targray Technology International Inc, Kirkland, QC, Canada.; davg = ), carbon black (C-NERGY™SUPER C65, TIMCAL Ltd.), and polyvinylidene difluoride (PVDF) (Solef®PVDF, Solvay SA, Brussels, Belgium) in a 90/4/6 wt% composition. Preparation of the slurry was conducted in a planetary mixer (HIVIS DISPER MIX Model 3D-2, PRIMIX Corporation, Awaji-shi, Japan). After pre-mixing the active material and the carbon black, an 8 wt% solution of PVDF dissolved in NMP was added. To reach the targeted solid content of 50%, more NMP was added. The slurry was coated onto a 11 copper foil (Carl Schlenk AG, Roth, Germany) with a gap width of 560 to reach the desired areal capacity of mA h cm−2, assuming a specific capacity of 350 −1 for the active material. Anodes were dried and compacted to a porosity of 38% before cell assembly. Graphite electrodes were produced in accordance with a standard electrode manufacturing process in order to guarantee good comparability for all electrochemical tests.
2.2. Slurry and Electrode Characteristics
Scanning electron microscopy (SEM) was used to investigate surface topologies and material distribution at electron acceleration voltages of 5 and 3 for top-view and cross-section images, respectively (SUPRA 40, Carl Zeiss AG). Samples for cross-sections were sanded with silicon carbide sandpaper and polished with diamond paste after being embedded in epoxy resin. Cross-section samples were sputtered with Au for 40 s to increase conductivity.
Chronoamperometrical tests were performed to determine the electrical resistance of the electrodes prior to the electrochemical tests. Resulting currents were measured at equidistant voltage steps in a range of 10 to 50 on a Biologic-VSP instrument. The slope of the obtained I–V curve represents the electrical conductance for each sample according to Ohm’s law.
Raman spectra of the electrodes and the individual electrode components (NMC811, CB, KS6L, PMA (Figure A1)) were recorded with a Horiba XploRA Plus, utilizing a 50× objective, a grating of 1200 gr/mm, and a 532 laser operated at 10 . Elemental mapping in an arbitrarily selected 500 × 500 µm square was conducted at 100 points, with three acquisitions per point.
2.3. Cell Assembly and Electrochemical Analysis
Discs with a diameter of and were punched out of the cathodes and anodes, respectively, for further processing into coin cells. The electrodes were dried (anodes at 120 and cathodes at 80 ) under vacuum for 12 h and transferred into a glove box (O2 < ppm, H2O < ppm (LabMaster Glove Box MB200-G, MBRAUN)) of Ar-filled atmosphere. Coin cells of 2032 dimension were assembled, containing wave springs, stainless steel spacers, and a trilayer 2500 Celgard separator. Then, 150 of LiPF6 in 3:7 EC:EMC (2 wt% VC) were used as an electrolyte. To ensure full wetting of the electrodes, a resting period of 4 was implemented before further electrochemical testing. An Arbin BT-21084 instrument was used for all cycling tests. Specific capacity of 200 −1 was assumed for the cathode active material. All cells went through a formation and preconditioning protocol of 2 cycles at 0.05C, followed by 5 cycles at 0.1C. Discharge capacities were adapted to match the 3rd cycle at 0.1C to reflect real capacities of the cells for further tests. Adjusted specific capacities are 123 −1 for both 0PMA and 25PMA, and 125 −1 for 50PMA. Subsequent rate capability tests were conducted at 4 different C-rates (0.2C, 0.5C, 1C and 0.1C) with 10 symmetric charge/discharge cycles each. These constant current constant voltage (CCCV) tests were performed within a potential range of 3 to . Additionally, the cycling behavior at 0.2C was investigated for 100 cycles.
Electrochemical impedance spectroctoscopy (EIS) was carried out in half cell configuration against Li metal to help understand transfer phenomena during the formation cycles at 3 , 100% depth of discharge (DOD). Spectra were recorded on a Biologic-VSP in a range between 500 and 500 using a voltage amplitude of 10 .
3. Results
3.1. Electrode Characterization
SEM images give insights into the morphology of the electrodes at the top region of the coating (Figure 1). At low magnification (3kx), the coatings containing PMA appear more continuous than the 0PMA sample, in which crevices between the NMC particles are visible in Figure 1a,c,e. At higher magnifications (10kx) (Figure 1b,d,f), the distinguishability between the NMC secondary particles is clearer for 0PMA than for the other samples. In Figure 1b, typical round shaped secondary NMC particles (purple) with a diameter of approximately 10 can be distinguished from the smaller CB particles (yellow) and the flake-like KS6L graphite (green). The difference between 25PMA and 50PMA samples is less pronounced compared to the sample without PMA in the top layer. Cross-section images taken via digital microscope are shown in Figure A3. 0PMA (Figure A3c) shows clear differentiation between the bottom and top layer. Similarly, the two layers are distinguishable for 0PMA and 50PMA in the SEM images (Figure A3b,f). 25PMA shows no definite interface between the layers (Figure A3d) in the investigated electrode section. While pores and cavities are visible in the bottom layers of 0PMA and 25PMA (Figure A3b,d), for 50PMA only few pores can be detected (Figure A3f). It must be pointed out that by nature, the investigated sections of SEM images are comparably small and further interpretation should be taking carefully.
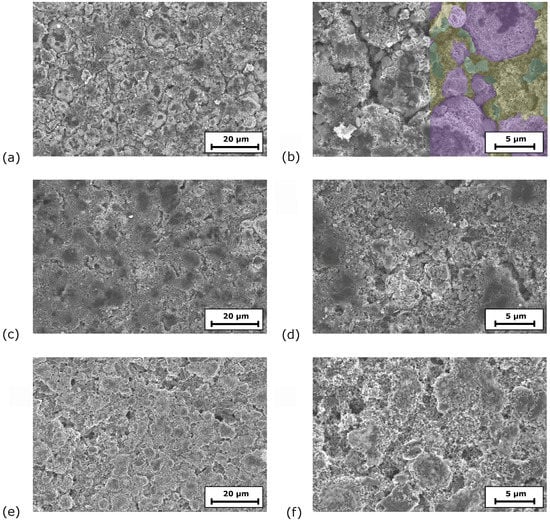
Figure 1.
SEM images of (a,b) 0PMA (NMC811 particles in purple, KS6L graphite in green and CB in yellow; larger image shown in Figure A2), (c,d) 25PMA and (e,f) 50PMA at two different magnifications each.
Omitting PMA in the top-layer causes an increase in electrical resistance. The investigation of the electrical resistance leads to values of , , and for 0PMA, 25PMA, and 50PMA, respectively, which were calculated by analyzing the slopes of the I–V curves in Figure A4.
Raman spectroscopy was performed to verify the differences in material distribution, visible in the SEM images. Figure 2a shows the median of all recorded spectra after background correction. The peak intensity at 522 −1 is assigned to NMC811 [47,48] and is approximately 50% higher for 0PMA than for the other two electrodes. After normalizing the spectra (Figure 2b), two particular regions in a range of 900–1300 −1 and 1500–1700 −1 show clear features displayed in Figure 2c and Figure 2d, respectively.
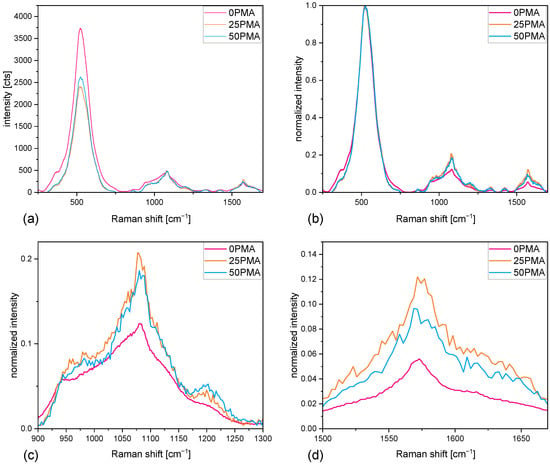
Figure 2.
(a) Raman spectra comparison of measured intensities, (b) normalized Raman spectra, (c) zoomed-in section between 900 and 1300 −1, (d) zoomed-in section between 1500 and 1700 −1.
The peaks at 1570 −1 correspond to the G-band peak of graphite [49,50]. The absence of a pronounced peak at 1345 −1 (graphite D-band) [49,50] indicates a higher concentration of the graphite additive KS6L in comparison to carbon black, where both D- and G-band peaks have similar intensities (Figure A1b,c).
The peak at 1070 −1 originates from the LiOH formed during the slurry mixing process [51]. The peak is partially overlapped by vibrational modes (v1 and v3) [52] arising from LiPO formed during the reaction of LiOH with HPO [53]. Increasing pH values due to the rising concentration of LiOH inside the slurry are suppressed by incorporation of phosphoric acid into the mixture. Phosphates formed on the surface of the NMC secondary particles prevent extensive Li+ leaching and, thus, an increase in pH above the corrosion limit of 8.6. PMA binder is dispersed in a 40 wt% solution of water and added during the last step of the mixing process. This increases the amount of LiOH, comparing the intensities of the 1070 cm−1 peaks in Figure 2c.
3.2. Electrochemical Cell Performance
Rate capability tests were performed at different current densities from 0.05C to 1C. The results are shown in Figure 3a. To see the improvement over a multi-layered cathode without any binder tuning, ML coatings from previous studies [8] were included in this graph. Formation cycles are not displayed. The first 5 cycles at 0.1C are marked with an asterisk to show that nominal capacities were adjusted for the following cycles. The irregularities seen at a C-rate of 0.2C for the 0PMA sample are due to power shortages of the cycling instrument and are present in all cells with assembled 0PMA electrodes. At low current densities (0.1C and 0.2C), binder reduction seems to have little impact on the specific discharge capacity—the difference stays within a range of ±5% with regard to ML. Significant improvements can be achieved at higher C-rates. At 0.5C an increase of around 10% can be obtained, with 25PMA having the highest specific discharge capacity of 156 −1. 50PMA and 25PMA benefit from a reduction in binder content at a C-rate of 1C, resulting in a 24% and 27% increase, respectively. 0PMA and ML similarly show lower values. Averaged results of specific discharge capacities are displayed in Table 3 for all samples and C-rates. The specific discharge capacities for 100 cycles at 0.2C are shown in Figure 3b. ML electrodes hold 89% of their initial specific discharge capacity after 100 cycles. In comparison, tuned cathodes performed slightly superior with 0PMA at 91% and both 25PMA and 50PMA at 93% of their original capacity values.
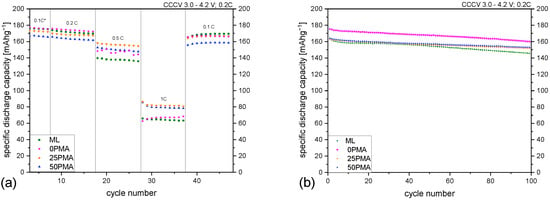
Figure 3.
(a) Rate capability test including ML samples from a previous study [8] and (b) results of 100 cycles at 0.2C. A plot including error bars is attached to the Appendix (Figure A5).

Table 3.
Specific discharge capacities [ −1] for different C-rates of all tested samples, including ML samples as reference [8]. Results are averaged over all cycles of the specific C-rate and standard deviations (SD) calculated.
Electrochemical impedance spectra were measured to investigate transport phenomena during the formation cycles. Figure 4a,b show a comparison of all Nyquist plots of 0PMA, 25PMA, and 50PMA cells at 100%DOD during the first and second cycles. First cycle impedance spectra of 25PMA and 50PMA show a similarly small semi-circle in contrast to 0PMA. An increase in impedance for both 0PMA and 50PMA is detectable after the second cycle, whereas 25PMA shows no significant change (Figure 4c–e). Voltage curves associated to the EIS measurements are displayed in Figure A6. The shapes of the voltage profiles for 25PMA and 50PMA are similar for both cycles.
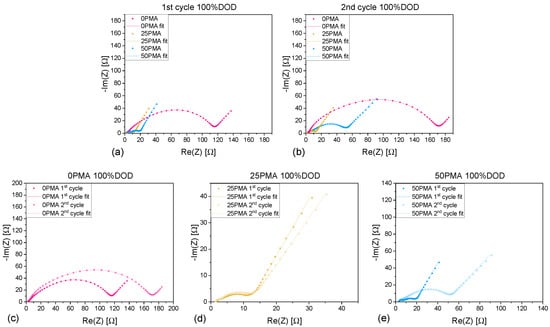
Figure 4.
Comparison of EIS spectra for different electrode types with included fit of (a) 1st cycle and (b) 2nd cycle at 100% depth of discharge. Zoomed in spectra comparing 1st and 2nd cycle of (c) 0PMA, (d) 25PMA and (e) 50PMA.
4. Discussion
Investigations of the electrodes’ morphology, as well as results from electrochemical analysis, reveal correlations between sufficient electronic conductivity of the electrode and cycling performance. Reducing the amount of insulating PMA in the top layer causes a decrease in electrical resistance. Top-view SEM images (Figure 1) indicate that without any PMA binder the slurry components can be differentiated clearly for 0PMA, in contrast to 25PM and 50PMA samples. This can be linked to the ability to form strong bonds between the carbon particles and the active material. A well-integrated carbon-binder domain contributes positively to electron transport by building up a conductive network. At the same time, excessive CBD presence may lead to a blockage of the active surface [21]. This explains, on the one hand, the poor cycling performance of 0PMA at 1C. A small amount of binder is necessary to maintain the connection between conducting carbon entities and active material throughout the coating. On the other hand, a general reduction in PMA can increase the amount of active surface accessible, explaining the increase in specific discharge capacity for 25PMA and 50PMA for higher current densities. Raman spectra indicate that a noticeable amount of LiOH was formed by reaction of leached Li+ in the aqueous slurry. This explains that even for low current densities a decrease in specific discharge capacity arises compared to the theoretically assumed value of 200 −1.
To further investigate the differences in cycling behavior of the samples’ specific charge and discharge capacities of representative cycles against voltage and at different C-rates are displayed in Figure 5. The horizontal region in all curves represents the constant voltage step of each charging cycle. Comparison of the individual contributions to the charge capacity, which is in direct proportion to the resistance of the cell, is in accordance with the higher resistance measured during chronoamperometry and EIS. As shown in Figure 6, the potentiostatic contribution to the specific charge capacity increases with current density. The ratio of galvanostatic to potentiostatic share at 1C is strongly in favor of constant voltage contributions for 0PMA. For 25PMA and 50PMA a smaller share, arising from the CV charging step is registered. Table 4 shows average values of galvanostatic and potentiostatic contributions to the specific discharge capacities for different C-rates.
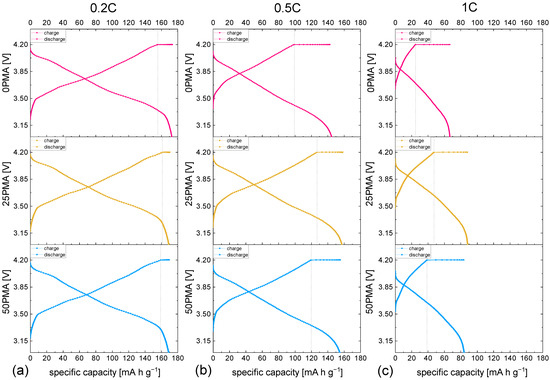
Figure 5.
Voltage profiles of all samples at different C-rates (a) C, (b) C, (c) 1C.
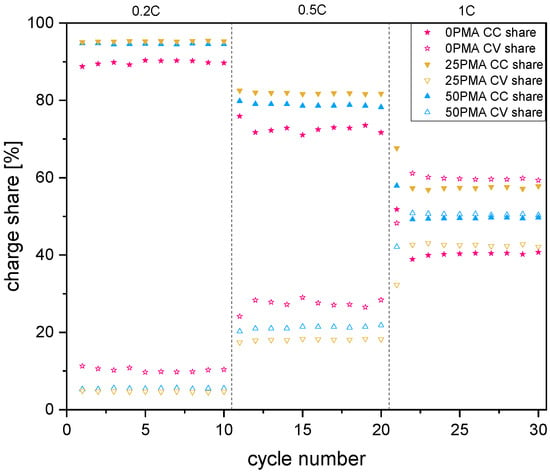
Figure 6.
Galvanostatic (CC) and potentiostatic (CV) contributions to the specific charge capacities for 0.2C, 0.5C, and 1C. A plot including error bars is attached to the Appendix A (Figure A7).

Table 4.
Average values of galvanostatic (CC) and potentiostatic (CV) contributions to the specific charge capacity for different C-rates.
Figure 7 shows differential plots dQ/dV vs. voltage for all samples. Characteristic peaks for NMC811 [54] are clearly visible in the differential plot at 0.2C (Figure 7a). The anodic peaks at ~ correspond to the phase transitions between hexagonal (H1) and monoclinic phase (M). Features at ~ and ~ indicate transitions between the phases M → H2, and H2 → H3, respectively. However, the latter does not appear within the tested voltage range for 0PMA. Lithiation of the graphite is represented by the broad peaks at ~ . Increasing the current density leads to a peak shift to higher voltages and a decreased capacity, which is represented by the area underneath the curve. This behavior is in accordance with the voltage plot in Figure 5.

Figure 7.
Differential plots for (a) 0.2C, (b) 0.5C, and (c) 1C.
To interpret EIS results, an appropriate equivalent circuit (Figure 8) was used to fit the recorded data according to Zhuang et al. [55]. L represents the inductive behavior arising from the cables connecting the cellholders with the potentiostat. Resistance contributions to RS include the electrolyte and all cell components (seperator, current collector). A constant phase element (QCEI) and a corresponding resistance RCEI are used to fit the resistance share of the cathode electrolyte interphase (CEI). Middle to high-frequency regions are related to electronic resistances of the material within the coating and are represented by Qe and Re. The double-layer capacitance Qdl and the charge transfer resistance Rct depict the charge transfer between electrode and electrolyte. Li+ diffusion within the active material can not be accurately modeled with a Warburg element at low frequencies and, thus, is represented by the constant phase element QD.

Figure 8.
Equivalent circuit model used for EIS fitting.
Contributions of the individual resistances RS, RCEI, Re, and Rct to the overall resistance can be interpreted through an appropriate curve fit. Inductance values for all samples are in the magnitude of several nano Henry (nH) and, therefore, neglectable. Bulk resistances RS show only marginal differences (Figure 9a and Table 5) due to the utilization of identical cell components besides the cathodes. They can be determined by Re(Z) intercepts at high frequencies. The cathode electrolyte interphase resistance (RCEI) values are displayed in Figure 9b and are significantly higher for 25PMA and 50PMA cells. This increase in RCEI originates from the additional phosphates and LiOH covering the NMC particles detected via Raman spectroscopy (Section 3.1), which produce a thicker protective layer. According to Källquist et al., the exact ratio of all electrode components has an impact on CEI evolution [56]. Both RS and RCEI show only minor variations after the first and second cycles, for all three cell types. The aforementioned missing inter-particle connection through a conductive CBD bridge, which was detected in SEM images (Figure 1b), shows its effect also during EIS measurements. 0PMA samples show a severe increase in electronic resistance Re compared to 25PMA and 50PMA. Charge transfer resistances Rct are depicted by semicircles in the mid to low frequency region of the Nyquist plot. Values illustrated in Figure 9d for 25PMA and 50PMA are notably lower compared to 0PMA. Both elementary processes of electron conduction across the electrode thickness and the electrochemical insertion of electrons into the active material [57] are negatively effected by the missing CBD in 0PMA. The overall high resistances for 0PMA can be considered one of the driving forces for lower specific discharge capacities at 1C. In particular for high current densities, proper electrical conductivity throughout the electrode is necessary to utilize the maximal capacity of the active material. All additional fitting parameters are displayed in Table A1.
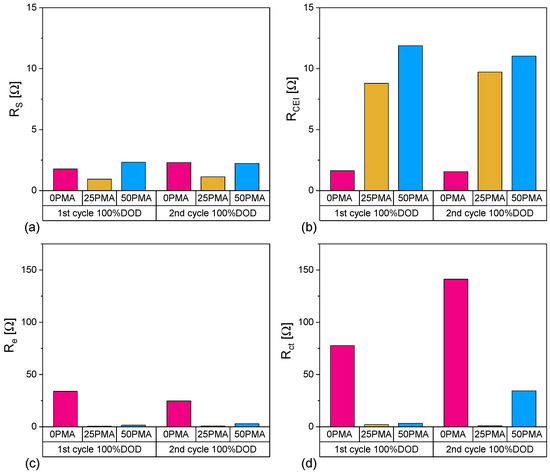
Figure 9.
Comparison of contributions (a) RS, (b) RCEI, (c) Re and (d) Rct to resistance of 0PMA, 25PMA and 50PMA cells at 100%DOD.

Table 5.
Resistance parameters determined form fitting the equivalent circuit model to the spectra.
5. Conclusions
The multi-layer coating technique was used as a tool to create binder gradients within water-based NMC811 cathodes of high loading. It was demonstrated that this method can efficiently be applied to vary binder concentrations at pilot scale. Two samples with reduced amounts of poly(methyl) acrylic binder and one completely free of PMA in the top-layer were successfully fabricated on an R2R pilot line. In contrast to our previous findings [8] regarding the concept of multi-layering for manufacturing thick, high-energy NMC811 cathodes; we herein present the binder gradient influence on the electrochemical performance—related to the amount of PMA incorporated in the upper layer. Depending on the amount of the studied binder at the top layer, the particle connection and correlated electronic conductivity to achieve high current capability is increased or reduced. An optimum was found at 25% PMA within the studied range at 1C. The binder reduction effectively increases the specific discharge capacity values compared to samples without binder gradients. Cathodes with a decreased amount of PMA outperform unmodified multi-layer electrodes by up to 28% at 1C. Summarizing the analysis of the electrode characteristics and electrochemical tests, an inter dependency between cycling performance and inter-particle conductivity was observed. Complete omission of PMA leads to an insufficient embedding of carbon particles (both CB and graphite) within the binder matrix. This missing link between the active materials has severe consequences for electronic and charge transfer resistance. These studies pave the way towards sustainably processed high current capable, highly loaded NMC811 cathode containing Li-ion batteries for future applications.
Author Contributions
Conceptualization, L.N.; methodology, L.N.; validation, L.N.; formal analysis, L.N.; investigation, L.N.; resources, K.F. and M.J.; writing—original draft preparation, L.N.; writing—review and editing, L.N., K.F., M.J. and F.W.; visualization, L.N.; supervision, K.F. and F.W.; project administration, K.F. and M.J.; funding acquisition, M.J. All authors have read and agreed to the published version of the manuscript.
Funding
This research was funded by the Austrian Federal Ministry for Climate Action, Environment, Energy, Mobility, Innovation and Technology (BMK).
Institutional Review Board Statement
Not applicable.
Informed Consent Statement
Not applicable.
Data Availability Statement
The data presented in this study are available on request from the corresponding author.
Acknowledgments
The authors would like to thank Christiane Groher and Ningxin Zhang for performing the SEM measurements reported herein. In addition we would like to acknowledge the support from Michael Höchtl during the analysis of the Raman data. Sample preparation for SEM cross-sections was carried out using facilities at the University Service Centre for Transmission Electron Microscopy, Vienna University of Technology, Austria.
Conflicts of Interest
The authors declare no conflict of interest.
Appendix A
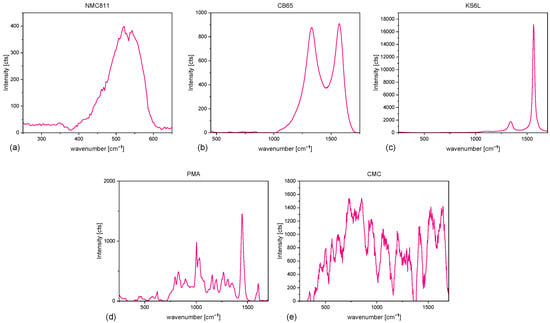
Figure A1.
Raman spectra of all materials used for slurry mixing (a) NMC811, (b) KS6L, (c) CB65, (d) PMA, (e) CMC.
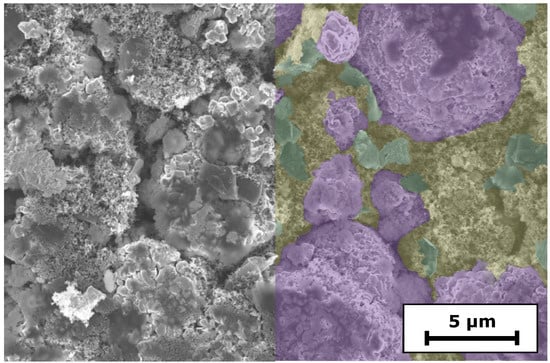
Figure A2.
Top-view SEM image of 0PMA. Species are colored in purple (NMC811), green (KS6L graphite), and yellow (CBD).
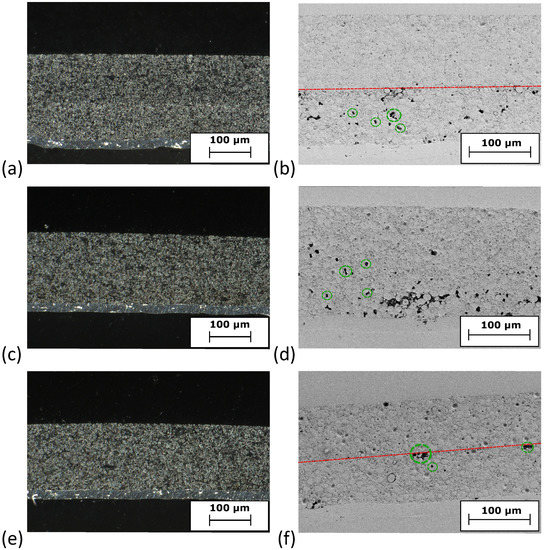
Figure A3.
Cross-section images of (a,b) 0PMA, (c,d) 25PMA and (e,f) 50PMA. The left column shows images taken via digital microscope. The right column shows SEM images. Dotted red lines indicate the interface of the two layers, while green circles highlight examples for pores.
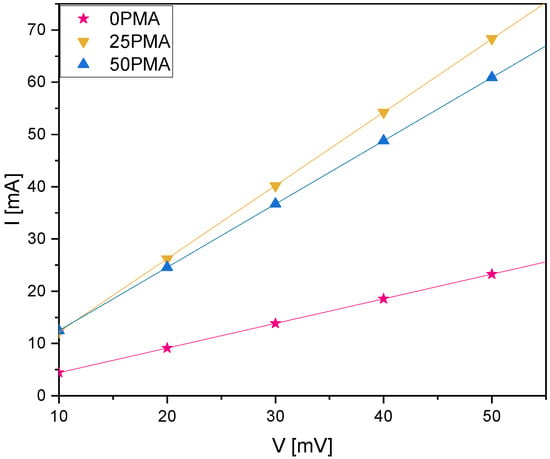
Figure A4.
I–V curves resulting from chronoamperometry measurements.
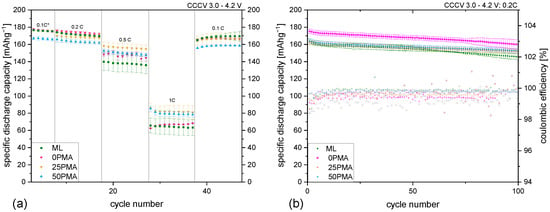
Figure A5.
(a) Rate capability test including ML samples from a previous study [8], (b) results of 100 cycles at 0.2C including coulombic efficiencies and statistical errors.
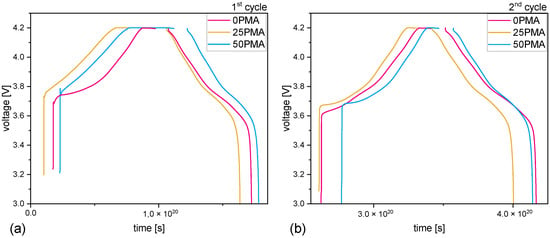
Figure A6.
Voltage curves associated to the investigated EIS cycles. (a) 1st cycle and (b) 2nd cycle.
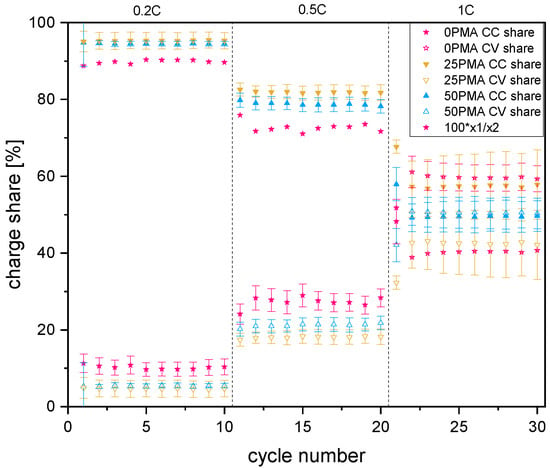
Figure A7.
Galvanostatic (CC) and potentiostatic (CV) contributions to the specific charge capacities for 0.2C, 0.5C, and 1C.

Table A1.
Parameters of constant phase elements determined from fitting the equivalent circuit model to the spectra and error value of the fit.
Table A1.
Parameters of constant phase elements determined from fitting the equivalent circuit model to the spectra and error value of the fit.
| Sample | QCEI [] | CEI | Qe [] | e | Qdl [] | dl | QD [] | D | 2 | |
|---|---|---|---|---|---|---|---|---|---|---|
| 1st cycle | 0PMA | 0.72 | 22.78 | 0.84 | 1.00 | 11.00 | 0.64 | 0.002 | ||
| 25PMA | 0.66 | 1.25 | 1.00 | 0.57 | 7.69 | 0.74 | 0.008 | |||
| 50PMA | 0.68 | 19.13 | 0.87 | 1.00 | 8.10 | 0.73 | 0.003 | |||
| 2nd cycle | 0PMA | 1.00 | 11.42 | 0.85 | 0.79 | 16.37 | 0.63 | 0.002 | ||
| 25PMA | 0.73 | 0.84 | 1.00 | 0.84 | 9.38 | 0.68 | 0.006 | |||
| 50PMA | 0.68 | 0.27 | 1.00 | 0.84 | 7.01 | 0.60 | 0.004 |
References
- Du, Z.; Wood, D.L.; Daniel, C.; Kalnaus, S.; Li, J. Understanding limiting factors in thick electrode performance as applied to high energy density Li-ion batteries. J. Appl. Electrochem. 2017, 47, 405–415. [Google Scholar] [CrossRef]
- Kuang, Y.; Chen, C.; Kirsch, D.; Hu, L. Thick electrode batteries: Principles, opportunities, and challenges. Adv. Energy Mater. 2019, 9, 1901457. [Google Scholar] [CrossRef]
- Font, F.; Protas, B.; Richardson, G.; Foster, J.M. Binder migration during drying of lithium-ion battery electrodes: Modelling and comparison to experiment. J. Power Sources 2018, 393, 177–185. [Google Scholar] [CrossRef]
- Jaiser, S.; Müller, M.; Baunach, M.; Bauer, W.; Scharfer, P.; Schabel, W. Investigation of film solidification and binder migration during drying of Li-Ion battery anodes. J. Power Sources 2016, 318, 210–219. [Google Scholar] [CrossRef]
- Baunach, M.; Jaiser, S.; Schmelzle, S.; Nirschl, H.; Scharfer, P.; Schabel, W. Delamination behavior of lithium-ion battery anodes: Influence of drying temperature during electrode processing. Dry. Technol. 2016, 34, 462–473. [Google Scholar] [CrossRef]
- Westphal, B.G.; Kwade, A. Critical electrode properties and drying conditions causing component segregation in graphitic anodes for lithium-ion batteries. J. Energy Storage 2018, 18, 509–517. [Google Scholar] [CrossRef]
- Pfleging, W. Recent progress in laser texturing of battery materials: A review of tuning electrochemical performances, related material development, and prospects for large-scale manufacturing. Int. J. Extrem. Manuf. 2020, 3, 012002. [Google Scholar] [CrossRef]
- Neidhart, L.; Fröhlich, K.; Eshraghi, N.; Cupid, D.; Winter, F.; Jahn, M. Aqueous Manufacturing of Defect-Free Thick Multi-Layer NMC811 Electrodes. Nanomaterials 2022, 12, 317. [Google Scholar] [CrossRef]
- Diehm, R.; Kumberg, J.; Dörrer, C.; Müller, M.; Bauer, W.; Scharfer, P.; Schabel, W. In Situ Investigations of Simultaneous Two-Layer Slot Die Coating of Component-Graded Anodes for Improved High-Energy Li-Ion Batteries. Energy Technol. 2020, 8, 1901251. [Google Scholar] [CrossRef]
- Wood, M.; Li, J.; Du, Z.; Daniel, C.; Dunlop, A.R.; Polzin, B.J.; Jansen, A.N.; Krumdick, G.K.; Wood, D.L., III. Impact of secondary particle size and two-layer architectures on the high-rate performance of thick electrodes in lithium-ion battery pouch cells. J. Power Sources 2021, 515, 230429. [Google Scholar] [CrossRef]
- Kalnaus, S.; Livingston, K.; Hawley, W.B.; Wang, H.; Li, J. Design and processing for high performance Li ion battery electrodes with double-layer structure. J. Energy Storage 2021, 44, 103582. [Google Scholar] [CrossRef]
- Kespe, M.; Cernak, S.; Gleiß, M.; Hammerich, S.; Nirschl, H. Three-dimensional simulation of transport processes within blended electrodes on the particle scale. Int. J. Energy Res. 2019, 43, 6762–6778. [Google Scholar] [CrossRef]
- Liu, L.; Guan, P.; Liu, C. Experimental and simulation investigations of porosity graded cathodes in mitigating battery degradation of high voltage lithium-ion batteries. J. Electrochem. Soc. 2017, 164, A3163. [Google Scholar] [CrossRef]
- Qi, Y.; Jang, T.; Ramadesigan, V.; Schwartz, D.T.; Subramanian, V.R. Is there a benefit in employing graded electrodes for lithium-ion batteries? J. Electrochem. Soc. 2017, 164, A3196. [Google Scholar] [CrossRef]
- Müller, D.; Landa-Medrano, I.; Eguia-Barrio, A.; Boyano, I.; Urdampilleta, I.; de Meatza, I.; Fill, A.; Birke, P. Electrochemical characterization of bi-layered graphite anodes combining high and low porosity in lithium-ion cells to improve cell performance. Electrochim. Acta 2021, 391, 138966. [Google Scholar] [CrossRef]
- Dai, Y.; Srinivasan, V. On graded electrode porosity as a design tool for improving the energy density of batteries. J. Electrochem. Soc. 2015, 163, A406. [Google Scholar] [CrossRef]
- Liu, D.; Chen, L.C.; Liu, T.J.; Chu, W.B.; Tiu, C. Improvement of lithium-ion battery performance by two-layered slot–die coating operation. Energy Technol. 2017, 5, 1235–1241. [Google Scholar] [CrossRef]
- Kim, K.M.; Jeon, W.S.; Chung, I.J.; Chang, S.H. Effect of mixing sequences on the electrode characteristics of lithium-ion rechargeable batteries. J. Power Sources 1999, 83, 108–113. [Google Scholar] [CrossRef]
- Wang, M.; Dang, D.; Meyer, A.; Arsenault, R.; Cheng, Y.T. Effects of the mixing sequence on making lithium ion battery electrodes. J. Electrochem. Soc. 2020, 167, 100518. [Google Scholar] [CrossRef]
- Lombardo, T.; Ngandjong, A.C.; Belhcen, A.; Franco, A.A. Carbon-Binder Migration: A Three-Dimensional Drying Model for Lithium-ion Battery Electrodes. Energy Storage Mater. 2021, 43, 337–347. [Google Scholar] [CrossRef]
- Hein, S.; Danner, T.; Westhoff, D.; Prifling, B.; Scurtu, R.; Kremer, L.; Hoffmann, A.; Hilger, A.; Osenberg, M.; Manke, I.; et al. Influence of conductive additives and binder on the impedance of lithium-ion battery electrodes: Effect of morphology. J. Electrochem. Soc. 2020, 167, 013546. [Google Scholar] [CrossRef]
- Usseglio-Viretta, F.L.; Colclasure, A.M.; Dunlop, A.R.; Trask, S.E.; Jansen, A.N.; Abraham, D.P.; Rodrigues, M.T.F.; Dufek, E.J.; Tanim, T.R.; Chinnam, P.R.; et al. Carbon-Binder Weight Loading Optimization for Improved Lithium-Ion Battery Rate Capability. J. Electrochem. Soc. 2022, 169, 070519. [Google Scholar] [CrossRef]
- Gordon, R.; Orias, R.; Willenbacher, N. Effect of carboxymethyl cellulose on the flow behavior of lithium-ion battery anode slurries and the electrical as well as mechanical properties of corresponding dry layers. J. Mater. Sci. 2020, 55, 15867–15881. [Google Scholar] [CrossRef]
- Lopez, C.G.; Richtering, W. Oscillatory rheology of carboxymethyl cellulose gels: Influence of concentration and pH. Carbohydr. Polym. 2021, 267, 118117. [Google Scholar] [CrossRef] [PubMed]
- Lee, J.H.; Paik, U.; Hackley, V.A.; Choi, Y.M. Effect of carboxymethyl cellulose on aqueous processing of natural graphite negative electrodes and their electrochemical performance for lithium batteries. J. Electrochem. Soc. 2005, 152, A1763. [Google Scholar] [CrossRef]
- Yen, J.P.; Chang, C.C.; Lin, Y.R.; Shen, S.T.; Hong, J.L. Effects of styrene-butadiene rubber/carboxymethylcellulose (SBR/CMC) and polyvinylidene difluoride (PVDF) binders on low temperature lithium ion batteries. J. Electrochem. Soc. 2013, 160, A1811. [Google Scholar] [CrossRef]
- Lingappan, N.; Kong, L.; Pecht, M. The significance of aqueous binders in lithium-ion batteries. Renew. Sustain. Energy Rev. 2021, 147, 111227. [Google Scholar] [CrossRef]
- Hu, S.; Li, Y.; Yin, J.; Wang, H.; Yuan, X.; Li, Q. Effect of different binders on electrochemical properties of LiFePO4/C cathode material in lithium ion batteries. Chem. Eng. J. 2014, 237, 497–502. [Google Scholar] [CrossRef]
- Wang, W.L.; Jin, E.M.; Gu, H.B. Impacts of different polymer binders on electrochemical properties of LiFePO4 cathode. Appl. Surf. Sci. 2013, 282, 444–449. [Google Scholar]
- Komaba, S.; Yabuuchi, N.; Ozeki, T.; Okushi, K.; Yui, H.; Konno, K.; Katayama, Y.; Miura, T. Functional binders for reversible lithium intercalation into graphite in propylene carbonate and ionic liquid media. J. Power Sources 2010, 195, 6069–6074. [Google Scholar] [CrossRef]
- Hawley, W.B.; Meyer, H.M., III; Li, J. Enabling aqueous processing for LiNi0.80Co0.15Al0.05O2 (NCA)-based lithium-ion battery cathodes using polyacrylic acid. Electrochim. Acta 2021, 380, 138203. [Google Scholar] [CrossRef]
- Spahr, M.E.; Goers, D.; Leone, A.; Stallone, S.; Grivei, E. Development of carbon conductive additives for advanced lithium ion batteries. J. Power Sources 2011, 196, 3404–3413. [Google Scholar] [CrossRef]
- Sahore, R.; Wood, D.L., III; Kukay, A.; Grady, K.M.; Li, J.; Belharouak, I. Towards understanding of cracking during drying of thick aqueous-processed LiNi0.8Mn0.1Co0.1O2 cathodes. ACS Sustain. Chem. Eng. 2020, 8, 3162–3169. [Google Scholar] [CrossRef]
- Loeffler, N.; Kopel, T.; Kim, G.T.; Passerini, S. Polyurethane binder for aqueous processing of Li-ion battery electrodes. J. Electrochem. Soc. 2015, 162, A2692. [Google Scholar] [CrossRef]
- Ibing, L.; Gallasch, T.; Friesen, A.; Niehoff, P.; Hintennach, A.; Winter, M.; Börner, M. The role of the pH value in water-based pastes on the processing and performance of Ni-rich LiNi0.5Mn0.3Co0.2O2 based positive electrodes. J. Power Sources 2020, 475, 228608. [Google Scholar] [CrossRef]
- Kim, J.; Hong, Y.; Ryu, K.S.; Kim, M.G.; Cho, J. Washing effect of a LiNi0.83Co0.15Al0.02O2 cathode in water. Electrochem. -Solid-State Lett. 2005, 9, A19. [Google Scholar] [CrossRef]
- Shkrob, I.A.; Gilbert, J.A.; Phillips, P.J.; Klie, R.; Haasch, R.T.; Bareño, J.; Abraham, D.P. Chemical weathering of layered Ni-rich oxide electrode materials: Evidence for cation exchange. J. Electrochem. Soc. 2017, 164, A1489. [Google Scholar] [CrossRef]
- Chatalov, A.Y. Effet du pH sur le comportement électrochimique des métaux et leur résistance à la corrosion. Dokl. Akad. Naouk SSSR 1952, 86, 775. [Google Scholar]
- Kazzazi, A.; Bresser, D.; Birrozzi, A.; von Zamory, J.; Hekmatfar, M.; Passerini, S. Comparative analysis of aqueous binders for high-energy li-rich NMC as a Lithium-Ion cathode and the impact of adding phosphoric acid. ACS Appl. Mater. Interfaces 2018, 10, 17214–17222. [Google Scholar] [CrossRef] [PubMed]
- Kukay, A.; Sahore, R.; Parejiya, A.; Hawley, W.B.; Li, J.; Wood, D.L., III. Aqueous Ni-rich-cathode dispersions processed with phosphoric acid for lithium-ion batteries with ultra-thick electrodes. J. Colloid Interface Sci. 2021, 581, 635–643. [Google Scholar] [CrossRef]
- Carvalho, D.V.; Loeffler, N.; Kim, G.T.; Marinaro, M.; Wohlfahrt-Mehrens, M.; Passerini, S. Study of water-based lithium titanate electrode processing: The role of pH and binder molecular structure. Polymers 2016, 8, 276. [Google Scholar] [CrossRef]
- Hamam, I.; Zhang, N.; Liu, A.; Johnson, M.; Dahn, J. Study of the reactions between Ni-rich positive electrode materials and aqueous solutions and their relation to the failure of Li-ion cells. J. Electrochem. Soc. 2020, 167, 130521. [Google Scholar] [CrossRef]
- Li, C.C.; Lee, J.T.; Tung, Y.L.; Yang, C.R. Effects of pH on the dispersion and cell performance of LiCoO2 cathodes based on the aqueous process. J. Mater. Sci. 2007, 42, 5773–5777. [Google Scholar] [CrossRef]
- Bauer, W.; Çetinel, F.A.; Müller, M.; Kaufmann, U. Effects of pH control by acid addition at the aqueous processing of cathodes for lithium ion batteries. Electrochim. Acta 2019, 317, 112–119. [Google Scholar] [CrossRef]
- Zhu, P.; Han, J.; Pfleging, W. Characterization and Laser Structuring of Aqueous Processed Li(Ni0.6Mn0.2Co0.2)O2 Thick-Film Cathodes for Lithium-Ion Batteries. Nanomaterials 2021, 11, 1840. [Google Scholar] [CrossRef]
- Li, J.; Zhong, W.; Deng, Q.; Zhang, Q.; Yang, C. Recent progress in synthesis and surface modification of nickel-rich layered oxide cathode materials for lithium-ion batteries. Int. J. Extrem. Manuf. 2022, 4, 042004. [Google Scholar] [CrossRef]
- Li, T.; Yuan, X.Z.; Zhang, L.; Song, D.; Shi, K.; Bock, C. Degradation mechanisms and mitigation strategies of nickel-rich NMC-based lithium-ion batteries. Electrochem. Energy Rev. 2020, 3, 43–80. [Google Scholar] [CrossRef]
- Julien, C.M.; Mauger, A. In situ Raman analyses of electrode materials for Li-ion batteries. AIMS Mater. Sci. 2018, 5, 650–698. [Google Scholar] [CrossRef]
- Tuinstra, F.; Koenig, J.L. Raman spectrum of graphite. J. Chem. Phys. 1970, 53, 1126–1130. [Google Scholar] [CrossRef]
- Reich, S.; Thomsen, C. Raman spectroscopy of graphite. Philos. Trans. R. Soc. London. Ser. Math. Phys. Eng. Sci. 2004, 362, 2271–2288. [Google Scholar] [CrossRef] [PubMed]
- Gorelik, V.; Bi, D.; Voinov, Y.; Vodchits, A.; Gorshunov, B.; Yurasov, N.; Yurasova, I. Raman spectra of lithium compounds. In Proceedings of the Journal of Physics: Conference Series, Moscow, Russia, 25–27 January 2017; IOP Publishing: Bristol, UK, 2017; Volume 918, p. 012035. [Google Scholar]
- Smith, R.J.; Shen, Y.; Bray, K.L. The effect of pressure on vibrational modes in Li3PO4. J. Physics Condens. Matter 2001, 14, 461. [Google Scholar] [CrossRef]
- Sahni, K.; Ashuri, M.; He, Q.; Sahore, R.; Bloom, I.D.; Liu, Y.; Kaduk, J.A.; Shaw, L.L. H3PO4 treatment to enhance the electrochemical properties of Li(Ni1/3Mn1/3Co1/3)O2 and Li(Ni0.5Mn0.3Co0.2)O2 cathodes. Electrochim. Acta 2019, 301, 8–22. [Google Scholar] [CrossRef]
- Jung, R.; Metzger, M.; Maglia, F.; Stinner, C.; Gasteiger, H.A. Oxygen release and its effect on the cycling stability of LiNixMnyCozO2 (NMC) cathode materials for Li-ion batteries. J. Electrochem. Soc. 2017, 164, A1361. [Google Scholar] [CrossRef]
- Zhuang, Q.C.; Qiu, X.Y.; Xu, S.D.; Qiang, Y.H.; Su, S. Diagnosis of electrochemical impedance spectroscopy in lithium-ion batteries. Lithium Ion Batter. Dev. 2012, 8, 189–227. [Google Scholar]
- Källquist, I.; Le Ruyet, R.; Liu, H.; Mogensen, R.; Lee, M.T.; Edström, K.; Naylor, A.J. Advances in studying interfacial reactions in rechargeable batteries by photoelectron spectroscopy. J. Mater. Chem. A 2022, 10, 19466–19505. [Google Scholar] [CrossRef]
- Gaberšček, M. Understanding Li-based battery materials via electrochemical impedance spectroscopy. Nat. Commun. 2021, 12, 1–4. [Google Scholar] [CrossRef]
Disclaimer/Publisher’s Note: The statements, opinions and data contained in all publications are solely those of the individual author(s) and contributor(s) and not of MDPI and/or the editor(s). MDPI and/or the editor(s) disclaim responsibility for any injury to people or property resulting from any ideas, methods, instructions or products referred to in the content. |
© 2023 by the authors. Licensee MDPI, Basel, Switzerland. This article is an open access article distributed under the terms and conditions of the Creative Commons Attribution (CC BY) license (https://creativecommons.org/licenses/by/4.0/).