Abstract
Actual market requirements for storage systems highlight the limits of graphite as an anode for Li-ion batteries. Lithium metal can represent a suitable alternative to graphite due to its high theoretical specific capacity (about 3860 mAh g−1) and low negative redox potential. However, several aging mechanisms, such as dendrite growth, lithium loss and the formation of an unstable SEI, decrease the performances of Li-based batteries. A suitable strategy to better understand and study these mechanisms could be the development of an electrochemical model that forecasts the aging behaviour of a lithium-metal battery. In this work, a P2D aging electrochemical model for an Li-based cell was developed. The main innovation is represented by the combination of two aspects: the substitution of graphite with metallic lithium as an anode and the implementation of SEI growth on the metallic lithium surface. The calibration of the model, based on experimental measurements and the successive validation, led to us obtaining a good accuracy between the simulated and experimental curves. This good accuracy makes the developed P2D aging model a versatile and suitable approach for further investigations on Li-based batteries considering all the aging phenomena involved.
1. Introduction
Nowadays, the use of electric vehicles (EVs) in the automotive sector is growing rapidly, and an exponential rise in EV sales can be expected [1,2,3]. On the market, several rechargeable battery technologies can be found, depending on the different chemical structures, but lithium-ion batteries (LIBs) represent the most suitable solution for the automotive sector due to their high specific power, high energy density and low mass [4,5,6]. In the last few years, a remarkable number of scientific studies and papers on LIB aspects has been published, leading to decreases in the price and increased performances [7]. As an example, one important step was the development of high-energy-density full cells through the substitution of soft and hard carbon anodes with a commercial material, graphite [8,9]. Graphite’s advantages are its low cost and dimensional stability [10], but the moderate energy density (volumetric capacity of 735 mAh cm−3 and theoretical gravimetric capacity of 372 mAh g−1) is becoming a limit, because it can hardly satisfy the current storage technological market requirements [11]. Other important issues regarding graphite anodes in LIBs are the limited rate capability and the irreversible capacity of the first cycle. The first one is correlated with the charge of the fuel cell and, so, with the possible risk of metallic lithium plating on the electrode surface [12,13]. Instead, the second one is caused by the electrolyte decomposition and the consumption of Li+ brought to the formation of a solid electrolyte interphase (SEI) [14]. The two phenomena can potentially cause a short circuit of the cell or an accelerated capacity fade [15]. Thus, the development and the implementation of new anodic materials inside LIBs are necessary [16].
Metallic lithium is one of the most interesting materials that can be used as an alternative to graphite, due to its ultrahigh theoretical specific capacity (3860 mAh g−1), low gravimetric density (0.534 g cm−3) and the most negative redox potential (−3.04 V vs. the standard hydrogen electrode) [17]. The theoretical specific capacity of metallic lithium is 10-times higher than the commercial graphite anode due to the fact that lithium-metal batteries (LMBs) are characterized by a conversion reaction with a direct Li+/Li0 deposition/dissolution process, while traditional LIBs are based on an intercalation mechanism of lithium ions (Li+) [18]. Clearly, Li metal anodes (LMAs) are still in early-stage development; therefore, their life cycle is still quite inferior compared to graphite. Interestingly, though, different LCA studies highlighted that, in addition to increasing the specific capacity of the battery cell by at least 18%, the substitution of graphite with metallic lithium actually lowered their environmental impact [19,20].
Unfortunately, LMA practical application in secondary Li metal batteries is still hampered by several problems [21]. First, the initial formation and continuous growth of Li dendrite cause severe safety issues, such as separator penetration and short circuit of the battery, that generate high current discharge, inducing heat generation and, in some cases, explosions [22]. Then, Li dendrite can break at the roots, thus disconnecting from the matrix and generating an electrically isolated Li metal, usually known as “dead Li”. This phenomenon decreases the content of active lithium at the electrode, therefore, provoking a reduction in battery-specific capacity [23]. At last, lithium-metal thermodynamic instability, caused by its high Fermi energy level, gives rise to uncontrolled reactions between the electrolyte and lithium [24]. The main effects of these reactions are the creation of SEI layers on the metallic lithium surface, the consumption of electrolyte and lithium and the growth of the internal resistance, decreasing battery life [25]. According to this statement, SEI growth study on metallic lithium surface can be considered the most important and impacting phenomenon on cell performances among the previously cited issues.
In order to solve the diverse issues regarding the application of metallic lithium as an anode, several strategies have been employed and are already being studied, such as the formation of an artificial SEI layer, the inclusion of additives in commercial liquid electrolyte and, last but not least, the substitution of liquid electrolytes with alternative electrolytes as solid-state electrolytes or gel–polymer electrolytes [26].
Therefore, considering the complexity in physical and electrochemical processes, and the degradation phenomena occurring inside lithium-metal batteries, modelling is a powerful tool for studying this battery’s next generation and helping provide a better understanding of these mechanisms and improvements in the protection strategies of metallic lithium [27]. According to the spatial scale, several multiscale models have been developed and suggested to mathematically explain the Li-ion battery reaction mechanisms [28]. At an atomic level, material properties are investigated through density functional theory (DFT) and molecular dynamics (MD), while phase-field (PF) modelling is adopted at a mesoscale level to analyse physical and chemical reactions inside the microstructure. A macroscale model can be used to optimize the electrode and battery electrochemical behaviour by studying the interactions between the electrochemical parameters and the battery performances. Inside this last class of models, three typologies can be commonly identified: empirical, equivalent circuit and electrochemical [29]. Between these, electrochemical models represent an advanced and sophisticated tool for reaction mechanistic analysis, battery design optimization and battery state estimation [30]. The most common electrochemical model is the pseudo-two-dimensional (P2D) model based on the porous electrode theory developed by Newman, Fuller and Doyle [31]. The main peculiarity in this model is its elevated accuracy due to the precise representation of the microstructure of the electrodes and the properties of the electrolyte [32,33]. In particular, the P2D model represents the microstructure considering spherical particles with the same radius and only solves one-dimensional diffusion-based transport in the particle. Several electrochemical models have already implemented the use of lithium metal as an anode, also for different battery chemistries, such as Lithium–air [34,35] and Lithium–sulphur [36,37], while other models describe the mechanisms of SEI formation on its surface [38,39,40]. However, to the best of our knowledge, the combination of metallic lithium as an anode, and the description of the SEI growth on its surface has not been described by any P2D electrochemical model yet.
Therefore, in this work, through the commercial software COMSOL Multiphysics, a P2D aging electrochemical model, based on porous electrode theory, was developed for a cell containing metallic lithium as an anode, with the purpose to analyse and forecast its aging behaviour. Lithium iron phosphate (LiFePO4, shortened to LFP) was adopted as a cathode for its high stability and high theoretical specific capacity [41]. As this is a first step in the study of aging mechanisms associated with LMA, among the different processes described above, SEI growth is considered as the most impactful and, therefore, was implemented, alone for now, in the developed model. Calibration of the electrochemical model was performed, through experimental characterization, in order to obtain the electrochemical parameters exactly corresponding to the model. Afterward, the electrochemical model was validated through a comparison between the simulated and the experimental charge–discharge curves at several C rates. After the electrochemical model validation, which confirmed the robustness of the chosen approach, the aging model was calibrated and validated as well, in order to estimate the capacity loss of the Li-LFP cell, due to the SEI growth upon long cycling. The optimal comparison between the simulated capacity loss and the experimental one proves the innovation in the aging model that takes into account both metallic lithium as an anode and the SEI growth on its surface, leading to a better understanding of the electrochemical behaviour and the aging mechanisms of this lithium-metal-based battery. Another important advantage of this modelling approach is its low computational cost, allowing experimental research to be sped up by avoiding long measurements. Indeed, three to four days of experimental testing (50 cycles at 1C) can be simulated in less than one hour.
2. Modeling
2.1. P2D Model
A pseudo-two-dimensional (P2D) approach was applied in the developed electrochemical model in order to describe and forecast the electrochemical behaviour of an LMA battery. As the acronym suggests, P2D is characterized by two dimensions: one is the cell thickness, while the other is the spherical particle dimension of the active material [42]. The P2D model was widely employed in Li-ion battery studies for its good accuracy and good agreement with experimental data and its low computational cost [43].
Along with cell thickness, the electrochemical system was modelled considering four sub-domains, representing, respectively, metallic lithium, separator, LFP and aluminium as a current collector. The main difference with respect to the classical commercial anode, graphite, is that lithium metal is considered as an infinite reservoir of lithium supply, so it has no dimension, and it is considered a boundary [44].
The concentrated solution theory was used to describe the concentration levels in the battery, since the electrolyte is composed of a binary lithium salt and a single-phase polymeric solvent. Therefore, in the electrolyte–separator domain, the model solves the current conservation equation (Equation (1)) and the saline mass conservation equation (Equation (2)), in which is the ionic current density flowing into the electrolyte, represents the electrolyte conductivity, is the electrolyte potential, is the dependence activity, is the transference number, is the volumetric concentration of Lithium ions in the electrolyte, is the volumetric fraction of the electrolyte and is the salt diffusivity in the electrolyte. T, F and R represent the temperature, Faraday’s constant and the universal gas constant, respectively.
The current collector is modelled as a simple non-reacting electrode in which electronic conduction is the only occurring phenomenon, described by Ohm’s law (Equation (3)); represents the electrical conductivity of the current collector, is the electrode potential and is the local current density that flows inside.
Along the radial dimension of the active material particles, the model only solves the Fick law for the diffusion of lithium ion in the active material (Equation (4)), using boundary conditions described by Equation (5).
represents the specific electrode surface and can be computed according to Equation (6), where is the geometric factor (usually = 3 for spherical particles), is the active volume fraction and is the radius particle.
Because of the presence of the electrolyte and the greater transport distance due to the tortuosity of the pores, a reduced volumetric fraction of conductive material in the electrode should be considered. According to this, it is possible to use the corrected values, usually known as “effective”, for diffusivity and electrical conductivity, for porous electrode materials. Here, the Bruggeman relationship is considered, in which tortuosity is a function of the material porosity. The effective diffusion coefficient , the effective conductivity of the liquid phase and the effective conductivity of the solid phase can be computed through Equation (7), in which and represent the porosity and the tortuosity of the material, respectively.
For the cathode, the lithium ion insertion reaction into the electrode’s active material is described using Equation (8). Here, represents the total current density transferred within the electrode due to a number of reactions (NR) taking place within, while represents the current density generated by the generic ith reaction in the electrode.
The chemical kinetics of the lithium-ion intercalation within the active material of the electrode are described by the Butler–Volmer equation (Equation (9)), which is usually used for the standard description of the reaction kinetics in electrodes.
The electrode of lithium is assumed as ideal, so a Butler–Volmer equation can be considered, as reported in Equation (10) [44,45]:
The over-potential due to the electrochemical reaction can be expressed by Equation (11), in which OCV denotes the cell open-circuit potential that is a function of the State of Charge (SoC).
The boundary conditions used in the electrochemical model are listed below:
- (1)
- The boundary condition “ground”, corresponding to Equation (12), is applied to define a reference potential within the model. In the analysed case, this boundary condition is directly applied at the negative electrode of the cell, the metallic lithium, in order to define the cell voltage according to Equation (13).
- (2)
- The boundary condition “charge–discharge cycle” is applied at the extreme of the positive current collector to model the galvanostatic cycling behaviour of the cell. For the charge, a positive current and the maximum voltage (4 V) were employed, while for the discharge, a negative current and the minimum voltage (2 V) were applied.
2.2. Aging Implementation
For the implementation of SEI growth on metallic lithium, an approach similar to the one adopted by Kindermann et al. was used [46]. They distinguish between the transport of two species through the SEI, which are Li-ions and electrons, and suppose that the SEI is characterized by maximum conductivity for Li-ions and very poor conductivity for electrons. Following their approach, SEI is formed directly on the metallic lithium surface, and Equation (11) should be modified in Equation (14), taking into account another ohmic drop () for the SEI-forming side reaction.
is SEI formation equilibrium potential and is equal to 0.4 V [47,48]. can be computed with Equation (15) considering the SEI’s initial thickness , the thickness increase and the respective conductivity.
is assumed to be equal to 0 nm because the experimental cells are fresh cells, so they were not subjected to any formation cycles, while was equal to 10−8 S m−1 because of the insulative behaviour.
Butler–Volmer kinetics with an anodic charge transfer coefficient and a cathodic charge transfer coefficient were implemented because of the introduced overpotential . Equation (16) is similar to the cathodic Tafel expression, but it also takes into account dissolution reactions during cycling.
The index in symbolizes Lithium fluoride (LiF) and Lithium carbonate (Li2CO3) because they are the two most relevant products inside SEI. The overall increase in SEI thickness can be computed with the capacities , the molar masses and densities by Equation (17):
For the exchange current density , the same Arrhenius behaviour hypothesized by Kindermann et al. was used, as reported in Equation (18):
3. Experimental Section
Validation of the model can be realized only through a comparison, at different C rates, between the simulated charge–discharge curves and the experimental ones. Therefore, Li-LFP batteries need to be assembled with the same configuration used in the electrochemical model described above: metallic lithium as an anode, polyolefin as a separator soaked with a commercial liquid electrolyte and LFP as a cathode. Before proceeding with the final validation of the model, a calibration of the same is necessary. This implies that some electrochemical parameters of the model should be obtained through experimental measurements in order to make simulation as realistic as possible. In this section, electrode preparation, coin cell assembly and cycling protocols used for the experiment and calibration will be accurately described.
3.1. Electrode Preparation and Coin Cell Assembly
The LFP cathode was prepared by solvent casting a homogeneous slurry of LiFePO4 (purchased from Aleees), Carbon black C-NERGY C65 (Imeyrs) and polyvinylidene fluoride (PVdF, HSV900, Arkema) in NMP on an Al foil, with a weight ratio of 70:20:10. After, the electrode was dried in an oven at 50 °C for 1 h and cut into 15 mm-diameter discs, obtaining an active mass loading of 1.7 mg cm−2. In the end, it was dried for 4 h at 120 °C (Büchi Glass Oven B-585, Flawil, Switzerland) under vacuum.
Coin cells (2032) were assembled inside an Argon-filled dry glove box (MBraum Labstar, Garching—Germany; H2O and O2 content lower than 1 ppm). Lithium foil (Chemetall Foote Corporation) was cut into 16 mm-diameter discs while Celgard2500 of 20 mm diameter was used as separator soaked with a 1.0 M solution of LiPF6 in EC: DEC 1v:1v.
3.2. Electrochemical Characterization
All the galvanostatic cycling tests were performed using an LBT-21084 multi-channel Arbin Instrument: half-cell batteries were cycled in a potential window of 2–4 V vs. Li/Li+. These voltages are generally used for LFP, which is characterized by a high theoretical specific capacity and a smooth operating voltage (3.45 vs. Li/Li+) [49]. Considering only the LFP active material of the electrode, the theoretical specific capacity (~170 mAh g−1) was used to compute the current for the galvanostatic cycling at different C rates.
Electrochemical impedance spectroscopy (EIS) was performed in potentiostatic mode (PEIS), with a voltage amplitude of 10 mV and a frequency range of 10 mHz to 100 kHz through the use of Biologic VMP3. PEIS was carried out at different temperatures, in a climatic chamber EUCAR 4 Binder, in order to determine electrochemical parameters characterizing the electrochemical model developed.
All the experiments, except for the exchange current density test that was assessed in a climatic chamber, were performed at room temperature in an environment conditioned at 25 °C.
3.3. Morphological Analysis
Morphological analysis was performed with the purpose of determining the average radius particle of the cathodic active material. This technique was achieved through FESEM (Field Emission Scanning Electron Microscopy) using a Zeiss SUPRA 40 with Gemini column and Schottky field emission source (Tungsten at 1800 K). Acquisitions were carried out by setting an acceleration potential (EHT) of 5 kV and a working distance (WD) between 2.3 and 3.1 mm.
4. Results and Discussion
4.1. Experimental Results
4.1.1. Morphological Analysis
FESEM analysis was performed in order to evaluate the active material distribution in the electrode and to assess the average diameter of LFP particles and agglomerates. FESEM micrographs of electrodes are reported at different magnifications in Figure 1.
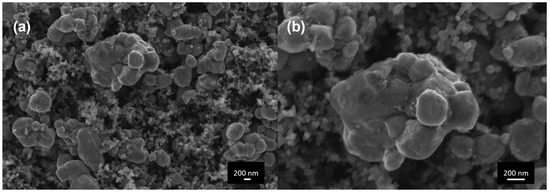
Figure 1.
FESEM micrographs of the cathode electrodes (a) 50 kX and (b) 100 kX.
In Figure 1a, at a magnification of 50 kX, several agglomerates of LFP can be identified, particularly the one positioned in the top centre of the figure; the much smaller spherical nanoparticles are typical of Carbon C65 morphology. In Figure 1b, a magnification of 100 kX was used in order to measure the average particle radius of the agglomerate of the previously identified LFP. An average particle radius of 1 μm, comparable with literature data [50], was determined and used inside the electrochemical model.
4.1.2. Equilibrium Potential Curve
A second important electrochemical parameter that characterizes the electrochemical model is the equilibrium potential curve of the cathode (OCV, open-circuit voltage). The curve should represent voltage as a function of State of Charge (SoC), covering a potential window of 2–4 V vs. Li/Li+ [42]. To obtain true thermodynamic OCV, galvanostatic cycling at a slow C rate (C/25), also known as pseudo-OCV, was performed in half-cell configuration [51,52].
Since a polarization phenomenon was observed between charge and discharge curve during the measurements, and because of the importance of the parameter described, both charge and discharge OCV curves were implemented inside the developed electrochemical model. Looking at Figure 2a,b, respectively, for charge and discharge, the polarization phenomenon, as mentioned, can be clearly identified. Considering, for both curves, an SoC equal to 50%, a non-negligible difference of 50 mV between the charge and the discharge equilibrium voltage was calculated. In fact, considering only a charge or discharge OCV curve inside the electrochemical model for charge–discharge cycles will result in a percentage error of around 1.45% and 1.47% in the plateau region for charge (3.45 vs. Li/Li+) and discharge (3.40 vs. Li/Li+), respectively.
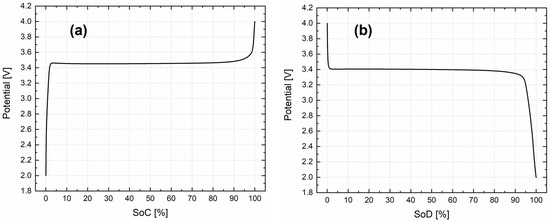
Figure 2.
Open-circuit voltage of LFP, (a) charge and (b) discharge.
4.1.3. Exchange Current Density
This parameter represents the electron transfer rate when ions flow between the electrolyte and the electrode and it corresponds to the current measured at zero overpotential in the absence of net charge transfer [51]. This value can be computed using the charge transfer resistance measured through the EIS. In fact, using the PEIS technique, a small voltage oscillation is applied, and Equation (9) can be linearized, as reported in Equation (19), where represents the reference exchange current density:
Considering that represents the electrode–electrolyte interface surface area and the charge transfer, the over-potential can be defined according to Equation (20):
Substituting (19) in (20), the can be computed, as in Equation (21):
For this purpose, half cells were assembled to estimate the reference exchange current density [53,54]. According to the work conducted by Chen et al. [51], PEIS should be performed at a fixed SoC, equal to 50%, and at several increasing temperatures. Therefore, the cell assembled was subjected to three formation cycles at C/10 for two purposes: stabilize the SEI formation and then calculate the charge capacity of the 3rd cycle to determine the useful capacity to bring to the cell at the required State of Charge. Once 50% SoC was achieved, EIS was performed at different temperatures, from 20 °C to 60 °C, with an increase step of 10 °C between each measurement. Upon reaching this temperature, a relaxation time of 1 h was applied to stabilize the cell OCV before carrying out EIS.
In the end, using ZView software, an equivalent circuit model, shown in Figure 3a, was employed to fit the EIS data and evaluate the charge transfer resistance at different temperatures. R1 is the series resistance, R2 and CPE1 are linked to the charge transfer resistance of the interface, while R3 and CPE2 are related to the charge transfer of active materials and W1 was used to fit the low-frequency tail. W1 is known as Generalized Finite Warburg (GFW) element. This circuit element is an extension of another more common element, the Finite-Length Warburg (FLW), which is the solution to the one-dimensional diffusion equation of a particle. R3 was identified as the charge transfer resistance ( and its value decreases as temperature increases, as shown in Figure 3b. The fitted spectra at each temperature are reported in Figure S1.
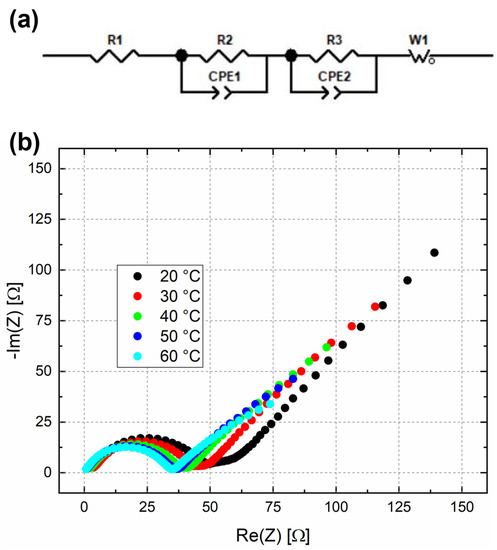
Figure 3.
(a) The equivalent circuit model used to fit the EIS data; (b) impedance spectra at different temperatures for half cell with LFP cathode.
The calculation of charge transfer resistance and reference exchange current density at 50% SoC, and at different temperatures, is reported in Table 1. The results are in line with those reported by Chen et al. [51]. Since the temperature inside the electrochemical model is equal to 20 °C, the reference exchange current density for the cathode was made equal to 2.99 A m−2.

Table 1.
Charge transfer resistance and reference exchange current density for LFP at different temperatures.
4.2. Model Calibration and Validation
4.2.1. Electrochemical Model Calibration and Validation
Electrochemical model calibration was performed in order to obtain a good fitting between the simulated and the experimental charge–discharge curves at a fixed C rate, chosen to be equal to C/20. This was achieved, as described in the previous paragraphs, through the experimental determination of some of the cathode input parameters, such as average radius particle, open-circuit voltage and exchange reference current density. For the anode, calibration was not performed due to the condition applied to metallic lithium, which is considered to be a boundary inside the developed electrochemical model. In Table 2, all the principal electrochemical parameters to develop the calibration model are reported.
Table 2.
Electrochemical parameters used for the simulation.
Successively, electrochemical model validation was performed to prove the consistency and robustness of the calibration of the P2D model at different C rates from the one chosen for the calibration (C/20). Therefore, the electrochemical model validation was achieved comparing charge–discharge curves of the first three experimental cycles with the simulated ones. Since four different C rates were considered for the validation (C/10, C/5, C/2, 1C), the charge–discharge current in the model was coherently modified for each C rate. Figure 4 shows a comparison at (a) C/10, (b) C/5, (c) C/2 and (d) 1C. It can be stated that all the simulated curves fit the experimental results well, both for the voltage behaviour and for the required experimental charge–discharge times. The errors between the experimentally obtained capacities and the ones obtained from the model were calculated and are reported in Table S1. All values are below 2.5%, confirming the strength of the model.
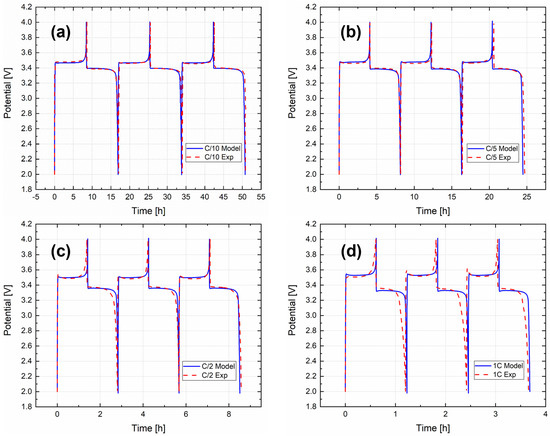
Figure 4.
Validation of the P2D electrochemical model for the 4 different C rates, (a) C/10, (b) C/5, (c) C/2 and (d) 1C.
The smoothing plateau at around 3.45 V vs. Li+/Li can be identified for all four different C rates. Of course, the polarization phenomenon between charge and discharge is present and increases coherently with the increasing input charge–discharge current because of the increasing C rate. It is possible to see, in Figure 4d only, at 1C, a small discrepancy in the discharge phase between the simulated and experimental curves; this could be due to the behaviour of the experimental curve, probably caused by the increasing current.
4.2.2. Aging Model Calibration and Validation
Once the electrochemical model was validated, the aging model calibration was performed. In order to see the effect of the implementation of the SEI growth on the surface of metallic lithium, it was necessary to simulate the experimental loss in discharge capacity for a high number of charge–discharge cycles (in this case, fixed equal to 50). The parameters in Equation (18) were modified in order to improve the fitting between the simulated discharge capacities and the experimental ones, at a fixed calibration C rate, equal to C/2. After the aging calibration, the P2D aging model was validated at 1C. Charge–discharge currents were coherently changed due to the different C rates, and the capacity loss for 50 cycles was simulated. In Figure 5, a comparison between the simulated and experimental discharge capacities for 50 cycles at C/2 and 1C is shown, and the corresponding numerical values are reported in Table S2.
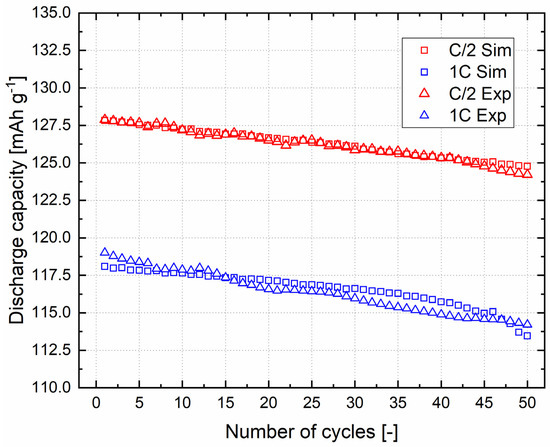
Figure 5.
Validation of the aging model.
A general linear trend can be observed in the experimental discharge capacities for both C rates. The capacity loss values, defined as percentage ratio between the 1st and 50th cycle discharge capacities (2.86% for C/2 and 4.03% for 1C), are coherent with the increase in the C rate, confirming the good stability in the Li-LFP cell for long cycling. As can be seen from Figure 5, the experimental results at 1C show less linear behaviour with respect to C/2. It should be considered that, at 1C, the initial capacity of the model was considered the same as for the experimental cell; in fact, the model underestimates the experimental capacity of 1–2 mAh g−1. The discrepancy can be seen in the last five cycles at 1C, probably due to an increase in the effect of SEI formation caused by the higher current density with respect to the C/2 case.
Comparing the simulated and experimental discharge capacities, the developed P2D aging model accurately forecasts the capacity loss upon long cycling, for both C rates. However, as can be observed in Figure 5, the fitting is better for C/2 than 1C. In fact, considering the simulated and experimental discharge capacities for the same cycle and the same C rate, a difference of 40 μAh g−1 and 560 μAh g−1 can be seen at C/2 for the 1st and 50th cycles, while for 1C, these values increase to 920 μAh g−1 and 750 μAh g−1.
Instead, the capacity loss values calculated for the simulated curves are 2.39% and 3.92% for C/2 and 1C, respectively. This means that there is a difference between the experimental and simulated values of about 0.47% for C/2 and 0.11% for 1C. The lower value observed at a higher C rate demonstrates the good quality and the breakthrough of this P2D aging model. The innovation is, indeed, the combination of the metallic lithium as an anode and the SEI growth on its surface, assuming that LiF and Li2CO3 are the only two products from the SEI reaction and considering an Arrhenius equation to describe the exchange current density of SEI.
5. Conclusions
In this work, an innovative P2D aging electrochemical model for a lithium-metal–LFP cell was successfully developed. Particularly, the combination of two important aspects that characterize this new battery generation was implemented inside a P2D model for the first time.
From one side, we chose lithium metal as an anode, substituting out the traditional graphite anode. This implies a different treatment from an electrochemical point of view, considering metallic lithium as a boundary condition and not as a porous electrode, as is usually applied for graphite. The second aspect is the implementation of SEI growth on the surface of metallic lithium (assuming that LiF and Li2CO3 are the only two products), which is the phenomenon considered as the most impactful on aging mechanisms.
The developed P2D model can well represent the electrochemical behaviour of the cell at four different C rates (C/10, C/5, C/2 and 1C) and forecast the discharge capacity loss for several cycles at two different C rates (C/2 and 1C). This was possible through the calibration work performed, which allowed us to obtain electrochemical parameters, such as OCV curves and exchange reference current density. Indeed, it was possible to experimentally measure both of these important electrochemical parameters and insert them inside the aging model, in order to increase its accuracy and make it as realistic as possible, as demonstrated in the validation phase.
Thus, considering the low computational cost of the simulation and the accuracy obtained studying a complicated aging phenomenon, such as SEI growth, on a metallic lithium surface, the model, reported here, could be a versatile instrument for future investigations. In fact, other degradation phenomena, such as dendrite growth on the lithium anode surface or the active material loss inside the cathode, can be considered within a P2D electrochemical model.
In conclusion, the implementation of SEI growth, in combination with other aging mechanisms, which strongly affect lithium-based batteries, could be a suitable strategy to increase the knowledge about electrochemical behaviour, contributing to the future up-scaling of this battery technology.
Supplementary Materials
The following supporting information can be downloaded at https://www.mdpi.com/article/10.3390/batteries9030146/s1, Table S1. Error values between model and experimental data; Table S2. Comparison of discharge capacities and capacity loss values obtained experimentally and from the model. Figure S1. Equivalent circuit model (a) used to fit EIS at 20 °C (b), 30 °C (c), 40 °C (d), 50 °C (e) and 60 °C (f).
Author Contributions
Conceptualization, D.D. and P.D.P.; Methodology, D.D. and D.V.; Software, D.D. and P.D.P.; Validation, D.D. and P.D.P.; Data curation, D.D.; Writing—original draft, D.D.; Writing—review and editing, D.V. and J.A.; Supervision, C.F., S.B. and M.S. All authors have read and agreed to the published version of the manuscript.
Funding
This research received no external funding.
Data Availability Statement
Not applicable.
Acknowledgments
The authors wish to thank Mauro Raimondo from Politecnico di Torino for FE-SEM analysis.
Conflicts of Interest
The authors declare no conflict of interest.
Abbreviations
| av | Specific electrode surface |
| c | Volumetric concentration |
| D | Diffusivity |
| DFT | Density Functional Theory |
| Ecell | Cell voltage |
| Eeq | Equilibrium potential |
| EC:DEC | Ethylene carbonate:Dyethyl carbonate |
| EIS | Electrochemical Impedance Spectroscopy |
| EVs | Electric Vehicles |
| F | Faraday’s constant |
| f | Dependence activity |
| i | Current density |
| i0 | Reference exchange current density |
| k | Rate constant |
| Li2CO3 | Lithium carbonate |
| LiF | Lithium fluoride |
| LiPF6 | Lithium exafluorophosfate |
| LFP | Lithium iron phosphate |
| LIBs | Lithium-ion batteries |
| LMA | Lithium-metal anodes |
| LMBs | Lithium-metal batteries |
| M | Molar weight |
| MD | Molecular Dynamics |
| OCV | Open-Circuit Voltage |
| P2D | Pseudo-two-dimensional model |
| PEIS | Potentiostatic Electrochemical Impedance Spectroscopy |
| PVdF | Polyvinylidene fluoride |
| PF | Phase-field modeling |
| Q | Capacity |
| R | Universal gas constant |
| rp | Radius particle |
| RSEI | SEI Resistance |
| T | Temperature |
| t+ | Transference number |
| S | Electrode–electrolyte interface surface area |
| SEI | Solid Electrolyte Interphase |
| SoC | State of Charge |
| V | Voltage |
| Greek | |
| α | Charge transfer coefficient |
| δSEI | SEI Thickness |
| ε | Volumetric fraction |
| ρ | Density |
| η | Over-potential |
| σ | Conductivity |
| τ | Tortuosity |
| ϕ | Potential |
References
- Houache, M.S.E.; Yim, C.-H.; Karkar, Z.; Abu-Lebdeh, Y. On the Current and Future Outlook of Battery Chemistries for Electric Vehicles—Mini Review. Batteries 2022, 8, 70. [Google Scholar] [CrossRef]
- Ravi, S.S.; Aziz, M. Utilization of Electric Vehicles for Vehicle-to-Grid Services: Progress and Perspectives. Energies 2022, 15, 589. [Google Scholar] [CrossRef]
- Dik, A.; Omer, S.; Boukhanouf, R. Electric Vehicles: V2G for Rapid, Safe, and Green EV Penetration. Energies 2022, 15, 803. [Google Scholar] [CrossRef]
- Lemian, D.; Bode, F. Battery-Supercapacitor Energy Storage Systems for Electrical Vehicles: A Review. Energies 2022, 15, 5683. [Google Scholar] [CrossRef]
- Li, Z.; Khajepour, A.; Song, J. A Comprehensive Review of the Key Technologies for Pure Electric Vehicles. Energy 2019, 182, 824–839. [Google Scholar] [CrossRef]
- Sun, X.; Li, Z.; Wang, X.; Li, C. Technology Development of Electric Vehicles: A Review. Energies 2019, 13, 90. [Google Scholar] [CrossRef]
- Fichtner, M.; Edström, K.; Ayerbe, E.; Berecibar, M.; Bhowmik, A.; Castelli, I.E.; Clark, S.; Dominko, R.; Erakca, M.; Franco, A.A.; et al. Rechargeable Batteries of the Future—The State of the Art from a BATTERY 2030+ Perspective. Adv. Energy Mater. 2022, 12, 2102904. [Google Scholar] [CrossRef]
- Asenbauer, J.; Eisenmann, T.; Kuenzel, M.; Kazzazi, A.; Chen, Z.; Bresser, D. The Success Story of Graphite as a Lithium-Ion Anode Material–Fundamentals, Remaining Challenges, and Recent Developments Including Silicon (Oxide) Composites. Sustain. Energy Fuels 2020, 4, 5387–5416. [Google Scholar] [CrossRef]
- Zhao, L.; Ding, B.; Qin, X.; Wang, Z.; Lv, W.; He, Y.; Yang, Q.; Kang, F. Revisiting the Roles of Natural Graphite in Ongoing Lithium-Ion Batteries. Adv. Mater. 2022, 34, 2106704. [Google Scholar] [CrossRef]
- Shen, X.; Zhang, X.-Q.; Ding, F.; Huang, J.-Q.; Xu, R.; Chen, X.; Yan, C.; Su, F.-Y.; Chen, C.-M.; Liu, X.; et al. Advanced Electrode Materials in Lithium Batteries: Retrospect and Prospect. Energy Mater. Adv. 2021, 2021, 1–15. [Google Scholar] [CrossRef]
- Jiao, S.; Zheng, J.; Li, Q.; Li, X.; Engelhard, M.H.; Cao, R.; Zhang, J.G.; Xu, W. Behavior of Lithium Metal Anodes under Various Capacity Utilization and High Current Density in Lithium Metal Batteries. Joule 2018, 2, 110–124. [Google Scholar] [CrossRef]
- Waldmann, T.; Hogg, B.-I.; Wohlfahrt-Mehrens, M. Li Plating as Unwanted Side Reaction in Commercial Li-Ion Cells–A Review. J. Power Sources 2018, 384, 107–124. [Google Scholar] [CrossRef]
- Hu, D.; Chen, L.; Tian, J.; Su, Y.; Li, N.; Chen, G.; Hu, Y.; Dou, Y.; Chen, S.; Wu, F. Research Progress of Lithium Plating on Graphite Anode in Lithium-Ion Batteries. Chin. J. Chem. 2021, 39, 165–173. [Google Scholar] [CrossRef]
- Heiskanen, S.K.; Kim, J.; Lucht, B.L. Generation and Evolution of the Solid Electrolyte Interphase of Lithium-Ion Batteries. Joule 2019, 3, 2322–2333. [Google Scholar] [CrossRef]
- Vetter, J.; Novák, P.; Wagner, M.R.; Veit, C.; Möller, K.-C.; Besenhard, J.O.; Winter, M.; Wohlfahrt-Mehrens, M.; Vogler, C.; Hammouche, A. Ageing Mechanisms in Lithium-Ion Batteries. J. Power Sources 2005, 147, 269–281. [Google Scholar] [CrossRef]
- Wang, H.; Liu, Y.; Li, Y.; Cui, Y. Lithium Metal Anode Materials Design: Interphase and Host. Electrochem. Energy Rev. 2019, 2, 509–517. [Google Scholar] [CrossRef]
- Amici, J.; Calderón, C.A.; Versaci, D.; Luque, G.; Barraco, D.; Leiva, E.; Francia, C.; Bodoardo, S. Composite Polymer Electrolyte with High Inorganic Additive Contents to Enable Metallic Lithium Anode. Electrochim. Acta 2022, 404, 139772. [Google Scholar] [CrossRef]
- Ding, J.-F.; Zhang, Y.-T.; Xu, R.; Zhang, R.; Xiao, Y.; Zhang, S.; Bi, C.-X.; Tang, C.; Xiang, R.; Park, H.S.; et al. Review on Lithium Metal Anodes towards High Energy Density Batteries. Green Energy Environ. 2022; in press. [Google Scholar] [CrossRef]
- Wu, Z.; Kong, D. Comparative Life Cycle Assessment of Lithium-Ion Batteries with Lithium Metal, Silicon Nanowire, and Graphite Anodes. Clean Technol. Env. Policy 2018, 20, 1233–1244. [Google Scholar] [CrossRef]
- Lastoskie, C.M.; Dai, Q. Comparative Life Cycle Assessment of Laminated and Vacuum Vapor-Deposited Thin Film Solid-State Batteries. J. Clean Prod. 2015, 91, 158–169. [Google Scholar] [CrossRef]
- Ghazi, Z.A.; Sun, Z.; Sun, C.; Qi, F.; An, B.; Li, F.; Cheng, H.M. Key Aspects of Lithium Metal Anodes for Lithium Metal Batteries. Small 2019, 15, 1900687. [Google Scholar] [CrossRef] [PubMed]
- Wang, R.; Cui, W.; Chu, F.; Wu, F. Lithium Metal Anodes: Present and Future. J. Energy Chem. 2020, 48, 145–159. [Google Scholar] [CrossRef]
- Fang, C.; Li, J.; Zhang, M.; Zhang, Y.; Yang, F.; Lee, J.Z.; Lee, M.-H.; Alvarado, J.; Schroeder, M.A.; Yang, Y.; et al. Quantifying Inactive Lithium in Lithium Metal Batteries. Nature 2019, 572, 511–515. [Google Scholar] [CrossRef] [PubMed]
- Liu, B.; Zhang, J.G.; Xu, W. Advancing Lithium Metal Batteries. Joule 2018, 2, 833–845. [Google Scholar] [CrossRef]
- Li, B.; Wang, Y.; Yang, S. A Material Perspective of Rechargeable Metallic Lithium Anodes. Adv. Energy Mater. 2018, 8, 1702296. [Google Scholar] [CrossRef]
- Li, J.; Kong, Z.; Liu, X.; Zheng, B.; Fan, Q.H.; Garratt, E.; Schuelke, T.; Wang, K.; Xu, H.; Jin, H. Strategies to Anode Protection in Lithium Metal Battery: A Review. InfoMat 2021, 3, 1333–1363. [Google Scholar] [CrossRef]
- Barcellona, S.; Piegari, L. Lithium Ion Battery Models and Parameter Identification Techniques. Energies 2017, 10, 2007. [Google Scholar] [CrossRef]
- Zhao, Y.; Stein, P.; Bai, Y.; Al-Siraj, M.; Yang, Y.; Xu, B.X. A Review on Modeling of Electro-Chemo-Mechanics in Lithium-Ion Batteries. J. Power Sources 2019, 413, 259–283. [Google Scholar] [CrossRef]
- Adaikkappan, M.; Sathiyamoorthy, N. Modeling, State of Charge Estimation, and Charging of Lithium-Ion Battery in Electric Vehicle: A Review. Int. J. Energy Res. 2022, 46, 2141–2165. [Google Scholar] [CrossRef]
- Chen, Z.; Danilov, D.L.; Eichel, R.A.; Notten, P.H.L. Porous Electrode Modeling and Its Applications to Li-Ion Batteries. Adv. Energy Mater. 2022, 12, 2201506. [Google Scholar] [CrossRef]
- Doyle, M.; Fuller, T.F.; Newman, J. Modeling of Galvanostatic Charge and Discharge of the Lithium/Polymer/Insertion Cell. J. Electrochem. Soc. 1993, 140, 1526–1533. [Google Scholar] [CrossRef]
- Xu, L.; Lin, X.; Xie, Y.; Hu, X. Enabling High-Fidelity Electrochemical P2D Modeling of Lithium-Ion Batteries via Fast and Non-Destructive Parameter Identification. Energy Storage Mater. 2022, 45, 952–968. [Google Scholar] [CrossRef]
- Liu, K.; Gao, Y.; Zhu, C.; Li, K.; Fei, M.; Peng, C.; Zhang, X.; Han, Q.L. Electrochemical Modeling and Parameterization towards Control-Oriented Management of Lithium-Ion Batteries. Control Eng. Pract. 2022, 124, 105176. [Google Scholar] [CrossRef]
- Sahapatsombut, U.; Cheng, H.; Scott, K. Modelling the Micro-Macro Homogeneous Cycling Behaviour of a Lithium-Air Battery. J. Power Sources 2013, 227, 243–253. [Google Scholar] [CrossRef]
- Sahapatsombut, U.; Cheng, H.; Scott, K. Modelling of Operation of a Lithium-Air Battery with Ambient Air and Oxygen-Selective Membrane. J. Power Sources 2014, 249, 418–430. [Google Scholar] [CrossRef]
- Kumaresan, K.; Mikhaylik, Y.; White, R.E. A Mathematical Model for a Lithium–Sulfur Cell. J. Electrochem. Soc. 2008, 155, A576. [Google Scholar] [CrossRef]
- Zhang, T.; Marinescu, M.; Walus, S.; Offer, G.J. Modelling Transport-Limited Discharge Capacity of Lithium-Sulfur Cells. Electrochim. Acta 2016, 219, 502–508. [Google Scholar] [CrossRef]
- Wu, H.; Jia, H.; Wang, C.; Zhang, J.G.; Xu, W. Recent Progress in Understanding Solid Electrolyte Interphase on Lithium Metal Anodes. Adv. Energy Mater. 2021, 11, 2003092. [Google Scholar] [CrossRef]
- Ramasubramanian, A.; Yurkiv, V.; Foroozan, T.; Ragone, M.; Shahbazian-Yassar, R.; Mashayek, F. Stability of Solid-Electrolyte Interphase (SEI) on the Lithium Metal Surface in Lithium Metal Batteries (LMBs). ACS Appl. Energy Mater. 2020, 3, 10560–10567. [Google Scholar] [CrossRef]
- Cheng, X.B.; Zhang, R.; Zhao, C.Z.; Wei, F.; Zhang, J.G.; Zhang, Q. A Review of Solid Electrolyte Interphases on Lithium Metal Anode. Adv. Sci. 2015, 3, 1500213. [Google Scholar] [CrossRef]
- Lin, Y.; Zhang, X.; Liu, Y.; Wang, Q.; Lin, C.; Chen, S.; Zhang, Y. Ultra-Stable Li||LiFePO4 Batteries via Advanced Designing of Localized High Concentration Electrolyte. J. Colloid Interface Sci. 2022, 628, 14–23. [Google Scholar] [CrossRef]
- Pron, V.G.; Versaci, D.; Amici, J.; Francia, C.; Santarelli, M.; Bodoardo, S. Electrochemical Characterization and Solid Electrolyte Interface Modeling of LiNi 0.5 Mn 1.5 O 4 -Graphite Cells. J. Electrochem. Soc. 2019, 166, A2255–A2263. [Google Scholar] [CrossRef]
- Jokar, A.; Rajabloo, B.; Désilets, M.; Lacroix, M. Review of Simplified Pseudo-Two-Dimensional Models of Lithium-Ion Batteries. J. Power Sources 2016, 327, 44–55. [Google Scholar] [CrossRef]
- Franke-Lang, R.; Kowal, J. Electrochemical Model-Based Investigation of Thick LiFePO4 Electrode Design Parameters. Modelling 2021, 2, 259–287. [Google Scholar] [CrossRef]
- Liu, D.; He, Y.; Chen, Y.; Cao, J.; Zhu, F. Electrochemical Modeling, Li Plating Onsets and Performance Analysis of Thick Graphite Electrodes Considering the Solid Electrolyte Interface Formed from the First Cycle. Electrochim. Acta 2023, 439, 141651. [Google Scholar] [CrossRef]
- Kindermann, F.M.; Keil, J.; Frank, A.; Jossen, A. A SEI Modeling Approach Distinguishing between Capacity and Power Fade. J. Electrochem. Soc. 2017, 164, E287–E294. [Google Scholar] [CrossRef]
- Appiah, W.A.; Busk, J.; Vegge, T.; Bhowmik, A. Sensitivity Analysis Methodology for Battery Degradation Models. Electrochim. Acta 2023, 439, 141430. [Google Scholar] [CrossRef]
- Lamorgese, A.; Mauri, R.; Tellini, B. Electrochemical-Thermal P2D Aging Model of a LiCoO2/Graphite Cell: Capacity Fade Simulations. J. Energy Storage 2018, 20, 289–297. [Google Scholar] [CrossRef]
- Chen, S.-P.; Lv, D.; Chen, J.; Zhang, Y.-H.; Shi, F.-N. Review on Defects and Modification Methods of LiFePO 4 Cathode Material for Lithium-Ion Batteries. Energy Fuels 2022, 36, 1232–1251. [Google Scholar] [CrossRef]
- Li, J.; Cheng, Y.; Jia, M.; Tang, Y.; Lin, Y.; Zhang, Z.; Liu, Y. An Electrochemical-Thermal Model Based on Dynamic Responses for Lithium Iron Phosphate Battery. J. Power Sources 2014, 255, 130–143. [Google Scholar] [CrossRef]
- Chen, C.-H.; Brosa Planella, F.; O’Regan, K.; Gastol, D.; Widanage, W.D.; Kendrick, E. Development of Experimental Techniques for Parameterization of Multi-Scale Lithium-Ion Battery Models. J. Electrochem. Soc. 2020, 167, 080534. [Google Scholar] [CrossRef]
- Wildfeuer, L.; Gieler, P.; Karger, A. Combining the Distribution of Relaxation Times from EIS and Time-Domain Data for Parameterizing Equivalent Circuit Models of Lithium-Ion Batteries. Batteries 2021, 7, 52. [Google Scholar] [CrossRef]
- Amin, R.; Belharouak, I. Part-II: Exchange Current Density and Ionic Diffusivity Studies on the Ordered and Disordered Spinel LiNi 0.5 Mn 1.5 O 4 Cathode. J. Power Sources 2017, 348, 318–325. [Google Scholar] [CrossRef]
- Lee, H.; Yang, S.; Kim, S.; Song, J.; Park, J.; Doh, C.H.; Ha, Y.C.; Kwon, T.S.; Lee, Y.M. Understanding the Effects of Diffusion Coefficient and Exchange Current Density on the Electrochemical Model of Lithium-Ion Batteries. Curr. Opin. Electrochem. 2022, 34, 100986. [Google Scholar] [CrossRef]
Disclaimer/Publisher’s Note: The statements, opinions and data contained in all publications are solely those of the individual author(s) and contributor(s) and not of MDPI and/or the editor(s). MDPI and/or the editor(s) disclaim responsibility for any injury to people or property resulting from any ideas, methods, instructions or products referred to in the content. |
© 2023 by the authors. Licensee MDPI, Basel, Switzerland. This article is an open access article distributed under the terms and conditions of the Creative Commons Attribution (CC BY) license (https://creativecommons.org/licenses/by/4.0/).