Article

Online State of Health Estimation of Lithium-Ion Batteries Based on Charging Process and Long Short-Term Memory Recurrent Neural Network

1
School of Electric Power, South China University of Technology, Guangzhou 510641, China
2
Guangdong Hynn Technology Co., Ltd., Dongguan 518109, China
*
Author to whom correspondence should be addressed.
Batteries 2023, 9(2), 94; https://doi.org/10.3390/batteries9020094
Submission received: 30 November 2022 / Revised: 12 January 2023 / Accepted: 24 January 2023 / Published: 30 January 2023

Abstract

:
Accurate state of health (SOH) estimation is critical to the operation, maintenance, and replacement of lithium-ion batteries (LIBs), which have penetrated almost every aspect of our life. This paper introduces a new approach to accurately estimate the SOH for rechargeable lithium-ion batteries based on the corresponding charging process and long short-term memory recurrent neural network (LSTM-RNN). In order to learn the mapping function without employing battery models and filtering techniques, the LSTM-RNN is initially fed into the health indicators (HIs) extracted from the charging process and trained to encode the dependencies of the related data sequence. Subsequently, the trained LSTM-RNN can properly estimate online SOHs of LIBs using extracted HIs. We experiment on two public datasets for model construction, validation, and comparison. Conclusively, the trained LSTM-RNN achieves an overall root mean square error (RMSE) lower than 1% on the cases with the same discharging current rate and an RMSE of 1.1198% above 80% SOH on another testing case that underwent a different discharging current rate.

1. Introduction

Lithium-ion batteries are deployed in many fields, such as consumer electronics, electric vehicles (EV), and aerospace technologies, due to their high energy density, long lifetime, environmental friendliness, and low self-discharge rate [1,2,3]. However, as the charge/discharge cycle increases, the material inside the lithium-ion battery is irreversibly consumed [4,5], which means that the cell ages, manifesting in decreasing capacity, declining power, and thermal instability. When the battery ages beyond a certain point, the battery performance consequently becomes unreliable and is prone to failure. State of health (SOH) is proposed to represent the battery aging degree and can reflect the total capacity reduction and resistance increment. Most companies set 80% SOH as the criterion for the decommission of used batteries [6]. Additionally, a reliable SOH estimation method is crucial for secure and reliable battery operation and is the backbone of the battery management system (BMS) [7].
This paper utilizes the capacity to indicate the battery state of health (SOH), which can be defined in terms of battery capacity [8,9], internal resistance [10,11,12], and peak power [13]. Technically, battery SOH estimation methods mainly fall into two categories. In the first category, SOH estimation is based on battery models, including the equivalent circuit models [14,15], electrochemical models [16,17,18], and empirical models [19,20], in combination with advanced filter techniques such as the particle filter (PF) and Kalman filter (KF) techniques. Bi et al. [15] proposed a second-order equivalent circuit model of an RC circuit for battery packs and subsequently developed a genetic resampling particle filter (GPF) technique to cope with the inaccuracy of the equivalent circuit model. In addition, Li et al. [17] developed an SP-based degradation model including solid electrolyte interface (SEI) layer formation. This model can quickly estimate capacity fade and voltage profile changes with high accuracy. Additionally, Guha et al. [19] obtained a degradation model to monitor the SOH of a battery by fusing the capacity degradation model and an empirical model for internal resistance growth. In [21], Ossai et al. estimated the SOH of batteries using the Weibull distribution function based on a nonlinear mixed effect degradation model framework. Since lithium-ion batteries have intricate electrochemical properties and complex aging mechanisms, the model-based approach requires computationally intensive algorithms to accurately estimate SOH [9]. Moreover, the identified parameters always need to be modified according to the different working conditions and battery types, which obstructs the promotion of related model-based approaches [22,23].
The second category of SOH estimating methods is built on data-driven (machine learning) methodologies. In contrast to model-based approaches, data-driven methods are dependent on the offline charging/discharging data to learn the mapping function to estimate the SOH, ignoring the complex aging mechanisms and intricate internal electrochemical properties of lithium-ion batteries. Due to significant strides made in the field of machine learning, these data-driven approaches, mainly including the support vector machine (SVM) [24,25], Gaussian process regression (GPR) [26,27,28], and the neural network (NN) [9,29,30,31,32], typically produce more accurate SOH estimates. In [24], Feng et al. built a predictive diagnosis model based on a support vector machine whose coefficients for cells are identified by determining the support vectors. Richardson et al. [27] proposed Gaussian process (GP) regression for estimating the SOH of batteries and highlighted the advantages of GPs over other SOH forecasting approaches. To obtain more accurate SOH estimates, the effective health indicators fed into the algorithms are initially extracted from the charge/discharge data. Zhao et al. [25] employed a relevance vector machine (RVM) to fit the mapping function between the five types of extracted health indicators and SOH. Wang et al. [28] initially proposed an accurate SOH prediction model using multi-output Gaussian process regression (MOGPR) and subsequently performed the SOH estimation based on extracted health indicators (HIs). Li et al. [9] utilized the convolutional neural network for SOH estimation based on the battery’s charging current, voltage, and temperature. Based on an incremental capacity curve, Lin et al. [29] utilized a back-propagation neural network to develop an SOH hybrid estimation method. In [31], Shahriari et al. obtained SOH estimates based on the relationship between health indicators (HIs) from the state of charge (SOC) and the battery open-circuit voltage. Additionally, Liu et al. [32] extracted partial segments of charging and discharging data as health indicators for SOH estimation.
By establishing a non-linear mapping function between the input vectors and SOH, data-driven methods can accurately estimate battery SOH. Since the cyclic charge/discharge data can be viewed as a series of time series data, the sequence prediction problem of SOH estimation can be tackled using RNNs with a “memory” property [33]. To address the gradient vanishing problem of convolutional recurrent neural networks (RNN) [34], the LSTM-RNN is designed to learn long-term dependencies by remembering information over long periods [35]. Due to the suitability of this characteristic for addressing the time series predicting problem, this paper employs a vanilla LSTM-RNN with one single hidden layer to estimate the online SOH with the stable and monolithic charging process of lithium-ion batteries. Specifically, the main advantage of this method is that it can adequately exploit time series characteristics to learn the long-term dependencies from the historical cyclic data. With only one single hidden layer on the LSTM-RNN, this method can be achieved with less model complexity and fewer parameter sets compared with other data-driven approaches. Another advantage is that it can directly map battery measurement signals such as voltage and current to the online SOH, avoiding the inference algorithms and intensively computational filter techniques used in model-based SOH estimators.
After a brief introduction, the second section will introduce the battery cyclic datasets and the health indicator extraction process. The third section will elaborate on the detailed LSTM-RNN for online SOH estimation. The fourth section will describe the procedure for the LSTM-RNN application and show the online SOH estimation results on the introduced battery datasets, and this will be followed by the conclusions in Section 5. All abbreviations are explained in Table A1 of Appendix A.

2. Battery Datasets and Health Indicator Extraction

This paper utilizes two public cyclic aging datasets, one from the data repository of the NASA Ames Prognostics Center of Excellence (PCoE) [36] and another provided by the Center for Advanced Life Cycle Engineering (CALCE) [37,38] at the University of Maryland, to verify the effectiveness and performance of the proposed SOH estimator. The SOH is defined as the ratio of the present capacity to the nominal capacity and can be expressed as follows:
SOH = C P C N × 100 %
where CN denotes the nominal capacity and CP is the present capacity of the battery.

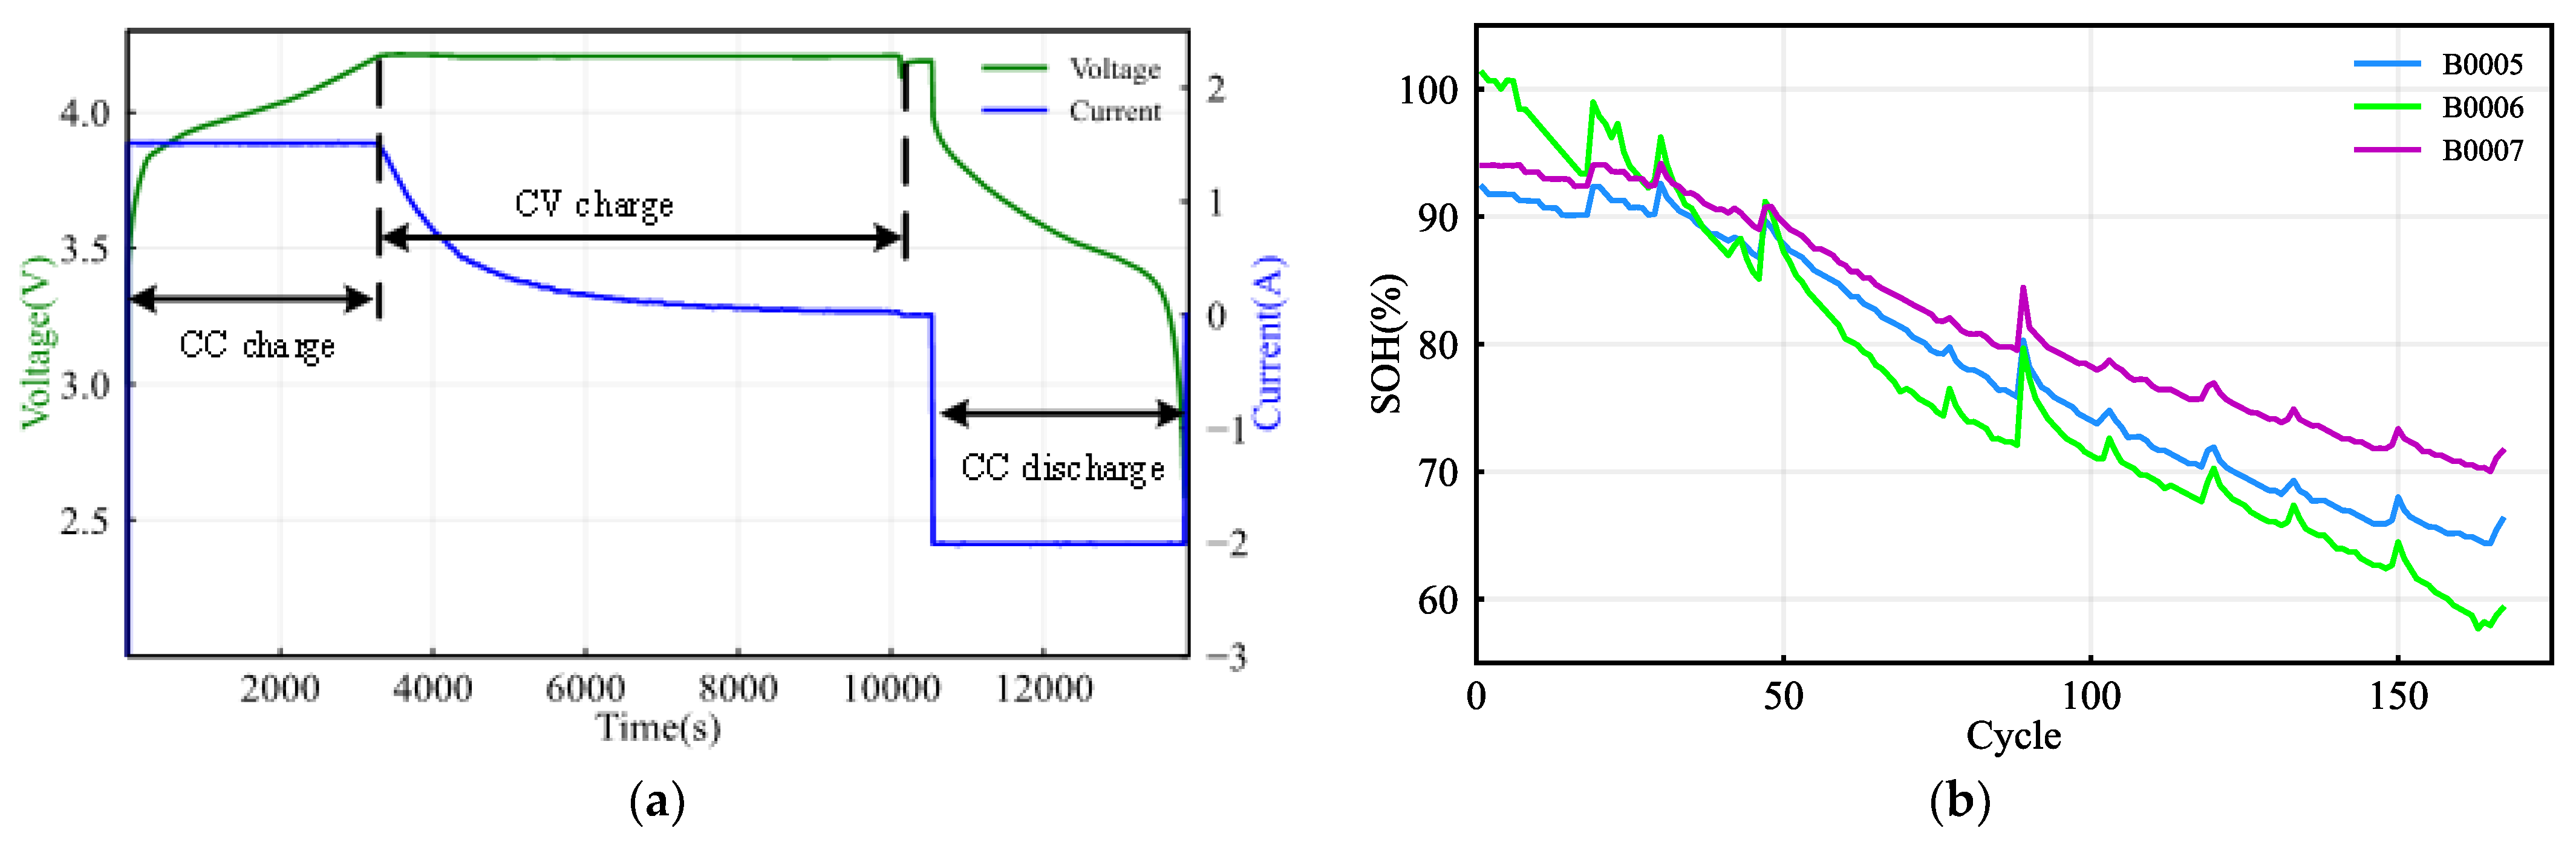
2.1. Description of NASA Battery Dataset

The NASA battery datasets, regarding several commercially available lithium-ion 18 650-sized rechargeable batteries, was collected from a battery prognostics test bed. The test bed setup included a power supply, a programmable load, a voltmeter, a thermocouple sensor, and an environmental chamber to regulate and stabilize the temperature [26]. Among the six battery datasets, the first dataset includes three batteries (labeled B0005, B0006, and B0007) considered suitable for this battery state of health estimation study. This set of cells was run through three operational profiles (charge, discharge, and impedance) at room temperature. As is shown in Figure 1a, the charge was carried out in a constant current–constant voltage (CC–CV) mode where the constant current was 1.5 A, the voltage was 4.2 V, and the constant voltage (CV) mode continued until the charging current dropped to 20 mA. Discharge was carried out at a constant current (CC) level of 2 A until the voltage fell to 2.7 V, 2.5 V, and 2.2 V for batteries B0005, B0006, and B0007, respectively. The charge/discharge cycle was repeated to accelerate the aging until the batteries reached their end-of-life (EOF) criterion of a 30% reduction in rated capacity (from 2 Ah to 1.4 Ah), and all the SOH degradation curves are shown in Figure 1b.

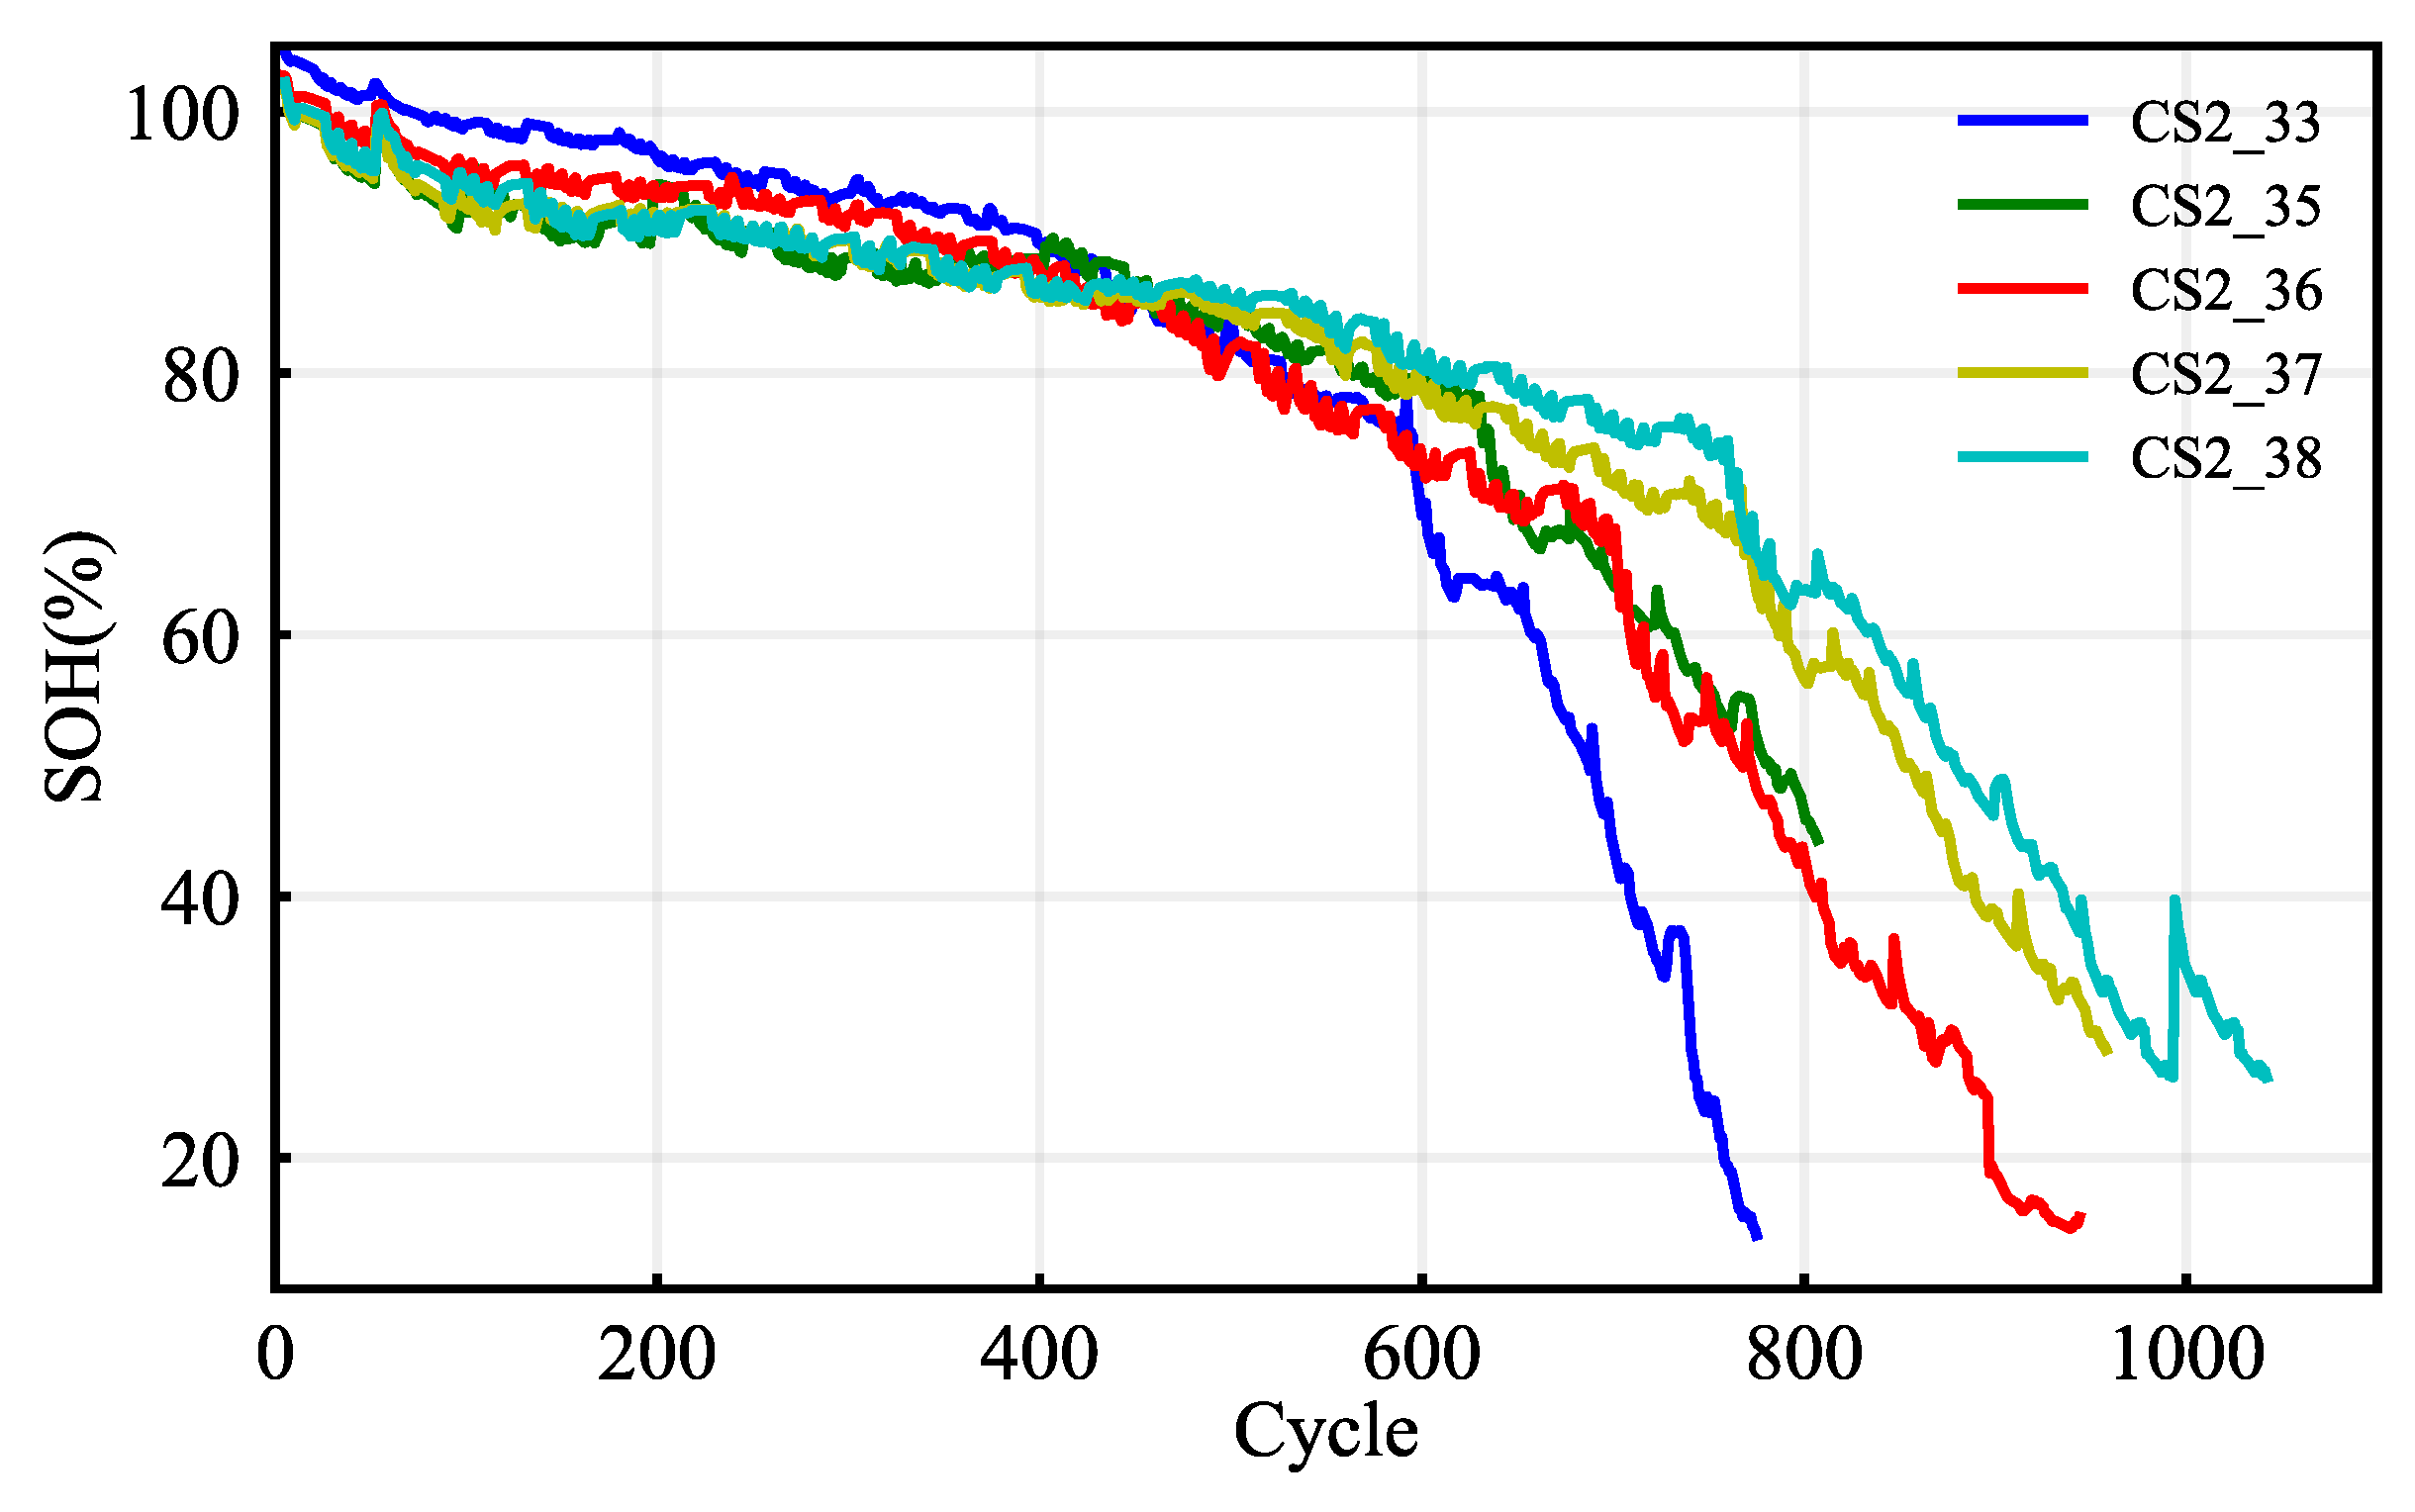
2.2. Description of CALCE Battery Dataset

The second battery dataset, from the Center for Advanced Life Cycle Engineering (CALCE) at the University of Maryland, was obtained from the implementation of cyclic battery testing on the Arbin200 battery testing system at room temperature. Specifically, we employ a set of five CS2 cells labeled CS2-33, CS2-35, CS2-36, CS2-37, and CS2-38 to verify the effectiveness of the LSTM-RNN estimating model. Each cell underwent the same CC–CV charging mode in which the constant current rate was 0.5 C (this indicates that the charging current was 0.55 A), and the constant voltage was sustained at 4.2 V until the charge current fell below 0.05 A. As for the discharge process, CS2-33 was cycled with a constant discharge current of 0.55 A, which indicates that the discharge current rate was 0.5 C. The rest of the cells (CS2-35, CS2-36, CS2-37, and CS2-38) were discharged with a constant current rate of 1 C. The materials of the cells consisted of graphite on the anode and LiCoO2 on the cathode. Figure 2 represents the SOH degradation curves of all the batteries whose nominal capacity is 1.1 Ah.

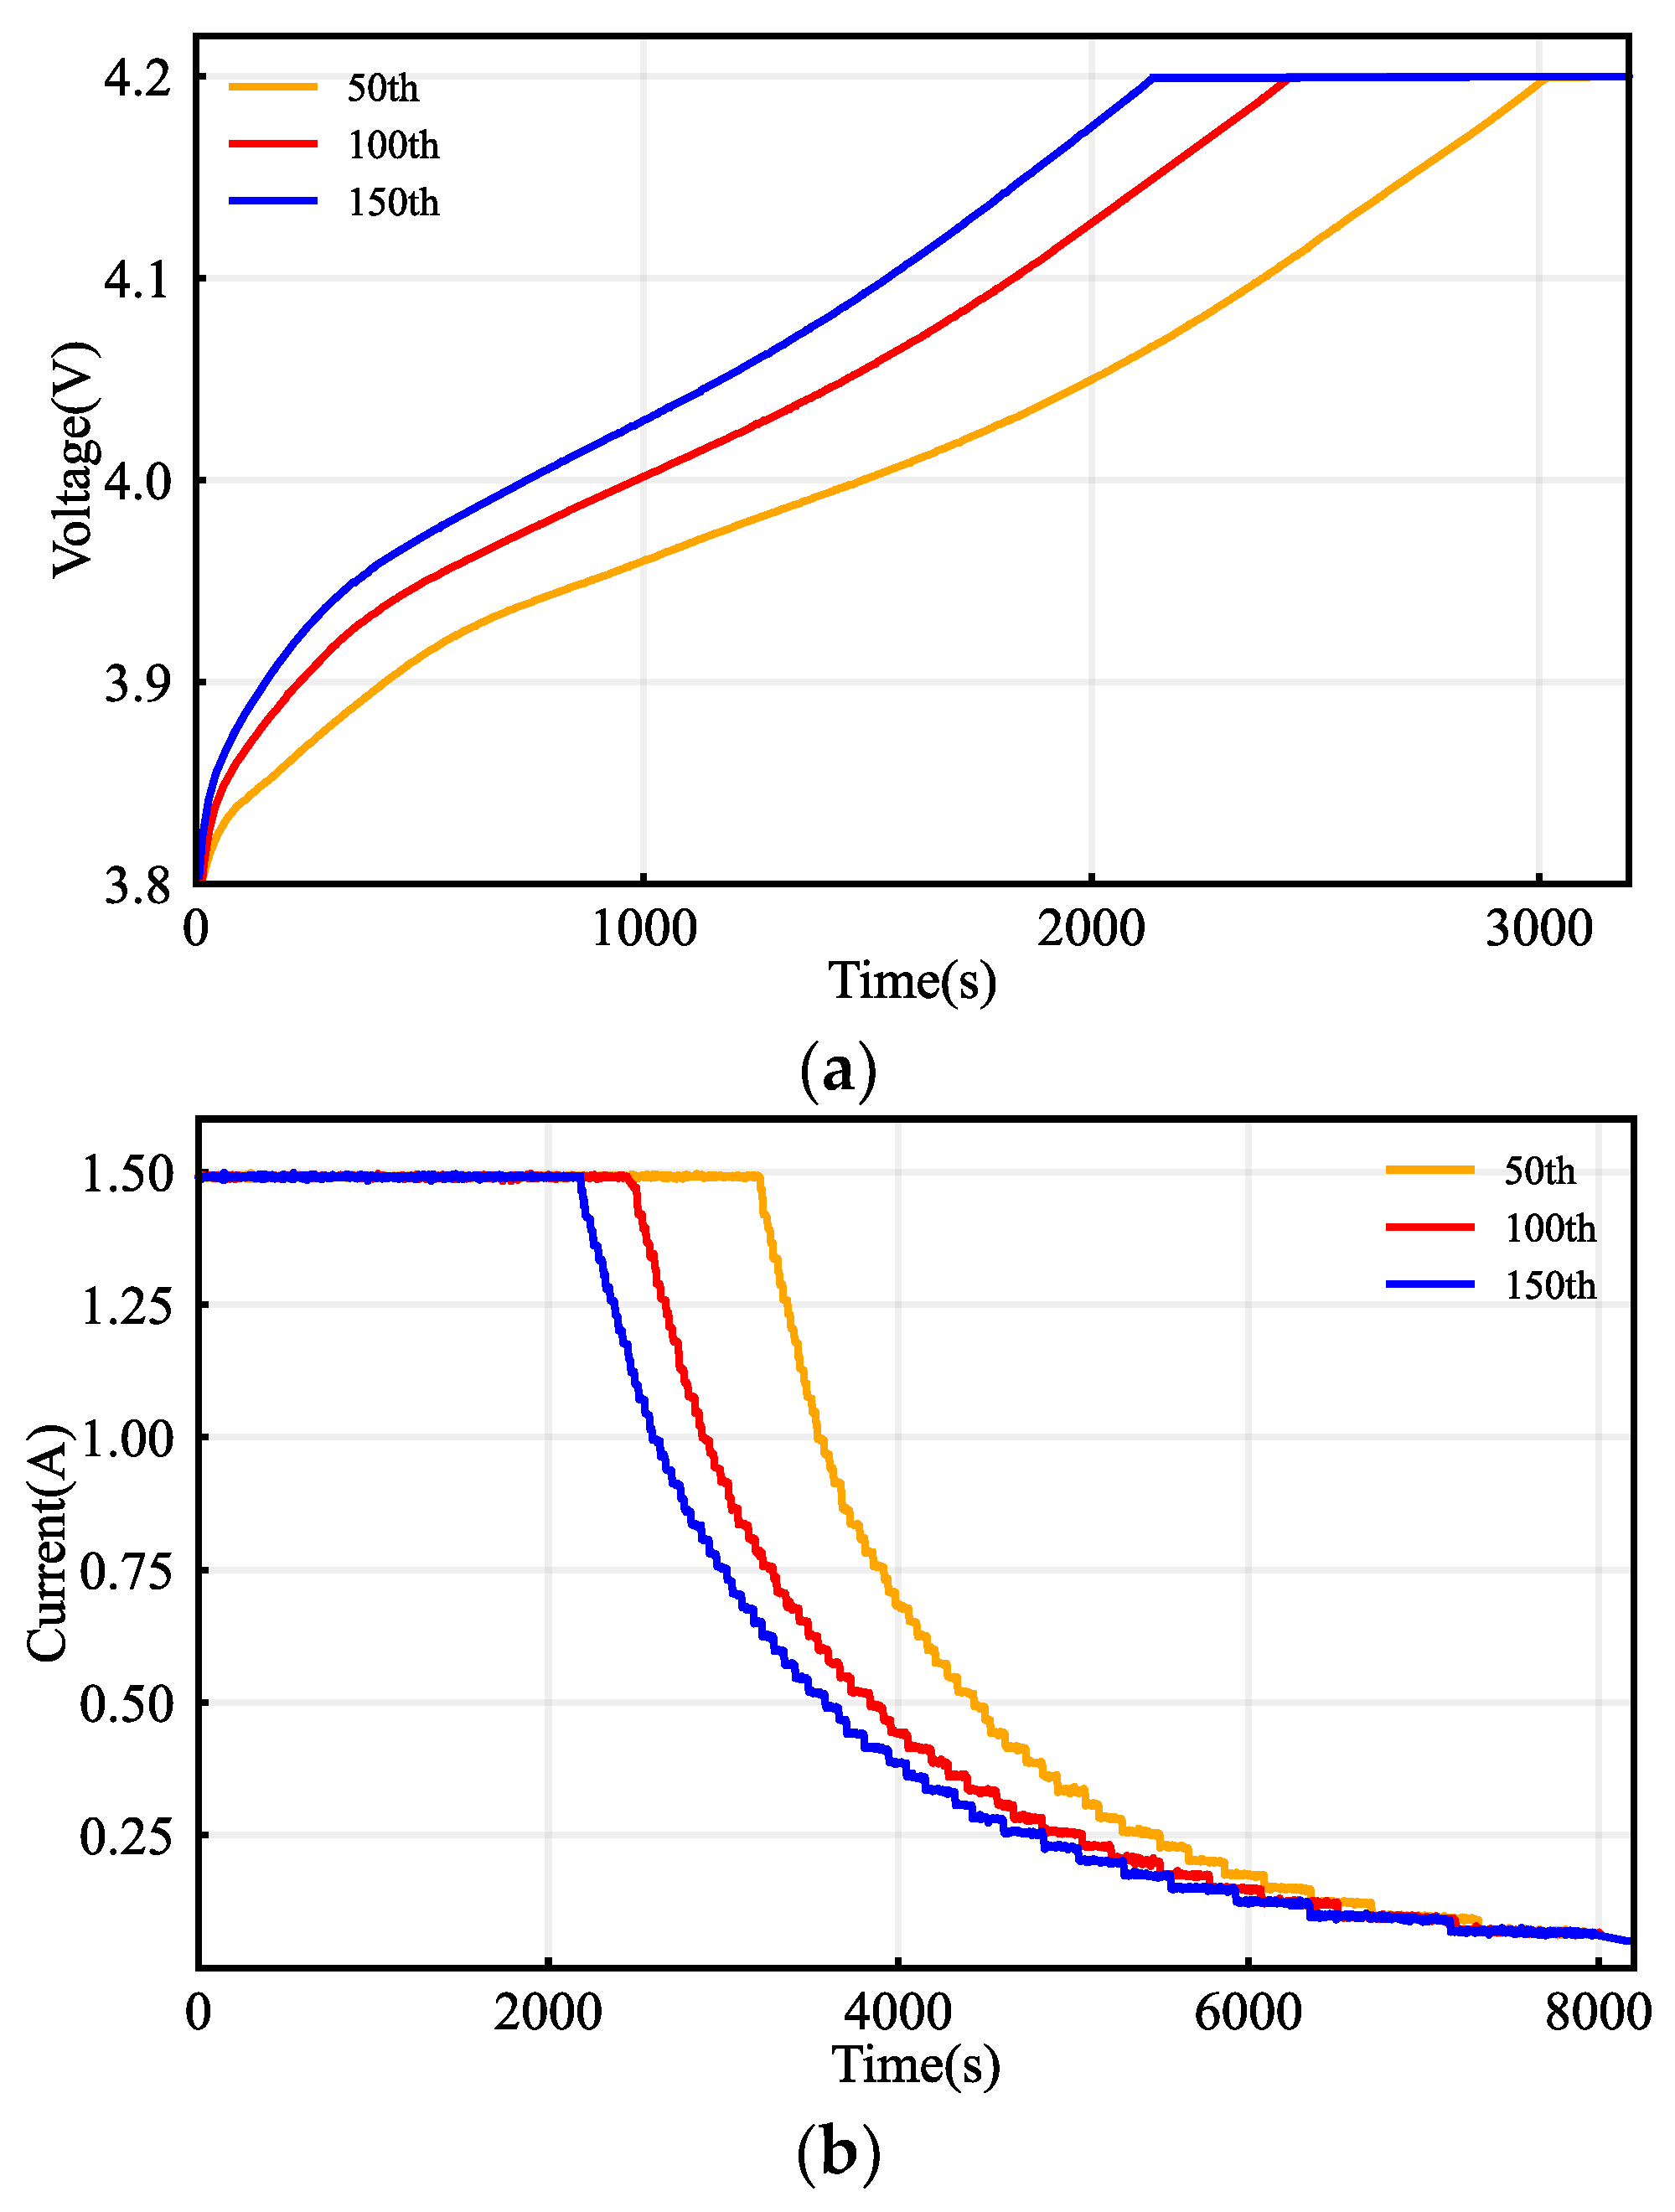
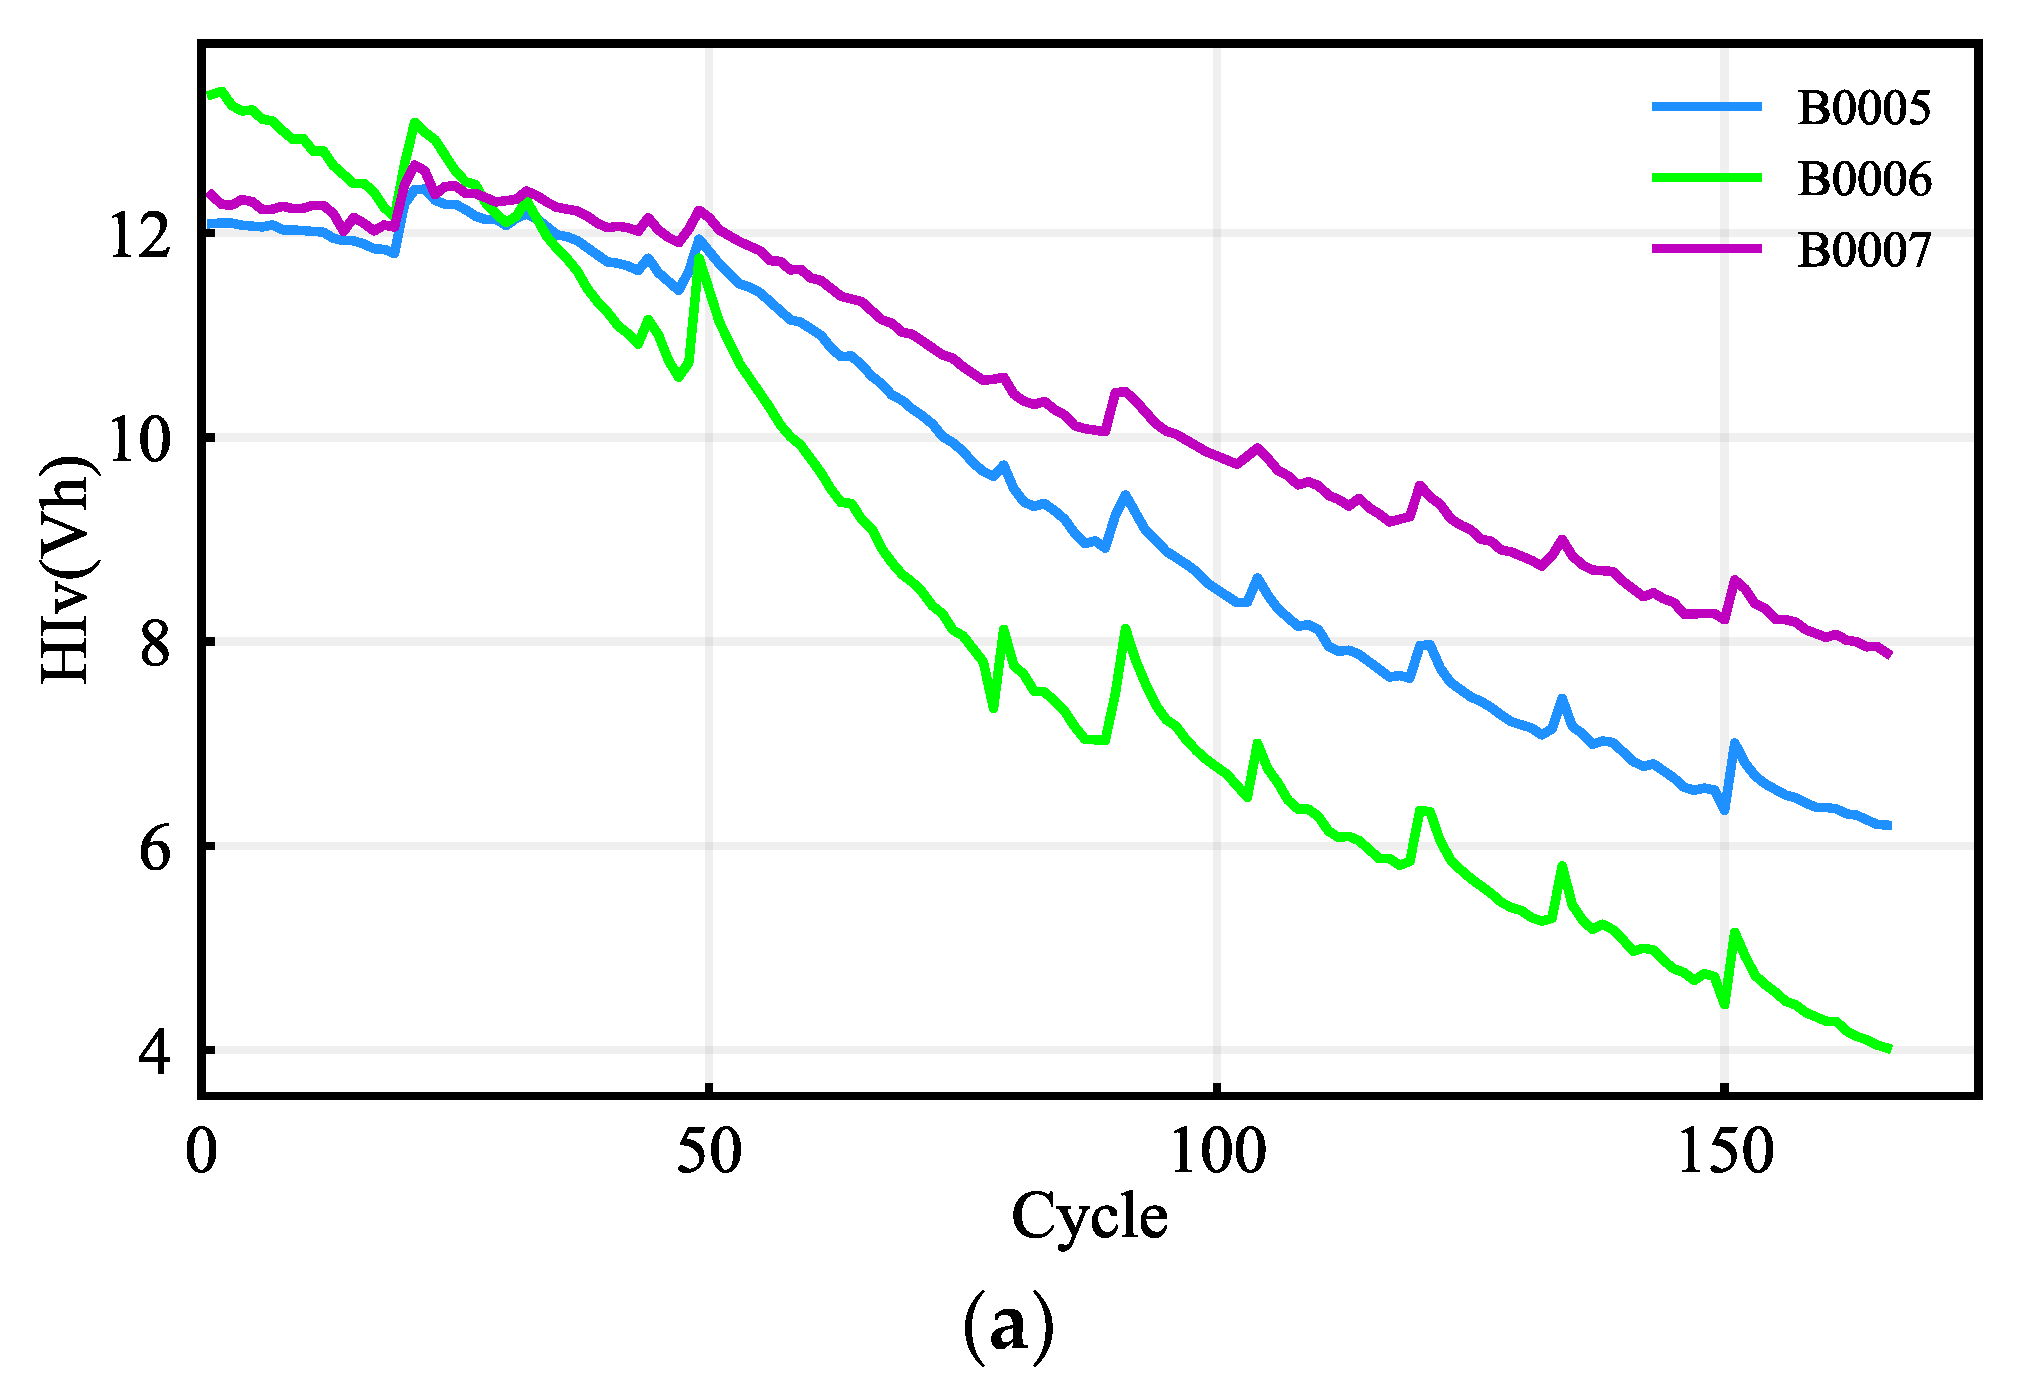
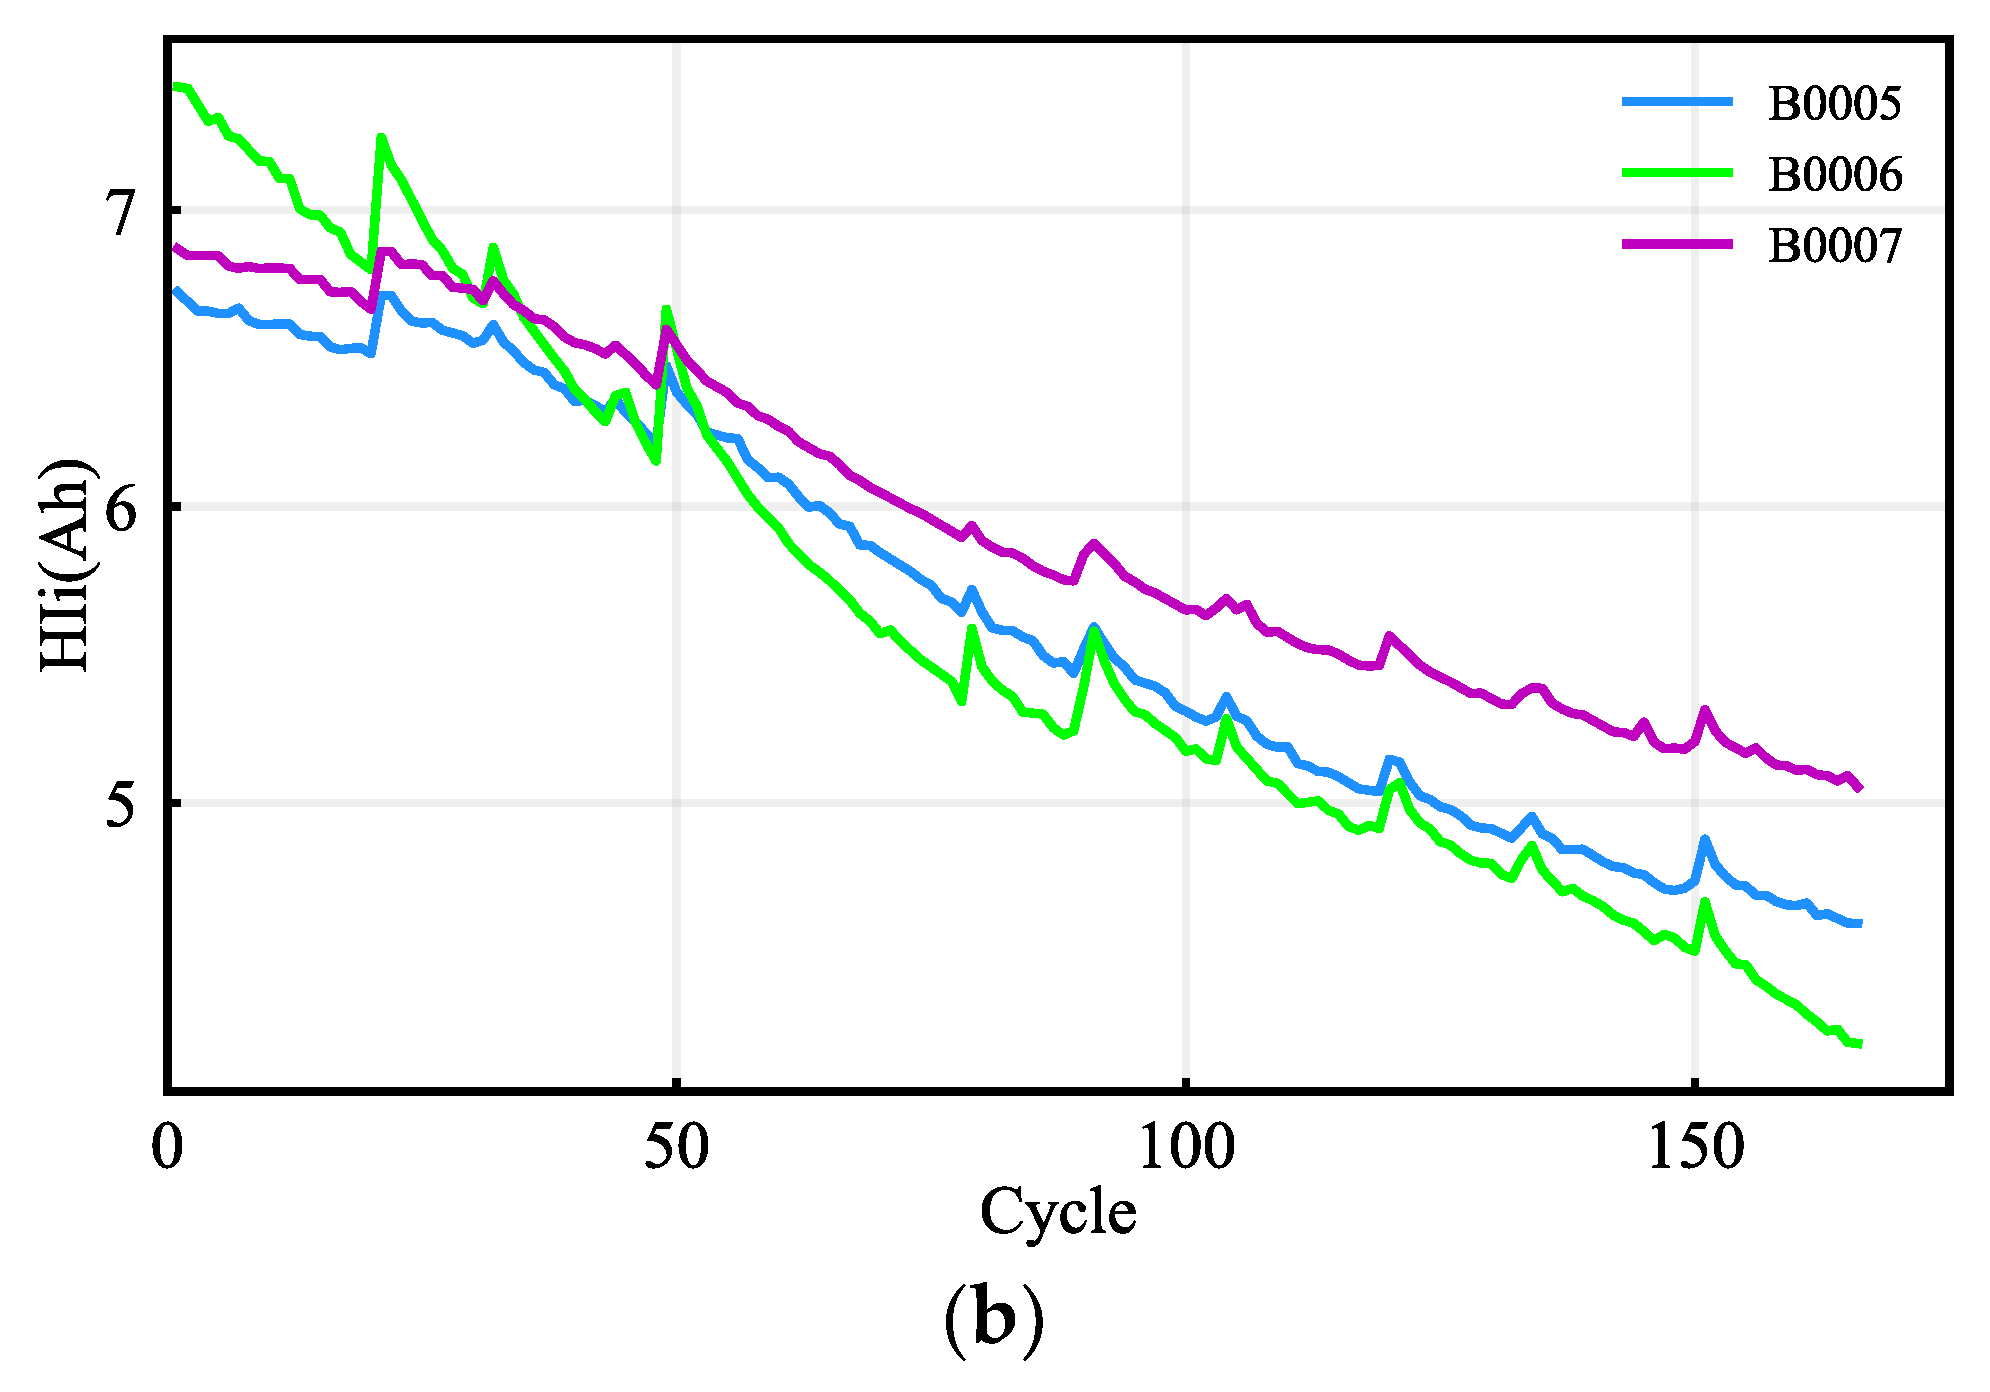
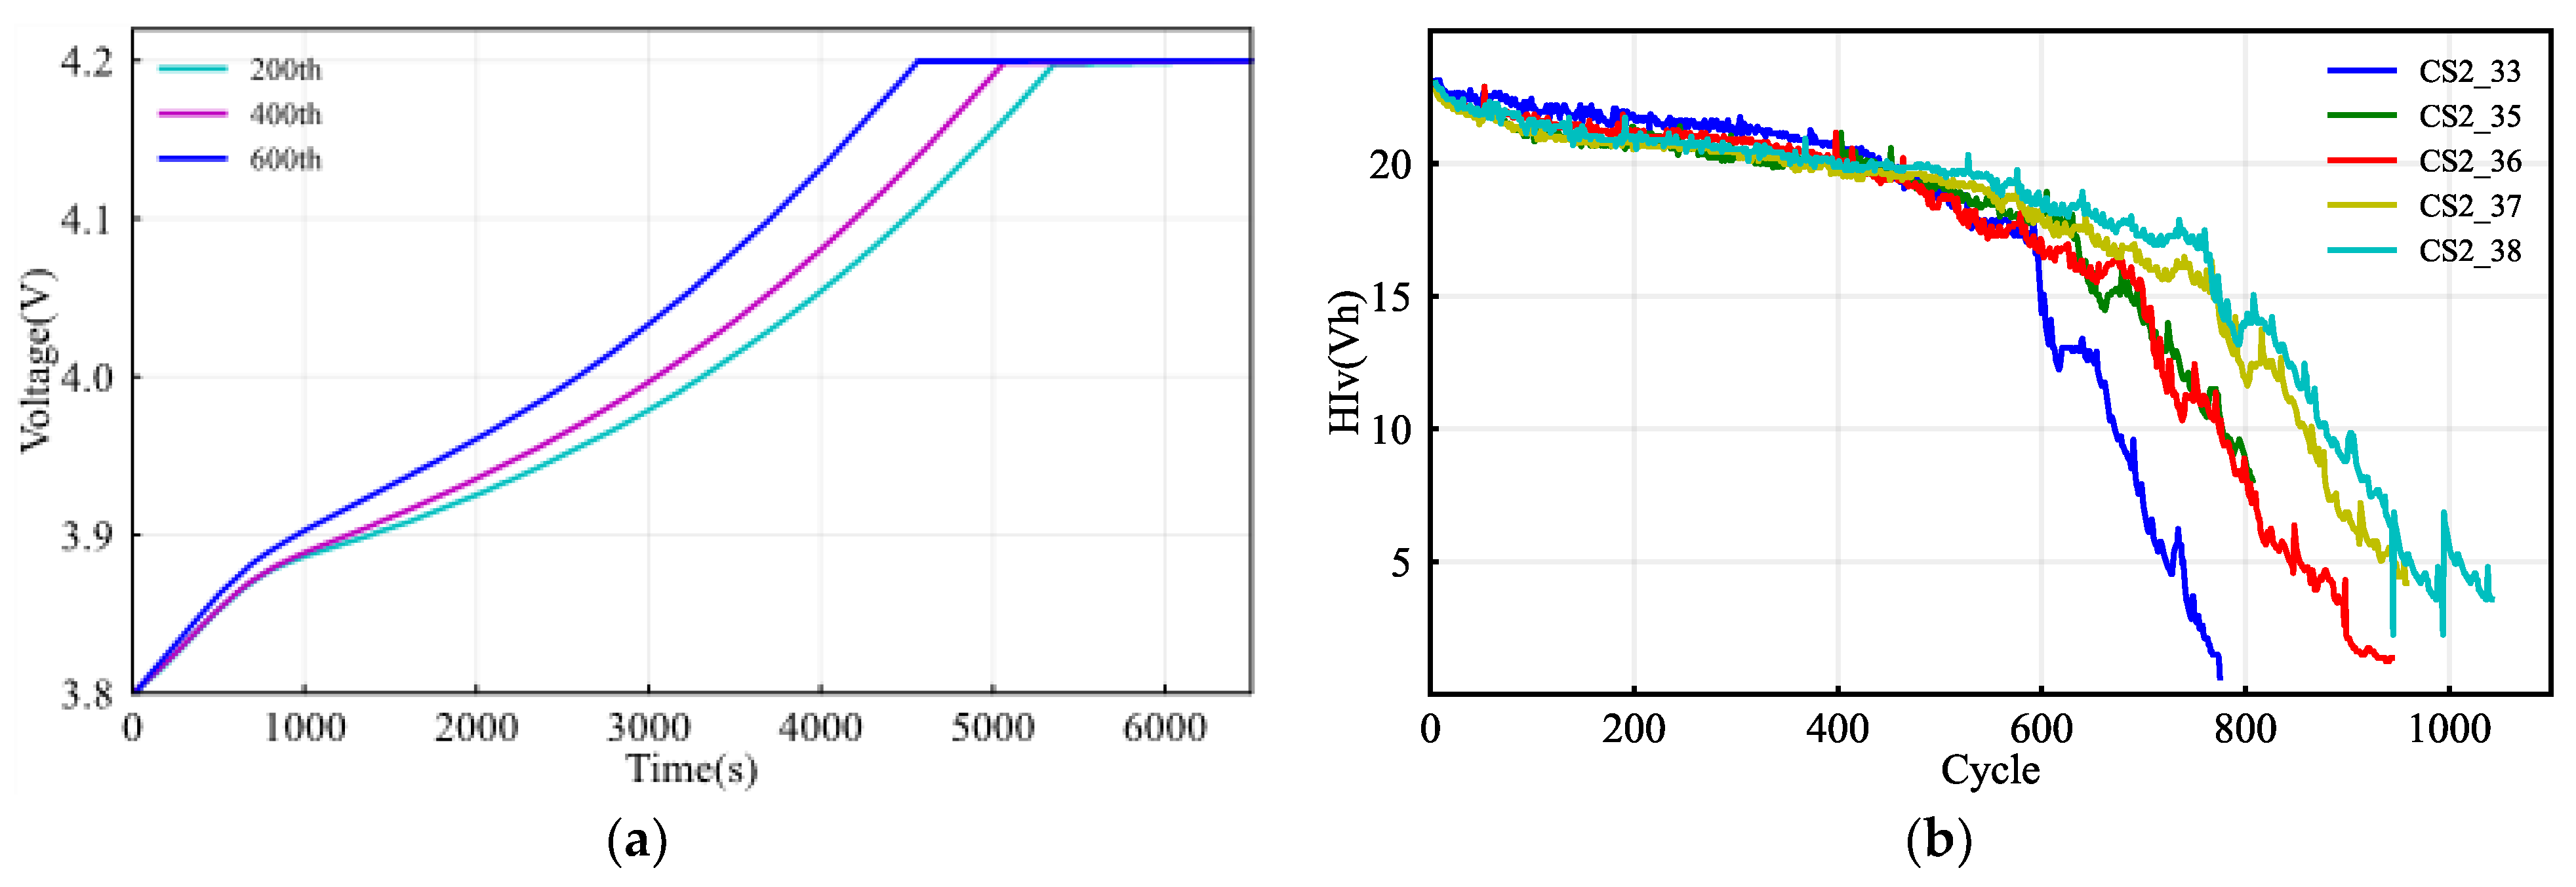
2.3. Health Indicator Extraction

In some articles, health indicators are extracted from the discharging process [39], but this is not practical due to the complex and inconsistent discharging scenario, especially for electric vehicles (EVs) [40]. Therefore, in this paper we extract the health indicators from the controllable and monolithic charging process to estimate the current online SOH.
Figure 3 represents the related terminal voltage and current curves for the NASA batteries during the CC–CV charging process. Figure 3a shows the terminal voltage responses extracted from a partial voltage segment of a single cell during different cycles. The terminal voltage gets higher and reaches the cut-off voltage earlier as the cycle number increases. Therefore, the voltage integration from the 3.8–4.2 V terminal voltage varies regularly with the number of cycles. Consequently, this partial voltage integration can indicate the cell’s health status, which is denoted as HIv and calculated as follows:
H I v = t = t 0 t = t 1 v ( t ) d t
where v(t) represents the terminal voltage function versus time, and t0 and t1 denote the moments at which the voltage equals 3.8 V and 4.2 V, respectively. The plots of HIv values versus the cycles for different cells from the NASA repository are represented in Figure 4a.
Besides the charge terminal voltage, Figure 3b compares the whole current curves during different cycles and shows that the corresponding current decreases as the number of cycles increases. Consequently, the integration, calculated from the charging process, can be viewed as a health indicator and denoted as HIi. This current integration is the charging capacity and can be calculated as follows:
H I i = t = t 0 t = t 1 i ( t ) d t
where i(t) represents the corresponding charge current, and t0 and t1 denote the charge start and end moments, respectively. The HIi curves for different cells from the NASA repository are shown in Figure 4b.
As the partial charge voltage segment is more easily accessible than the whole charging current, we only employ the HIv as the health indicator for the CALCE batteries to avoid current sampling interference. Figure 5a illustrates the corresponding terminal voltage curves during different cycles of battery CS2-35, and the corresponding HIv values versus the cycle number are represented in Figure 5b. As can be seen in Figure 5b, the HIv values degrade with more noise than the corresponding SOH values compared with those in Figure 2.

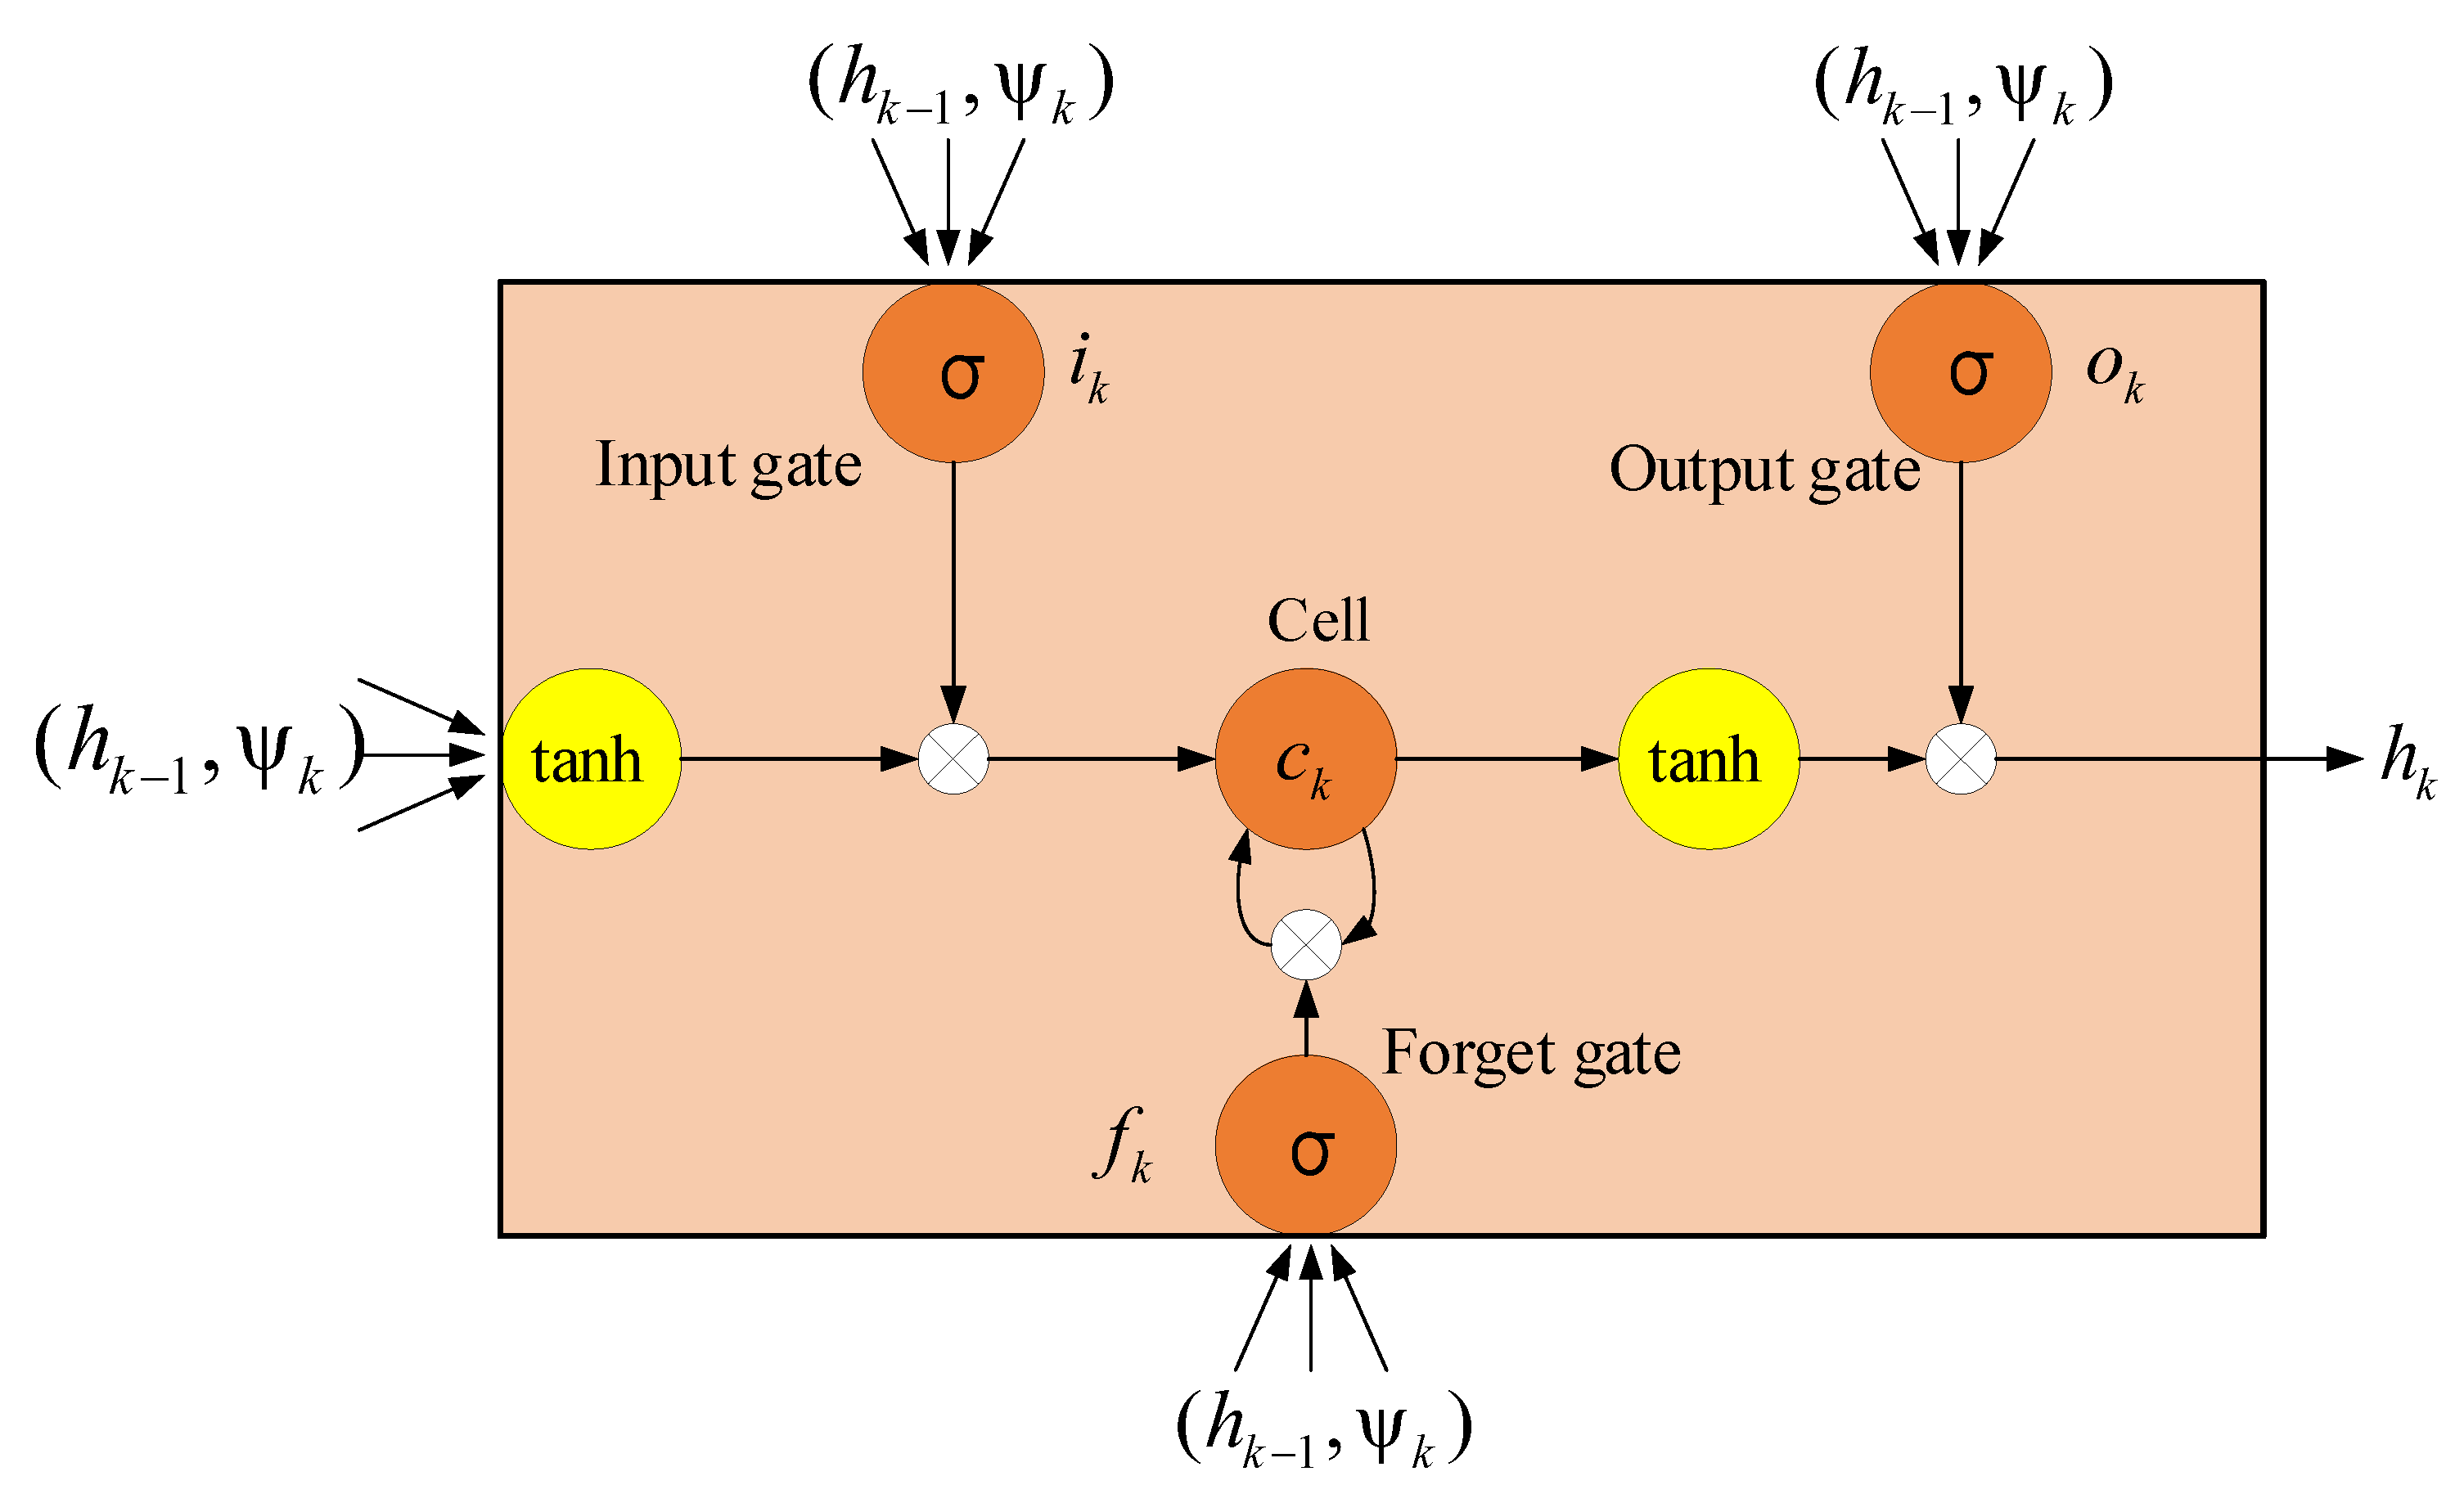
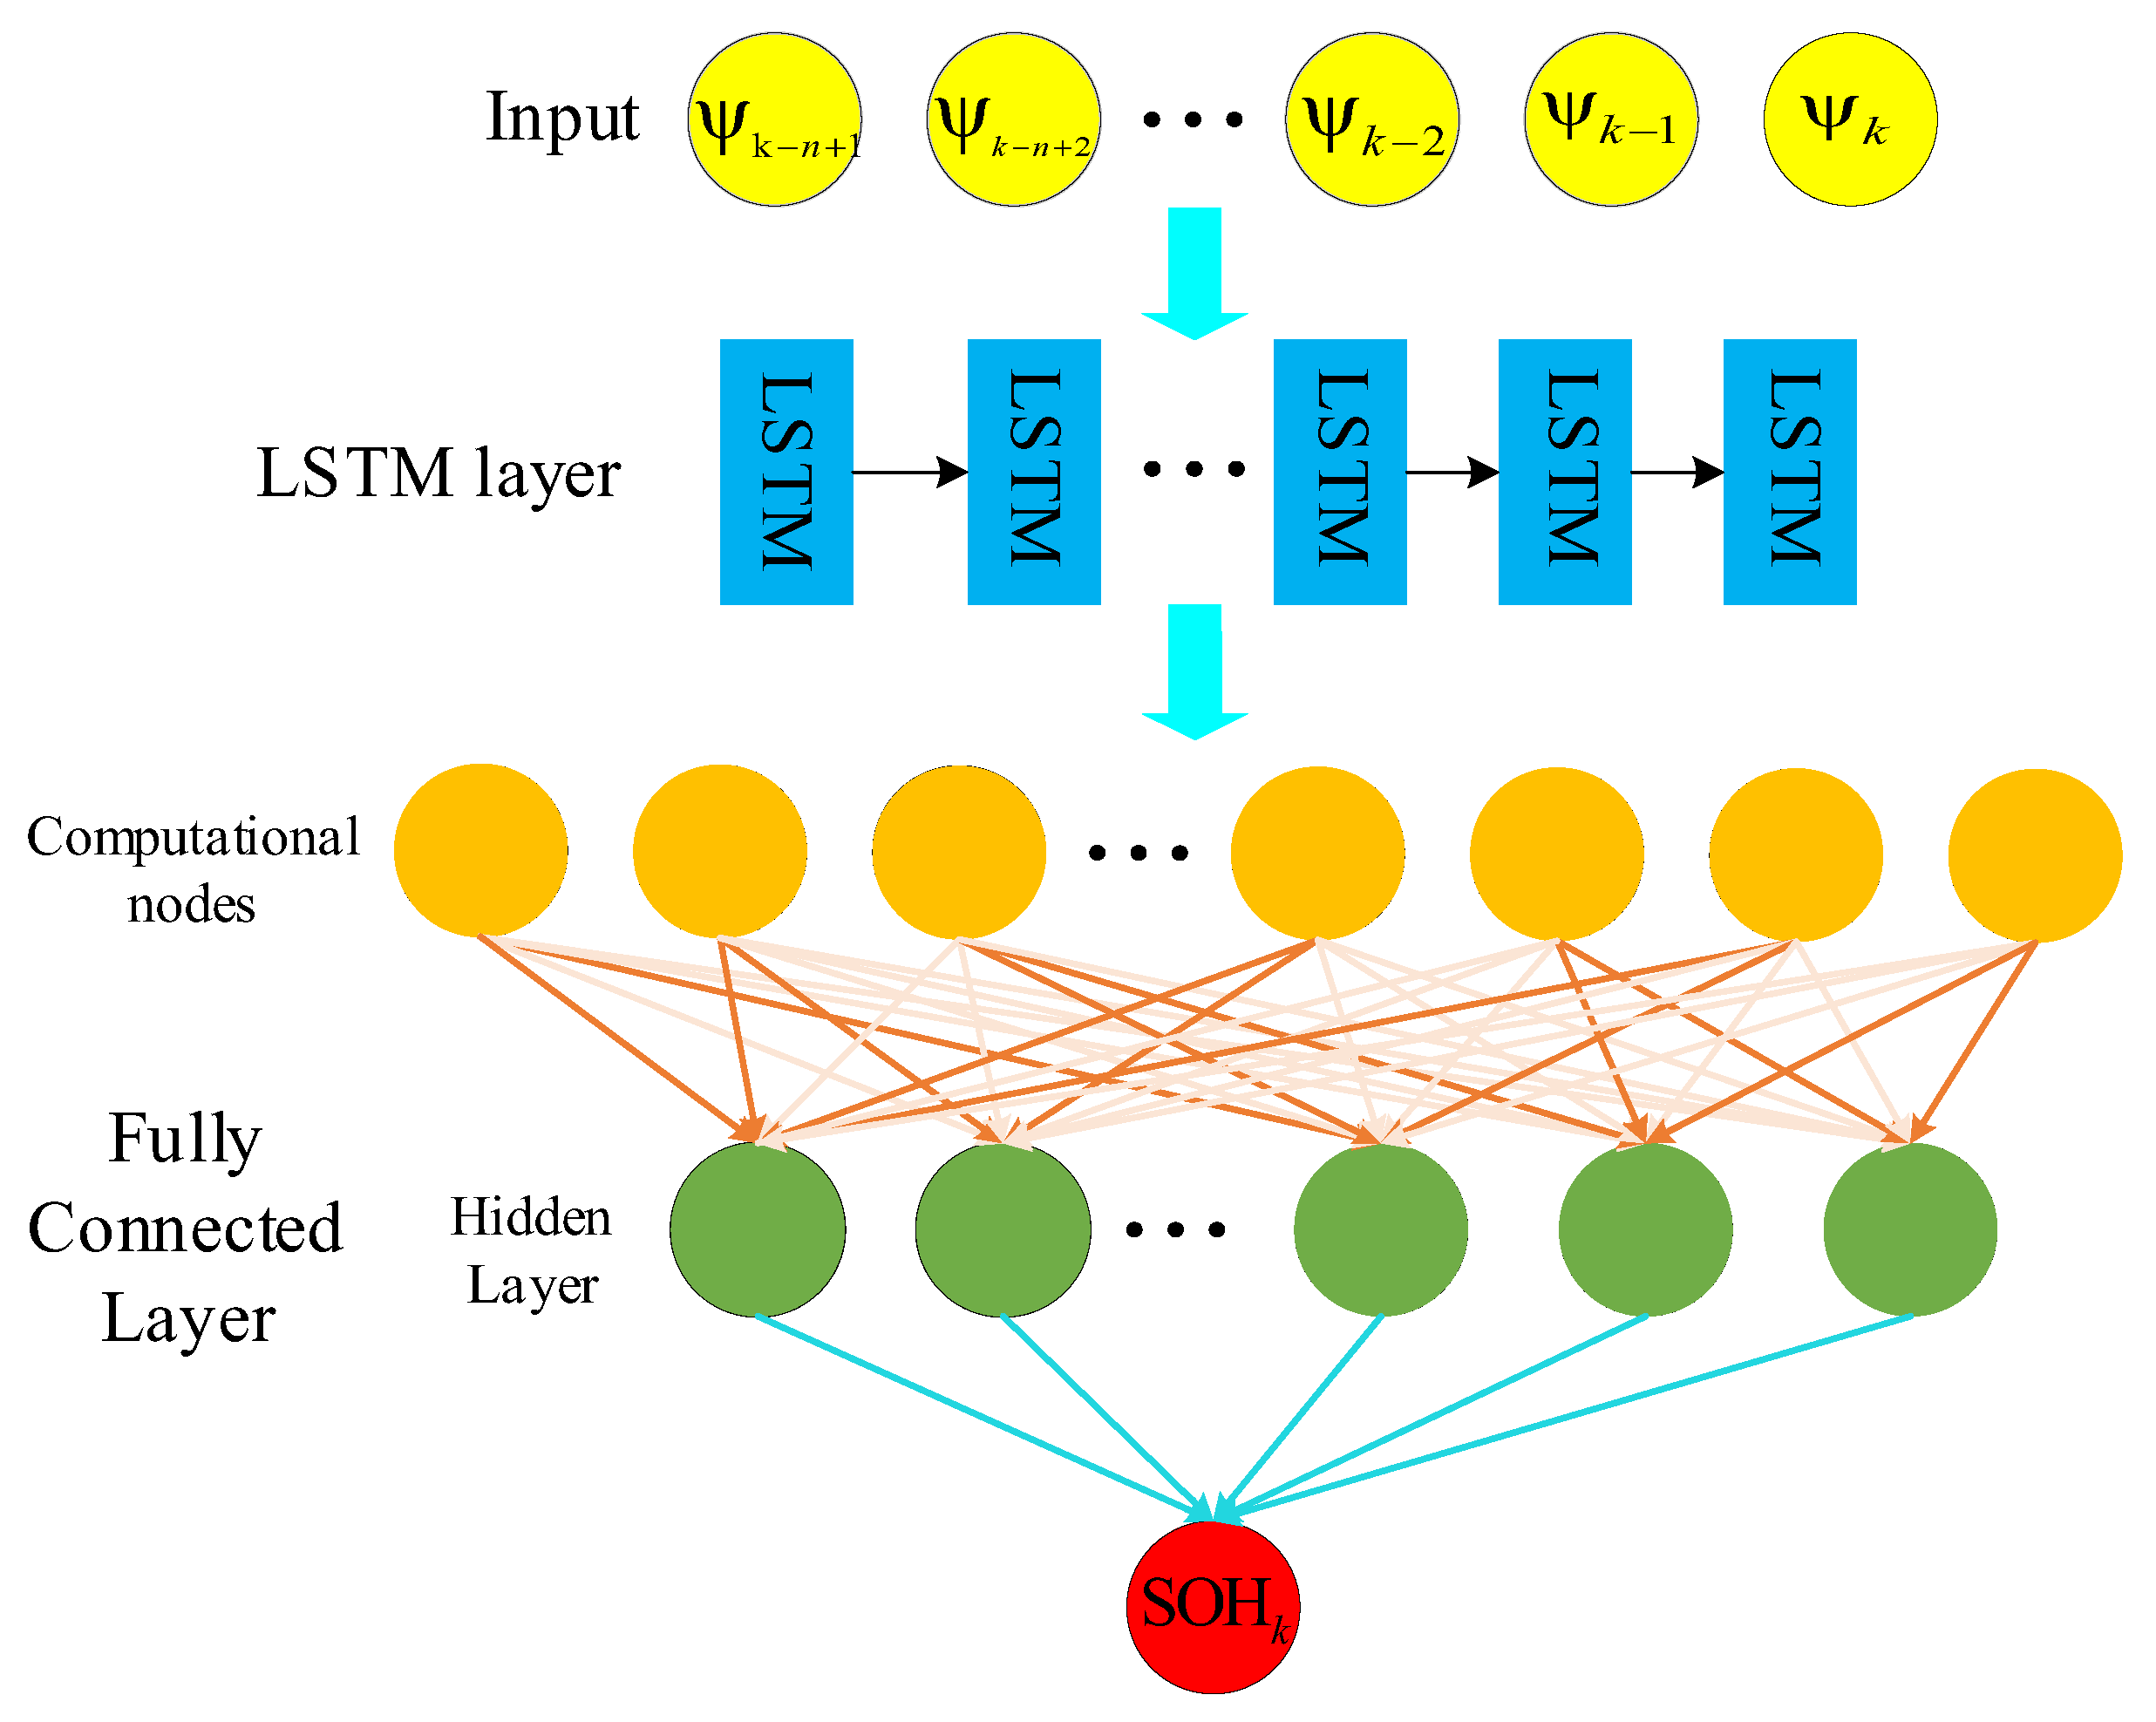
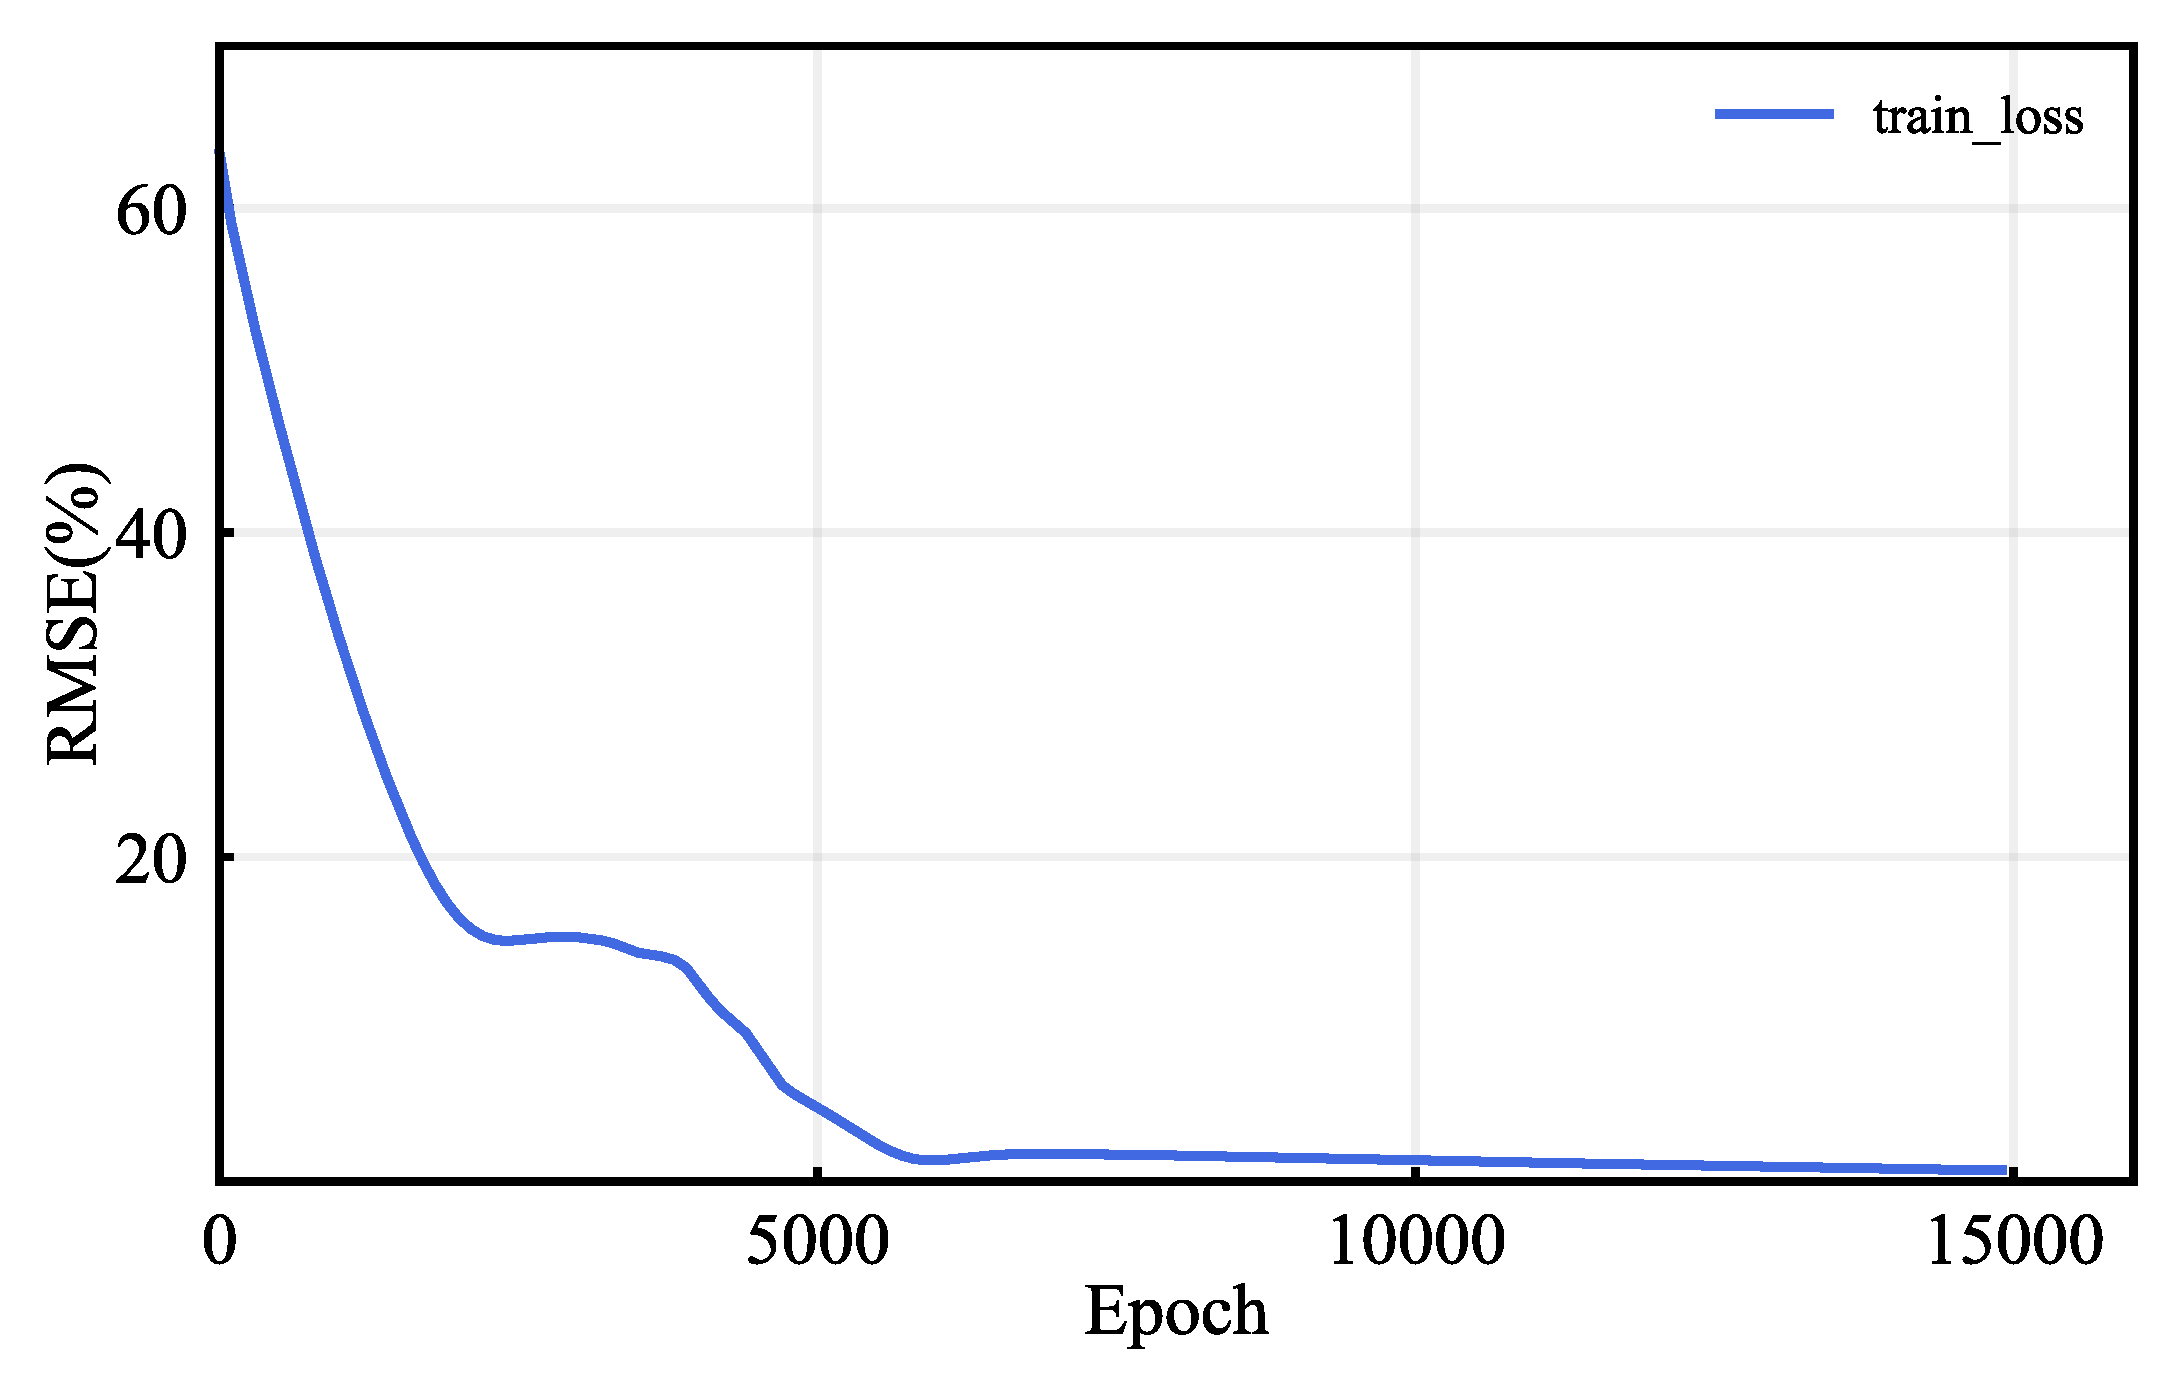
3. LSTM-RNN Algorithm

Due to their “memory” characteristics, RNNs are suitable for this type of time-series data estimation [33]. However, conventional RNNs have issues in learning long-term dependencies where the gradients may either vanish or explode during backpropagation [34]. To address this problem, an LSTM-RNN was proposed to capture long-term dependencies within the sequence by remembering information over long periods [35]. Therefore, this paper utilizes an LSTM-RNN to estimate the SOH of lithium-ion batteries.
Figure 6 schematically illustrates the network architecture of LSTM-RNN, which can work as a nonlinear dynamic system by mapping input vectors to output sequences. The LSTM cell is equipped with a memory cell ck, which is the key part of the structure and stores the long-term dependencies. In addition, the input, output, and forget gates are distinctive features of the LSTM-RNN and can regulate the information flow. Each gate is a sigmoid unit (σ) that is activated from the hidden layer at the last time step hk−1 and from the present input layer ψk. The constructed LSTM-RNN can be represented by the composite function below:
i k = σ ( W ψ i ψ k + W h i h k 1 + b i ) f k = σ ( W ψ f ψ k + W h f h k 1 + b f ) c k = f k c k 1 + i k tanh ( W ψ c ψ k + W h c h k 1 + b c ) o k = σ ( W ψ o ψ k + W h o h k 1 + b o ) h k = o k tanh ( c k )
where h0 is the initial hidden state, σ denotes the sigmoid function, and i, f, c, and o are the input gate, forget gate, memory cell, and output gate, respectively. These gates can inhibit the flow of information by setting the value of the sigmoid unit as 0 from the current input layer ψk and the hidden layer at the last time step hk−1. The W and b values are the network weights and biases, respectively. The subscripts of W describe the interaction occurring between the two corresponding components, e.g., Wψi denotes the input–input gate matrix and Whi denotes the hidden–input gate matrix. At each gate, a bias b is added to the matrix multiplication to increase the computing flexibility.
When we exploit the LSTM-RNN to estimate online SOH, the network initially needs to be trained with a series of sequences from the dataset. In order to take full advantage of the LSTM’s ability to capture long-term dependencies, this work utilizes n-step (n equals 10) input vectors to estimate one SOH value. Therefore, a typical dataset used to train the network is given by D = ((ψ1, ψ2, …, ψn, SOHn*), (ψ2, ψ3, …, ψn+1, SOHn+1*), … (ψk−n+1, ψk−n+2, …, ψk, SOHk*), …, (ψN−n+1, ψN−n+2, …, ψN, SOHN*)), where SOHk* denotes the ground-true value at cycle k and ψk is the vector of inputs at cycle k. After the LSTM-RNN, a fully connected layer linearly transforms the hidden state tensor hk to obtain a single estimated SOH value. The fully connected layer achieving the regression is given by:
S O H k = V o u t h k + b f
where Vout and bf are the weight matrix and biases of the fully connected layer, respectively. The whole training and SOH estimating process structure is shown in Figure 7. Consequently, we can estimate the online SOH using the trained LSTM-RNN with the testing input vectors.

4. SOH Estimation Results and Analysis

This section implements the proposed LSTM-RNN to estimate the online SOH of batteries as they age using the two public datasets introduced above. Considering the stable and monolithic charging scenario, we can extract the health indicators from the partial charging voltage segment and the charging current, respectively, to estimate the corresponding SOH. The kth vector of inputs, consisting of the health indicators fed into LSTM-RNN, is described as ψk, where k denotes the kth charging cycle. The following two subsections investigate and verify the performance of the proposed SOH estimation technique using the NASA and CALCE battery datasets, respectively.

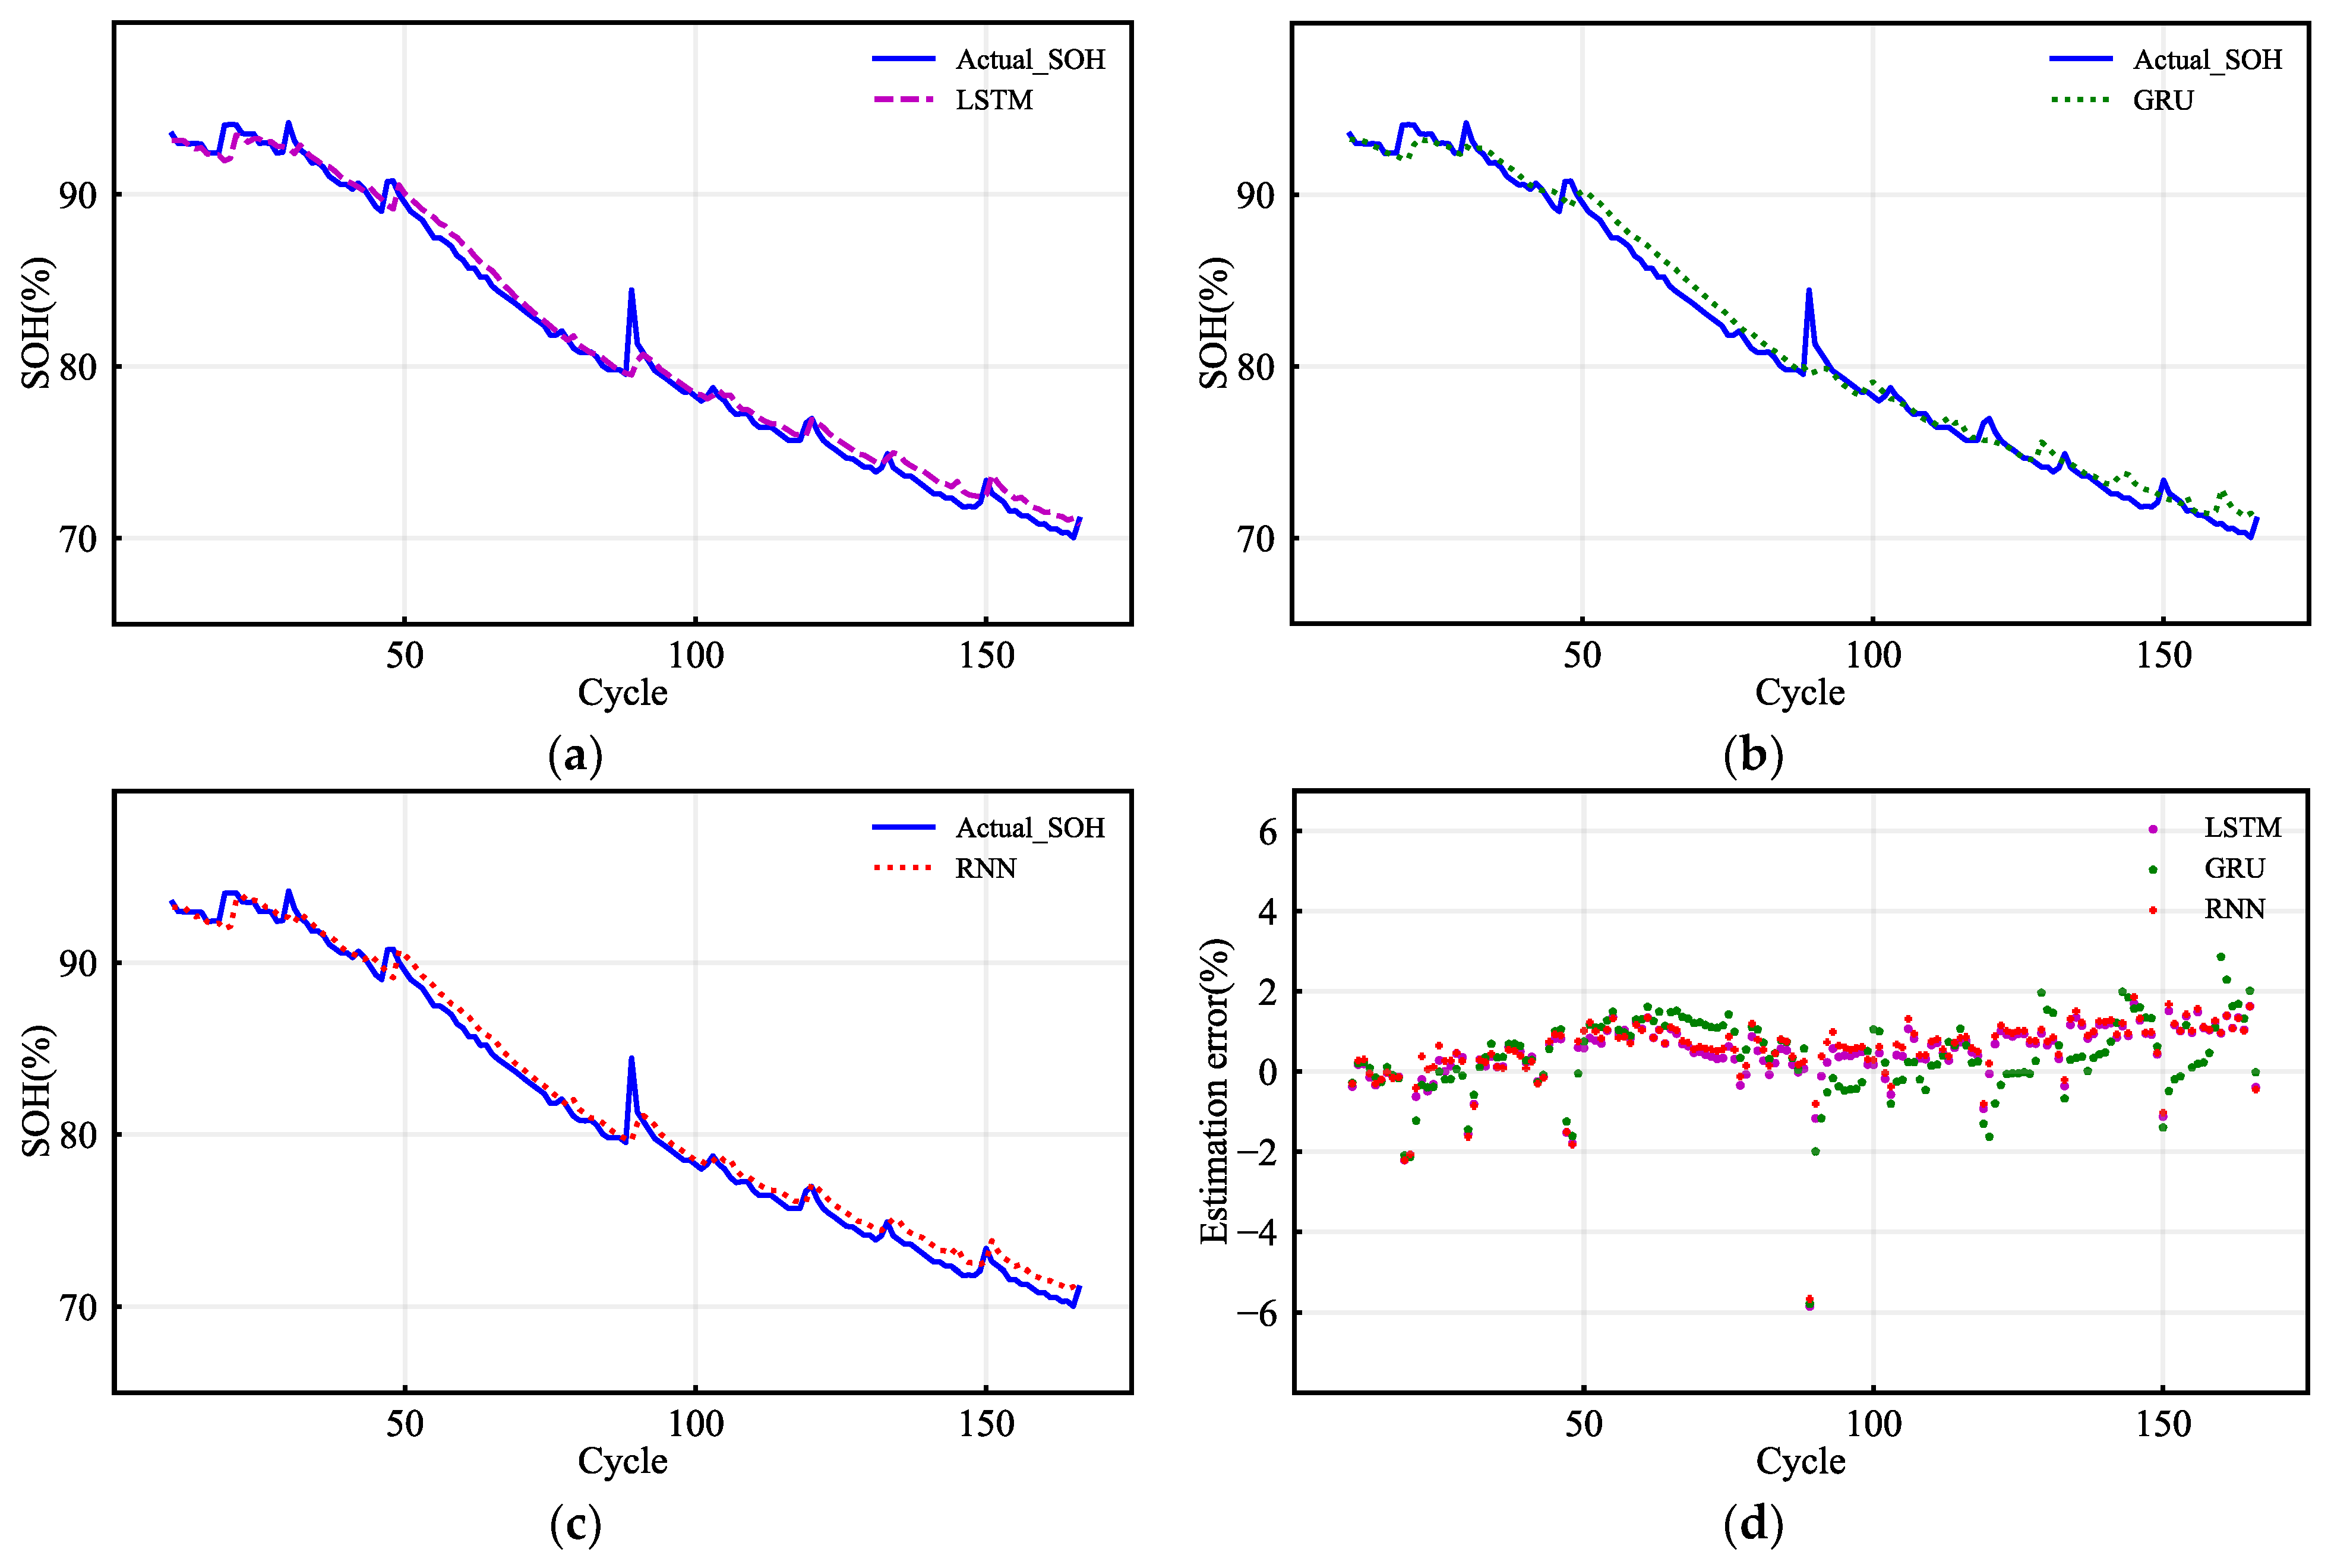
4.1. SOH Estimation Based on the NASA Battery Dataset

Section 2 introduced the cyclic experiment with the battery datasets. Considering the varying information in the whole life cycle of the batteries, we train the LSTM-RNN using the entire battery samples rather than partial data from the whole cycling life, since this is more compatible with the intended practical application. Specifically, the initial training uses 80% of the battery B0005 and B0006 datasets, whereas cross-validation uses the remaining 20%. The dataset from cell B0007 is for testing. The validation serves the hyper-parameters adjustment, and the testing achieves the performance assessment. After completing the parameter configuration, we retrain the model with the datasets from batteries B0005 and B0006. As mentioned above, the vector of inputs ψk fed into the LSTM in the experiment using the NASA dataset is defined as ψk = (HIv, HIi), where HIv denotes the voltage integration from the partial voltage segment and HIi represents the charging capacity in the charging process. All the experiments were implemented using Python 3.9.12 on a laptop equipped with an Intel Core i5-8300H processor.
To perform the online SOH estimation, we explore a vanilla LSTM with one single hidden layer to reduce the model complexity and parameter settings. In the training process, the LSTM network can reach higher predicting accuracy when its layer owns more computational nodes. However, the network is prone to overfitting when the layer is equipped with large computational nodes. Combining with the cross-validation, we set 128 computational nodes in the layer and select the mean square error (MSE) as the optimization goal, which can be calculated as:
MSE = 1 m i = 1 m ( SOH i SOH i * )
where m is the number of examples in one batch, SOHi* is the predicted SOH for the ith example, and SOHi is the ith actual value.
For the evaluation of the performance of the algorithms in the testing stage, the error metrics are given in terms of the root mean square error (RMSE) and mean absolute error (MAE) in the following equations:
RMSE = 1 m i = 1 m ( SOH i SOH i * ) 2
MAE = 1 m i = 1 m | SOH i SOH i * |
where the root mean square error (RMSE) is sensitive to the large errors, and the mean absolute error reflects how close the estimated SOH is to the real SOH, regardless of the sign.
Having features on a similar scale helps the gradient descent converge more smoothly and quickly toward the minima. We standardize the features by removing the mean and scaling to unit variance to transform the health indicators into a similar scale. The stand score of a sample x is calculated as:
z = ( x u ) s
where u is the mean of the training samples and s is the deviation of the training samples. The testing samples are transformed based on the mean and deviation of the training samples.
To minimize the MSE loss, the network weights W and biases b are updated through every training epoch ϵ, which includes one forward and one backward pass. Based on the gradient of the MSE loss function, the Adam optimization algorithm [41] was utilized to update the parameters and is given by the following:
m ε = β 1 m ε 1 L ( W ε 1 ) r ε = β 2 r ε 1 L ( W ε 1 ) 2 m ˜ ε = m ε / ( 1 β 1 ε ) r ˜ ε = r ε / ( 1 β 2 ε ) W ε = W ε 1 α m ˜ ε r ˜ ε k
where β1 and β2 are decay rates set to 0.9 and 0.999, respectively, L denotes the loss function, α is the learning rate, and constant term k is set to 10−8. represents the matrix of network parameters at the current training epoch. More details about the Adam optimization method can be found in [41].
We routinely use cross-validation to evaluate model performance to obtain adequate hyper-parameters. In combination with the cross-validation technique, we set the training epochs as 15,000. Figure 8 displays a plot of the RMSE as a function versus the training epoch. As can be observed, the RMSE drops fast in the first 5000 epochs and almost reaches 0 after 12,000 epochs. Due to the decreasing tendency after 12,000 epochs, 15,000 is considered a reasonable number of training epochs. We choose a batch size of 64 to train the network as a compromise between the large and small batches. All the parameters of the LSTM-RNN are listed in Table 1.
In the online SOH estimation, we compare the LSTM-RNN with the gated recurrent unit recurrent neural network (GRU-RNN) and simple recurrent neural network (Sim-RNN) to demonstrate its effectiveness and performance. In order to carry out a fair comparison, the RNN and GRU algorithms are provided with the same structure and parameters as the LSTM, except for the main RNN and GRU working layers. The Sim-RNN and GRU-RNN are given 15,000 and 25,000 epochs, respectively, to achieve converging loss in the training process. The computational time required to train the LSTM-RNN, Sim-RNN, and GRU-RNN is around 18.1 min, 13.8 min, and 30.6 min, respectively. Consequently, more training epochs for the GRU-RNN incur a longer training time.
Figure 9 shows the online SOH estimation results for cell B0007 using the three networks. As can be seen, the SOH predictions of the three networks generally follow the actual SOH values. The estimation errors of the LSTM-RNN, Sim-RNN, and GRU-RNN are plotted in Figure 9d, and all the estimation errors of the three different networks stay approximately within 2%. The test results from the LSTM-RNN, Sim-RNN, and GRU-RNN algorithms are listed in Table 2. The overall RMSE and MAE of the LSTM are 0.5623% and 0.5746%, respectively (slighter smaller than those of the GRU and RNN). Therefore, the proposed SOH estimator can accurately estimate the online SOH with the extracted HIs based on the charging process in this experiment.

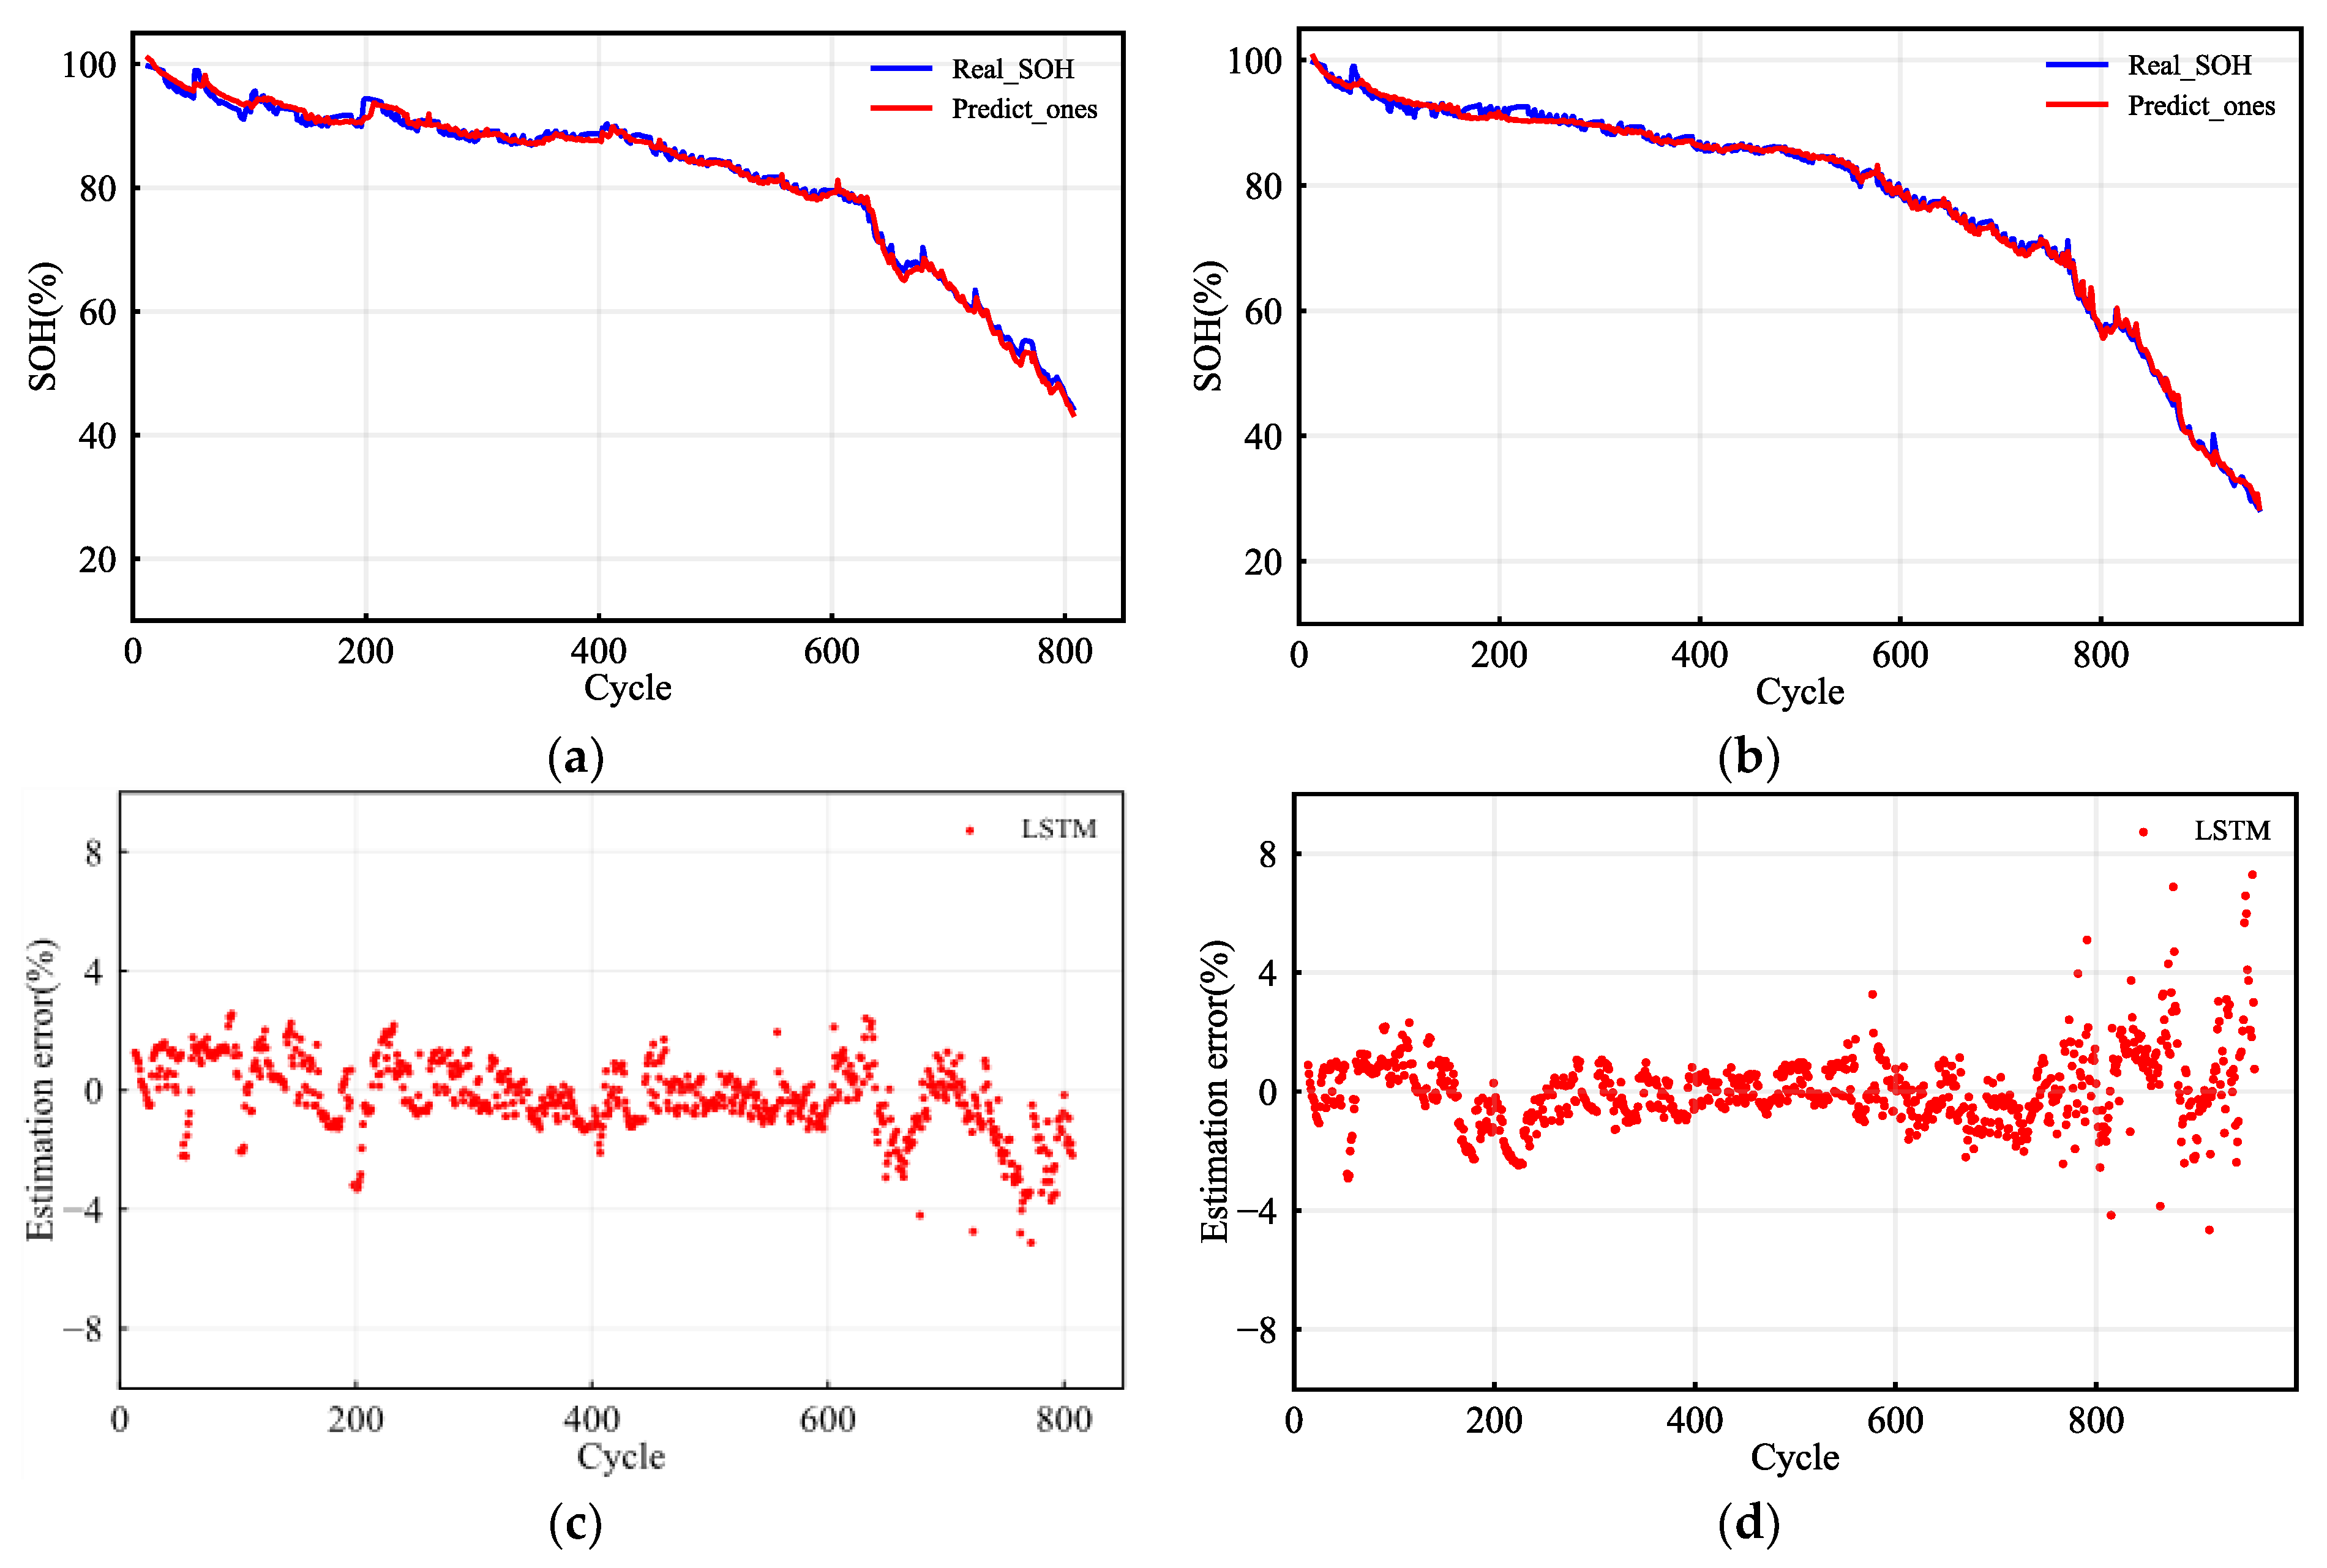
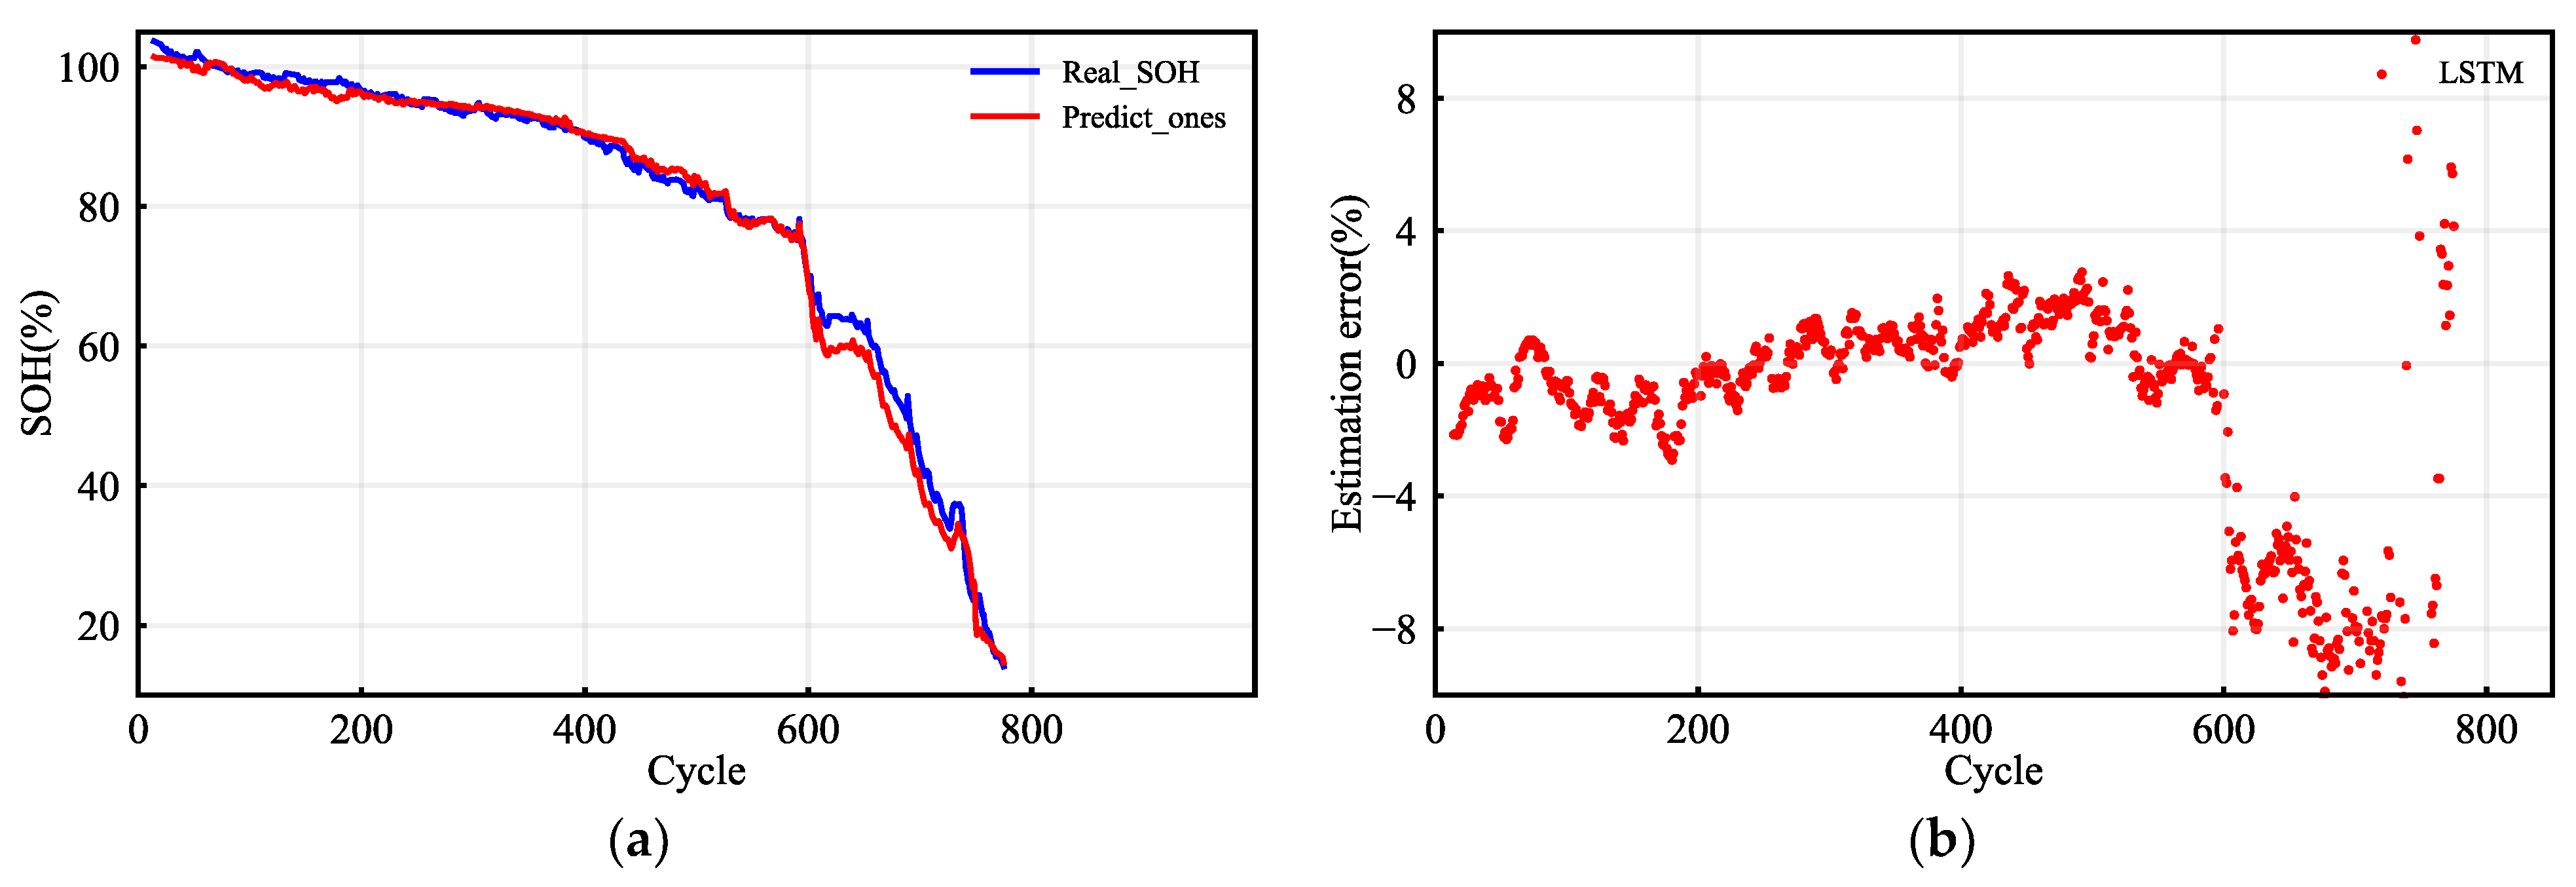
4.2. SOH Estimation Based on the CALCE Battery Dataset

To validate the generality of the proposed LSTM-RNN, we further employ the CALCE battery dataset to establish its effectiveness. As mentioned above, the input vector, fed into the LSTM network, only contains one health indicator HIv in the CALCE battery dataset experiment. Excluding the HIi optimizes the online SOH estimation process by avoiding interference from the electric current sampling process.
Similarly, the training and cross-validation are performed on the cyclic data of batteries CS2-36 and CS2-38, while the testing is achieved using the remaining battery datasets. The parameters of this LSTM-RNN are virtually the same as those in Table 1, except that the batch size is 128. Additionally, we continue to train the model using 15,000 training epochs. The computation time for training the LSTM-RNN based on cells CS2-36 and CS2-38 is 32.0 min.
Figure 10 shows the estimation performance on batteries CS2-35 and CS2-37, which underwent the 1 C discharging rate. Figure 10a,b represent the corresponding SOH estimation results for batteries CS2-35 and CS2-37. The overall RMSE achieved on the two batteries is 0.9311% and 0.8288%, respectively. The overall RMSE and MAE performance metrics for batteries CS2-35 and CS2-37 are listed in Table 3. Moreover, the estimation errors of each cycle for the two testing cases are plotted in Figure 10c,d, and the errors mainly stay within 3%. Specifically, the estimation root mean square errors above 80% SOH (safe battery operating range) generally fall within 2% and are smaller than those estimated in the final phase. Moreover, the SOH estimation results from the LSTM-RNN eliminate the impact of the input noise from the HIv extraction process shown in Figure 5b.
To evaluate the robustness of the trained LSTM-RNN model against different discharging current rates, battery CS2-33, which underwent a 0.5 C discharging rate, was used to validate the estimator. Figure 11a,b show the estimation results and the estimation errors of each cycle, respectively. The SOH estimations above 80% SOH are close to the actual values at different cycles, and the corresponding estimation errors are almost within 3%. However, the SOH estimation errors of the LSTM-RNN model are relatively large for the cycles in which the SOH is below 80%. The overall RMSE of the estimation result for battery CS2-33 is 2.0384%, and the MAE is 1.495%, as listed in Table 3. Since lithium-ion batteries generally operate within a certain range for a safety, evaluating the estimator performance above 80% SOH is more practical and critical. Table 4 shows that the overall RMSE of the estimation results above 80% SOH for the battery CS2-33 is 1.1198%, and the MAE 0.9454%, a result approaching the estimation performance of the developed LSTM-RNN for batteries CS2-35 and CS2-37, which means that the trained LSTM network possesses a certain degree of robustness against the different discharging current rates.
From the preceding experiments and analysis, we can conclude that the proposed LSTM-RNN-based estimator can accurately estimate online SOH with robustness against different discharging current rates for different battery types.

5. Conclusions

State of health illustrates the aging of lithium-ion batteries and accurate SOH estimation provides a basis for lithium-ion battery maintenance and replacement. As the characteristics of the LSTM-RNN enable it to address the time series predicting problem, this paper mainly uses an LSTM-RNN model to estimate the online SOH of lithium-ion batteries with a stable and monolithic charging process.
In the final analysis, the primary benefit of this approach is that it accurately estimates SOH by effectively leveraging the properties of time series to infer long dependencies from offline battery data. Due to the one hidden layer on the LSTM-RNN, this method can be accomplished with less model complexity and fewer parameter sets than other data-driven approaches. Additionally, the proposed LSTM-RNN can directly map battery measurement signals such as voltage and current to the online SOH, avoiding the inference algorithms and intensively computational filter techniques used in model-based SOH estimators.
Experimental studies using two different battery datasets illustrate the performance and adaptability of this type of data-driven algorithm in the SOH estimation of lithium-ion batteries. In summary, the proposed LSTM-RNN achieves good performance in the NASA battery dataset with an overall RMSE of 0.5623% and shows robustness against the battery discharging rate when applied to the CALCE battery dataset. In addition, the experiment results show that the LSTM-RNN produces more accurate lithium-ion battery SOH estimates than the gated recurrent unit recurrent neural network (GRU-RNN) and simple recurrent neural network (Sim-RNN). Since the SOH estimator is developed based on the charging process rather than the complex discharging scenario, we can use this estimator in many practical applications for online SOH estimation.

Author Contributions

Conceptualization, K.L.; methodology, K.L.; software, K.L.; validation, D.X. and L.K.; formal analysis, K.L.; resources, K.L.; data curation, K.L. and D.X.; writing—original draft preparation, K.L.; writing—review and editing, K.L.; supervision, L.K. and D.X.; project administration, L.K.; funding acquisition, L.K. All authors have read and agreed to the published version of the manuscript.

Funding

This research was funded by the Guangdong Basic and Applied Basic Research Foundation, grant number No. 2022A1515140009.

Data Availability Statement

Not applicable.

Acknowledgments

The authors gratefully thank the NASA Ames Centers of Excellence Diagnostic Center and the Center for Advanced Life Cycle Engineering (CALCE) of the University of Maryland for providing the experimental data.

Conflicts of Interest

The authors declare no conflict of interest.

Appendix A

Table A1. Abbreviation comparison table.
AbbreviationExplanation
SOHState of health
LIBLithium-ion battery
LSTMLong short-term memory
HIHealth indicator
SOCState of charge
RMSERoot mean square error
MAEMean absolute error
EVElectirc vehicle
BMSBattery manangement system
PFParticle filter
KFKalma filter
SEISolid electrolyte interface
SVMSupport vector machine
GPRGaussian process regression
NNNeural network
RVMRelevance vector machine
NASANational Aeronautics and Space Administration
PCoEPrognostics Center of Excellence
CALCECenter for Advanced Life Cycle Engineering
CC–CVConstant current–constant voltage
GRUGated recurrent unit
Sim-RNNSimple recurrent neural network

References

  1. Jaguemont, J.; Boulon, L.; Dubé, Y. A comprehensive review of lithium-ion batteries used in hybrid and electric vehicles at cold temperatures. Appl. Energy 2016, 164, 99–114. [Google Scholar] [CrossRef]
  2. Choi, S.; Wang, G. Advanced lithium-ion batteries for practical applications: Technology, development, and future perspectives. Adv. Mater. Technol. 2018, 3, 1700376. [Google Scholar] [CrossRef]
  3. Koorata, P.K.; Panchal, S.; Fraser, R.; Fowler, M. Combined influence of concentration-dependent properties, local deformation and boundary confinement on the migration of Li-ions in low-expansion electrode particle during lithiation. J. Energy Storage 2022, 52, 104908. [Google Scholar] [CrossRef]
  4. Han, X.; Ouyang, M.; Lu, L.; Li, J.; Zheng, Y.; Li, Z. A comparative study of commercial lithium ion battery cycle life in electrical vehicle: Aging mechanism identification. J. Power Sources 2014, 251, 38–54. [Google Scholar] [CrossRef]
  5. Xie, Y.; Li, W.; Hu, X.; Tran, M.-K.; Panchal, S.; Fowler, M.; Liu, K. Co-estimation of SOC and three-dimensional SOT for lithium-ion batteries based on distributed spatial-temporal online correction. IEEE Trans. Ind. Electron. 2022, 1–10. [Google Scholar] [CrossRef]
  6. Zhang, J.; Lee, J. A review on prognostics and health monitoring of Li-ion battery. J. Power Sources 2011, 196, 6007–6014. [Google Scholar] [CrossRef]
  7. Yalçın, S.; Panchal, S.; Herdem, M.S. A CNN-ABC model for estimation and optimization of heat generation rate and voltage distributions of lithium-ion batteries for electric vehicles. Int. J. Heat Mass Transf. 2022, 199, 123486. [Google Scholar] [CrossRef]
  8. Ng, K.S.; Moo, C.-S.; Chen, Y.-P.; Hsieh, Y.-C. Enhanced coulomb counting method for estimating state-of-charge and state-of-health of lithium-ion batteries. Appl. Energy 2009, 86, 1506–1511. [Google Scholar] [CrossRef]
  9. Chaoran, L.; Fei, X.; Yaxiang, F. An approach to lithium-ion battery SOH estimation based on convolutional neural network. Trans. China Electrotech. Soc. 2020, 35, 4106–4119. [Google Scholar] [CrossRef]
  10. Remmlinger, J.; Buchholz, M.; Meiler, M.; Bernreuter, P.; Dietmayer, K. State-of-health monitoring of lithium-ion batteries in electric vehicles by on-board internal resistance estimation. J. Power Sources 2011, 196, 5357–5363. [Google Scholar] [CrossRef]
  11. Iurilli, P.; Brivio, C.; Carrillo, R.E.; Wood, V. Physics-Based SoH Estimation for Li-Ion Cells. Batteries 2022, 8, 204. [Google Scholar] [CrossRef]
  12. Olarte, J.; Martinez de Ilarduya, J.; Zulueta, E.; Ferret, R.; Garcia-Ortega, J.; Lopez-Guede, J.M. Online Identification of VLRA Battery Model Parameters Using Electrochemical Impedance Spectroscopy. Batteries 2022, 8, 238. [Google Scholar] [CrossRef]
  13. Rahimi-Eichi, H.; Ojha, U.; Baronti, F.; Chow, M.-Y. Battery management system: An overview of its application in the smart grid and electric vehicles. IEEE Ind. Electron. Mag. 2013, 7, 4–16. [Google Scholar] [CrossRef]
  14. Xiong, R.; Tian, J.; Mu, H.; Wang, C. A systematic model-based degradation behavior recognition and health monitoring method for lithium-ion batteries. Appl. Energy 2017, 207, 372–383. [Google Scholar] [CrossRef]
  15. Bi, J.; Zhang, T.; Yu, H.; Kang, Y. State-of-health estimation of lithium-ion battery packs in electric vehicles based on genetic resampling particle filter. Appl. Energy 2016, 182, 558–568. [Google Scholar] [CrossRef] [Green Version]
  16. Prada, E.; Di Domenico, D.; Creff, Y.; Bernard, J.; Sauvant-Moynot, V.; Huet, F. A simplified electrochemical and thermal aging model of LiFePO4-graphite Li-ion batteries: Power and capacity fade simulations. J. Electrochem. Soc. 2013, 160, A616. [Google Scholar] [CrossRef] [Green Version]
  17. Li, J.; Adewuyi, K.; Lotfi, N.; Landers, R.G.; Park, J. A single particle model with chemical/mechanical degradation physics for lithium ion battery State of Health (SOH) estimation. Appl. Energy 2018, 212, 1178–1190. [Google Scholar] [CrossRef]
  18. Bartlett, A.; Marcicki, J.; Onori, S.; Rizzoni, G.; Yang, X.G.; Miller, T. Electrochemical model-based state of charge and capacity estimation for a composite electrode lithium-ion battery. IEEE Trans. Control. Syst. Technol. 2015, 24, 384–399. [Google Scholar] [CrossRef]
  19. Guha, A.; Patra, A. State of health estimation of lithium-ion batteries using capacity fade and internal resistance growth models. IEEE Trans. Transp. Electrif. 2017, 4, 135–146. [Google Scholar] [CrossRef]
  20. Tang, X.; Zou, C.; Yao, K.; Chen, G.; Liu, B.; He, Z.; Gao, F. A fast estimation algorithm for lithium-ion battery state of health. J. Power Sources 2018, 396, 453–458. [Google Scholar] [CrossRef]
  21. Ossai, C.I.; Raghavan, N. Statistical characterization of the state-of-health of lithium-ion batteries with Weibull distribution function—A consideration of random effect model in charge capacity decay estimation. Batteries 2017, 3, 32. [Google Scholar] [CrossRef] [Green Version]
  22. Seaman, A.; Dao, T.-S.; McPhee, J. A survey of mathematics-based equivalent-circuit and electrochemical battery models for hybrid and electric vehicle simulation. J. Power Sources 2014, 256, 410–423. [Google Scholar] [CrossRef] [Green Version]
  23. Fotouhi, A.; Auger, D.J.; Propp, K.; Longo, S.; Wild, M. A review on electric vehicle battery modelling: From Lithium-ion toward Lithium–Sulphur. Renew. Sustain. Energy Rev. 2016, 56, 1008–1021. [Google Scholar] [CrossRef] [Green Version]
  24. Feng, X.; Weng, C.; He, X.; Han, X.; Lu, L.; Ren, D.; Ouyang, M. Online state-of-health estimation for Li-ion battery using partial charging segment based on support vector machine. IEEE Trans. Veh. Technol. 2019, 68, 8583–8592. [Google Scholar] [CrossRef]
  25. Zhao, L.; Wang, Y.; Cheng, J. A hybrid method for remaining useful life estimation of lithium-ion battery with regeneration phenomena. Appl. Sci. 2019, 9, 1890. [Google Scholar] [CrossRef] [Green Version]
  26. Richardson, R.R.; Birkl, C.R.; Osborne, M.A.; Howey, D.A. Gaussian process regression for in situ capacity estimation of lithium-ion batteries. IEEE Trans. Ind. Inform. 2018, 15, 127–138. [Google Scholar] [CrossRef] [Green Version]
  27. Richardson, R.R.; Osborne, M.A.; Howey, D.A. Gaussian process regression for forecasting battery state of health. J. Power Sources 2017, 357, 209–219. [Google Scholar] [CrossRef]
  28. Wang, J.; Deng, Z.; Li, J.; Peng, K.; Xu, L.; Guan, G.; Abudula, A. State of Health Trajectory Prediction Based on Multi-Output Gaussian Process Regression for Lithium-Ion Battery. Batteries 2022, 8, 134. [Google Scholar] [CrossRef]
  29. Lin, H.; Kang, L.; Xie, D.; Linghu, J.; Li, J. Online State-of-Health Estimation of Lithium-Ion Battery Based on Incremental Capacity Curve and BP Neural Network. Batteries 2022, 8, 29. [Google Scholar] [CrossRef]
  30. Lin, H.-T.; Liang, T.-J.; Chen, S.-M. Estimation of battery state of health using probabilistic neural network. IEEE Trans. Ind. Inform. 2012, 9, 679–685. [Google Scholar] [CrossRef]
  31. Shahriari, M.; Farrokhi, M. Online state-of-health estimation of VRLA batteries using state of charge. IEEE Trans. Ind. Electron. 2012, 60, 191–202. [Google Scholar] [CrossRef]
  32. Liu, H.; Wang, P.; Cheng, Z. A Novel Method Based on Encoder-Decoder Framework for Li-Ion Battery State of Health Estimation. Proc. CSEE 2021, 5, 1851–1859. [Google Scholar] [CrossRef]
  33. Salehinejad, H.; Sankar, S.; Barfett, J.; Colak, E.; Valaee, S. Recent advances in recurrent neural networks. arXiv 2017, arXiv:1801.01078. [Google Scholar] [CrossRef]
  34. Pascanu, R.; Mikolov, T.; Bengio, Y. On the difficulty of training recurrent neural networks. In Proceedings of the International Conference on Machine Learning, Atlanta, GA, USA, 16–21 June 2013; pp. 1310–1318. [Google Scholar]
  35. Staudemeyer, R.C.; Morris, E.R. Understanding LSTM—A tutorial into long short-term memory recurrent neural networks. arXiv 2019, arXiv:1909.09586. [Google Scholar] [CrossRef]
  36. Saha, B.; Goebel, K. Battery Data Set, NASA Ames Prognostics Data Repository; NASA Ames Research Center: Moffett Field, CA, USA, 2007. Available online: http://ti.arc.nasa.gov/project/prognostic-data-repository (accessed on 10 January 2021).
  37. He, W.; Williard, N.; Osterman, M.; Pecht, M. Prognostics of lithium-ion batteries based on Dempster-Shafer theory and the Bayesian Monte Carlo method. J. Power Sources 2011, 196, 10314–10321. [Google Scholar] [CrossRef]
  38. Xing, Y.; Ma, E.W.; Tsui, K.-L.; Pecht, M. An ensemble model for predicting the remaining useful performance of lithium-ion batteries. Microelectron. Reliab. 2013, 53, 811–820. [Google Scholar] [CrossRef]
  39. Liu, D.T.; Zhou, J.B.; Liao, H.T.; Peng, Y.; Peng, X.Y. A Health Indicator Extraction and Optimization Framework for Lithium-Ion Battery Degradation Modeling and Prognostics. IEEE Trans. Syst. Man Cybern. Syst. 2015, 45, 915–928. [Google Scholar] [CrossRef]
  40. Sekhar, R.; Shah, P.; Panchal, S.; Fowler, M.; Fraser, R. Distance to empty soft sensor for ford escape electric vehicle. Results Control. Optim. 2022, 9, 100168. [Google Scholar] [CrossRef]
  41. Kingma, D.P.; Ba, J. Adam: A method for stochastic optimization. arXiv 2014, arXiv:1412.6980. [Google Scholar] [CrossRef]
Figure 1. (a) Battery terminal voltage and charge/discharge current during one cycle; (b) the curves of degradation capacity.
Batteries 09 00094 g001
Figure 2. The SOH degradation curves during the whole life cycle.
Batteries 09 00094 g002
Figure 3. (a) Charge voltage curves from 3.8 V to 4.2 V during different cycles; (b) current curves during the whole charging process during different cycles.
Batteries 09 00094 g003
Figure 4. (a) The values of the HIv versus the cycle number; (b) the values of the HIi versus the cycle number.
Batteries 09 00094 g004aBatteries 09 00094 g004b
Figure 5. (a) Charge voltage curves from 3.8 V to 4.2 V during three different cycles for the CS2-35 battery; (b) the curves of the values of the health indicator (HIv) versus the cycle number for the CALCE battery dataset.
Batteries 09 00094 g005
Figure 6. Network architecture of the LSTM-RNN.
Batteries 09 00094 g006
Figure 7. SOH estimating process structure.
Batteries 09 00094 g007
Figure 8. RMSEs of the training performance versus the training epochs.
Batteries 09 00094 g008
Figure 9. (a) SOH estimation results of the LSTM-RNN; (b) SOH estimation results of the GRU-RNN; (c) SOH estimation results of the Sim-RNN; (d) estimation errors of the LSTM-RNN, Sim-RNN, and GRU-RNN.
Batteries 09 00094 g009
Figure 10. SOH estimation results based on the batteries CS2-35 and CS2-37. (a) SOH estimation for CS2-35; (b) SOH estimation for CS2-37; (c) SOH estimation errors of each cycle for battery CS2-35; (d) SOH estimation errors of each cycle for battery CS2-37.
Batteries 09 00094 g010
Figure 11. SOH estimation results based on the battery CS2-33; (a) SOH estimation for CS2-33; (b) SOH estimation error for CS2-33.
Batteries 09 00094 g011
Table 1. Parameter settings for the LSTM-RNN.
ParameterValue Setting
OptimizerAdam
Loss functionMSE
Activation functionRELU
Computational nodes in one layer128
Batch size64
Learning rate0.00005
Epochs15,000
Table 2. The RMSE and MAE results from the testing of battery B0007.
LSTM (%)GRU (%)RNN (%)
RMSE0.56230.64210.6345
MAE0.57460.74940.6400
Table 3. The RMSE and MAE results for the batteries under different charging rates.
Testing BatteryDischarging RateRMSE (%)MAE (%)
CS2-330.5 C2.0381.4952
CS2-351 C0.93110.7437
CS2-371 C0.82880.6373
Table 4. The RMSE and MAE results for the different testing cells above 80% SOH.
Testing BatteryDischarging RateRMSE (%)
(SOH > 80%)
MAE (%)
(SOH > 80%)
CS2-330.5 C1.11980.9454
CS2-351 C0.90620.7260
CS2-371 C0.83170.6370
Disclaimer/Publisher’s Note: The statements, opinions and data contained in all publications are solely those of the individual author(s) and contributor(s) and not of MDPI and/or the editor(s). MDPI and/or the editor(s) disclaim responsibility for any injury to people or property resulting from any ideas, methods, instructions or products referred to in the content.

