Article

Integration of Electrode Markings into the Manufacturing Process of Lithium-Ion Battery Cells for Tracking and Tracing Applications

Institute for Machine Tools and Industrial Management (iwb), TUM School of Engineering and Design, Technical University of Munich, Boltzmannstr. 15, 85748 Garching, Germany
*
Author to whom correspondence should be addressed.
Batteries 2023, 9(2), 89; https://doi.org/10.3390/batteries9020089
Submission received: 26 November 2022 / Revised: 20 January 2023 / Accepted: 25 January 2023 / Published: 28 January 2023
(This article belongs to the Topic Battery Design and Management)

Abstract

:
One of the major challenges of battery cell manufacturing is the reduction of production costs. Production defects and manufacturing inaccuracies, combined with high value streams, cause cost-intensive scrap rates. Conventional batch tracing is insufficient to detect rejects at an early stage, since the quality-critical intermediate products are not considered in a differentiated manner. To address this deficiency, tracking and tracing approaches in battery cell production are becoming increasingly popular. To obtain sufficient resolutions of the production data, the allocation of process and product data must be performed at the electrode sheet level. An interface is required for this, which can be realized by marking the individual electrodes. This paper investigates the integration of two well-known marking technologies: laser and ink marking. Integrating these marking technologies requires the consideration of physical boundary conditions in the process chain. For this purpose, the necessary investigations are presented in a structured manner to ensure that the marking does not have a negative influence on the process chain and vice versa. A pilot production line is used as an example to demonstrate the necessary tests for the integration of laser or ink markings.

1. Introduction

The rise in CO2 emissions is intensifying anthropogenic climate change and is becoming one of today’s most critical issues [1]. The transition to a sustainable energy future is being realized through the decarbonization of the power sector and the predominant use of renewable energy sources [2]. In the automotive industry, electrochemical energy storage systems, such as lithium-ion batteries, are playing a significant role in replacing fossil fuels [3]. Current market studies predict a huge increase in the demand for lithium-ion cells for transportation applications between 2020 and 2030 [4]. The production of lithium-ion battery cells involves a complex process chain with a large number of interdependencies between the process parameters, the intermediate products, and the final cell quality [5]. These interactions are difficult to control, and even small deviations lead to high scrap rates. In combination with high material costs, this results in high production costs [5]. To address the challenge of reducing these high production costs, different approaches are emerging to reduce scrap rates. Quality management systems, which collect and evaluate data from the intermediate products, are used to detect deviations in the intermediate products at an early stage and to determine correlations between individual product and process parameters [6,7,8]. Another attempt to master the prevalent complexity is the use of data-driven approaches [6,9,10]. To exploit the full potential of such approaches, consistent, high-quality datasets are required [6]. A consistent database is a challenging element for the manufacturing industry [11], including battery cell production. The complexity of battery cell production due to the large number of process steps associated with single-unit and batch production contributes to its inconsistency and the lack of thorough, transparent datasets [12]. One way to improve the database is to use a holistic traceability system that allows the clear assignment of the process parameters and the intermediate product properties to the final battery cell [13]. To enable the traceability of intermediate product properties, tracking and tracing systems in battery production are becoming increasingly important [13]. A complete database created by means of a traceability system would be able to improve existing data-driven approaches and thus fully exploit their potential. The use of tracking and tracing systems would also make it possible to show correlations between the final battery cell and its intermediate products. Furthermore, the recorded data could be used to reject defective intermediate products from production at an early stage.

2. State of the Art

According to ISO 9000 2015, traceability can relate to the origin of materials and parts, the processing history, and the distribution and location of the product after delivery [14]. A traceability system is characterized by the tracking and tracing of the product. Tracking refers to the surveillance of the product from upstream to downstream; tracing represents the reverse of the tracking process, whereby the history of a product is recreated by the information recorded at each step of the value chain [15]. While product data tracing is already well advanced in other industries, such as the food [16,17] and pharmaceutical industries [18], tracking and tracing in battery production has so far only been conceptual in the literature [19]. Due to the combination of different continuous and discrete material flows, existing traceability approaches cannot be directly transferred to battery cell production. During electrode production and cell assembly, discrete product sections are required for the integration of a traceability system [20]. Therefore, Wessel et al. identified methods to distinguish single objects using optical identifiers such as one-dimensional (1D) and two-dimensional (2D) barcodes combined with optical character recognition [19]. Sommer et al. presented a tracking and tracing system for battery production, describing the traceability system up to the individual electrode sheet [21]. To identify the individual electrode sheets, unique markings were applied to the current collector. For this purpose, two possible techniques were identified for 2D coding. Laser marking systems and ink marking systems were compared, as these are the only options for battery cell production [13]. However, it has not yet been experimentally proven that the two marking technologies are suitable for battery cell production [21]. To date, it has not been shown whether laser or ink marking can withstand the physical boundary conditions of battery production or whether the marking negatively impacts the process chain. As the boundary conditions depend on the respective production line, it is necessary to ensure the consistency of the marking and to show the influence on the individual processes. Sommer et al. derived marking requirements from the physical boundary conditions of the production line. The necessary investigations pertaining to the geometrical, thermal, chemical, and mechanical boundary conditions for the evaluation of appropriate marking systems in the battery production line are presented in this paper in a structured manner.

3. Approach and Experimental Scope for the Integration of Marking into Lithium-Ion Battery Cell Production

The required investigations are based on the geometrical, thermal, chemical, and mechanical constraints of battery cell production, shown in Figure 1. The marking is applied in electrode production before or after the coating process. Thus, the marking is attached to the aluminum or copper collector foils [21]. The marked foils then pass through the process chain and are subject to its boundary conditions. The marking has to be readable until the end of the process chain for integration in a holistic tracking and tracing system. To prove the durability of the marking with regard to the process chain, all necessary tests are presented as part of a structured procedure. For this purpose, the inserted marking must be examined with regard to the four boundary conditions [21]. The geometrical boundary conditions result from the selected code format, the code content, the resulting code size, and the available area on the collector foils. The marking content has to comply with a developed traceability concept and must not exceed the available space. In addition, the applied marking must withstand the temperatures in the process chain. With regard to chemical resistance, it must be ensured that the applied marking is not damaged, dissolved, or removed by the solvents used, which could negatively affect the product’s properties. Finally, the mechanical boundary conditions to which the marking is subject must be considered. The marking must not have any negative influence on the joining processes or on the foils themselves. Only when the marking meets all the boundary conditions of the battery cell production process can it be used for permanent electrode identification. Below, the four boundary conditions are examined in relation to marking in the research production line of the Institute for Machine Tools and Industrial Management (iwb) as an example.
When integrating a marking for individual electrode sheets, the marking content is defined in the first step. To ensure the distinctive identification of the electrode section, each marking is unique and is used only once. Sommer et al. suggested a timestamp to avoid confusing individual electrode sections. The next step is to convert the information to be stored into a code. An appropriate code format must be selected for this purpose. Different code formats are used as state-of-the-art component and product labels [22]. The selected code content and code format result in a corresponding code size. The codes are scalable via their module size, but minimum size limits must be defined to guarantee readability [23]. The resulting code is applied to the uncoated electrode foil and must not exceed the area available. If the code exceeds the available area, the content has to be reduced, or another code format has to be chosen. Once the code is defined, a suitable technology is needed to apply the marking to the arrester foils. Riexinger et al. and Sommer et al. identified laser and ink systems as suitable for battery cell production. Therefore, the scope of this work was divided into laser- and ink-relevant paths. Laser marking leads to a surface or material change [24]. Therefore, the weakening of the foils by the marking, as well as the influence of the marking on the contacting [25], must also be investigated.
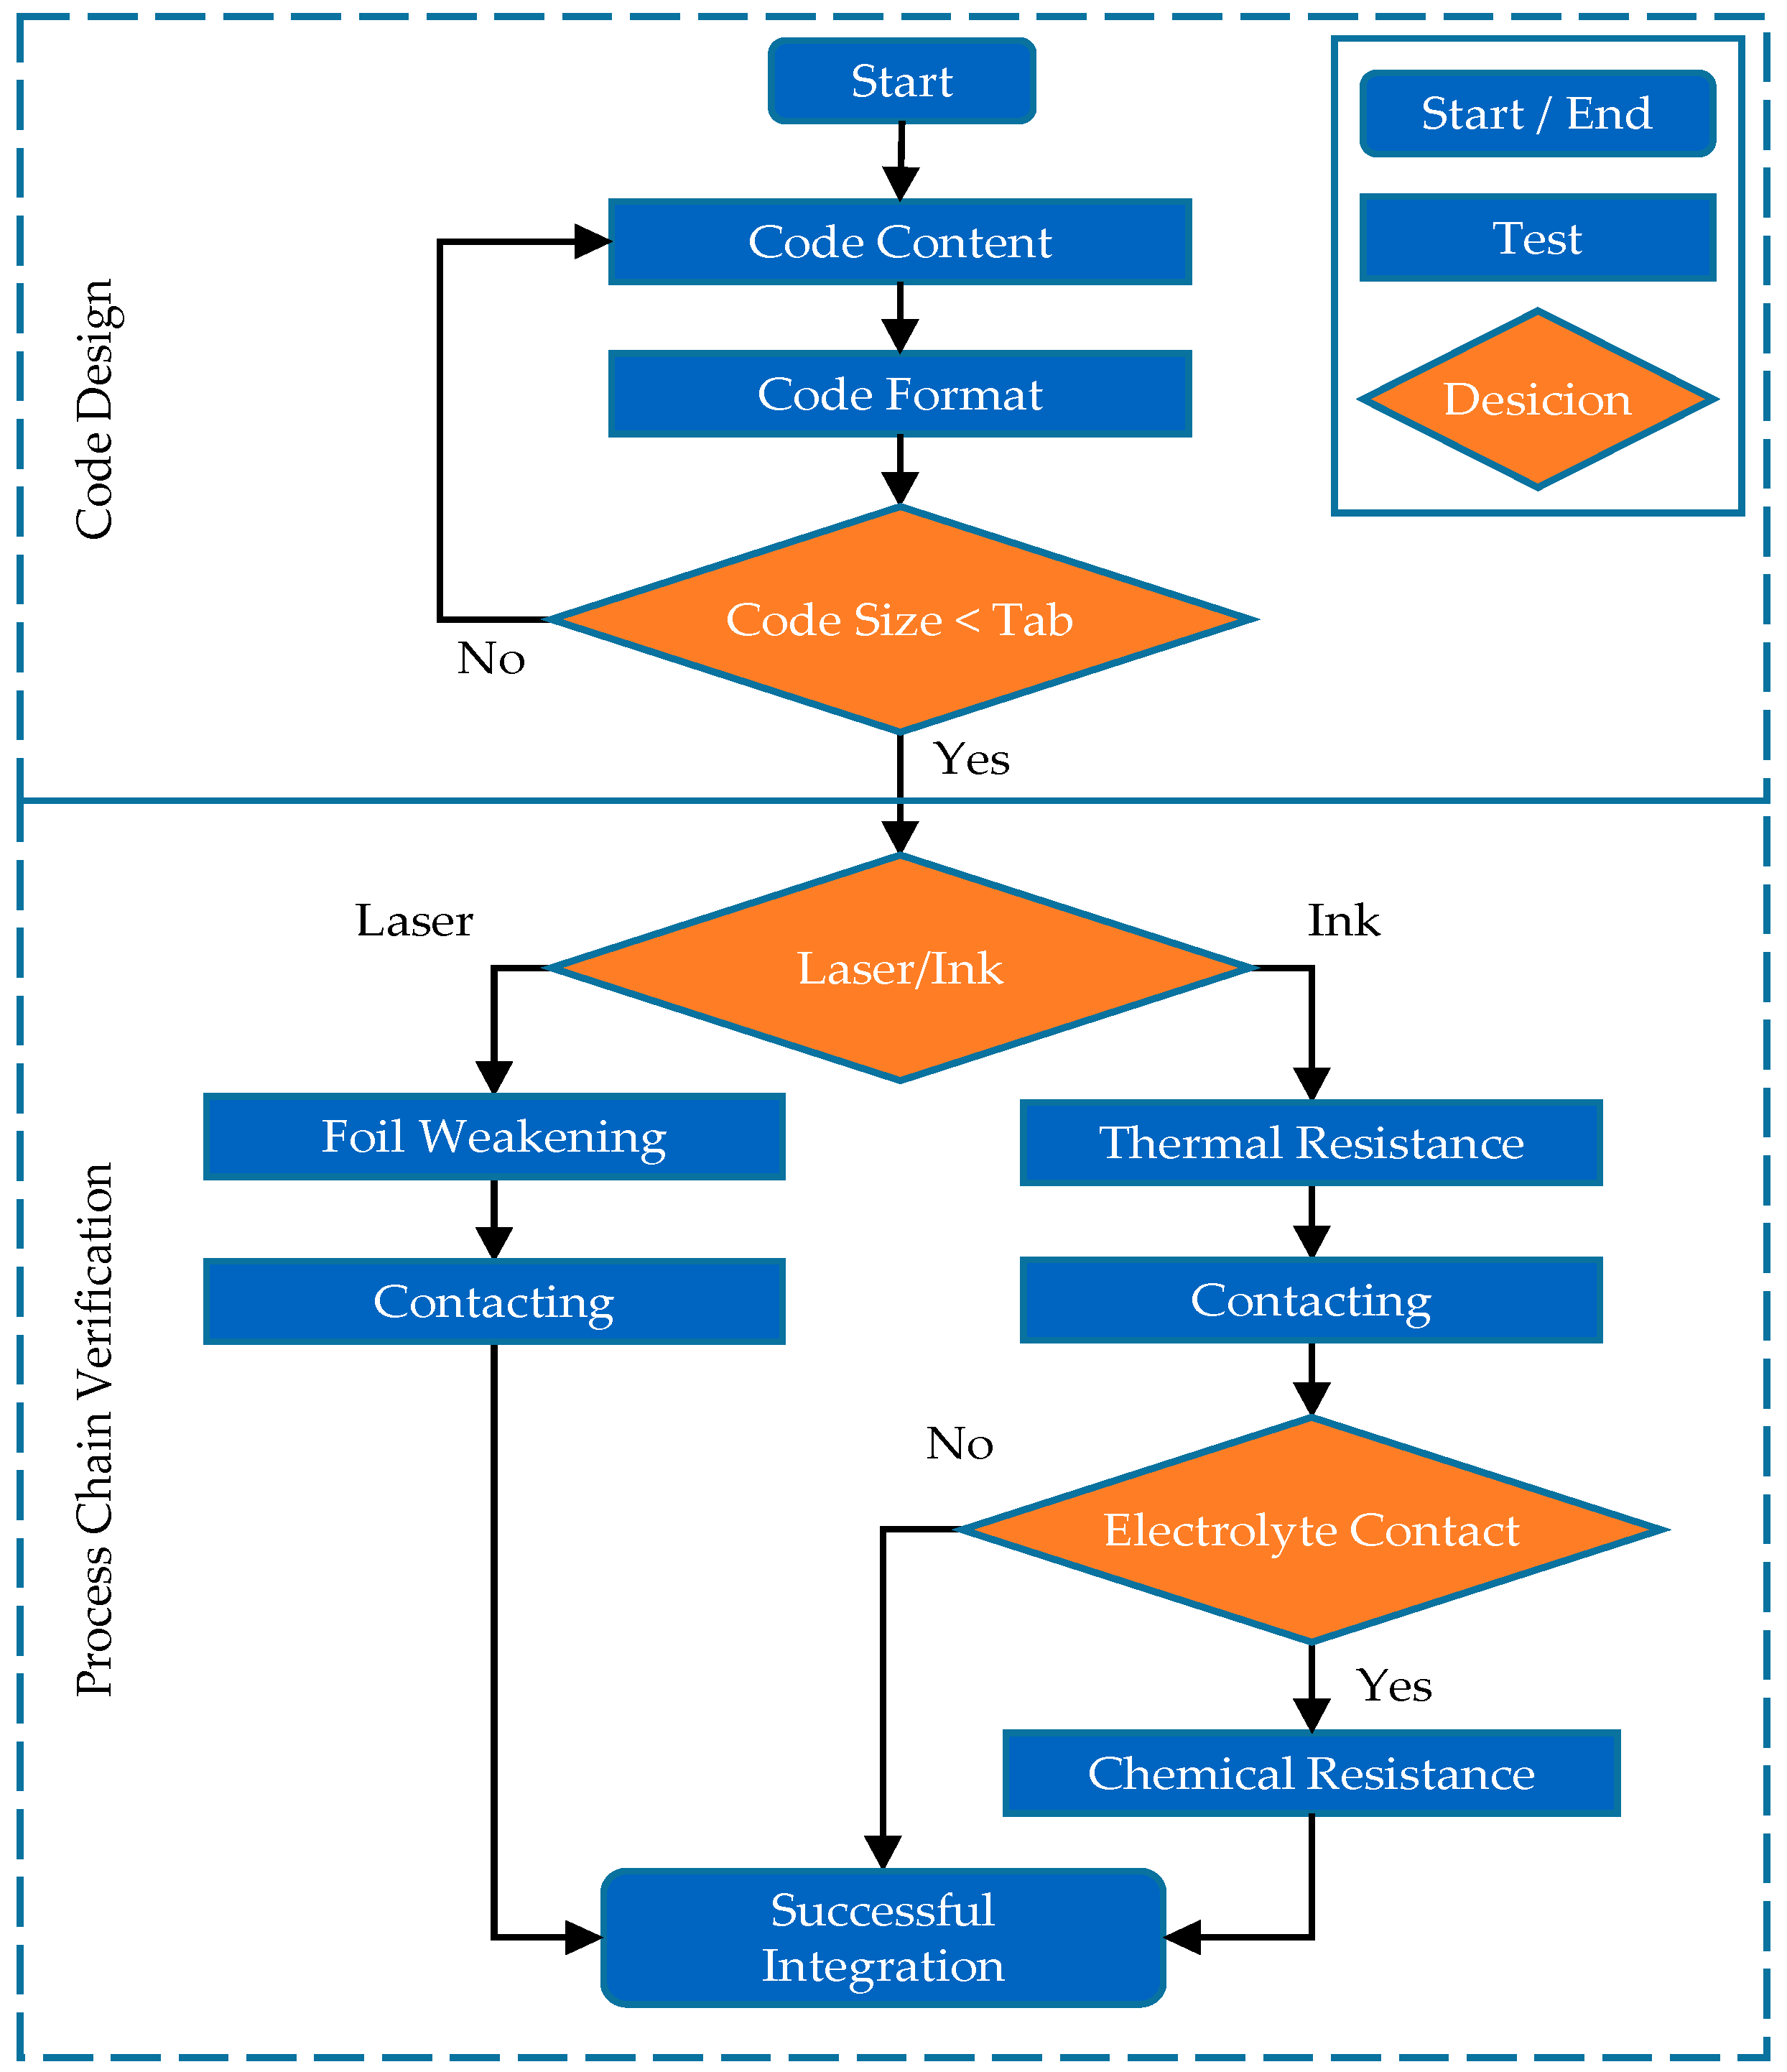
In the case of ink markings, a dye is applied to the foils. The dye can be detached at high temperatures or dissolved by solvents [21]. Furthermore, the dye can be present in the joining zone during contacting, potentially influencing the process [25]. The detachment of the ink by the electrolyte can cause contamination in the manufactured battery cell, the influence of which on the electrochemical properties of the cell must also be investigated. In Figure 2, the individual steps for the integration of a marking applied by a laser or ink marking system are shown in chronological order to illustrate the successful integration of marking into battery cell production.
The presented approach was validated using the pilot production line for lithium-ion battery cells at the iwb with a laser and an ink marking system.

4. Materials and Methods

For the laser markings, a fiber laser marking system (FOBA Y.0300-xs, ALLTEC GmbH, Selmsdorf, Germany) was used. After initial empirical investigations, the following parameters were defined for the application of markings with the laser: for the aluminum foil, a traverse speed of 1500 mm/s, an intensity of 45%, and a pulse frequency of 10 kHz were chosen; for the copper foil, a traverse speed of 1600 mm/s, an intensity of 85%, and a pulse frequency of 10 kHz were chosen. For the ink markings, an inkjet marking system (MK-G1000 with the ink MK10, Keyence, Osaka, Japan) was used. According to the manufacturer, MK10 ink consists of 80–90% butanone and ethyl methyl ketone solvents and 10–20% solvent black dye. The exact composition was disclosed by the manufacturer. Copper foil (SE-Cu58, Carl Schlenk AG, Roth, Germany) with 10 µm thickness and aluminum foil (AA1100/H19, Speira GmbH, Grevenbroich, Germany) with 15 µm thickness were used in this study.

4.1. Geometrical Constraints/Code Design and Application

The geometrical constraints result from the space available for the marking and the size of the selected marking. The marking has to be applied to the uncoated parts of the collector foils to prevent damage to the coating. Consequently, the maximum size of the marking can be derived from the available area on the current collector. As long as the marking is smaller than the available space, it can be applied and is completely readable. To ensure traceability from electrode production to cell assembly, the marking must be applied in the current collector section of the electrode. This limits the available area for marking. Furthermore, the marking content and the marking format have an influence on the resulting code size [26]. Consequently, the resulting code size and the available area on the current collector have to be evaluated. For tracking and tracing applications, it is recommended to use unique markings or codes to enable the exact assignment of process parameters to a specific electrode section at a later stage. Sommer et al. suggested the use of distinctive timestamps as code content, but other algorithms, such as incrementing numbers to generate unmistakable uniqueness, are also feasible. The unique identification created for each marking is converted into an encoding in a subsequent process step. For data storage, a marking is used in a 1D or 2D code format on the electrode sheets. Therefore, different code formats are available for this purpose. Optical code marking is a suitable method for marking electrodes [13] and a proven technique for tracking and tracing systems [27]. Codes consist of black and white elements with a defined size and arrangement. The different code formats can have either a 1D or a 2D structure with different properties. For direct part marking, the 2D code formats Data Matrix codes (DMCs) and quick response (QR) codes are recommended [26]. Thus, Data Matrix and QR codes were compared regarding their information storage capacity and space requirements to identify a suitable code format. The 1D code DataBar Expanded was also included in the comparison, as it was developed for traceability purposes and has the highest data capacity of all 1D code formats [22]. For the comparison of DMCs, QR codes, and DataBar Expanded codes, the code size was considered as a function of the code capacity to be stored. For this purpose, the respective storage capacity and the resulting code size were taken from ISO IEC 16022 [28] for DMCs, ISO IEC 18004 [29] for QR codes, and ISO IEC 24724 [30] for DataBar Expanded codes. Since 1D and 2D codes are scalable to different sizes, the module size, which represents the size of the smallest element of a code, was kept the same for all code formats. The iwb pouch cell format [31] was used to check whether the selected marking fit on the current collector. For this purpose, an exemplary DMC with the content “20220405100401iwb” was applied to an electrode sheet as an example of a unique timestamp with a location description. In the second step, the size ratio of the current collector area and code was formed. After choosing a suitable code content and format, the code has to be applied to the foils. For this purpose, two potential technologies for lithium-ion battery production, laser and ink marking, have already been proposed in the literature. For demonstration purposes, a DMC containing the content “20220405100401iwb” was applied to the foils using the described laser and ink marking systems. A module size of 0.35 mm with a resulting code size of 5.6 × 5.6 mm was selected. The applied codes were then photographed, and a prominent point in the code was enlarged using a 3D laser scanning microscope (VK-X3000, Keyence, Japan).

4.2. Thermal Constraints/Thermal Resistance

Thermal boundary conditions are determined by the temperatures occurring in the production line. Since ink marking systems apply ink to the current collector, it is necessary to evaluate whether the ink can withstand the temperatures arising in the process chain. To test the temperature resistance of the markings, the following experiments were conducted. For the iwb production line, vacuum drying was chosen as the basis for the highest temperature in the production chain. Therefore, the laser- and ink-marked foils were placed in the oven and subjected to electrode-coil-drying temperature and pressure profiles in the first experiment. The electrode coils were dried in a vacuum oven (TR03, Waldner Process Systems, Germany) using three alternating drying and vacuum cycles. Each drying cycle was carried out at a drying temperature of 120 °C, beginning at ambient pressure in the dry room (dew point −40 °C), and included the following evacuation cycle: pevac1 = 400 mbar, pevac2 = 200 mbar, pevac3 = 100 mbar, pevac4 = 50 mbar, pevac5 = 30 mbar, pevac6 = 20 mbar dwell time (tevac1 = 30 min, tevac2 = … = tevac6 = 5 min), and venting to ambient pressure level [32]. In the second experiment, the aluminum and copper foil with ink and laser markings were placed in an oven (Vario 200, Zubler GmbH, Ulm, Germany) for 2 min at 500 °C and ambient pressure. These parameters corresponded to future foil treatments for wrinkle reduction at the iwb. The laser and ink markings were photographed and visually compared after printing and each experiment.

4.3. Chemical Constraints/Chemical Resistance

Since the collector foils of the battery cells come into contact with the electrolyte when installed in the housing [33], the influence of the ink dissolved in the electrolyte on the electrochemical properties must be investigated [21]. For this, the following experiments were carried out using six coin cells. In three of the six coin cells, the electrolyte was contaminated with ink; the other three cells were manufactured with ink-free electrolyte. All cells were then formed and cycled, and the cell performance was compared.
Electrode fabrication: The components for the cathode slurry were mixed with N-Methyl-2-pyrrolidone (NMP, Sigma-Aldrich, Burlington, NJ, USA) and the anode slurry with water at ambient pressure and temperature. The cathode slurry was made of 95.5 wt% lithium nickel manganese cobalt oxide (NMC622, BASF, Ludwigshafen am Rhein, Germany); 2.25 wt% conductive carbon (C65, Imerys, Bodio, Switzerland); 1.5 wt% polyvinylidene fluoride (PVDF, Solvay, Brussels, Belgium); and 0.75 wt% graphite (SFG6L, Imerys, Bodio, Switzerland). The anode slurry contained 94 wt% graphite (SMGA5, Hitachi, Tokyo, Japan); 3 wt% styrene-butadiene rubber (SBR, ZEON, Japan); 2 wt% carboxymethyl cellulose (CMC, ZEON, Tokyo, Japan); and 1 wt% conductive carbon (C65, Imerys, Bodio, Switzerland). Doctor blade coating was performed in an industrial roll-to-roll coating machine (BC50, Coatema GmbH, Dormagen, Germany) equipped with an infrared dryer at a coating speed of 1 m/min−1. For the anode slurry, 10 µm copper foil was used. For the cathode slurry, 15 µm aluminum foil was used. The resulting loading of the cathode was 17.3 mg/cm2, and the loading of the anode was 9.2 mg/cm2. Subsequently, the coatings were compressed with a calender (EA 102, Coatema GmbH, Dormagen, Germany) from an initial porosity of approx. 50% to a final porosity of approx. 30%.
Coin cell fabrication: Six coin cells (CR2032, Hohsen Corp., Osaka, Japan) were assembled in a dry room with a dew point of −45 °C using the fabricated electrodes. Three cells were filled with 100 µL of electrolyte (LP572, BASF, Ludwigshafen am Rhein, Germany) containing ethylene carbonate (EC) and ethyl-methyl-carbonate (EMC) at a ratio of 3:7 (by weight) as solvents with 1 M lithium-hexafluorophosphate (LiPF6). For the other three cells, the ink of six codes, corresponding to 0.66 µL ink, was dissolved in 300 µL electrolyte in a separate glass. This corresponded to a concentration of approximately 2.2 ‰. With this electrolyte–ink mixture, three coin cells were produced. As a separator, a glass fiber separator (Type 691, VWR, Radnor, PA, USA) with a thickness of 200 µm was used for all coin cells.
Formation and Cycling: All cells went through a formation procedure of three charge and discharge cycles at a C-Rate of C/10 to ensure the formation of the solid electrolyte interphase (SEI) on the surface of the graphite particles. Charging was conducted in constant current/constant voltage (CCCV) operation with a cutoff current at C/20, and discharging was performed in a CC procedure within a voltage range of 4.2 V to 3.0 V at a constant temperature of 25 °C. After the formation, the cells underwent a cycling test at a controlled temperature of 25 °C, while the applied current was derived from the capacity of the cell after the last formation cycle at C/10. Charging was carried out following a CCCV procedure with 1C and a cutoff charging current smaller than C/20. Discharging was performed in a CC procedure with 1C within a voltage range between 4.2 V and 3.0 V. Between each charging and discharging period was a break of 20 min. Similar to the formation, the ambient temperature was set to 25 °C.

4.4. Mechanical Constraints/Foil Weakening and Contacting

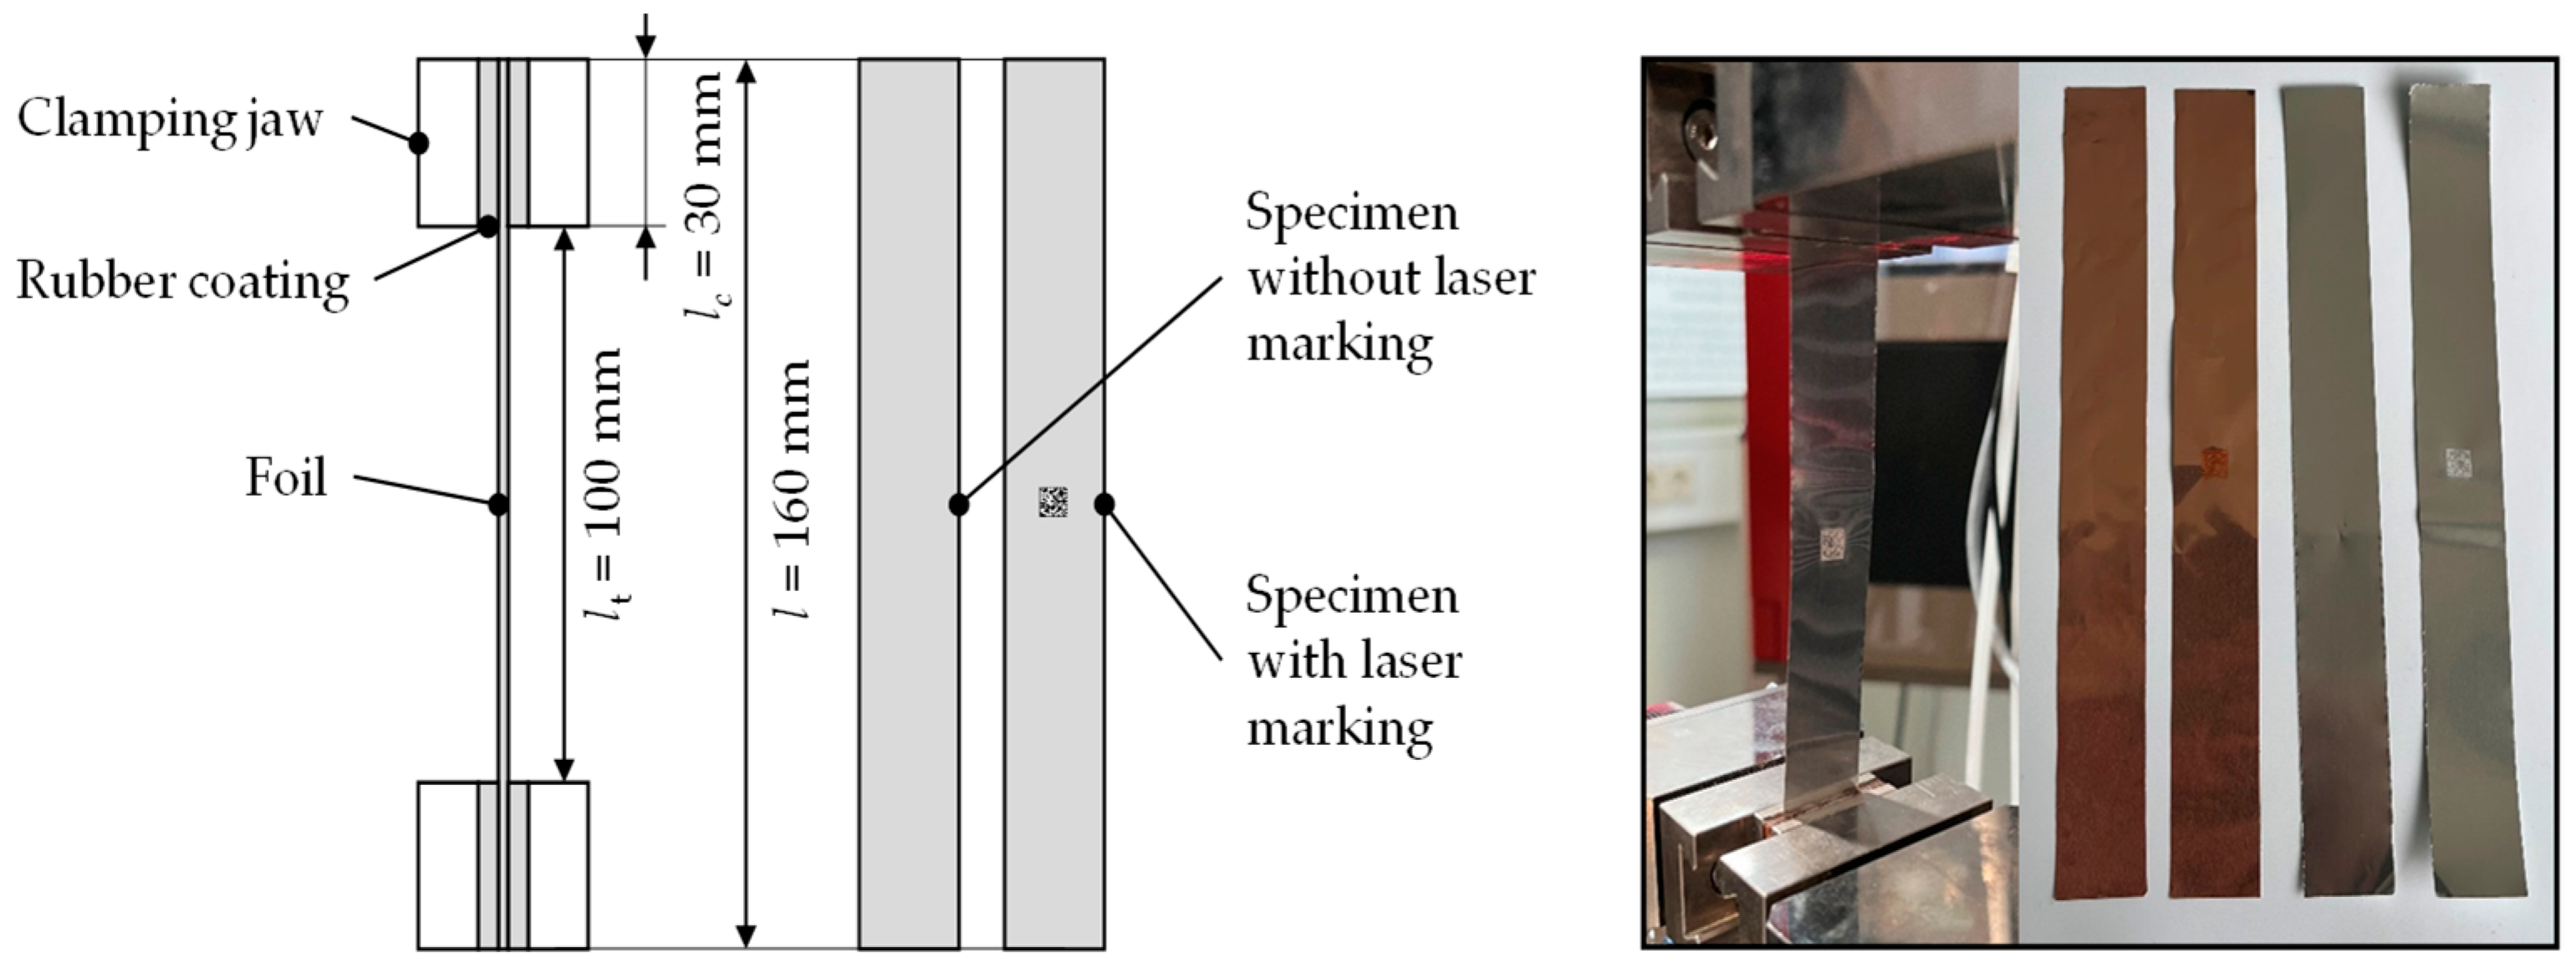
Compared to ink markings, the application of laser markings locally alters the surface and the structure of the aluminum and copper foils [24]. This leads to the assumption that the code weakens the material, which must be verified experimentally. Since the current collector foils are under mechanical stress during electrode production in roll-to-roll processes, any weakening must not cause the foil to tear. To evaluate whether material weakening has a decisive influence, a tensile test was performed at this point. The tensile test was used to quantify if the current collector foil was weakened by the laser marking and whether the further processing of the foils was possible. For this test, the presented copper and aluminum foils were laser-marked using the presented laser system. The lasered markings were the same DMCs as described in Section 4.1. The specimens had dimensions of 20 × 160 mm according to DIN EN ISO 527-3 and were cut from the foils by hand using a scalpel. Five aluminum and copper foil specimens with laser marking and five without marking were prepared and tested. For the laser-marked samples, the DMC was located in the center of the specimen. The tests were carried out on a tensile testing machine (XForce K, Zwick Roell, Ulm, Germany). For the measurement of the force, a 1 kN load cell was used. By dividing the measured force by the specimen’s cross-sectional area, the stress was calculated. The cross-sectional area for the aluminum specimens was 0.3 mm2, and for the copper specimens it was 0.2 mm2. For the measurement of the elongation, a laser extensometer (laserXtens 7-220 HP, Zwick Roell, Ulm, Germany) was used. The tests were performed following DIN EN 1465 and DIN EN ISO 527-3. After applying a preload of 1 N to compensate for clamping forces and to ensure a complete extension to the foil, the tensile test was performed at a feed rate of 50 mm min−1. The resulting test setup and the specimens with and without marking are shown in Figure 3.
In the production of lithium-ion batteries, the current collectors are contacted electrically by ultrasonic welding after the stacking of the individual electrodes and the separator [34]. Here, the requirement is that all foils are fully welded together to ensure electrical conductivity [35]. Furthermore, a tab is applied to the joined foils to electrically connect the cell to an external circuit [34]. The marking to be added is located on the current collectors and must be visible until cell assembly. This means that the marking is located in the joining zone of the ultrasonic welding. The ink marking thus applies contamination to the foils, and the laser marking changes the foil surface. The influence of the two marking options in the joining zone must therefore be investigated. It was suspected that marking would have a negative influence on the strength of the joining zone. The following two tests were performed to verify this suspicion, and a distinction was made between contacting the foils with each other and the foil with the collector tab.
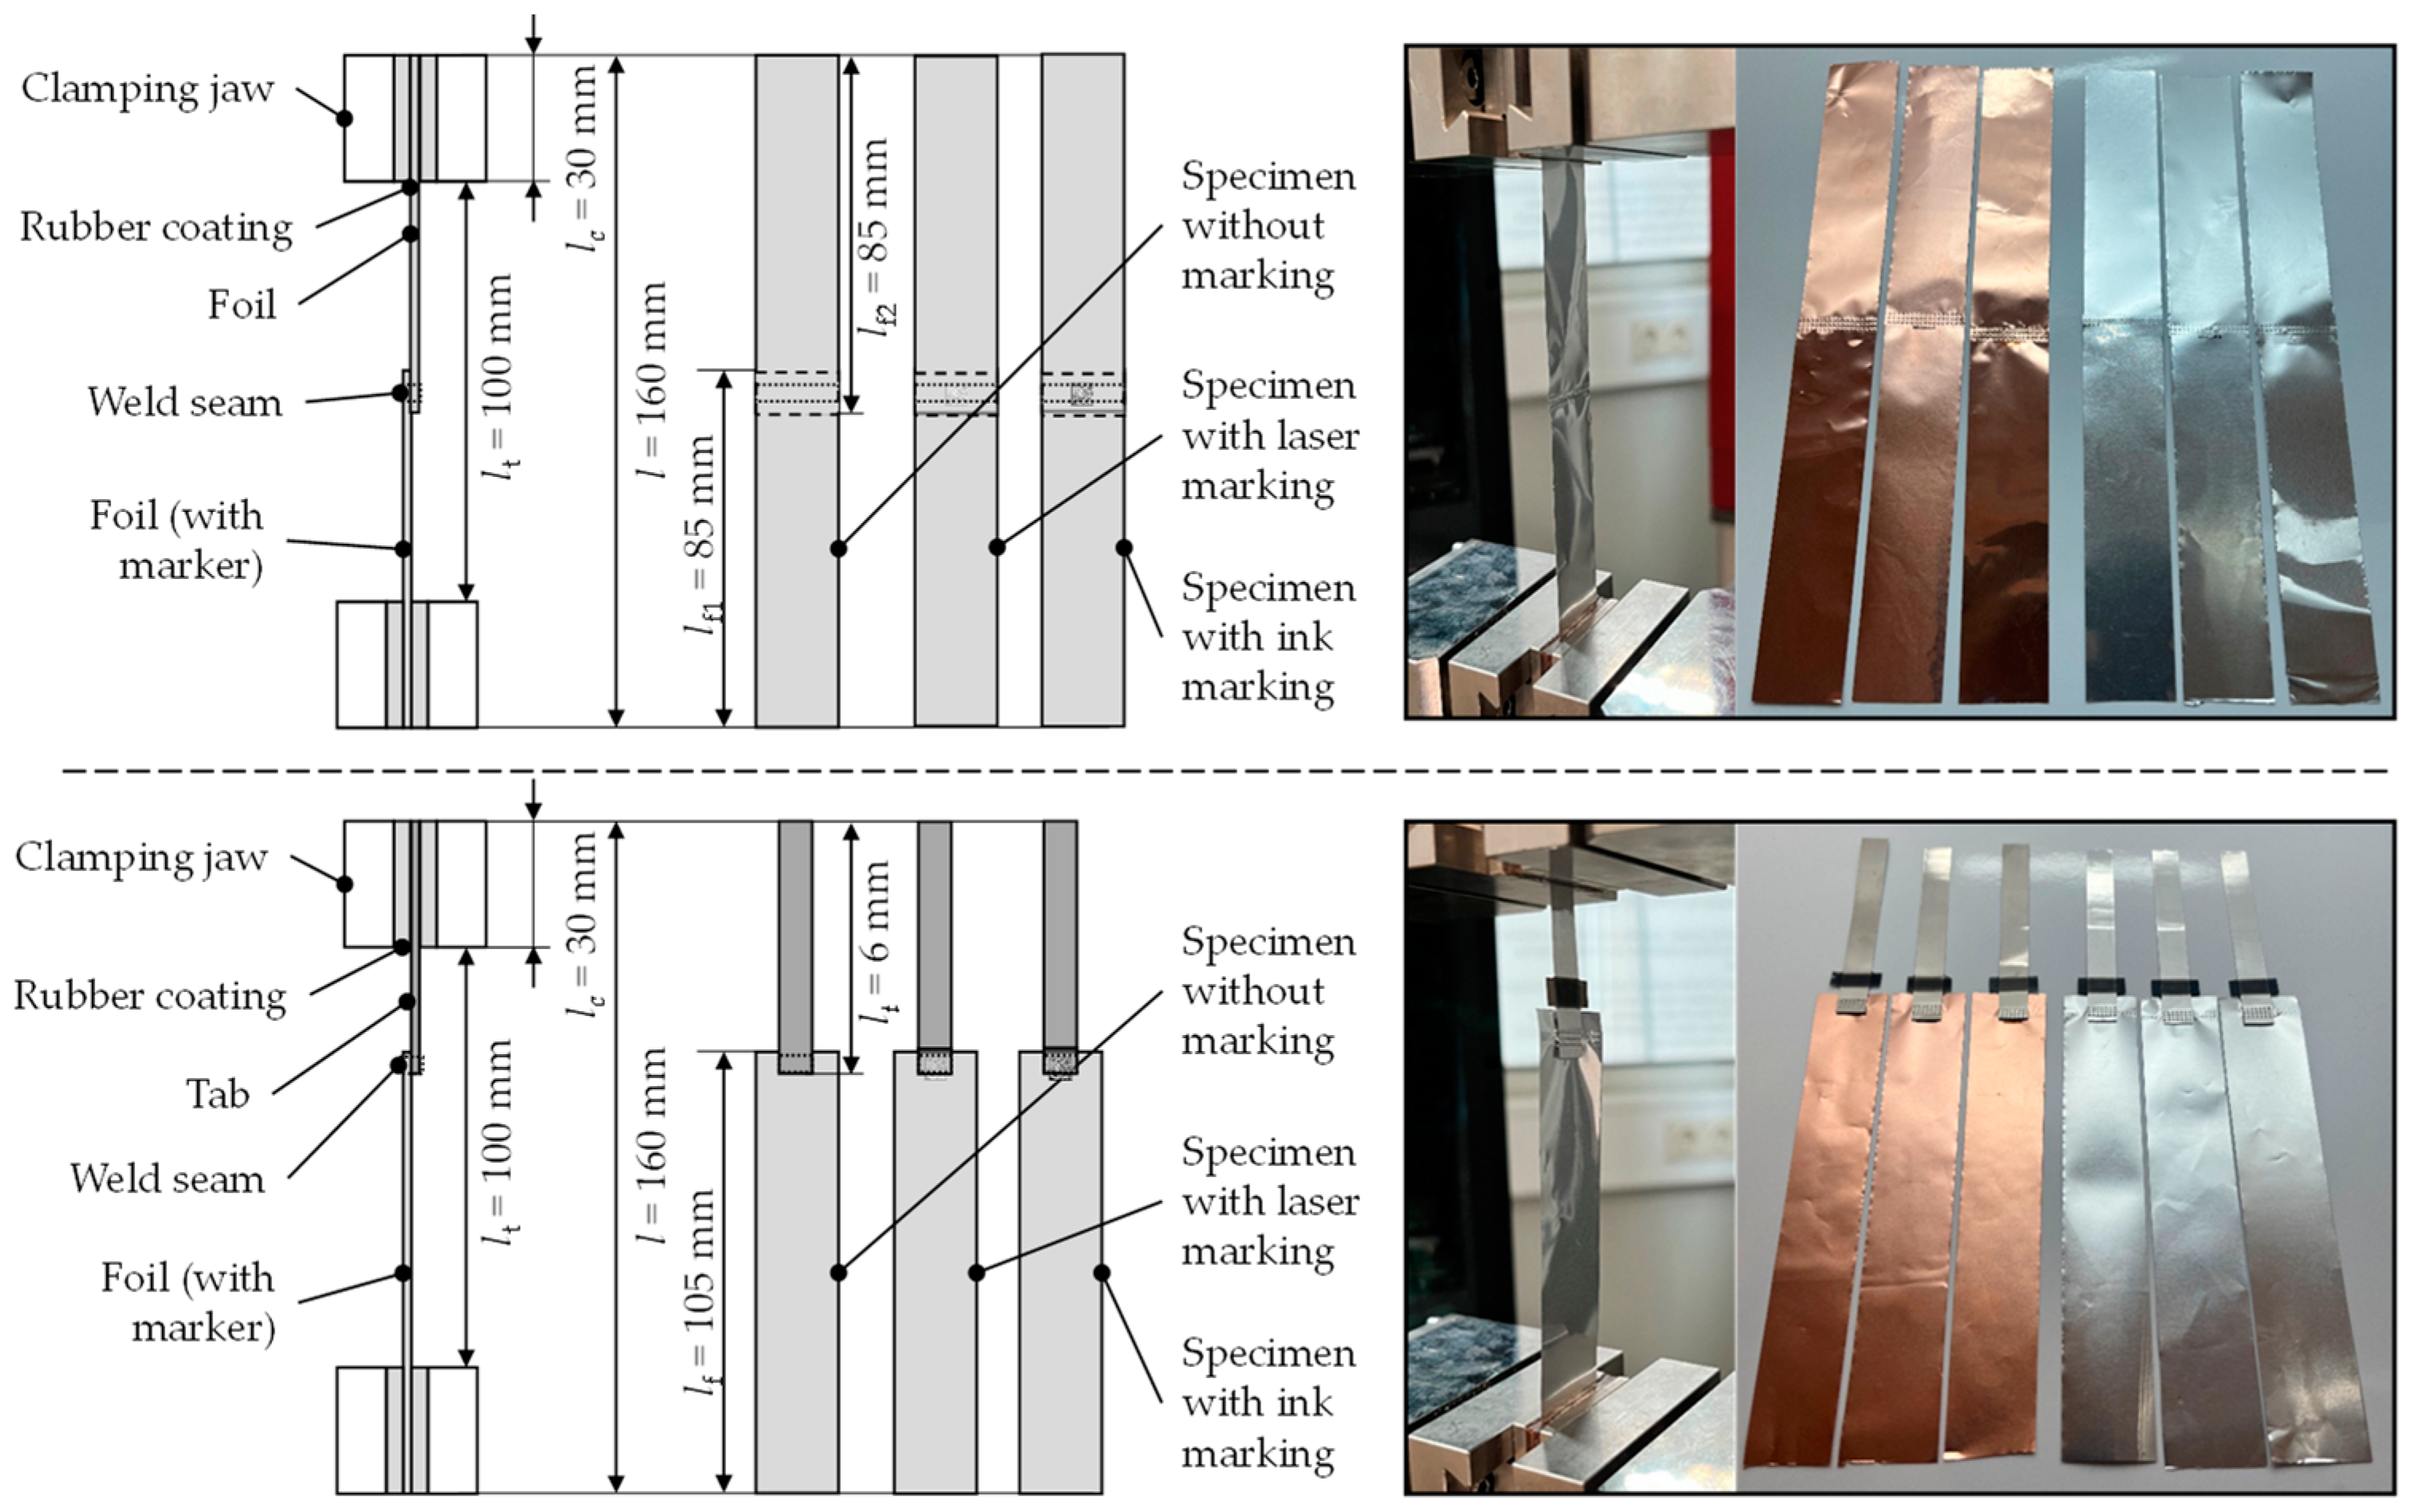
In the first experiment, the influence of the marking on the contact between two foils (foil–foil) was examined. For this purpose, samples without markings, with laser markings, and with ink markings were cut out of the aluminum and copper foils and joined with unprinted foils by ultrasonic welding. The individual parts of the specimens had a size of 85 × 20 mm and were joined with an overlap of 5 mm. The marking was located directly in the joining zone. Joining two parts resulted in a total size of 160 × 20 mm. Five specimens were produced and tested without markings as a benchmark for the five specimens with laser markings and the five specimens with ink markings in the joining zone, respectively. In the second experiment, the influence of the marking on the contact between the foil and a collector tab (foil–tab) was investigated. For this purpose, samples without markings, with laser markings, and with ink markings were cut out from the aluminum and copper foils and joined to the tabs by ultrasonic welding. The tabs for aluminum foils (EQ-PLiB-ATC8, PI-KEM, Tamworth, UK) and the tabs for copper foils (EQ-PLiB-NTA8, PI-KEM, Tamworth, UK) had a size of 60 × 8 × 0.09 mm; the foils with and without markings had a size of 105 × 20 mm. During joining, there was an overlap of 5 mm between the tab and foil, so that the marking was in the middle of the joining zone. The total length of the specimen was 160 mm. Five reference specimens without markings, five specimens with laser markings, and five specimens with ink markings in the joining zone were fabricated and tested.
All welds were made with an ultrasonic welding machine (Brandson Ultraweld L20, Emerson Electric Co., Ferguson, MO, USA). Both joining operations (foil–foil and foil–tab) were performed with the same parameters. An amplitude of 4 μm and a frequency of 20 kHz were used. A welding energy of 10 J and a clamping force of 34 kPa were applied for joining. The welds for the foil–foil joint had a geometry of 20 × 3 mm, and for the foil–tab joint a geometry of 8 × 3 mm. All tests were carried out on a tensile testing machine (XForce K, Zwick Roell, Ulm, Germany). For the measurement of the force, a 1 kN load cell was used. The tests were performed following DIN EN 1465 and DIN EN ISO 527-3. After applying a preload of 1 N to compensate for clamping forces and to ensure a complete extension to the foil, the tensile test was performed at a feed rate of 50 mm min−1. The above parameters were in accordance with the standard and have been proven for thin foils [36]. The maximum achievable force was then measured until the joining zone failed. The test setups, as well as the samples for the foil–foil experiment and the foil–tab experiment, are shown in Figure 4.

5. Results and Discussion

In this section, the results of the geometrical, thermal, chemical, and mechanical investigations are presented.

5.1. Geometrical Constraints/Code Design and Application

The comparison of the selected code formats in terms of their code capacity and the required space is shown in Figure 5. One byte corresponds to one alphanumeric character or two numeric characters.
It was shown that all code formats required more space for coding as the code content (in bytes) increased. Furthermore, it was shown that the DataBar Expanded code required the most space and the DMC the least space for the same code content. The DMC was best suited to electrode sheets with a limited area, as it stored the most information in a fixed space compared to the other code formats.
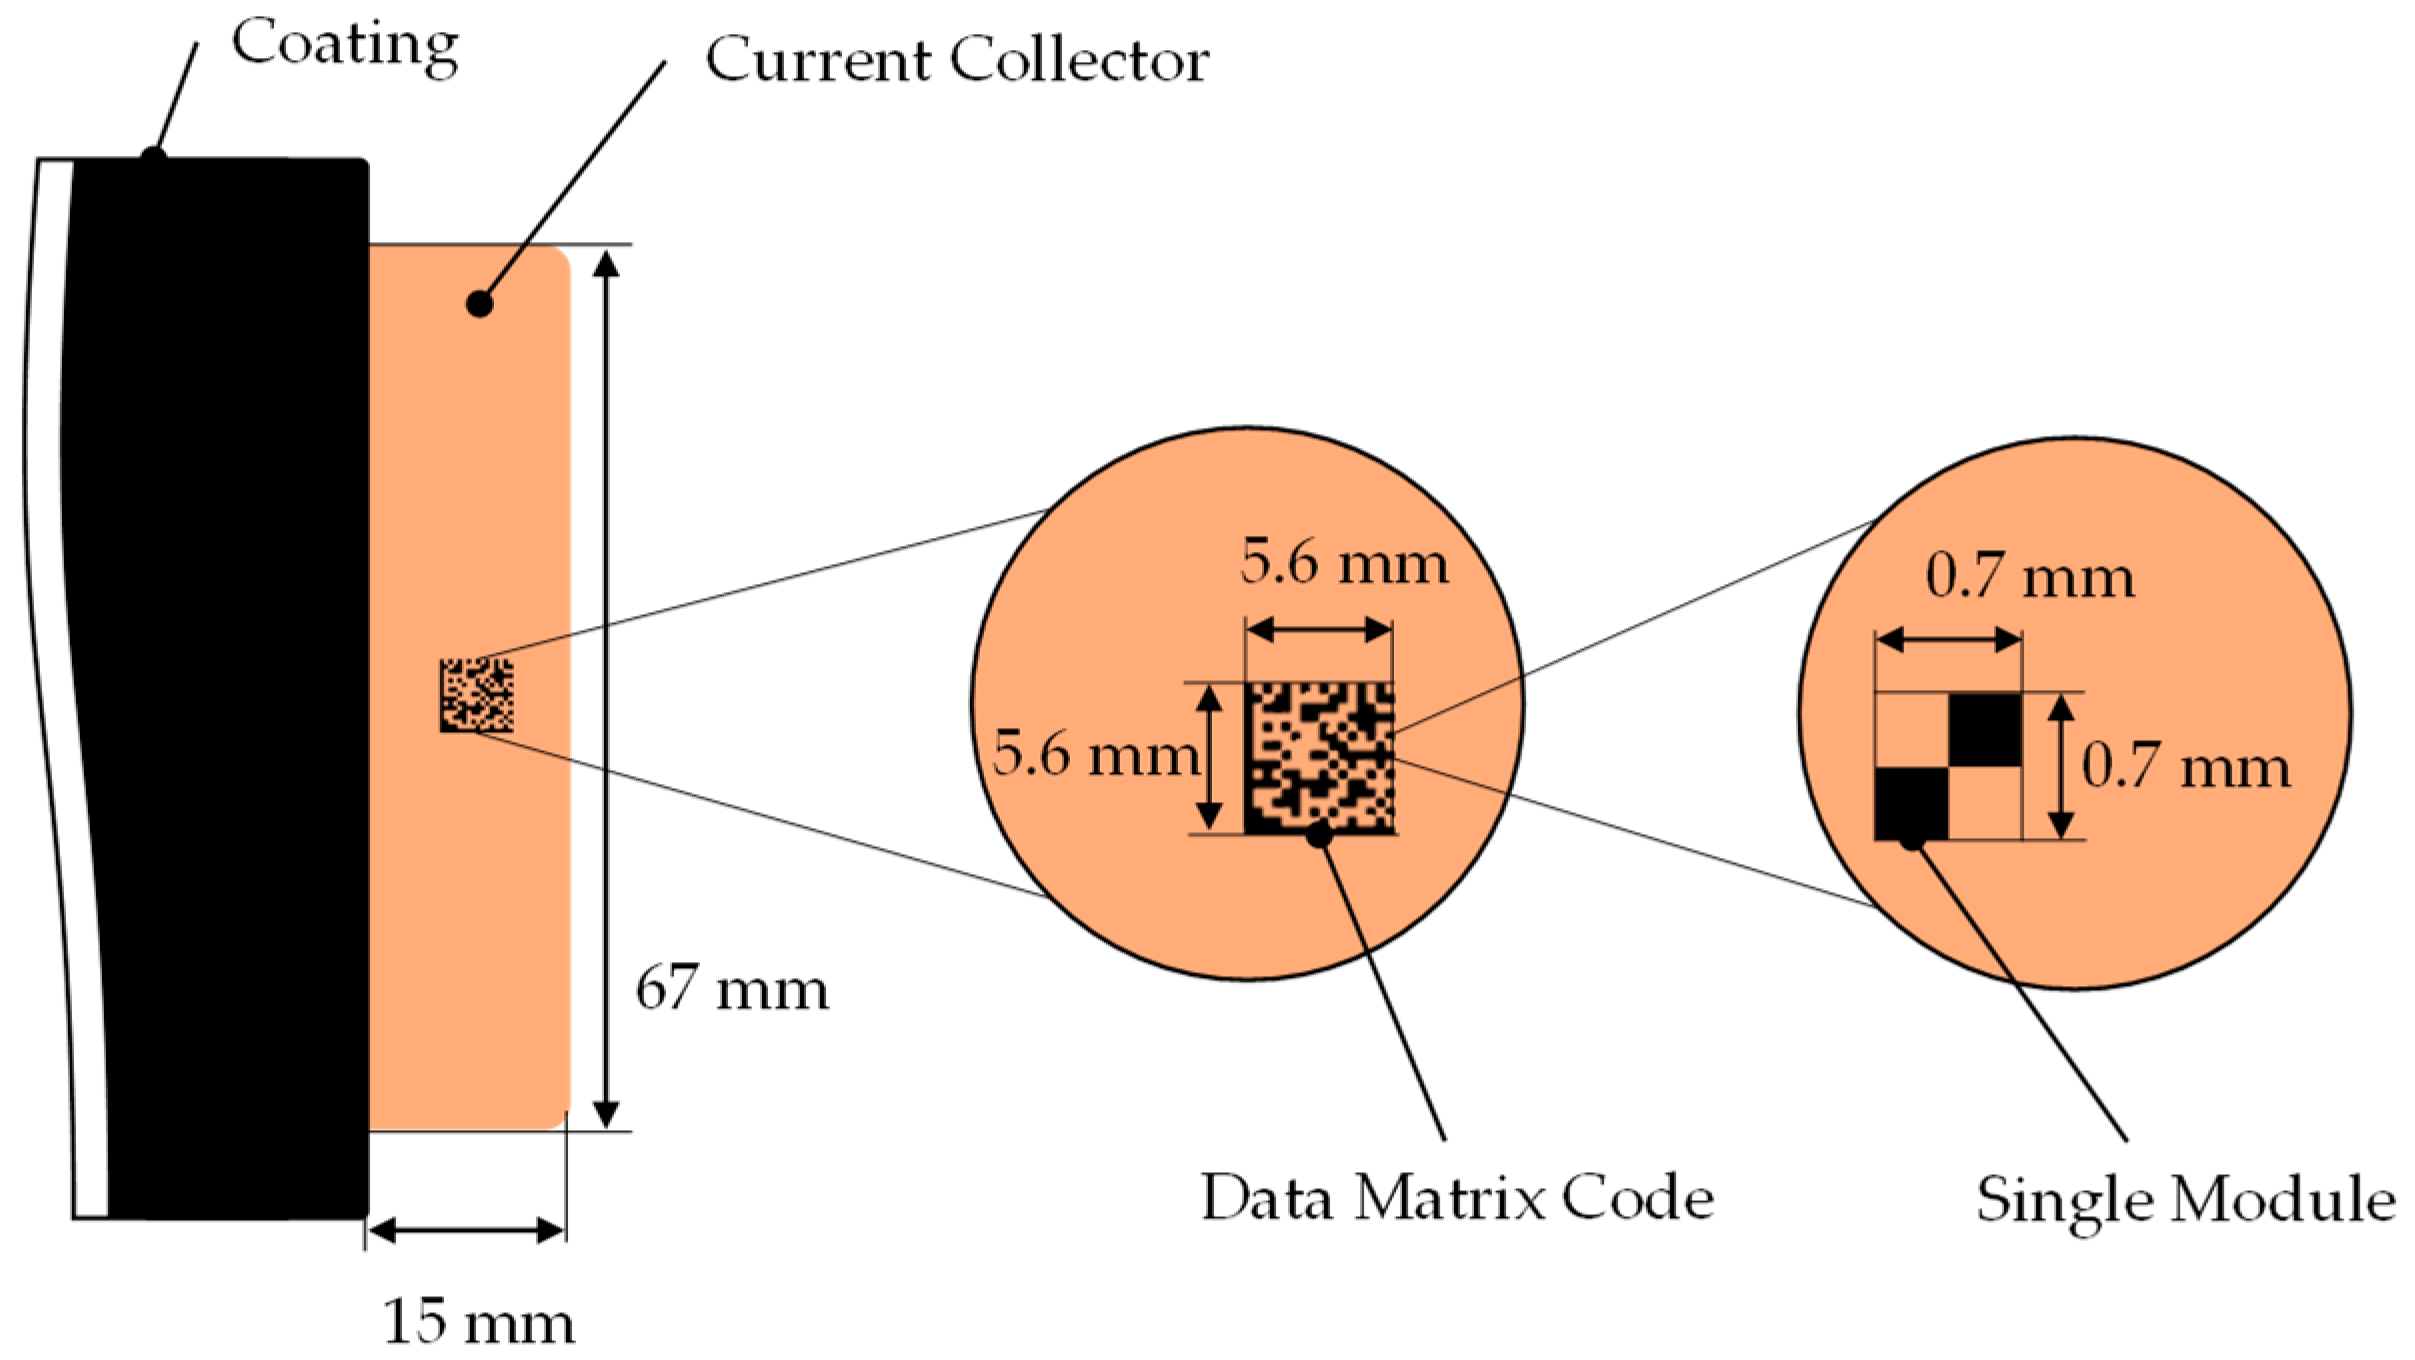
A marking containing 20220405100401iwb was converted to a DMC and projected onto an iwb electrode sheet. Here, the module size was set to 0.35 mm, resulting in a code size of 5.6 × 5.6 mm. The code on the current collector of an electrode sheet is shown in Figure 6.
The size of the DMC covered only a small fraction of the available area on the current collector. By dividing the area of the code (31.36 mm2) by the maximum possible area on the current collector (1005 mm2), the coverage was approx. 3%. When using larger codes, a different code format, or a smaller current collector, one must evaluate whether the given area is sufficient for the codes. The selected DMC was applied to the aluminum and copper foils using the described laser and ink marking systems, as shown in Figure 7.
It was shown that the code could be applied to both foils using either marking technology. Ink codes were applied to the foils via individual drops of ink, whereas the laser markings changed color as the surface of the material was processed. These two marking techniques have critical influences on the lithium-ion battery process chain. In order to evaluate these influences, the following investigations were carried out. For the two marking systems selected, the following boundary conditions must be evaluated to ensure the durability of the code, as well as the influence on the process chain.

5.2. Thermal Constraints/Thermal Resistance

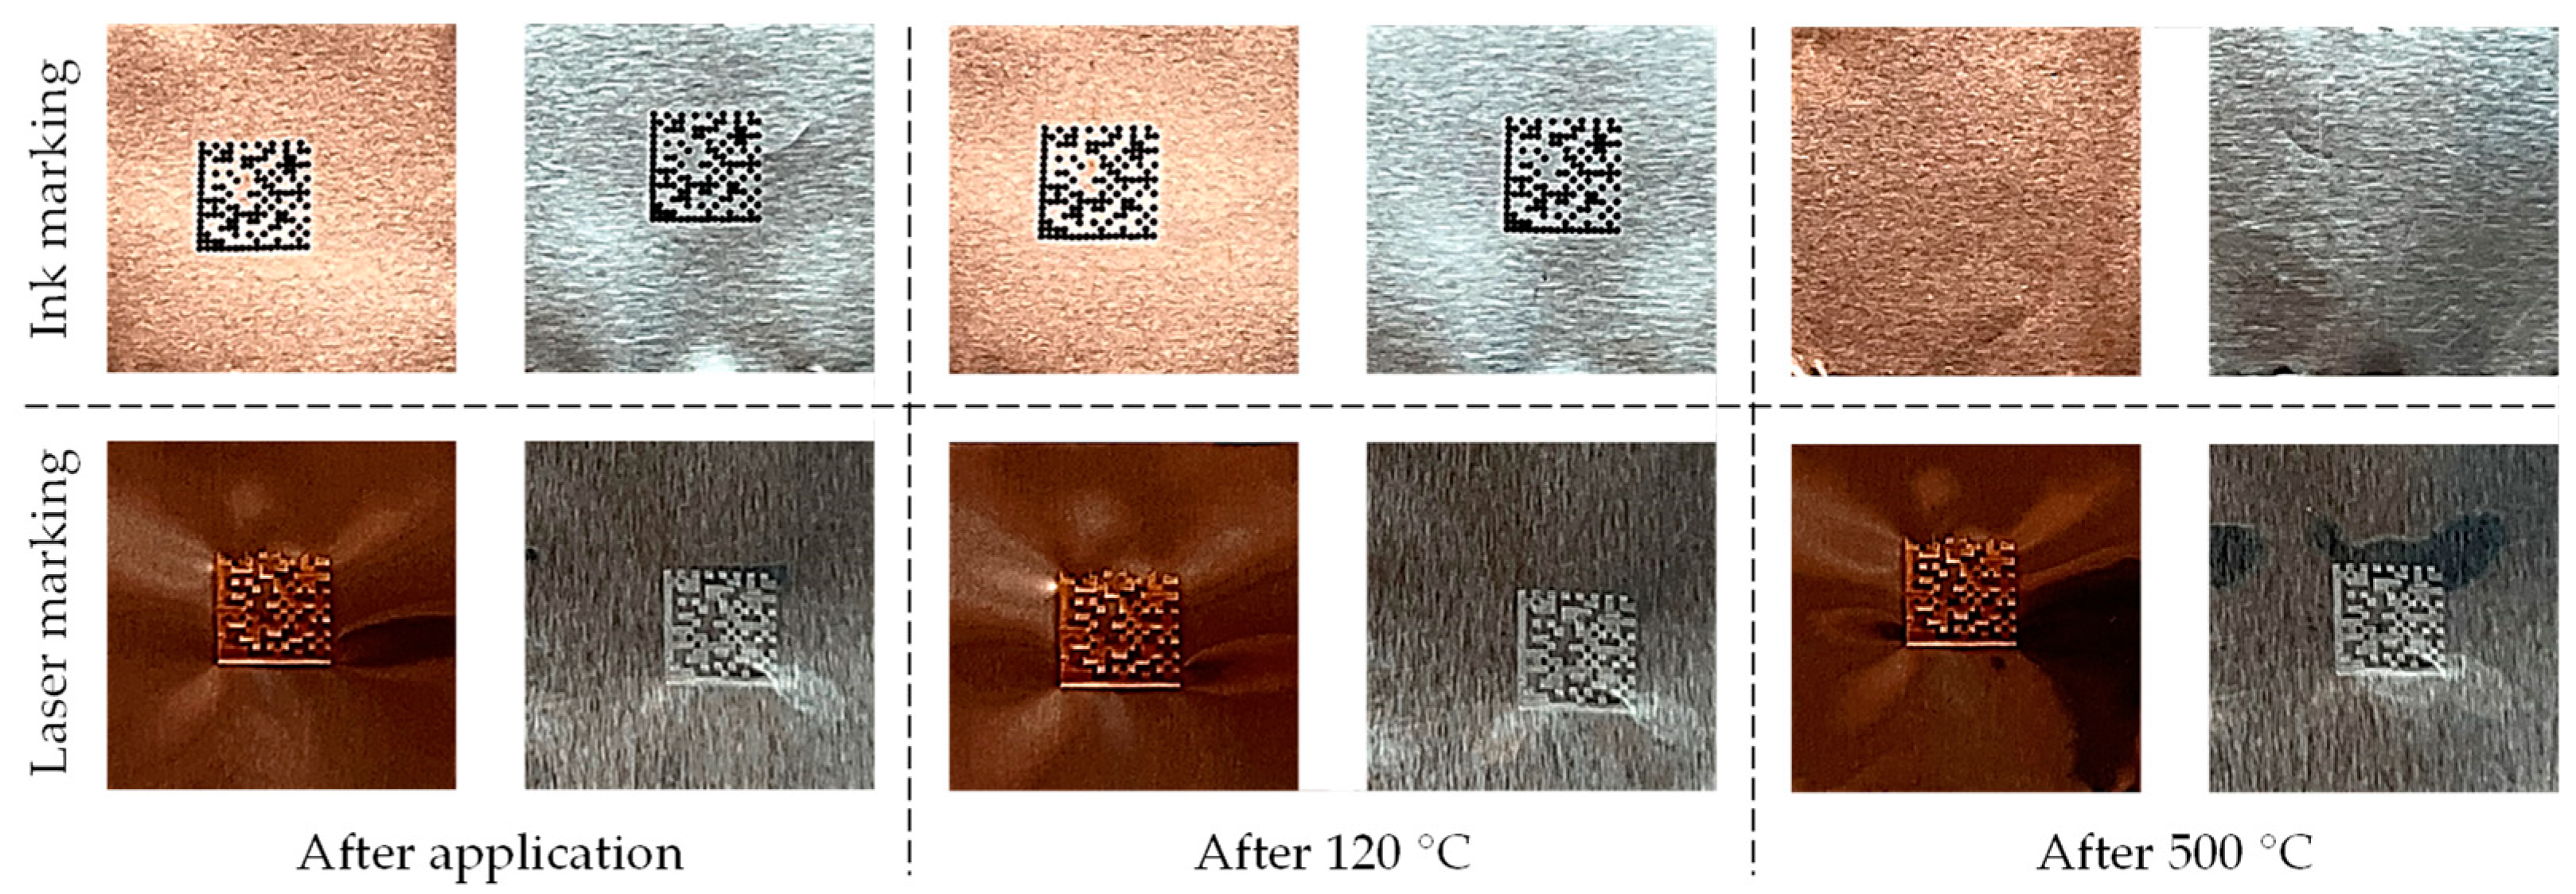
In Figure 8, the markings before and after the temperature treatments at 120 °C and 500 °C are shown. After application, the lasered and printed markings were visible on both foils. After the electrode coil drying at 120 °C, the codes were also still legible. After drying at 500 °C, the ink codes disappeared without leaving any residue, but the laser markings were still readable.
This experiment showed that the ink-printed codes had a maximum temperature resistance, which must be considered when choosing ink markings. In addition, the experiment showed that the ink markings withstood the maximum thermal stresses in the iwb battery cell production process and are applicable for electrode production in the pilot production line.

5.3. Chemical Constraints/Chemical Resistance

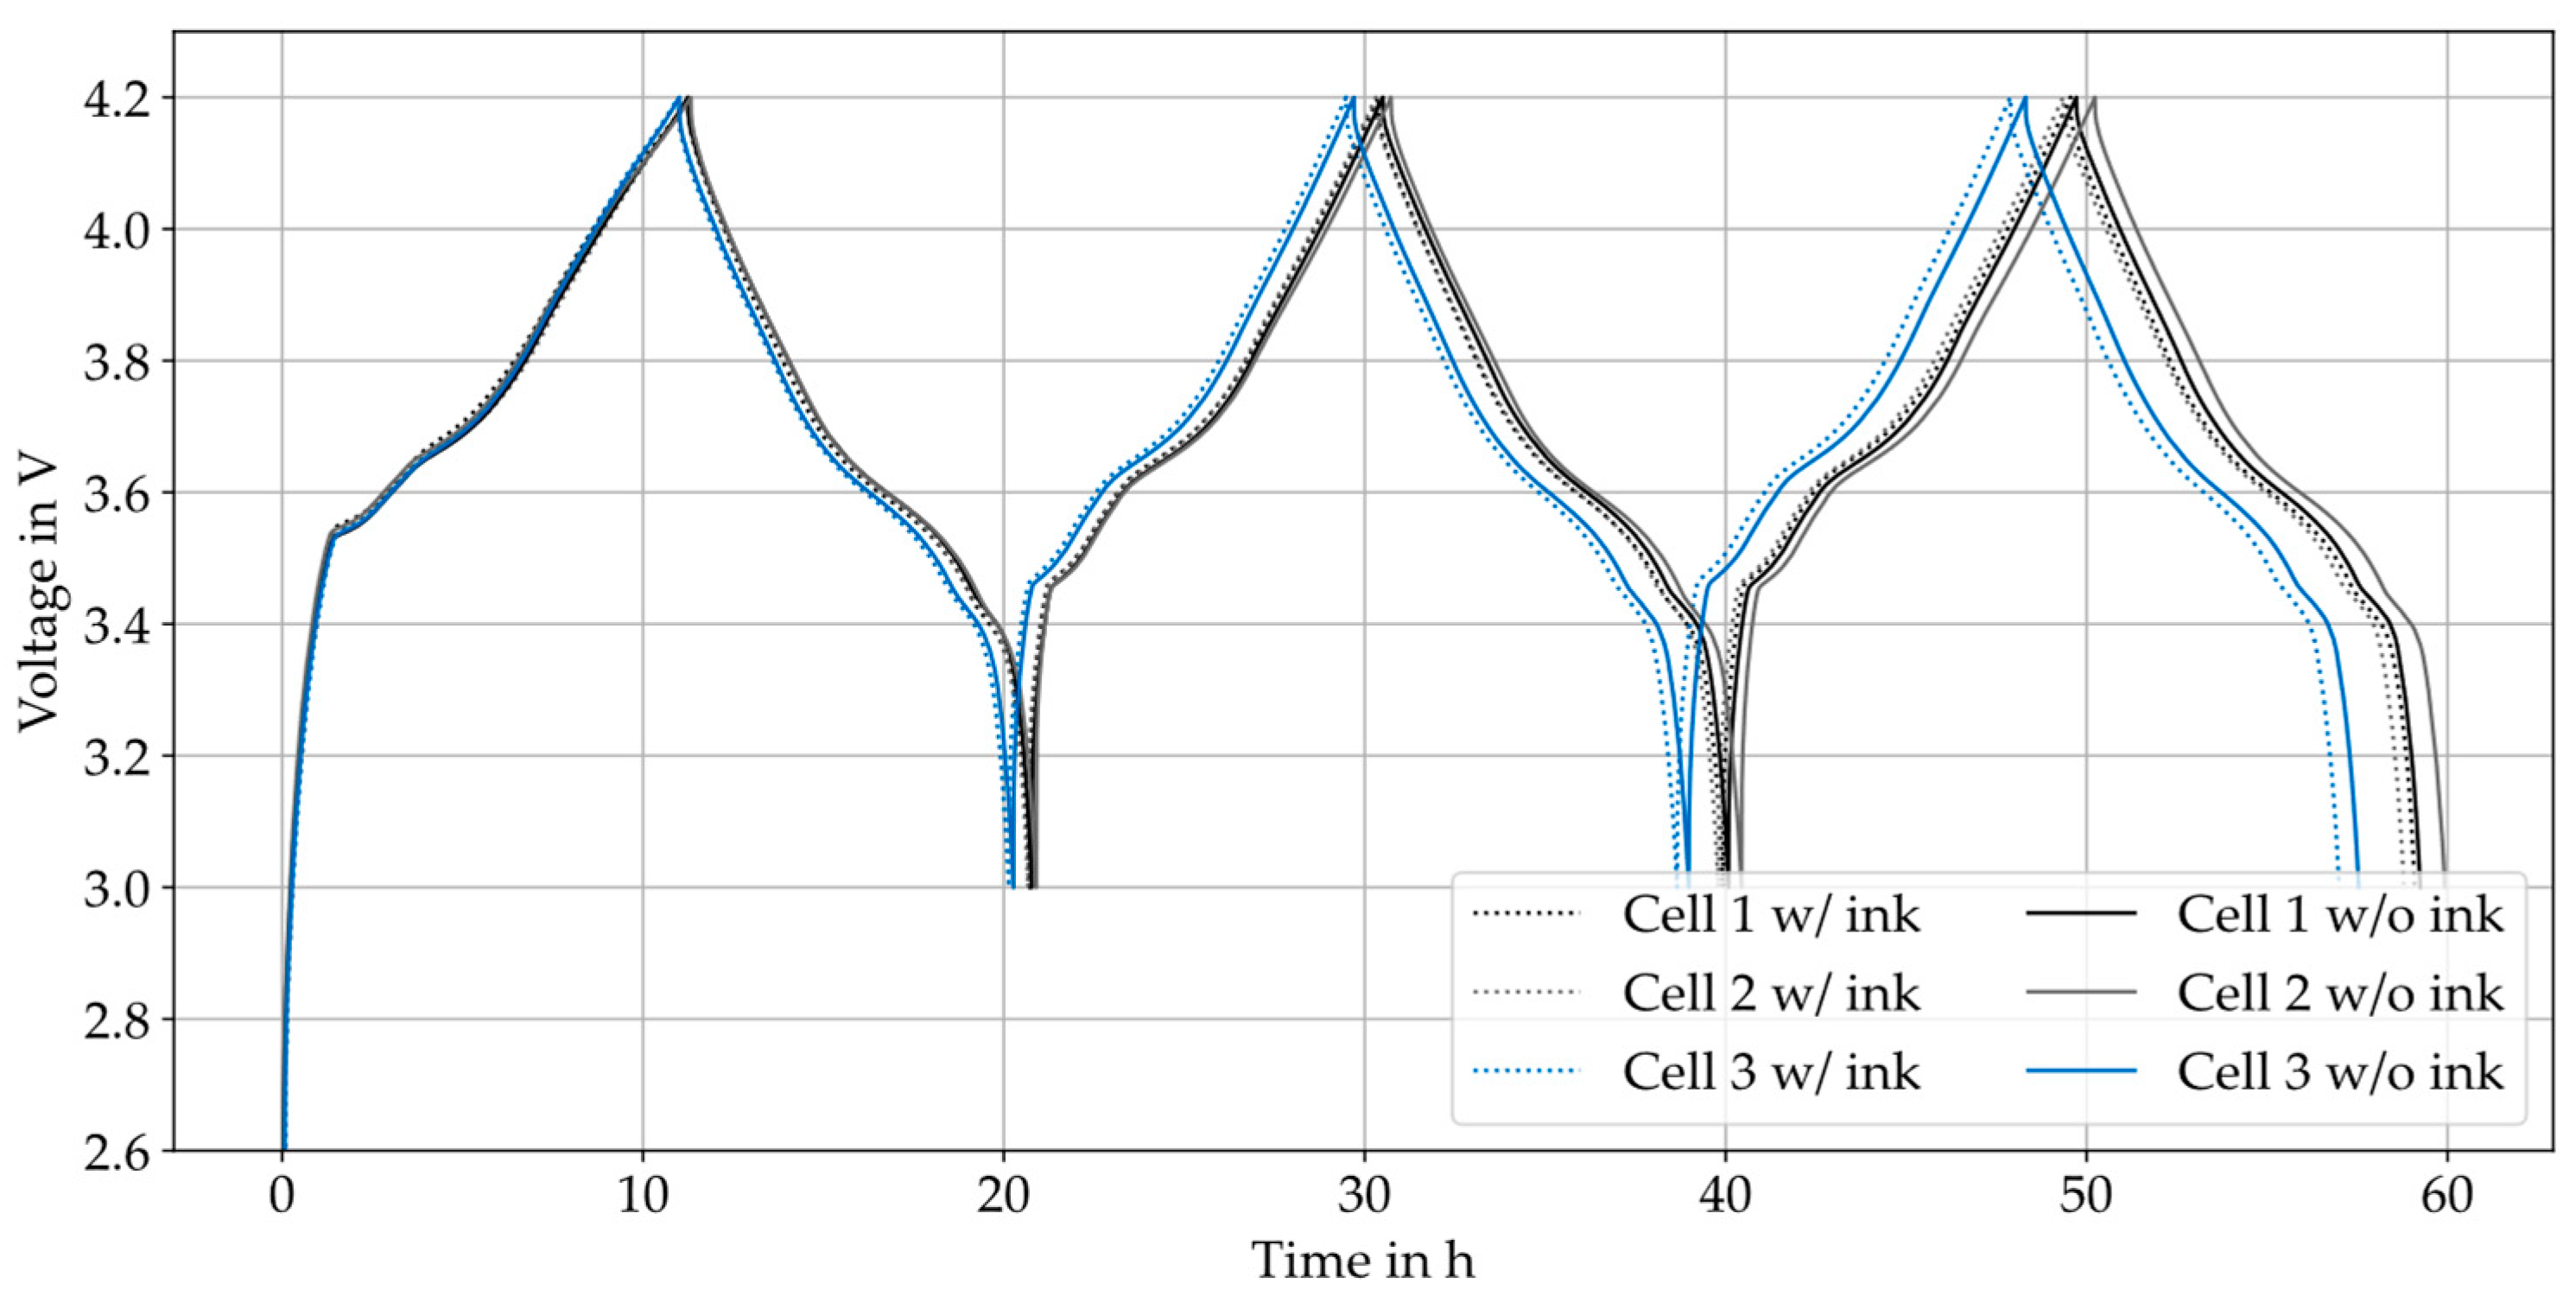
The voltage profiles of the formation showed no abnormalities between the coin cells with and without ink. Minimal deviations were visible over time, which could be attributed to inaccuracies in the determination of the initial capacity of the cells. Small deviations may occur when determining the cathode weight with the aid of a high-precision balance. The resulting voltage curves of the coin cells are shown in Figure 9.
The resulting coulomb efficiency (CE) of each cycle in all coin cells is presented in Table 1.
The calculated CEs for the first three forming cycles also showed small variations between the six cells. It was deduced that there were no discernible differences during the formation of the coin cells with and without ink.
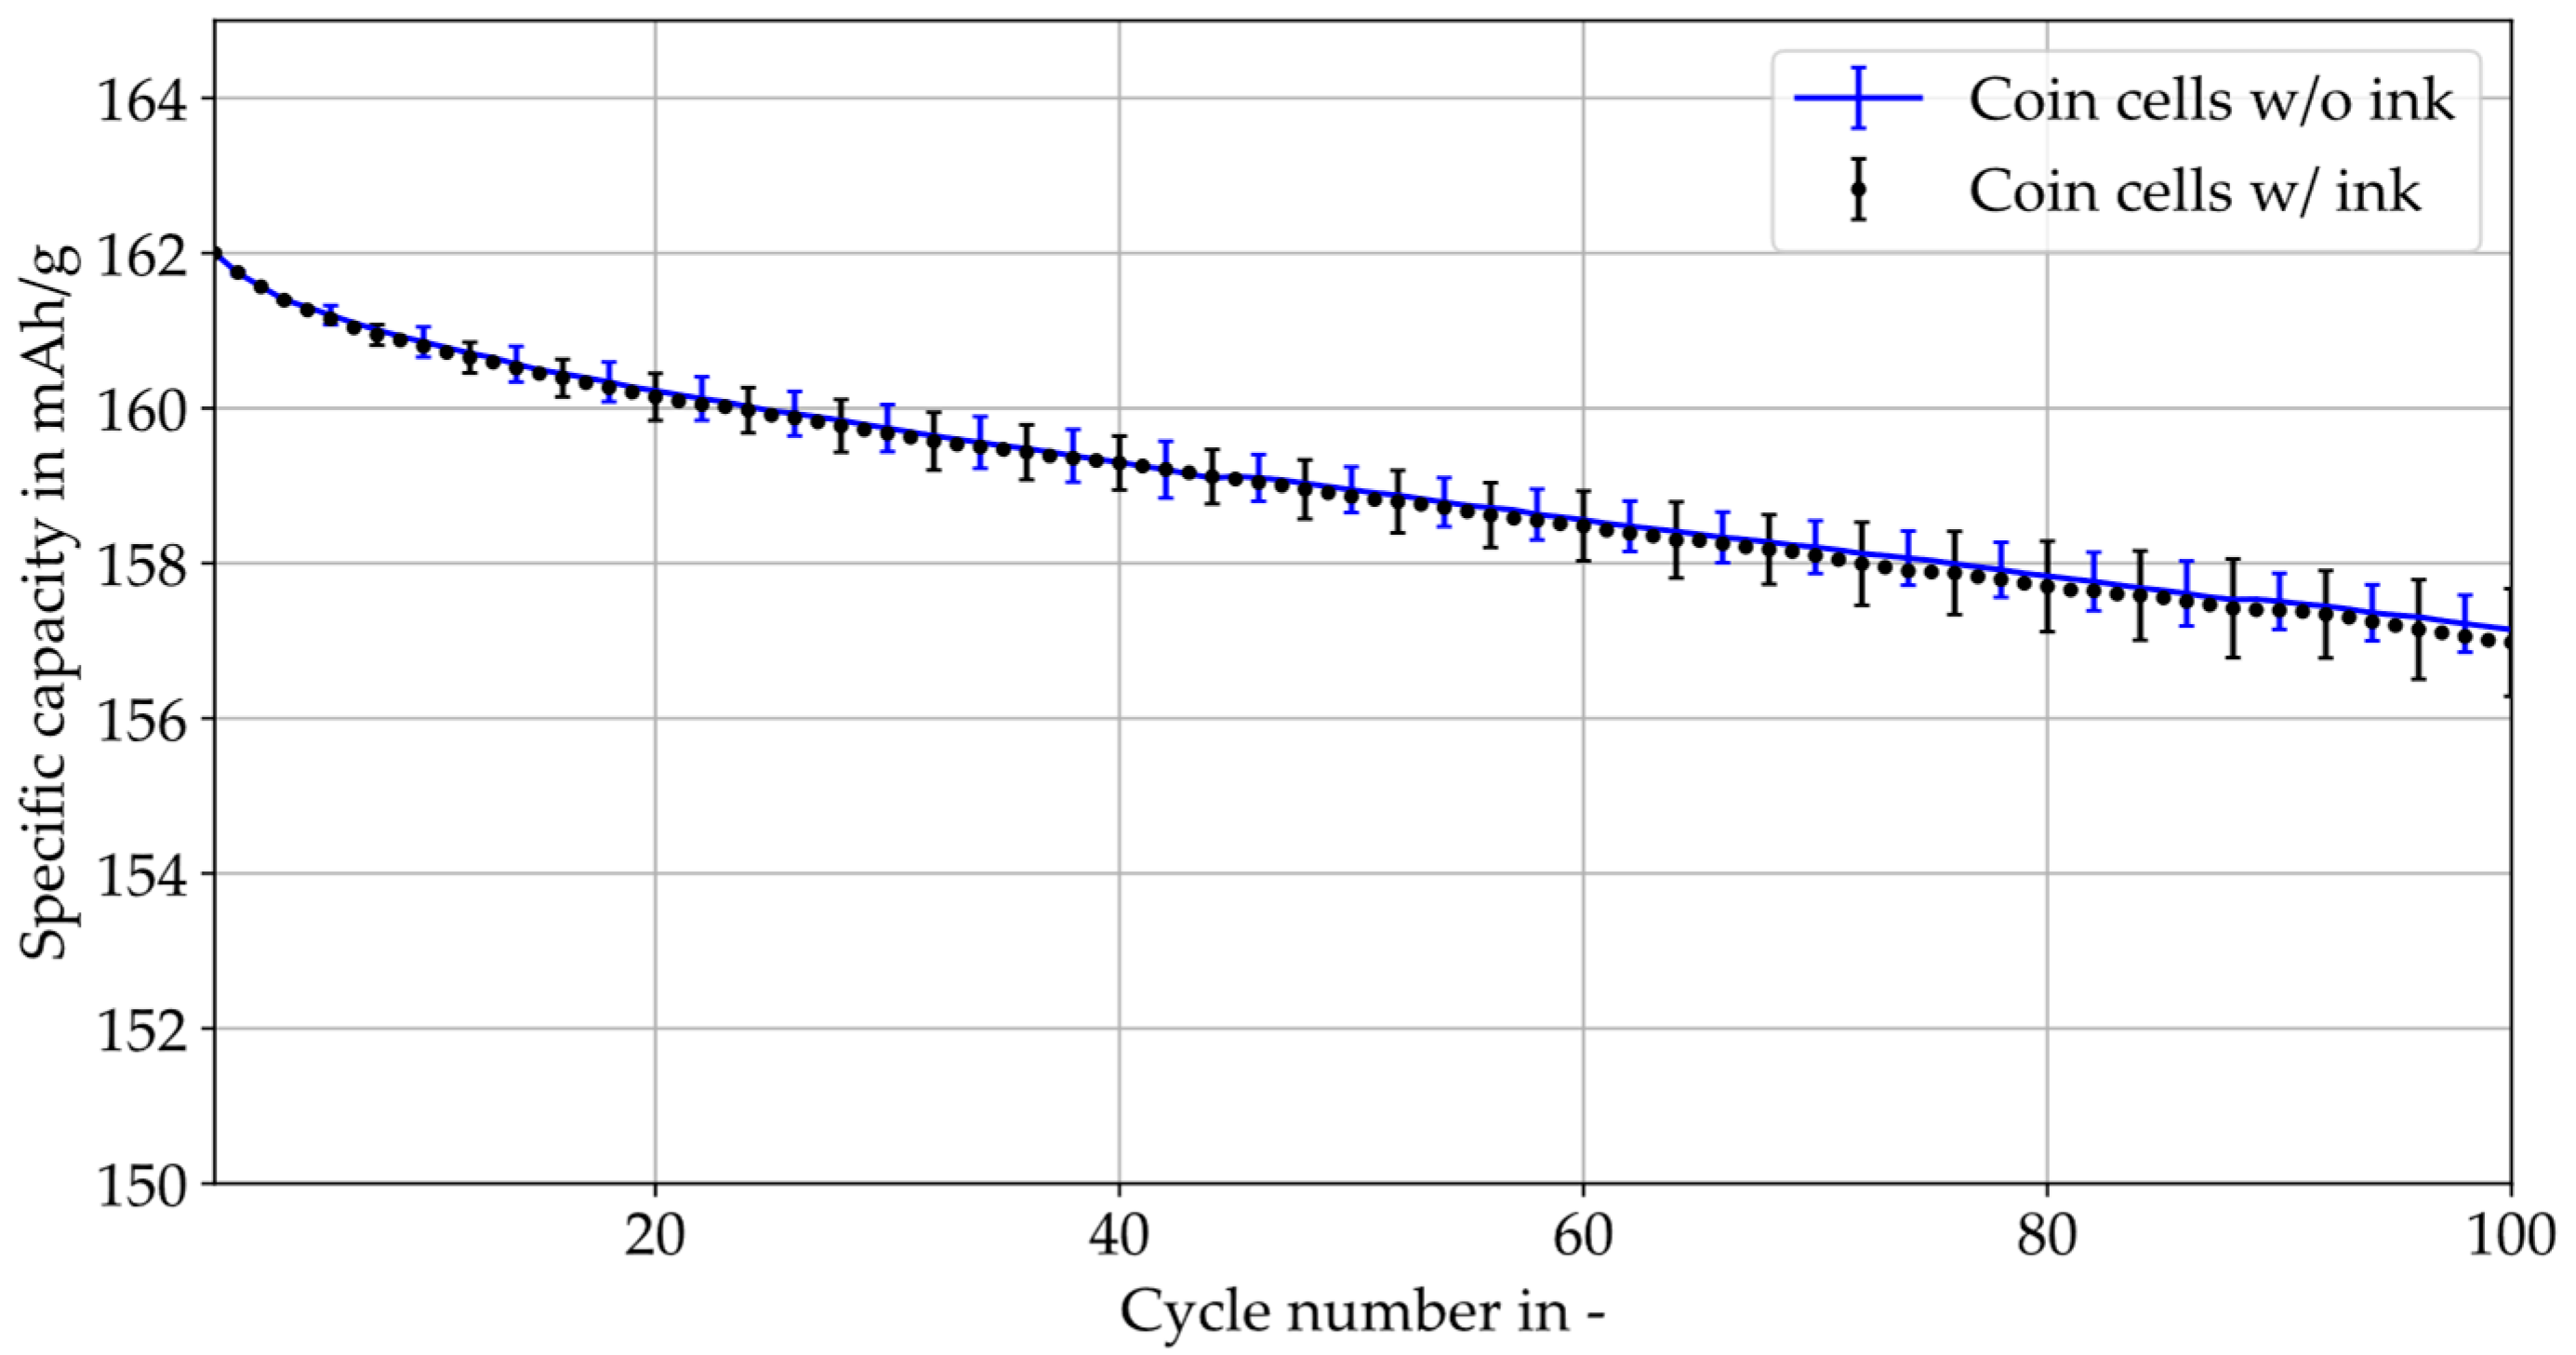
The mean capacity fade during cycling and the standard deviation of the coin cells with and without ink are displayed in Figure 10.
In the cycle test, it was found that the deviations within the experimental set of three coin cells with and without ink were greater than the difference between the mean values of the two batches. The cells with inked electrolytes showed no significant change in the cycling resistance. Furthermore, it must be noted that the concentration of ink used in the electrolyte was higher than in large-format cells. For this transfer, a large-format pouch cell from the iwb was used as a reference. Using the same electrode loading and the dimensions of the iwb cell format [21] with 10 cathodes and 11 anodes results in a total capacity of approx. 4.3 Ah. Using 2 mL/Ah electrolyte for an optimal dosing volume [37] and ink corresponding to 21 markings with 0.11 µL ink due to the inserted electrode sheets, an ink concentration of approx. 269 ppm was achieved. The concentration of ink in a large-format pouch cell is approx. ten times lower than that in the tested coin cells. Hence, it was concluded that the ink used has no influence on the electrochemical properties of large-format battery cells.

5.4. Mechanical Constraints/Foil Weakening and Contacting

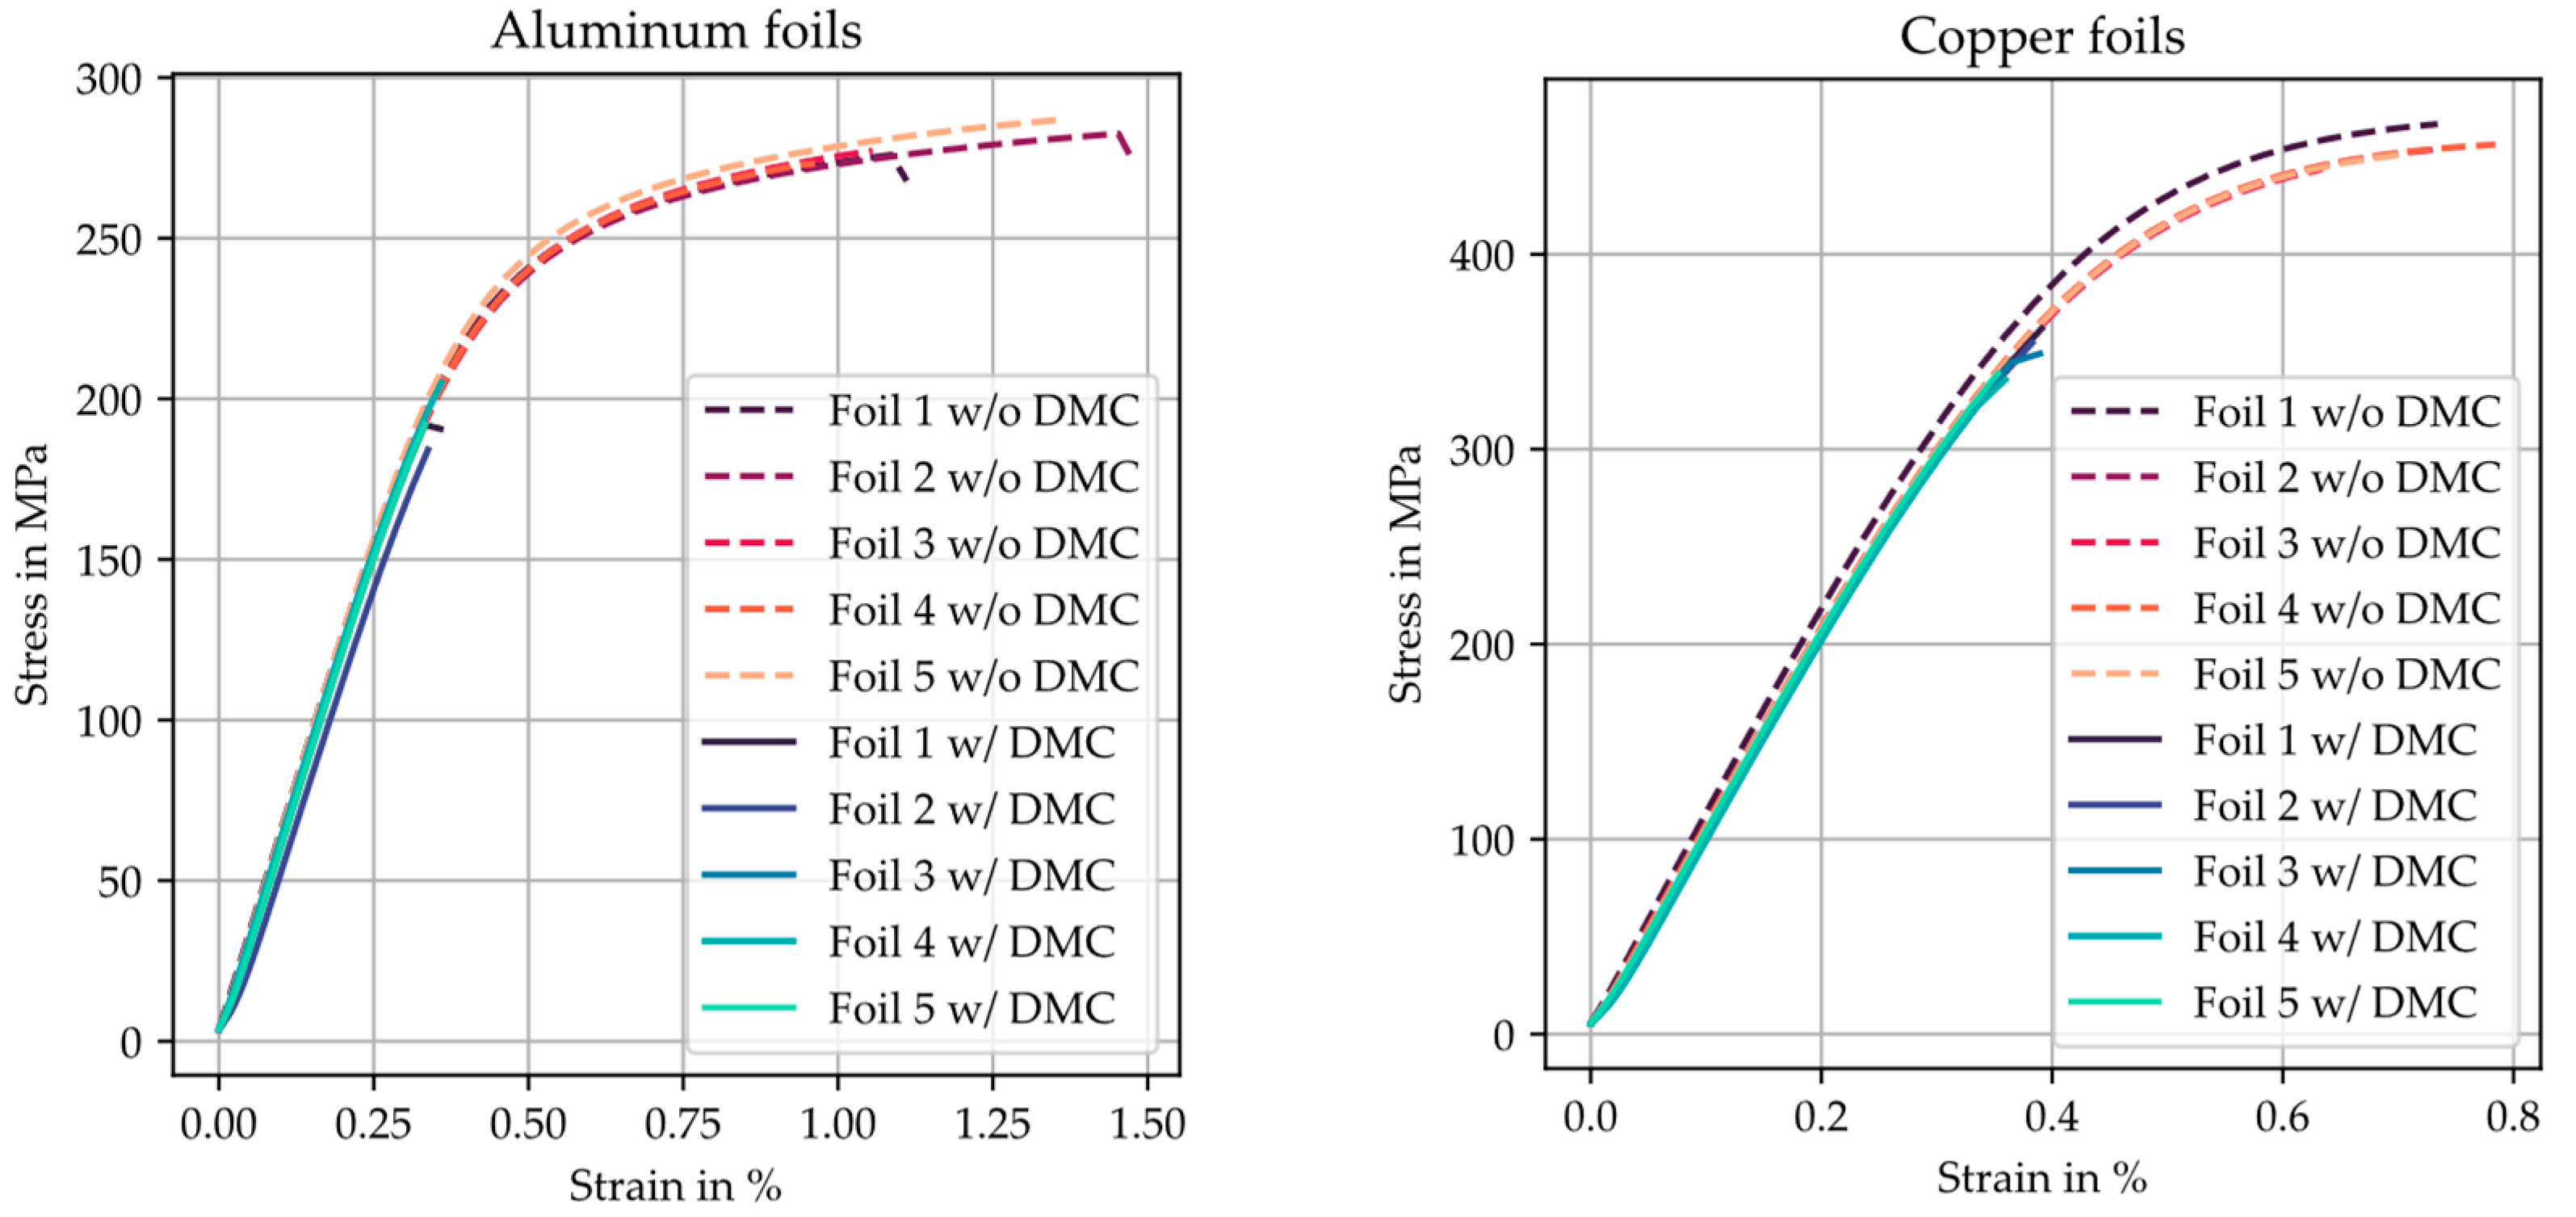
In Figure 11, the measured stress–strain curves of the laser-marked and unmarked aluminum and copper foils are shown.
According to the results of the tensile test with and without DMC markings, the unmarked aluminum foils tore at an elongation of 1% to 1.5%, and the unmarked copper foils at an elongation of approx. 0.75%. Both unmarked foils tore only in the plastic region of the stress–strain curve. The individual curves of the unmarked aluminum and copper foils had only minimal deviations in their courses. The marked aluminum foils tore at an elongation of approx. 0.35%, and the marked copper foils at approx. 0.4%, at the end of the linear elongation range. The gradients of the marked foils also had only very small deviations. This showed that the applied marking led to the breakage of the aluminum and copper foils at lower stresses or strains. This meant that laser marking weakened the foil. Regarding the use of laser-marked aluminum or copper foil in battery cell production, high web tension in electrode production can lead to foil breaks. Using the iwb production line as an example, the web tension was compared with the results of the tensile test. Using a foil with a width of 150 mm, a thickness of 15 µm for aluminum and 10 µm for copper, and a maximum possible foil force in the coating machine of 30 N, maximum web tensions of 13.33 MPa for aluminum and 20 MPa for copper were obtained. However, for both foils and the calculated stresses, no critical limits were exceeded that could cause the foil to break.
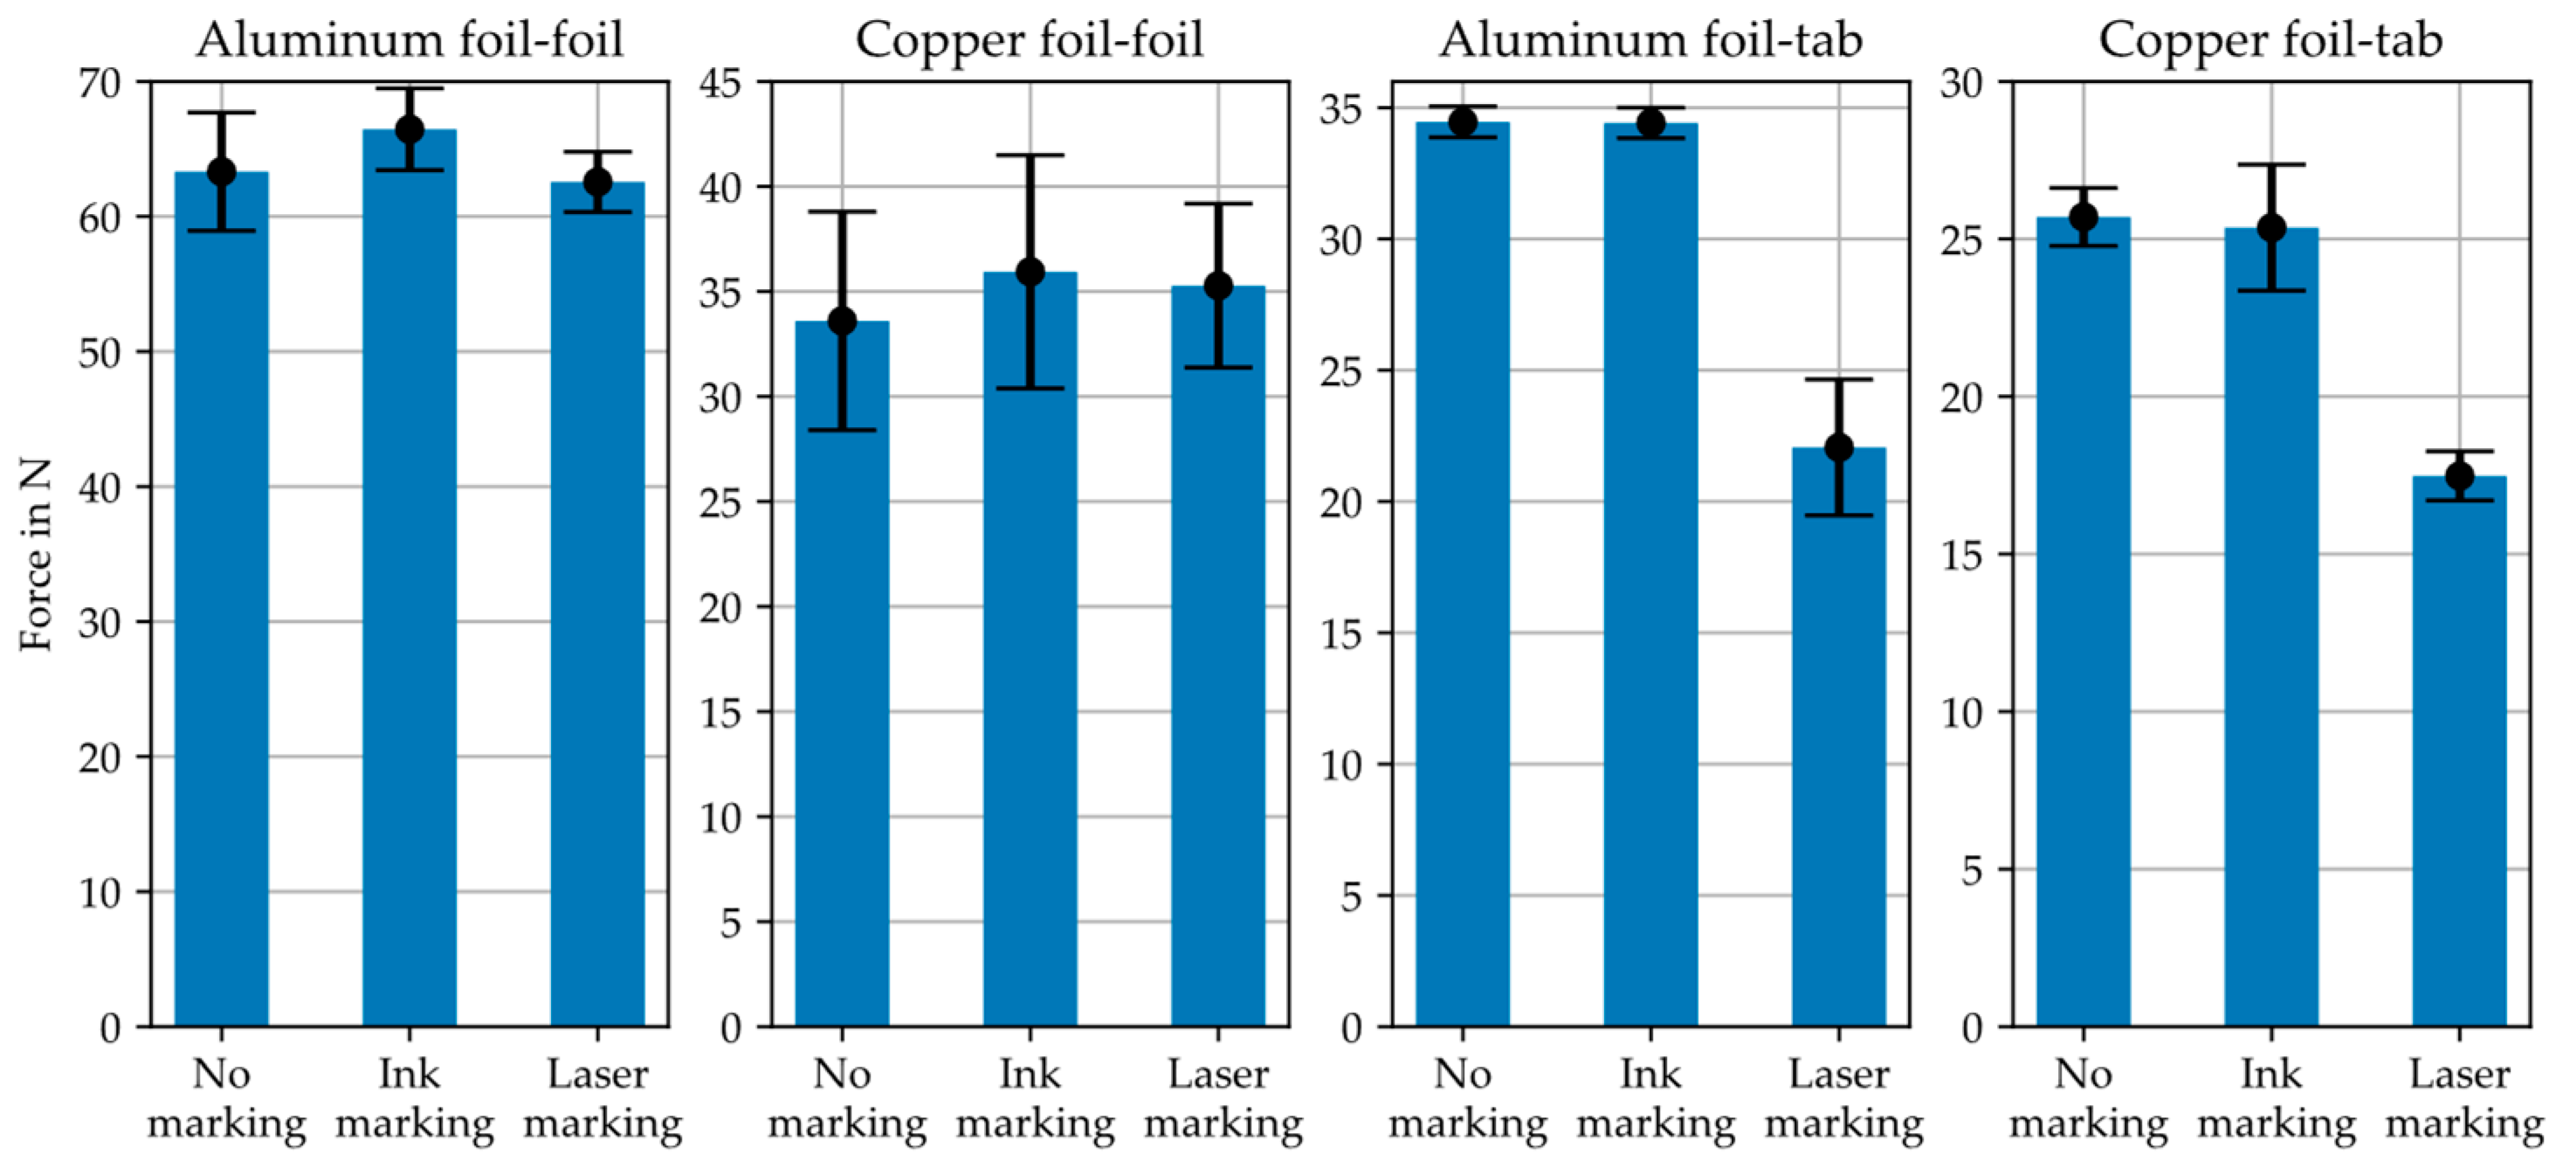
Figure 12 shows the mean measured forces as well as the standard deviation of the five respective specimens without marking, with ink marking, and with laser marking for the tests investigating the influence of the marking on the joining zone.
The results of the foil–foil test for aluminum showed an average maximum force of 63–66 N for all specimens. No significant difference between the specimens was evident here. Similarly, in the foil–foil test with copper, the mean maximum force was 33–36 N and did not show any major differences between the specimens. It was thus concluded that a marking, whether ink- or laser-based, had no negative influence on the ultrasonic joining zone between two foils. However, it must be noted that the marking was smaller than the total joining zone. With a total joining zone of 60 mm2 (3 × 20 mm) and a covered marking of 16.8 mm2 (3 × 5.6 mm), the proportion of marking in the joining zone was approx. 28%. This meant that the remaining, unaffected joining zone could achieve the maximum force, or the marking did not have a major influence. Furthermore, it must be verified whether a smaller ratio of marking to joining zone leads to the weakening of the maximum force.
The results of the foil–tab test on aluminum showed a maximum force of approx. 34 N for no marking as well as ink marking, and approx. 22 N for laser marking. It was shown that the force of the foil–tab joint with a laser marking corresponded to only 2/3 that of an unmarked foil–tab joint. For the copper–tab joint, it was shown that without marking and with ink marking, the maximum force was approx. 26 N, whereas the maximum force for the joint with a laser marking was approx. 17 N. The results showed that the maximum force for laser-marked specimens decreased by 1/3 compared to the unmarked joint. Hence, it was deduced that laser marking in the joining zone between aluminum or copper foils and a tab led to weakening by approx. 1/3 compared to a joining zone without marking. In ultrasonic welding, only the foils and tabs that are in direct contact with the tool are joined. Since the tabs had a thickness of 0.09 mm, the joining zone was formed only above the tab with the foil. This resulted in a joining zone of 24 mm2 (3 × 8 mm). The marking, which was located in the joining zone, had an area of 16.8 mm2 (5.6 × 3 mm). The proportion of the marking in the joining zone was, therefore, 70%. For the use of laser marking in battery cell production, it must be individually evaluated whether the maximum force of the foil–tab connection is sufficient or if the marking needs to be placed outside the joining zone.

6. Summary and Outlook

Necessary investigations to verify the integration of an ink- or laser-based marking into the production of lithium-ion battery cells were presented in a structured manner. The production chain imposes various requirements on a marking due to the different production steps. These were divided into geometric, thermal, chemical, and mechanical boundary conditions. The marking must not influence the production process in such a way that the further processing of the electrode sheet is no longer possible, or that the marking is illegible. The applied markings must be tested to ensure their durability under the relevant conditions. Using the iwb production line as an example, we showed that both the ink and laser marking systems were suitable.
DMCs were recommended as a suitable code format, because they stored the most information in a given area and the marking was, therefore, the smallest.
In the case of laser marking, it should be noted that the foils used were weakened by the marking, but the processability of the foils was not restricted. Furthermore, the use of laser markings resulted in the weakening of the tab bond to the foils.
In the case of ink markings, care must be taken to ensure that no exposure to excessively high temperatures occurs, since the markings will dissolve completely otherwise.
In addition, one must check whether any marking on the electrodes comes into contact with the electrolyte. There is a risk that the ink will dissolve in the solvents and negatively affect the electrochemical properties of the battery cells. However, this could not be detected for the ink used in this work.
Since each production line has its own boundary conditions for ink or laser marking, individual steps for quality assurance need to be conducted. This means that for the respective foils, inks, or laser parameters used and code formats selected, the presented approach must be repeated and checked for the respective physical effects of the process chain on the marking and vice versa.
The presented paper provides the basis for the selection of a suitable marking system. On this basis, markings could be used to implement a tracking and tracing system in subsequent research, making it possible to discretely represent the continuous material flows of electrode production.

Author Contributions

Conceptualization, A.S.; methodology, A.S.; software, A.S. and L.W.; validation, A.S.; formal analysis, A.S., M.L. and L.W.; investigation, A.S. and M.L.; resources, A.S. and M.L.; data curation, A.S.; writing—original draft preparation, A.S.; writing—review and editing, A.S., M.L., L.W. and R.D.; visualization, A.S.; supervision, R.D.; project administration, A.S.; funding acquisition, A.S. and M.L.; All authors have read and agreed to the published version of the manuscript.

Funding

We thank the German Federal Ministry of Education and Research (BMBF) for funding our research. The investigations presented in this paper were developed within the scope of the project “TrackBatt” (03XP0310A).

Data Availability Statement

The data is contained within the article.

Conflicts of Interest

The authors declare no conflict of interest.

References

  1. Okafor, C.L.; Ahove, M.A.; Odewumi, S.G. Intergovernmental panel on climate change. climate change 2021: The physical science basis. In Intergovernmental Panel on Climate Change; Springer International Publishing: Cham, Switzerland, 2021; pp. 13–18. [Google Scholar]
  2. Trenberth, K.E.; Fasullo, J.T. Tracking Earth’s Energy: From El Niño to Global Warming. Surv. Geophys. 2012, 33, 413–426. [Google Scholar] [CrossRef] [Green Version]
  3. Schmuch, R.; Wagner, R.; Hoerpel, G.; Placke, T.; Winter, M. Performance and cost of materials for lithium-based rechargeable automotive batteries. Nat. Energy 2018, 3, 267–278. [Google Scholar] [CrossRef]
  4. Pillot, C. The Rechargeable Battery Market and Main Trends 2018-2030. In Proceedings of the International Congress for Battery Recycling, Avicenne Energy Information for Growth, Paris, France, 28 May 2019. [Google Scholar]
  5. Kwade, A.; Haselrieder, W.; Leithoff, R.; Modlinger, A.; Dietrich, F.; Droeder, K. Current status and challenges for automotive battery production technologies. Nat. Energy 2018, 3, 290–300. [Google Scholar] [CrossRef]
  6. Schnell, J.; Nentwich, C.; Endres, F.; Kollenda, A.; Distel, F.; Knoche, T.; Reinhart, G. Data mining in lithium-ion battery cell production. J. Power Sources 2019, 413, 360–366. [Google Scholar] [CrossRef]
  7. Schnell, J.; Reinhart, G. Quality Management for Battery Production: A Quality Gate Concept. Procedia CIRP 2016, 57, 568–573. [Google Scholar] [CrossRef]
  8. Stock, S.; Ceruti, A.; Günter, F.J.; Reinhart, G. Introducing Inline Process and Product Analysis for the Lean Cell Finalization in Lithium-Ion Battery Production. Procedia CIRP 2021, 104, 1052–1058. [Google Scholar] [CrossRef]
  9. Turetskyy, A.; Thiede, S.; Thomitzek, M.; Drachenfels, N.; von Pape, T.; Herrmann, C. Toward Data-Driven Applications in Lithium-Ion Battery Cell Manufacturing. Energy Technol. 2020, 8, 1900136. [Google Scholar] [CrossRef] [Green Version]
  10. Thiede, S.; Turetskyy, A.; Kwade, A.; Kara, S.; Herrmann, C. Data mining in battery production chains towards multi-criterial quality prediction. CIRP Ann. 2019, 68, 463–466. [Google Scholar] [CrossRef]
  11. Haug, A.; Zachariassen, F.; van Liempd, D. The costs of poor data quality. JIEM 2011, 4, 168–193. [Google Scholar] [CrossRef]
  12. Guenther, T.; Billot, N.; Schuster, J.; Schnell, J.; Spingler, F.B.; Gasteiger, H.A. The Manufacturing of Electrodes: Key Process for the Future Success of Lithium-Ion Batteries. AMR 2016, 1140, 304–311. [Google Scholar] [CrossRef]
  13. Riexinger, G.; Doppler, J.P.; Haar, C.; Trierweiler, M.; Buss, A.; Schoebel, K.; Ensling, D.; Bauernhansl, T. Integration of Traceability Systems in Battery Production. Procedia CIRP 2020, 93, 125–130. [Google Scholar] [CrossRef]
  14. International Organization for Standardization. ISO 9000:2015-11(en) Quality Management Systems—Fundamentals and Vocabulary; Beuth Verlag GmbH: Berlin, Germany, 2015. [Google Scholar]
  15. Pizzuti, T.; Mirabelli, G.; Sanz-Bobi, M.A.; Goméz-Gonzaléz, F. Food Track & Trace ontology for helping the food traceability control. J. Food Eng. 2014, 120, 17–30. [Google Scholar] [CrossRef]
  16. Heyder, M.; Theuvsen, L.; Hollmann-Hespos, T. Investments in tracking and tracing systems in the food industry: A PLS analysis. Food Policy 2012, 37, 102–113. [Google Scholar] [CrossRef]
  17. Ruiz-Garcia, L.; Steinberger, G.; Rothmund, M. A model and prototype implementation for tracking and tracing agricultural batch products along the food chain. Food Control 2010, 21, 112–121. [Google Scholar] [CrossRef] [Green Version]
  18. Rotunno, R.; Cesarotti, V.; Bellman, A.; Introna, V.; Benedetti, M. Impact of Track and Trace Integration on Pharmaceutical Production Systems. Int. J. Eng. Bus. Manag. 2014, 6, 25. [Google Scholar] [CrossRef] [Green Version]
  19. Wessel, J.; Turetskyy, A.; Wojahn, O.; Herrmann, C.; Thiede, S. Tracking and Tracing for Data Mining Application in the Lithium-ion Battery Production. Procedia CIRP 2020, 93, 162–167. [Google Scholar] [CrossRef]
  20. Wittine, N.; Wenzel, S.; Kern, C.; Refflinghaus, R.; Trostmann, T. Introduction of Traceability into the Continuous Improvement Process of SMEs; Publish-Ing: Hannover, Germany, 2020. [Google Scholar]
  21. Sommer, A.; Leeb, M.; Haghi, S.; Guenter, F.J.; Reinhart, G. Marking of Electrode Sheets in the Production of Lithium-Ion Cells as an Enabler for Tracking and Tracing. Procedia CIRP 2021, 104, 1011–1016. [Google Scholar] [CrossRef]
  22. GS1 Germany GmbH. GS1 DataMatrix Guideline: Overview and Technical Introduction to the Use of GS1 DataMatrix, 2.5.1; GS1 AISBL: Cologne, Germany, 2018; pp. 1–60. [Google Scholar]
  23. National Aeronautics and Space Administration. Applying Data Matrix Identification Symbols on Aerospace Parts: NASA-STD-6002D; National Aeronautics and Space Administration: Washington, DC, USA, 2008; pp. 29–32.
  24. Lazov, L.; Deneva, H.; Narica, P. Laser Marking Methods. ETR 2015, 1, 108. [Google Scholar] [CrossRef]
  25. Shawn Lee, S.; Hyung Kim, T.; Jack Hu, S.; Cai, W.W.; Abell, J.A.; Li, J. Characterization of Joint Quality in Ultrasonic Welding of Battery Tabs. J. Manuf. Sci. Eng. 2013, 135, 541. [Google Scholar] [CrossRef]
  26. Liukkonen, M.; Tsai, T.-N. Toward decentralized intelligence in manufacturing: Recent trends in automatic identification of things. Int. J. Adv. Manuf. Technol. 2016, 87, 2509–2531. [Google Scholar] [CrossRef]
  27. Kern, C.; Refflinghaus, R.; Trostmann, T.; Wenzel, S.; Wittine, N.; Herrlich, F. Concept for selecting and integrating traceability systems in the continuous improvement process of SMEs, Excellence in Services. In Proceedings of the 22nd International Conference, Thessaloniki, Greece, 28–31 October 2019; pp. 350–363. [Google Scholar]
  28. International Organization for Standardization; International Electrotechnical Commission. ISO/IEC 16022:2006 (E): Information Technology—Automatic Identification and Data Capture Techniques—Data Matrix Bar Code Symbology Specification; Beuth Verlag GmbH: Berlin, Germany, 2006. [Google Scholar]
  29. International Organization for Standardization; International Electrotechnical Commission. ISO/IEC 18004:2015 (E): Information Technology—Automatic Identification and Data Capture Techniques—QR Code Bar Code Symbology Specification; Beuth Verlag GmbH: Berlin, Germany, 2015. [Google Scholar]
  30. International Organization for Standardization; International Electrotechnical Commission. ISO/IEC 24724 (E): Information Technology—Automatic Identification and Data Capture Techniques—GS1 DataBar Bar Code Symbology Specification; Beuth Verlag GmbH: Berlin, Germany, 2011. [Google Scholar]
  31. Kriegler, J.; Hille, L.; Stock, S.; Kraft, L.; Hagemeister, J.; Habedank, J.B.; Jossen, A.; Zaeh, M.F. Enhanced performance and lifetime of lithium-ion batteries by laser structuring of graphite anodes. Appl. Energy 2021, 303, 117693. [Google Scholar] [CrossRef]
  32. Schreiner, D.; Zuend, T.; Guenter, F.J.; Kraft, L.; Stumper, B.; Linsenmann, F.; Schueßler, M.; Wilhelm, R.; Jossen, A.; Reinhart, G.; et al. Comparative Evaluation of LMR-NCM and NCA Cathode Active Materials in Multilayer Lithium-Ion Pouch Cells: Part I Production, Electrode Characterization, and Formation. J. Electrochem. Soc. 2021, 168, 30507. [Google Scholar] [CrossRef]
  33. Guenter, F.J.; Roessler, S.; Schulz, M.; Braunwarth, W.; Gilles, R.; Reinhart, G. Influence of the Cell Format on the Electrolyte Filling Process of Lithium-Ion Cells. Energy Technol. 2020, 8, 1801108. [Google Scholar] [CrossRef]
  34. Lee, S.S.; Kim, T.H.; Hu, S.J.; Cai, W.W.; Abell, J.A. Joining Technologies for Automotive Lithium-Ion Battery Manufacturing: A Review. In Proceedings of the ASME 2010 International Manufacturing Science and Engineering Conference, Erie, PA, USA, 12–15 October 2010; pp. 541–549. [Google Scholar]
  35. Grabmann, S.; Tomcic, L.; Zaeh, M.F. Laser beam welding of copper foil stacks using a green high power disk laser. Procedia CIRP 2020, 94, 582–586. [Google Scholar] [CrossRef]
  36. Grabmann, S.; Kriegler, J.; Harst, F.; Guenter, F.J.; Zaeh, M.F. Laser welding of current collector foil stacks in battery production–mechanical properties of joints welded with a green high-power disk laser. Int. J. Adv. Manuf. Technol. 2022, 118, 2571–2586. [Google Scholar] [CrossRef]
  37. Guenter, F.J.; Burgstaller, C.; Konwitschny, F.; Reinhart, G. Influence of the Electrolyte Quantity on Lithium-Ion Cells. J. Electrochem. Soc. 2019, 166, A1709–A1714. [Google Scholar] [CrossRef]
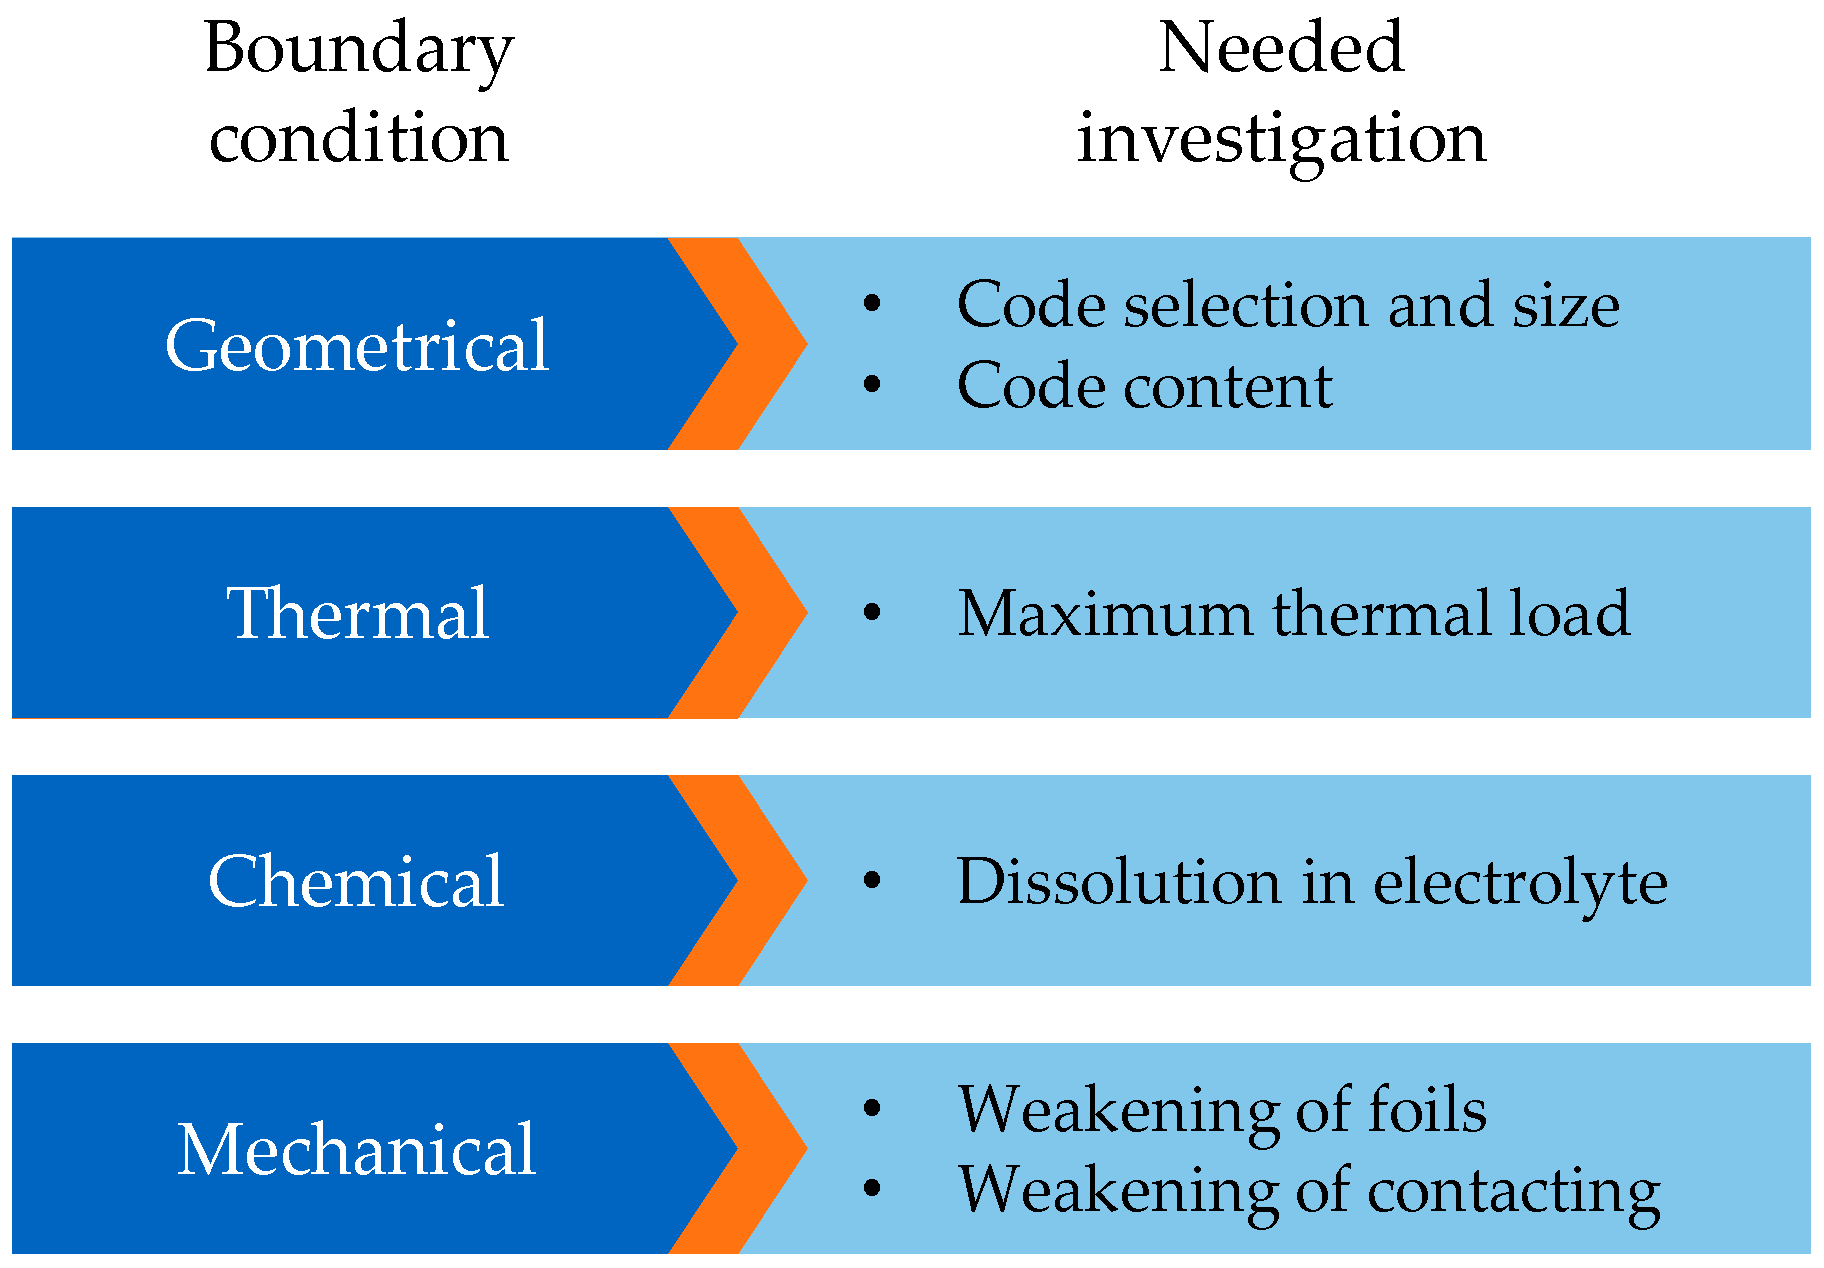
Figure 1. Appropriate investigations are derived from the geometric, thermal, chemical, and mechanical boundary conditions of battery cell production.
Batteries 09 00089 g001
Figure 2. Flow diagram showing the necessary investigations for the successful integration of marking; the diagram is divided into code design and process chain verification, as well as laser and ink technology paths.
Batteries 09 00089 g002
Figure 3. Left: schematic drawing of the tensile test setup and the prepared specimen with and without laser-printed marking/DMC. Right: picture of the test setup and four exemplary prepared specimens for each foil with and without laser marking.
Batteries 09 00089 g003
Figure 4. Top left: schematic drawing of the test setup for the foil–foil investigation. Top right: exemplary specimens with and without marking in the joining zone between the foils. Bottom left: schematic drawing of the test setup for the foil–tab investigation. Bottom right: exemplary specimens with and without marking in the joining zone between foil and tab.
Batteries 09 00089 g004
Figure 5. Comparison of the selected code formats (DMC, QR code, and DataBar Expanded code) regarding their storable content and the space required; calculated with a module width of 0.264 mm, which is the recommended module size for GS1 DataBar Expanded [22].
Batteries 09 00089 g005
Figure 6. Schematic anode illustration of an iwb pouch cell format current collector. The available size was 67 mm × 15 mm. A DMC was applied with a size of 5.6 mm × 5.6 mm. The figure shows a full-scale image of a possible code and the current collector.
Batteries 09 00089 g006
Figure 7. Left: (a) copper foil with ink-printed DMC, (b) aluminum foil with ink-printed DMC, (c) copper foil with laser-marked DMC, (d) aluminum foil with laser-marked DMC. Right: corresponding enlargement (a*d*) of the red-outlined modules of the four codes. For a module size of 0.35 mm, the codes had a resulting size of 5.6 × 5.6 mm.
Batteries 09 00089 g007
Figure 8. Lasered and printed markings/DMCs on copper and aluminum foil: left, directly after application; middle, after 120 °C electrode coil drying; right, after 2 min at 500 °C.
Batteries 09 00089 g008
Figure 9. Voltage profiles of the six coin cells during formation; the curves of the coin cells with ink are shown in dots, whereas the curves of the cells without ink are depicted with solid lines.
Batteries 09 00089 g009
Figure 10. Mean values and standard deviation of the specific capacity in the first 100 cycles of the coin cells with and without ink during the cycling test. The specific capacity of each coin cell was compared to a theoretical value of 162 mAh/g in the beginning.
Batteries 09 00089 g010
Figure 11. Results of the tensile test with laser DMC marked and unmarked aluminum (left) and copper foils (right).
Batteries 09 00089 g011
Figure 12. Averaged measured force and standard deviation of foil–foil and foil–tab tests without marking, with ink marking, and with laser marking for aluminum and copper foils.
Batteries 09 00089 g012
Table 1. Mean Coulomb efficiency and standard deviation (SD) during the first three forming cycles and the mean capacity and SD obtained for each coin cell with and without ink.
Cells1st Cycle2nd Cycle3rd CycleMean Capacity in mAhSD
Mean CE in %SDMean CE in %SDMean CE in %SD
w/o ink84.40.298.60.299.00.14.2700.1
w/ink83.60.298.40.298.80.14.2130.1
Disclaimer/Publisher’s Note: The statements, opinions and data contained in all publications are solely those of the individual author(s) and contributor(s) and not of MDPI and/or the editor(s). MDPI and/or the editor(s) disclaim responsibility for any injury to people or property resulting from any ideas, methods, instructions or products referred to in the content.