Abstract
Lithium-ion batteries are widely used in energy storage, small electronic devices and other fields due to their advantages of high energy density and long life cycles, as well as causing less damage to the environment than alternatives. For safety, it is essential to propose reasonable methods to assess batteries’ health statuses. Therefore, a health assessment model based on the evidential reasoning (ER) rule is proposed in this article. Firstly, the voltage rise time and the current fall time are taken as observation indicators, which contain information about the health status of lithium-ion batteries. Secondly, the information of various indicators is integrated into a belief structure, and the indicator reliability and indicator weights are adequately considered in the assessment model. Thirdly, there are some perturbations that will affect the operating status of batteries and cause the batteries’ reliability to fluctuate, so we use perturbation analysis to determine the adaptability of batteries to perturbations. We set two bounded parameters, the perturbation coefficient and the maximum perturbation error, to assess the reliability of lithium-ion batteries when experiencing perturbations. Finally, on the basis of the whole-life open data set of lithium-ion batteries from the National Aeronautics and Space Administration’s Prognostics Center of Excellence, the validity of the health assessment model and perturbation analysis is demonstrated.
1. Introduction
Lithium-ion batteries are widely used in modern life and industrial production, from personal electronic devices to the electric vehicle field of industrial production [1] and the aerospace field [2]. However, as the time taken for lithium-ion batteries to charge and discharge increases, health status indexes such as battery life and storage capacity continue to degrade until the end of their lives [3]. Therefore, an effective health assessment model must be proposed to obtain batteries’ health status in real time. The health status, charge status, life status, end time of discharge and remaining useful life (RUL) are used to estimate several battery parameters or health indicators [4]. Moreover, there are some perturbations, including external and internal perturbations, that will affect the normal operation of lithium-ion batteries. Currently, there is a lack of effective methods to assess the influence of perturbation influence. To remedy this situation, it is essential to study the reliability of lithium-ion batteries under perturbation conditions.
Currently, aiming at the health assessment of lithium-ion batteries, many domestic and foreign studies highlighted common methods for health assessment, including model-driven methods and data-driven methods.
Model-driven methods are established by using the system principle, and can be categorized into two groups, namely physical models and mathematical models. Physical models are built based on the specific phenomena that occur during batteries’ operation [5]. Iurilli et al. introduced a method to track the degradation of batteries and estimate state of health (SoH) from electrochemical impedance spectroscopy measurements, which can achieve a physics-based SoH estimation [6]. Xavier et al. developed a scalable framework, which can control the performance of lithium-ion batteries to their true physical boundaries by exploiting internal electrochemical quantities [7]. Mathematical models are built based on a mathematical approach, which can effectively estimate the life cycle of batteries [8]. Motapon et al. proposed a cycle life model for lithium-ion batteries based on fatigue theory and equivalent cycle counting, which can effectively estimate the cycle life of batteries [9].
Data-driven methods rely on historical observations while modeling by learning regularities of the observation data. Tang et al. built a model driven by data gathered using the operating modes of two battery types to assess batteries’ health statuses [10]. Zhao et al. developed a fused neural network model for lithium-ion battery capacity prediction by integrating a generalized learning system algorithm and a long short term memory neural network [11]. Hsu et al. built a new structured neural network model that combined a convolution training strategy to predict lithium-ion batteries’ RUL [12]. Ma et al. built a new extreme learning machine model based on extensive learning, which can quickly and adequately estimate the lithium-ion batteries’ health status [13]. Yao et al. built a new hybrid prediction model which integrates particle swarm optimization, an extreme learning machine, and a relevance vector machine to predict the remaining useful life of lithium-ion batteries [14].
However, both model-driven and data-driven methods have drawbacks. For model-driven methods, physical models only consider the physical and chemical properties of the battery, and ignore other perturbations in engineering, which makes the assessment results inaccurate. In mathematical models, a key problem is how to establish an accurate model that fully considers the complexity of the actual engineering situation. For data-driven methods, they are too objective and ignore the subjective control of expert knowledge, which is also an important part of health assessment. There are some data-driven methods that use neural networks to construct models, whose assessment process is uninterpretable and untraceable. As a semi-quantitative expert system, the reasoning process of the evidential reasoning (ER) rule is transparent and interpretable, which can effectively resolve the problem of a complex model mechanism and excessive dependence on observation data in batteries, and it can effectively fuse the information of multiple original indicators to obtain accurate assessment results [15], it is used in this article for assessing the lithium-ion batteries’ health status.
Yang et al. developed the Dempster Shafer (D-S) theory [16] and the ER algorithm [17] to establish an ER rule in 2013, whose main feature is that the evidence weight and the evidence reliability are considered. The ER rule clearly distinguishes the importance and the reliability of evidence, it is a generalized joint probabilistic inference that effectively resolves the evidence inference conflict and exponential explosion problems in D-S theory [18]. The expert knowledge and objective data are combined for description in the ER rule, which can effectively handle uncertainty or unknown information [19,20]. The ER rule, as a semi-quantitative assessment method, can obtain objective and subjectivity information to obtain comprehensive assessment results [21,22]. Zhao et al. used the ER rule to develop an online safety assessment method, which obtains comprehensive assessment results of the system’s safety levels [23]. Ma et al. used the ER rule and linguistic granulation optimization to solve the probabilistic linguistic multi-attribute group-decision-making problem in terms of reliability [24]. The abovementioned literature has validated the effectiveness of the ER rule in assessment, so we have used it to construct a health assessment model for lithium-ion batteries.
Due to the precision and complexity of lithium-ion batteries, they are easily affected by external and internal perturbation factors, resulting in reduced reliability. There is a need for perturbation analysis of lithium-ion batteries. To analyze the adaptation of lithium-ion batteries to different perturbations, perturbation analysis is adopted to simulate these perturbations. The perturbation analysis was first proposed by Ho [25]. Tang et al. combined perturbations and the ER rule for the first time, and perturbations were added to indicator data, and analysis of the sensitivity to perturbations was verified on aerospace relays [26]. Therefore, we have combined the ER rule and perturbation analysis to construct a battery reliability assessment model for perturbations.
The contributions are summarized as follows.
- (1)
- There are many indicators of the health of lithium-ion batteries, and the ER rule is effective in fusing information from multiple-sources. With this in mind, we introduce a new battery health assessment model using the ER rule.
- (2)
- Taking perturbations into consideration, a reliability assessment model for lithium-ion batteries is introduced, which can quantify the adaptation of the battery to perturbations.
The rest of this article is summarized as follows. In Section 2, the health assessment model and reliability assessment model are described, and all the assessment steps are determined. In Section 3, the health assessment model is described. In Section 4, the perturbation analysis is described in detail, and the reliability assessment model considering perturbation is constructed. In Section 5, the generality analysis of the proposed model is presented. In Section 6, the open data set of batteries is analyzed. In Section 7, the conclusion is presented.
2. New Health Assessment Model and Problem Formulation
The process of assessing models for lithium-ion batteries is determined in Section 2.1. The assessment problems are formulated in Section 2.2.
2.1. Structure of the New Health Assessment Model
Perturbations may affect the health status of lithium-ion batteries. To further assess the reliability of lithium-ion batteries under perturbations, we introduce the reliability assessment model. There are multiple observation indicators that can reflect a battery’s health status. At the same time, considering the rationality of the indicators, the rise time of the voltage and the fall time of the current for each charging cycle are taken as the observation indicators., The ER rule is used as an aggregation scheme to build a health assessment model. The assessment process is shown in Figure 1.
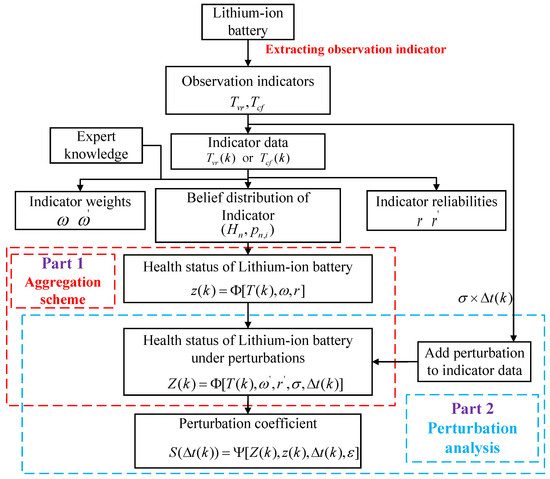
Figure 1.
Process for assessing lithium-ion battery health status.
In Figure 1, the observed indicators are taken as input data for the assessment model. Weights and reliabilities of indicators are calculated from these indicators. In part 1, evidence is generated from the observed indicator data, and we introduce an aggregation approach that allows the evidence, weights, and reliability to be fully integrated into the health assessment results. In part 2, the perturbations are added to the indicator data, the perturbation coefficient is calculated as the basis of the lithium-ion battery’s reliability. The explanation of all variables in Figure 1 is given as follows:
- (1)
- denotes the number of the cycle when the observation indicator data are gathered.
- (2)
- and indicate the voltage rise time and current fall time, respectively.
- (3)
- and denote the indicator weight and the indicator weight under perturbation, respectively, .
- (4)
- and denote the indicator reliability and the indicator reliability under perturbation, respectively, .
- (5)
- denotes the reference level, and denotes the belief degree of reference level under indicator .
- (6)
- denotes the perturbation intensity, denotes the perturbation variable at the cycle, and denotes the maximum error.
- (7)
- and denote the health assessment results and the health assessment results under perturbation at the cycle, respectively.
- (8)
- denotes the perturbation coefficient at the cycle, which can quantify the adaptability of lithium-ion batteries to perturbations.
Remark 1.
The assessment indicators
and are associated with cathode material and anode material. However, in a battery, the indicator data collected from cathode and anode are symmetrical. The materials of cathode and anode can affect the numerical problems of corresponding characteristic indicators for certain batteries, so the characteristic indicators of cathode and anode should be established based on multiple experiments combined with expert knowledge, and the corresponding data collected should be fused by the ER rule.
2.2. Description of Problem for Health Assessment Method
Lithium-ion batteries health assessment should focus on three problems, as shown in Figure 1.
Problem 1.
Construction of the lithium-ion battery health assessment model. In practical engineering, lithium-ion batteries have many monitoring indicators, and each has its own characteristics, so we should integrate multiple indicators to assess their health. We introduce the following model to produce a comprehensive health result:
where denotes a nonlinear function, which can obtain the health assessment level.
Problem 2.
Construction of the lithium-ion battery reliability assessment model. During the operation of the battery, the battery reliability is easily affected by perturbations, resulting in its fluctuation in reliability. Therefore, we introduce the following model to obtain the reliability of the lithium-ion battery under perturbations:
Problem 3.
Construction of a perturbation quantization equation. When the Problems 1 and 2 are resolved, it is necessary to quantify the effect of perturbations on the lithium-ion battery’s health status. This is because the lithium-ion battery has different adaptabilities to various perturbations. Thus, we introduce the quantization equation:
where represents a nonlinear function, which can quantify the adaptability of a lithium-ion battery to perturbations.
Remark 2.
and
are, in essence, equivalent to the results of lithium-ion battery health assessment.
is obtained under the perturbation condition. Moreover, it is key to perturbation analysis to reasonably construct the calculation equation of the perturbation coefficient
and obtain accurate battery reliability results.
3. Construction of the Assessment Models
Firstly, we extracted the observed indicators of lithium-ion batteries. Secondly, the method of setting indicator weights and reliabilities was determined, and the indicator information was transformed into the belief distributions. Finally, the lithium-ion battery health assessment model was described.
3.1. Determining the Observation Indicators
In the operation of batteries, directness such as capacity and internal resistance is difficult to obtain. Therefore, starting from the performance parameters that can be monitored, considering the process of the full life cycle of lithium-ion batteries, the voltage rise time and the current fall time were extracted as observation indicators [27], and can be calculated by
where , denotes the number of cycle for the battery’s full life, represents the total time of voltage rise at the cycle, and and represents the moment when the voltage reaches the rated upper bound and the lower bound at the cycle, respectively. represents the total time of current fall at the cycle, and and represents the moment when the current reaches the rated upper bound and the lower bound at the cycle, respectively.
3.2. Determining the Indicator Reliability
The reliability is an extrinsic property of the observables and is primarily influenced by some unknown observation targets. Therefore, it is necessary to combine reliability when fusing indicator data. Based on [23], we used the distance-based method to determine the reliability.
We defined the observation indicators, the observation indicators are denoted by , denotes the indicator data at the cycle within cycles and indicates the average value of the within . is calculated by
Then, the distance between and is calculated by
The average distance between all indicator data within cycles is
The indicators’ reliability is calculated as follows:
where denotes the maximum value of . The discreet degree of the indicator data can be expressed by in that the larger it is, the more unreliable the indicators are. Therefore, calculated by using indicator data is reasonable as an indicator of reliability.
3.3. Determining the Indicator Weight
When fusing the observation indicators, different indicators have different importance, which can be reflected in the indicator weight. How to automatically adapt the weighting to various conditions for assessment is key. Based on [23], we used the coefficient of variation (COV) method to determine the weight.
Suppose there are still observation indicators, the observation indicators are , the mean value of within cycles is and can be calculated by (6). The mean square error of the indicator within cycles is and there are
The indicator weight can be calculated by
where indicates the degree of volatility of . Volatility denotes the indicator’s ability to react to abnormal data. The higher the volatility of the indicator, the higher the weight is. Therefore, the weight calculated by the COV method is reasonable.
3.4. Standardization of Indicator Data
Due to the complexity of lithium-ion batteries, there are some uncertainties such as vagueness and ignorance in assessment progress. Therefore, to quantitatively describe uncertainty information, we used the rule-based method [28] to transform indicator data into a unified form, and then fused the transformed information. Before the transformation, the reasonable assessment level and reference value should be determined.
where is the reference value of the indicator and , is the input data of indicator , and is the number of assessment levels. denotes belief degree and satisfies , .
3.5. Aggregation Method Based on the ER Rule
We took the ER rule as an aggregation scheme to fuse indicator information and evidence parameters. The health status of the battery is indicated as a belief distribution.
Suppose the number of independent evidence is , each indicator is treated as a piece of evidence. The input indicator data are , which is denoted as evidence . There are reference levels, namely . Therefore, the evidence can be profiled in the form of belief distribution form:
where denotes the belief degree of relative to discernment framework , namely global ignorance.
The union belief degree of pieces of evidence can be calculated by the analytical ER method [19], as follows:
The combined assessment results are as follows:
The (18) is equivalent to the and in (1) and (2).
Assuming that denotes the utility of [29], the expected utility of an integrated health assessment is calculated by
where the expected utility can effectively measure the comprehensive numerical output.
Remark 3.
We used the offline observation indicator data to build the assessment model, which can monitor batteries’ statuses in real time. We can then calculate, by replacing the overall cycle period in (6)–(12) with its sub-period , the reliability and weight iteratively to assess batteries’ statuses in real time.
4. Perturbation Analysis
In engineering, lithium-ion batteries may be affected by some perturbations such as high temperature, strong current, high voltage and other perturbations, leading to a deterioration of reliability. Therefore, analyzing a battery’s adaptability to perturbations is necessary.
4.1. Quantification of Perturbations
When lithium-ion batteries are affected by perturbations, the observation indicator data will experience a certain degree of fluctuation. To recognize the perturbations more realistically, the two parameters perturbation intensity and perturbation variable are defined. could be measured in long-term practice. denotes the variable of the actual indicator data with respect to the information without perturbation, and it is characterized as follows:
- (1)
- Perturbations are random and irregular.
- (2)
- The perturbation variables follow the normal distribution.
Therefore, when perturbations are added to the indicator data, perturbed indicator data can be calculated by
where denotes the data of observation indicator under perturbation at the cycle, denotes the data of observation indicator without perturbation at the cycle, and . The process of perturbation analysis is shown in Figure 2.
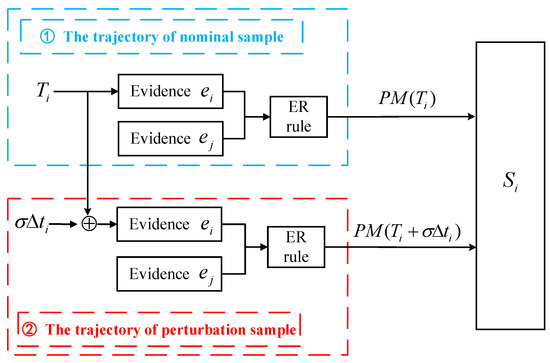
Figure 2.
Fusion process under perturbation by the ER rule.
In Figure 2, the upper half is the nominal sample, and the lower half is the sample with perturbation added. In the perturbed sample, the input parameter is changed to to obtain . and are essentially equivalent to utility .
We define that , the indicator and its corresponding reliabilities and weights are and , respectively. The belief distribution of evidence in the perturbed state can be calculated by using the (19):
where , . All indicators are fused by the ER rule, which can obtain effective health assessment results. In order to perform sensitivity for different perturbations, we introduce the perturbation coefficient
where can be taken as the reliability assessment results of the battery, denotes the maximum error of the perturbation coefficient. If , the influence of perturbation on the lithium-ion battery is tolerable. Otherwise, the battery should be adjusted.
4.2. Inference Process of the Perturbation Analysis
In this section, we describe how the ER rule and perturbation analysis can be combined to assess the reliability of a lithium-ion battery. The process of perturbation analysis is shown in Figure 3.
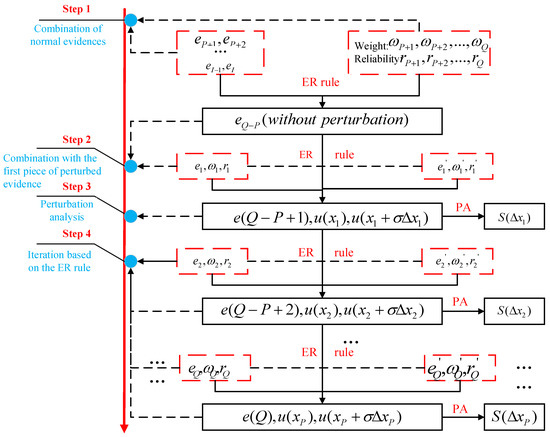
Figure 3.
The assessment process of the ER rule and perturbation analysis.
We suppose there are pieces of independent evidence and pieces of perturbed evidence . The combination order of each piece of evidence will not affect the fusion result of the ER rule [19]. Therefore, the procedure of perturbation analysis comprises four steps, as shown in Figure 3, and is summarized as follows:
Step 1: Combine the first pieces of evidence without perturbation according to the ER rule as (15)–(17), then is calculated by (18).
Step 2: The previous assessment result is combined with the first perturbation evidence according to the ER rule to obtain . Then, the perturbed utility and the expected utility are calculated by (19).
Step 3: According to and obtained in step 2, we use (22) to calculate the perturbation coefficient .
Step 4: By using the ER rule from step 1 repeatedly, from step 2 is combined with the remaining pieces of evidence. Then, we continue the perturbation analysis as shown in step 3.
5. General Application of Models
5.1. Analysis of the Overall Process of the Model
The assessment model can be divided into two parts in Figure 4. One part is health assessment, after extracting indicators , and calculating evidence parameters including weight , reliability and belief distribution in Section 3.2, Section 3.3 and Section 3.4, respectively. The assessment result is obtained by fusing abovementioned evidence parameters by the ER rule in Section 3.5. and calculating the expected utility . The other part is perturbation analysis, where the perturbations are added to characteristic indicators. Perturbation is quantified into perturbation intensity and perturbation variable, and perturbed indicator is formed by Equation (20). The evidence parameters including weight , reliability and belief distribution are calculated based on the perturbed indicator, which are fused by the ER rule in Section 3.5 to obtain assessment results and utility under perturbation. Then, the perturbation coefficient is calculated in Section 4.1 to complete the perturbation analysis. The overall perturbation analysis is performed to obtain the perturbation analysis results by combining the expected utility in the health assessment model.
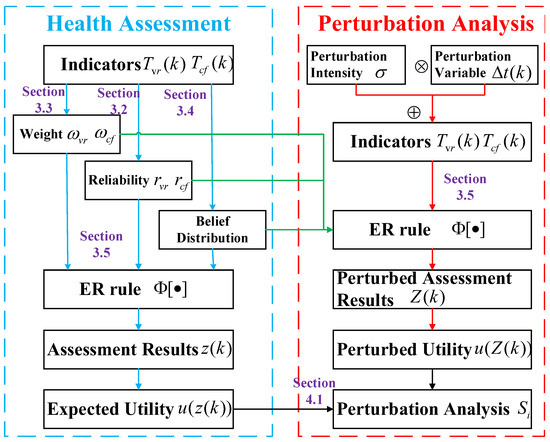
Figure 4.
Model’s overall analysis process.
5.2. Specific Steps of the Model’s Operation
The overall process of the health assessment model is summarized in Section 5.1. This section will describe the specific process of the model’s operation. The pseudocode of the overall process is shown in Algorithm 1.
| Algorithm 1. Specific operation process of the model. |
| ER Process and Perturbation Analysis |
The specific steps of the model process are shown in Algorithm 1 and described as follows.
Step 1: Analyze the operating mechanism of lithium-ion batteries, extract characteristic indicators and that can reflect health status.
Step 2: Calculate evidence parameters such as reliability , weight and belief distribution based on characteristic indicators in Step 1.
Step 3: The ER rules are used to integrate the evidence parameters in Step 2 to obtain comprehensive health assessment results and expected utility .
Step 4: Perturbations are converted into a perturbation intensity and a perturbation variable to represent the perturbed indicators.
Step 5: Repeat Step 2 and Step 3 to calculate the perturbed expected utility .
Step 6: Calculate the perturbation coefficient based on and to analyze the capability of the Li-ion battery against perturbations.
The proposed ER assessment model can not only assess the performance state of lithium-ion batteries, but also other types of batteries, such as aqueous and solid-state batteries.
On the application to other types of batteries, the principle of aqueous batteries is to provide energy by using different potential difference characteristics of different metals and adding water to activate the generation of current. The principle of solid-state batteries is the same as traditional lithium-ion batteries, which rely on the movement of lithium-ions between positive and negative electrodes to charge and discharge. From the perspective of the ER rule, since water and solid-state batteries also have similar characteristics to lithium-ion batteries, the same indicators can be extracted, and health assessment results can be obtained by fusion with the ER rule.
Remark 4.
Our work is a system related to cathode materials. For different electrode systems of the same battery, due to the difference in the electrode materials of the cathode system and the anode system, the damage degree of cathode and anode materials is almost the same when completing a charge-discharge cycle. However, after several cycles, the chemical properties of cathode material system and anode material system will cause a different degree of loss with the chemical reaction, which leads to different assessment results. Therefore, when the proposed ER assessment model is applied to anode material systems, the health status of the anode system needs to be assessed based on relevant properties of anode material.
6. Battery Assessment Results
A case study for the proposed model and perturbation analysis of the lithium-ion battery is examined in this section, which can demonstrate the effectiveness of health assessment in practice.
6.1. Study Background
The experimental data were obtained from the aging dataset of a 18,650 lithium-ion battery provided by the National Aeronautics and Space Administration (NASA) Prognostics Center of Excellence. The test conditions are charging mode and discharging mode. At a temperature of 24 °C, the battery was cycled for charging and discharging experiments until its rated capacity dropped by 30%, and the experiment was stopped. We used the B0006 battery to extract the observation indicator data. In charging mode, charging was performed at a constant current (CC) of 1.5 A until the battery voltage reached 4.2 V, then charging continued at a constant voltage (CV) until the charging current dropped to 20 mA. Therefore, a voltage of 3.8 V was used as the initial voltage, and a voltage of 4.2 V was used as the end voltage. A current value of 1.5 A was used as the initial current, and a current value of 0.5 A was the end current. The number of recharging cycles is 167. By way of summary, the voltage rise time of the constant current (CC) stage, the current fall time of the constant voltage (CV) stage and the battery capacity are shown in Figure 5. Moreover, and are replaced by time of CC-stage and time of CV-stage, respectively, in the following.
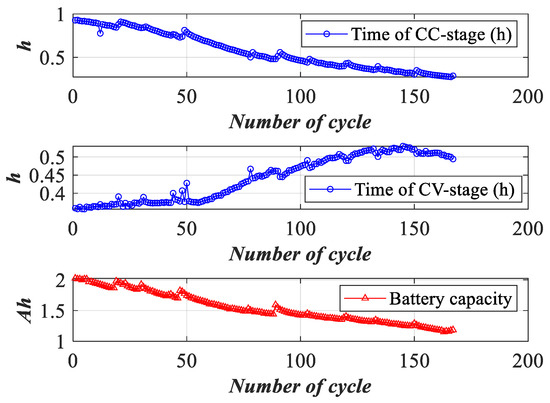
Figure 5.
Observation indicators of a lithium-ion battery.
As shown in Figure 5, as the number of cycles increases, the battery capacity decreases. In the CC-stage, the longer the voltage rises to the rated standard, the better the battery health status is. In the CV-stage, the longer the current falls to the rated standard, the better the battery health status is. Therefore, the time of CC-stage and CV-stage show a downward trend and upward trend, respectively. In engineering, there are many characteristic indicators of a battery. The battery health status cannot be comprehensively analyzed from a single indicator. Therefore, we had to combine multiple observation indicators to obtain reasonable results.
6.2. Health Assessment of Lithium-ion Batteries Based on the ER Rule
The assessment model introduced in Section 2, can effectively assess the battery’s health status, and the indicators are unified into the form of belief distributions using a rule-based approach. We set three reference levels, high, medium and low, namely, . As shown in Table 1, based on expert knowledge, the “high” and “low” reference values of the time of the CC-stage are the maximum value and minimum value, respectively. The “high” and “low” reference values of the time of the CV-stage are the minimum value and maximum value, respectively. The “medium” reference value is the data at the cycle.

Table 1.
Indicator assessment levels and reference value.
Based on (6)–(9), the evidence reliabilities are and . Based on (10)–(12), the evidence weights are and . Based on (13)–(14), the form of the belief distribution of the observation indicators is shown in Figure 6. Then, we used the ER rule to fuse these parameters by (15)–(24), and obtained the health assessment results, as shown in Figure 7.
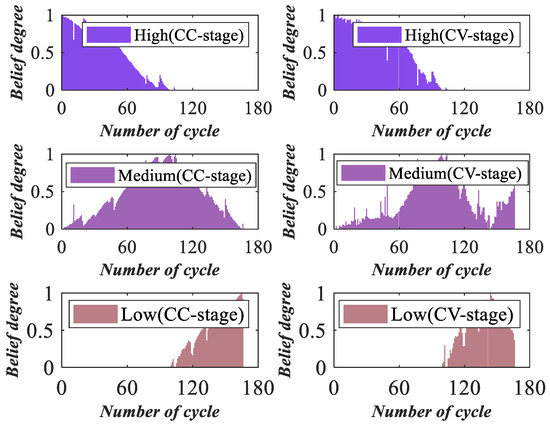
Figure 6.
Belief distributions of observation indicators.
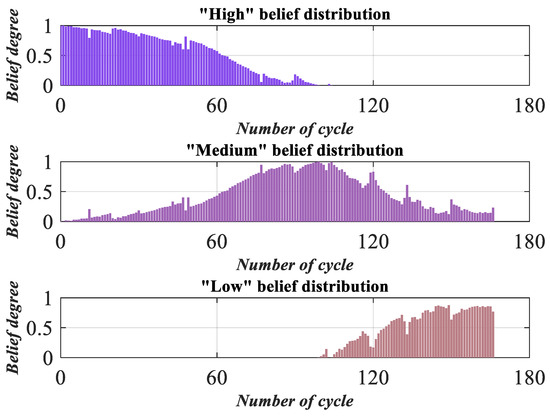
Figure 7.
Health assessment result of a lithium-ion battery.
According to Figure 7, the “high” belief degree shows a downward trend between the cycle and the cycle, the “medium” belief degree reaches its peak at the cycle and is mainly distributed between the cycle and the cycle, and the “low” belief degree begins to show an upward trend at the cycle. The battery’s health assessment result focused on “high” in the initial phase, followed by “medium”, and it focus on “low” in the last phase. This indicates that with the increase in charging times, the battery capacity decreases, which is similar to the trend of battery capacity shown in Figure 5.
By defining the reference level utilities as , and , we can calculate the expected utility by (19), as shown in Figure 8.
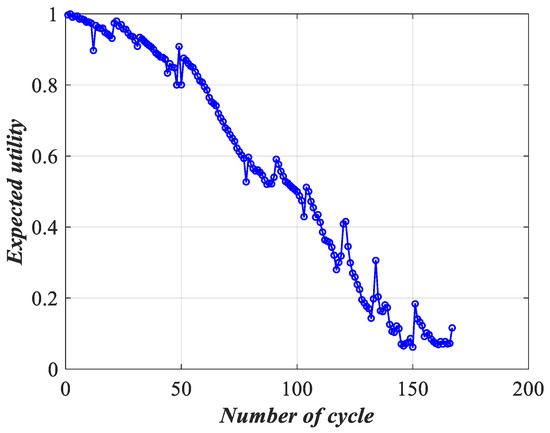
Figure 8.
Expected utility of lithium-ion battery performance.
According to Figure 8, the change in battery status shows a downward trend in total. After the cycle, the expected utility fluctuates sharply, indicating that the battery capacity loss is serious. Moreover, the utility fluctuates drastically at the , the , the and the cycle, indicating that the health status is unstable at this time. The utility trend is similar to that of the battery capacity presented in Figure 5, which indicates the validity of the assessment model. We selected the local images of the observation indicators and the corresponding utility images to prove the effectiveness of the assessment method, as can be seen in Figure 9.
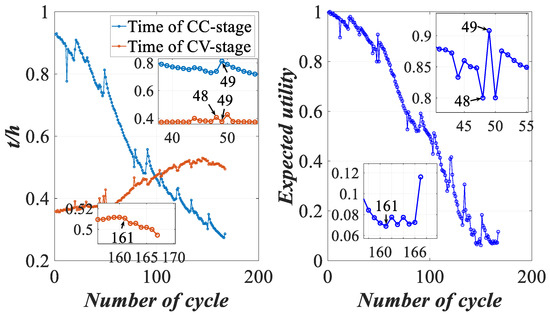
Figure 9.
Local indicators and utility comparisons.
As shown in Figure 9, the time of CC-stage and CV-stage show an upward trend and a downward trend at the cycle, respectively, while the expected utility shows a downward trend, indicating that the battery’s health status decreases at this time. The time of the CV-stage shows a downward trend at the cycle, while the expected utility shows an upward trend, indicating that the battery’s health status increases at this time. This shows that the change in utility is correlated with the change in indicators. Moreover, due to the characteristics of the ER rule, the variation trend of the expected utility and the indicator may be similar. It is obvious that the trend of expected utility is close to that of the time of CC-stage. However, the time of CV-stage decreases slightly at the cycle, and expected utility shows an upward trend, while the time of the CC-stage shows a downward trend at this time. This indicates that the ER rule can effectively fuse multiple indicators and comprehensively reflect the information of these indicators into the expected utility. Therefore, the proposed health assessment model is reasonable.
6.3. Reliability Analysis of Lithium-Ion Battery Considering Perturbation
Batteries are easily disturbed by the operation conditions during operation. Suppose there are four perturbation conditions, namely, low temperature and normal current, high temperature and normal current, low temperature and strong current, and high temperature and strong current. The perturbation intensities of these four perturbation conditions are given by 0.00135, 0.00140, 0.00145 and 0.00150, respectively. In addition, the perturbations cannot have a significant influence on observation indicators, so the perturbation intensity should be reasonably determined based on practical engineering, which can effectively simulate perturbation conditions. The perturbation variable is shown in Figure 10.
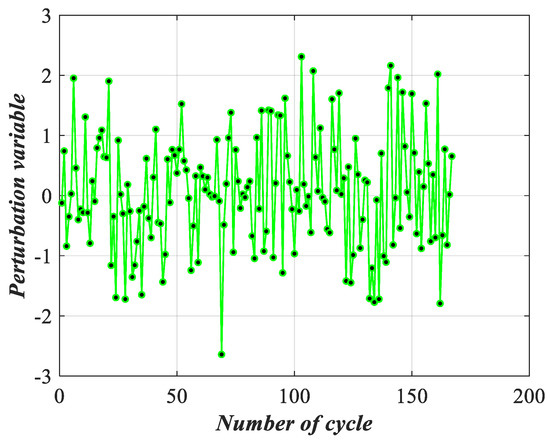
Figure 10.
Perturbation variable distribution.
Based on (20), perturbations are added to the indicator data in the form of random numbers. Because a battery is affected by perturbations, each indicator will recalculate as the reliability and weight change. The reliability and weight corresponding to different perturbation intensities are calculated by (6)–(12), as shown in Table 2 and Table 3, respectively.
Table 2.
Reliability of different perturbation intensities.
Table 3.
Weight of different perturbation intensities.
The expected utility of lithium-ion battery health assessment results under four types of perturbation intensities are shown in Figure 11.
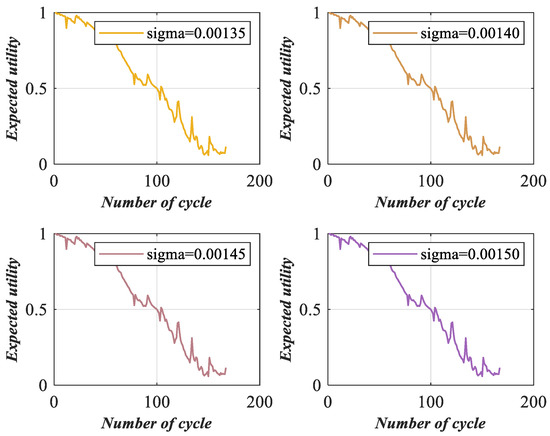
Figure 11.
Expected utility of lithium-ion battery health status under different perturbation intensities.
In Figure 10, when the perturbation intensities are different, the utility will also be slightly different, and to further analyze the specific influence of perturbations, we should quantify these subtle differences. Moreover, the trend of utilities is close to that without perturbations. The model can effectively assess battery health status under perturbations, indicating that the ER rule has robustness, which can fuse the perturbed indicators and obtain reasonable assessment results.
We introduce the perturbation coefficient to measure the reliability of a battery with respect to different perturbations; it can be calculated by (22). The perturbation coefficient is used to reflect the change in expected utility under perturbations by comparing the utility with perturbation with the expected utility without the perturbation, and it can measure the ability of the battery to respond to different perturbations. The smaller the perturbation coefficient is, the stronger the ability to resist perturbations is. The absolute values of the perturbation coefficient are shown in Figure 12.
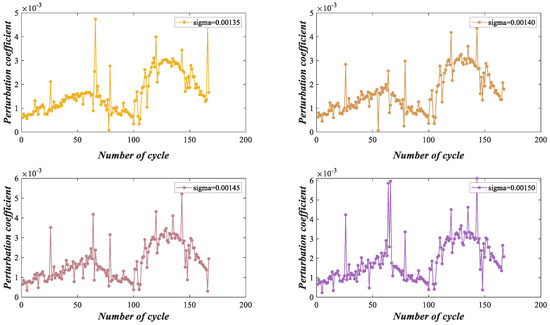
Figure 12.
Perturbation coefficients at various perturbation intensities.
According to Figure 12, the larger the perturbation intensities, the larger the corresponding perturbation coefficients are, which indicates a positive correlation between the perturbation coefficient and the severity of the utility change. When the fluctuation of the utility is larger, the fluctuation of the perturbation coefficient is also larger. After the cycle, the battery health status deteriorates severely, leading to the perturbation coefficient increasing dramatically. This suggests that when the battery health status is unstable, it is more susceptible to perturbations, so we should adjust the battery from time to time to ensure its safety. According to expert knowledge, the maximum error is , and when the perturbation intensities are 0.00135, 0.00140 and 0.00145, is constant, indicating that the battery can resist perturbations very well. When the perturbation intensity is 0.00150, is not constant, indicating that the battery cannot resist perturbations, and it is necessary to be adjusted or maintained.
6.4. Additional Experiment
6.4.1. Part of Health Status Assessment
To more comprehensively assess the health status of lithium-ion batteries, we have considered the effect of temperature change on batteries. With the increase in charge and discharge times of lithium-ion batteries, the activity of active substance inside batteries is enhanced, the internal resistance becomes larger, and it is easier to cause an exothermic chemical reaction, which leads to an increase in the temperature gradient during discharge. Therefore, the maximum temperature gradient of batteries is extracted, as shown in Figure 13.
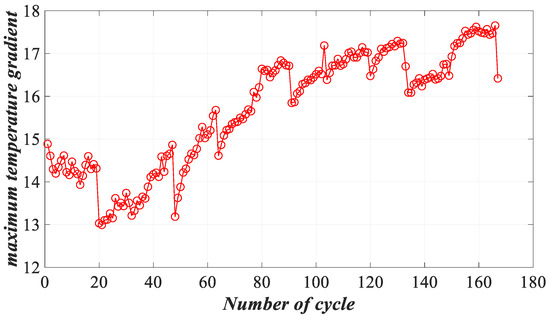
Figure 13.
Temperature gradient indicator.
In Figure 13, with the increase in cycle, the maximum temperature gradient shows an upward trend and fluctuates irregularly, which is consistent with reality. The time of the CC-stage, the time of the CV-stage and the temperature gradient are input into the ER model as indicators to obtain comprehensive health assessment results.
The reference levels and reference value of the temperature gradient are still , and setting principle is the same as in Section 6.2, as shown in Table 4.
Table 4.
Indicator assessment levels and reference value.
Based on (6)–(9), the evidence reliabilities are , and . Based on (10)–(12), the evidence weights are , and . Based on (13)–(14), the form of the belief distribution of temperature gradient is shown in Figure 14.
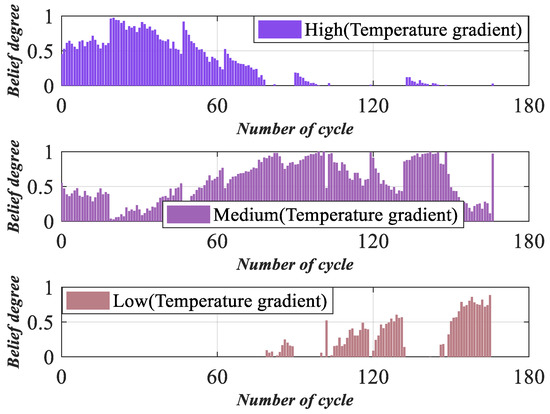
Figure 14.
Belief distributions of temperature gradient.
Then, we use the ER rule to fuse the above evidence parameters by (15)–(24), and obtain the health assessment results, as shown in Figure 15 and Figure 16.
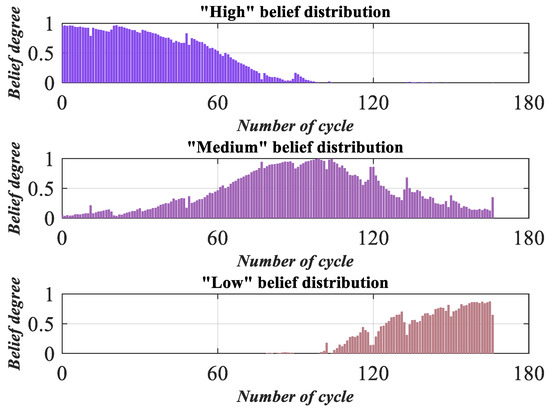
Figure 15.
Health assessment result of lithium-ion battery.
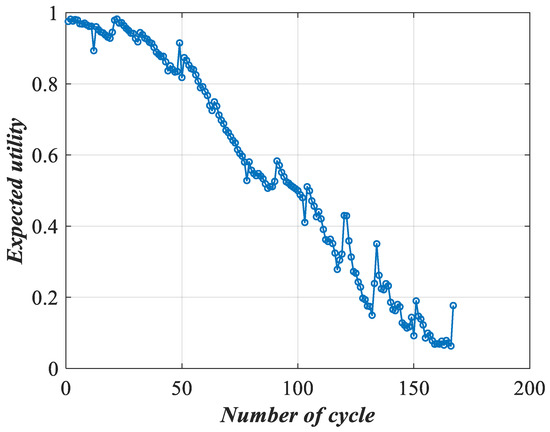
Figure 16.
Expected utility of lithium-ion battery performance.
Based on Figure 15 and Figure 16, it can be seen that the health status of the battery decreases as the number of cycles increases, and the health status fluctuates greatly, especially in the late stage of battery aging. When a new temperature gradient indicator is added, the proposed model can still accurately assess the health status of lithium-ion batteries and obtain more reasonable assessment results.
6.4.2. Part of Perturbation Analysis
Suppose that four perturbation conditions are still the same as in Section 6.3. The corresponding perturbation intensities are 0.00135, 0.00140, 0.00145 and 0.00150, respectively. The perturbation variable is shown in Figure 10. The reliability and weight corresponding to different perturbation intensities are calculated by (6)–(12), as shown in Table 5 and Table 6.
Table 5.
Reliability of different perturbation intensities.
Table 6.
Weight of different perturbation intensities.
The expected utility of lithium-ion battery health assessment results under four types of perturbation intensities are shown in Figure 17.
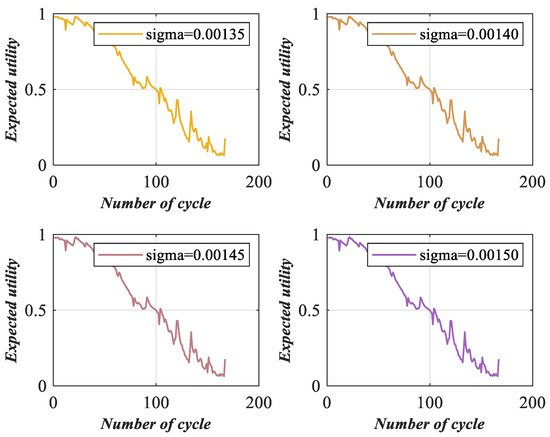
Figure 17.
Expected utility of lithium-ion battery health status under different perturbation intensities.
The perturbation coefficient can be calculated by (22), as shown in Figure 18.
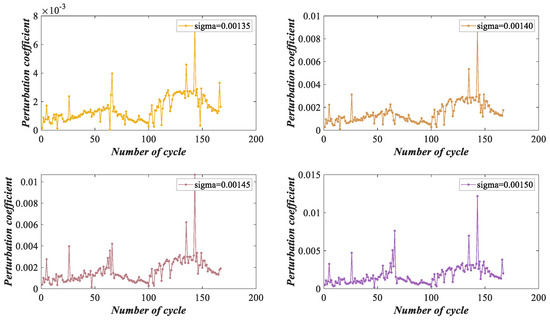
Figure 18.
Perturbation coefficients at various perturbation intensities.
In Figure 18, the perturbation coefficient will increase with the increase in perturbation intensity. Meanwhile, aging of the battery will be aggravated in the later running period, utility fluctuation will be drastic, and the reliability of the battery will decline, which leads to an increase in the performance coefficient. This is indicated that as batteries become less reliable, their ability to resist perturbation becomes weaker and they become more vulnerable to the negative influence of perturbations, which is consistent with the actual situation. The above experiments show that our health assessment model is effective.
6.5. Online Assessment for Lithium-Ion Battery Health Status
According to Remark 3, the health assessment model can also assess battery health status in real time. As shown in Figure 19, we calculate the weight and reliability of indicators in real time through (6)–(12) until the end of the cycle, and the belief distribution of indicators is the same as in Figure 6.
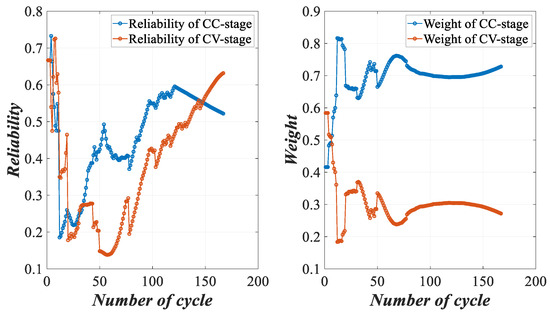
Figure 19.
Weight and reliability of the observation indicators in real time.
Then, based on (13)–(24), the belief distributions, reliabilities and weights of the observation indicators, they are iteratively fused by the ER rule to obtain real-time expected utilities, namely online expected utility. Offline expected utility and online utility are compared in Figure 20.
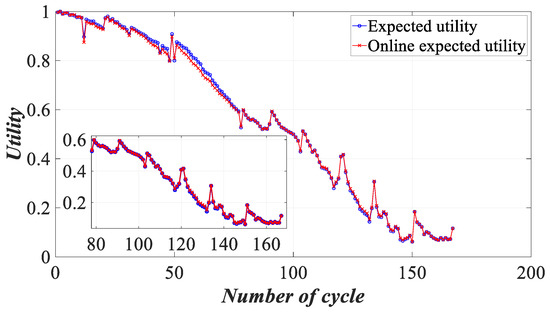
Figure 20.
Comparison of expected utility and online utility.
Based on Figure 20, the online expected utility and offline expected utility are closed, showing a downward trend. This indicates that the battery’s health status gradually decreases with the increase in cycle times. Moreover, between the and the cycles, there are certain differences between the offline utility and the online utility. This is because the reliability and weight are updated in real time, which leads to the deviation of the utility.
6.6. Comparative Experiment
Perturbation analysis can be combined with the ER rule to quantify the sensitivity of the assessment model to perturbations. To further verify the effectiveness of the ER rule, we used the analytic hierarchy process (AHP) to compare with the ER model [29]. The steps are as follows.
First, a discriminant matrix is built based on expert knowledge. There are two observation indicators, so is a second-order matrix. The discriminant matrix is
The maximum eigenvalue of based on the eigenvalue calculation is , so the consistency test index is
where is the order of . When matrix order is 2, the average random consistency index . Because the second-order matrix must be a consistency matrix, we have modified its corresponding to 0.0001, which is close to 0. Therefore, the consistency ratio of matrix is
indicates that matrix is effective. Using the geometric mean to compute the weight matrix, we have
is the row matrix of row 1 and columns composed of , is the element in matrix , and . The weight matrix is calculated by (26), there are . Based on the reference levels and reference values, the degree of each indicator for the assessment level can be profiled by a fuzzy relationship matrix:
where is the degree of evidence relative to assessment level . The reference values are normalized, shown in Table 2, and the fuzzy relation matrix is
Based on (26) and (27), the assessment results of the battery are obtained as follows:
According to (29) the belief degrees of the battery health status for the “high”, “medium” and “low” levels are 0.4399, 0.3060 and 0.2541, respectively. The highest assessment result is 0.4399 for the “high” level, followed by the “medium” level, and 0.2541 for the “low” level, which is consistent with the conclusion in Figure 7. Therefore, the AHP method can effectively assess the overall health status of a battery. However, the AHP method is unable to describe the time of deterioration and change of battery health status, so its outcomes cannot describe the actual situation effectively. Moreover, the parameter matrix may be affected by some subjective factors, which lead to an inaccurate assessment.
7. Conclusions
In this article, a new ER health assessment model for lithium-ion batteries is proposed to determine batteries’ health status. Due to the influence of random perturbations, the health status of batteries fluctuate to varying degrees; thus, a reliability assessment model that can quantify the adaptability of the battery to perturbations was proposed. Moreover, the health assessment model is able to provide online assessment.
The contributions of this article are as follows: First, the voltage rise time and the current fall time of lithium-ion batteries were used as observation indicators, which contain the health information about the batteries. Second, a health assessment model based on the ER rule was proposed, and the COV method and distance-based method were used to calculate the evidence weight and evidence reliability, which can assess the health status of batteries in real time. Third, perturbations were added to the indicators in the form of random numbers. The perturbation coefficient and maximum error were introduced to measure the battery’s sensitivity and adaptability to perturbations. Therefore, we combined the ER rule and proposed a reliability assessment model to quantify the adaptability of the battery to perturbations. From the experimental results, our models are effective in the health assessment and perturbation analysis of lithium-ion batteries.
The shortcoming of the proposed method is that perturbation is difficult to be accurately measured in practical engineering, so it is essential to develop a reasonable method to measure the perturbation and obtain accurate analysis results. In the future, the proposed method can be migrated to other types of batteries such as aqueous batteries, hybrid batteries, and solid-state batteries to obtain effective health assessment results and perturbation analysis results.
Author Contributions
Conceptualization, Y.Z. and S.W.; methodology, Y.Z. and S.W.; investigation, Y.Z., W.H., W.Z. and G.Z.; writing—original draft preparation, Y.Z. and S.W.; writing—review and editing, W.H. and S.T. All authors have read and agreed to the published version of the manuscript.
Funding
This work was supported in part by the Natural Science Foundation of China under Grant 62203461 and Grant 62203365, in part by the Postdoctoral Science Foundation of China under Grant No. 2020M683736, in part by the Teaching reform project of higher education in Heilongjiang Province under Grant Nos. SJGY20210456 and SJGY20210457, in part by the Natural Science Foundation of Heilongjiang Province of China under Grant No. LH2021F038, in part by the graduate academic innovation project of Harbin Normal University under Grant Nos. HSDSSCX2022-17, HSDSSCX2022-18 and HSDSSCX2022-19, in part by the Harbin Normal University Start-up Fund-funded Project of doctor under Grant No. XKB201906.
Data Availability Statement
The study data in this article are derived from the National Aeronautics and Space Administration Prognostics Center of Excellence. For the source URL of the lithium-ion battery data set in the Baidu AI Studio platform, please visit: https://aistudio.baidu.com/aistudio/datasetdetail/171099.
Conflicts of Interest
The authors declare no conflict of interest.
References
- Xiong, R.; Zhang, Y.Z.; Wang, J.; He, H.W.; Peng, S.M.; Pecht, M. Lithium-Ion Battery Health Prognosis Based on a Real Battery Management System Used in Electric Vehicles. IEEE Trans. Veh. Technol. 2019, 68, 4110–4121. [Google Scholar] [CrossRef]
- Chen, H.J.; Awatef, A.; Hussein, A.K.; Younis, O.; Degani, M.; Heidarshenas, B. Investigation of the use of extended surfaces in paraffin wax phase change material in thermal management of a cylindrical lithium-ion battery: Applicable in the aerospace industry. J. Energy Storage 2021, 45, 103685. [Google Scholar] [CrossRef]
- Sbarufatti, C.; Corbetta, M.; Giglio, M.; Cadini, F. Adaptive prognosis of lithium-ion batteries based on the combination of particle filters and radial basis function neural networks. J. Power Sources 2017, 344, 128–140. [Google Scholar] [CrossRef]
- Miao, Y.; Liu, L.; Zhang, Y.; Tan, Q.; Li, J. An overview of global power lithium-ion batteries and associated critical metal recycling. J. Hazard. Mater. 2021, 425, 127900. [Google Scholar] [CrossRef]
- Jin, X.; Vora, A.; Hoshing, V.; Saha, T.; Shaver, G.; Garcia, R.E.; Wasynczuk, O.; Varigonda, S. Physically-based reduced-order capacity loss model for graphite anodes in Li-ion battery cells. J. Power Sources 2017, 342, 750–761. [Google Scholar] [CrossRef]
- Iurilli, P.; Brivio, C.; Carrillo, R.E.; Wood, V. Physics-Based SoH Estimation for Li-Ion Cells. Batteries 2022, 8, 204. [Google Scholar] [CrossRef]
- Xavier, M.A.; de Souza, A.K.; Karami, K.; Plett, G.L.; Trimboli, M.S. A Computational Framework for Lithium Ion Cell-Level Model Predictive Control Using a Physics-Based Reduced-Order Model. IEEE Control Syst. Lett. 2021, 5, 1387–1392. [Google Scholar] [CrossRef]
- Jin, H.Y.; Cui, N.M.; Cai, L.; Meng, J.H.; Li, J.X.; Peng, J.C.; Zhao, X.C. State-of-Health Estimation for Lithium-ion Batteries with Hierarchical Feature Construction and Auto-Configurable Gaussian Process Regression. Energy 2022, 262, 125503. [Google Scholar] [CrossRef]
- Motapon, S.N.; Lachance, E.; Dessaint, L.A.; Al-Haddad, K. A Generic Cycle Life Model for Lithium-Ion Batteries Based on Fatigue Theory and Equivalent Cycle Counting. IEEE Open J. Ind. Electron. Soc. 2020, 1, 207–217. [Google Scholar] [CrossRef]
- Tang, X.P.; Zou, C.F.; Yao, K.; Lu, J.Y.; Xia, Y.X.; Gao, F.R. Aging trajectory prediction for lithium-ion batteries via model migration and Bayesian Monte Carlo method. Appl. Energy 2019, 254, 113591. [Google Scholar] [CrossRef]
- Zhao, S.S.; Zhang, C.L.; Wang, Y.Z. Lithium-ion battery capacity and remaining useful life prediction using board learning system and long short-term memory neural network. J. Energy Storage 2022, 52, 104901. [Google Scholar] [CrossRef]
- Hsu, C.W.; Xiong, R.; Chen, N.Y.; Li, J.; Tsou, N.T. Deep neural network battery life and voltage prediction by using data of one cycle only. Appl. Energy 2022, 306, 118134. [Google Scholar] [CrossRef]
- Ma, Y.Y.; Wu, L.F.; Guan, Y.; Peng, Z. The capacity estimation and cycle life prediction of lithium-ion batteries using a new broad extreme learning machine approach. J. Power Sources 2020, 476, 228581. [Google Scholar] [CrossRef]
- Yao, F.; He, W.X.; Wu, Y.X.; Ding, F.; Meng, D.F. Remaining useful life prediction of lithium-ion batteries using a hybrid model. Energy 2022, 248, 123622. [Google Scholar] [CrossRef]
- Zhou, M.; Liu, X.B.; Chen, Y.W.; Yang, J.B. Evidential reasoning rule for MADM with both weights and reliabilities in group decision making. Knowl.-Based Syst. 2018, 143, 142–161. [Google Scholar] [CrossRef]
- Pan, Y.; Zhang, L.M.; Li, Z.W.; Ding, L.Y. Improved fuzzy bayesian network-based risk analysis with interval-valued fuzzy sets and D-S evidence theory. IEEE Trans. Fuzzy Syst. 2019, 28, 2063–2077. [Google Scholar] [CrossRef]
- Li, H. Evidence Reasoning Algorithm for Multi-criteria Decision-making with Incomplete Attribute Weight Information. Fire Control Command Control 2015, 40, 12–15. [Google Scholar]
- Yang, J.B.; Xu, D.L. Evidential reasoning rule for evidence combination. Artif. Intell. 2013, 205, 1–29. [Google Scholar] [CrossRef]
- Gong, Y.J.; Su, X.Y.; Qian, H.; Yang, N. Research on fault diagnosis methods for the reactor coolant system of nuclear power plant based on D-S evidence theory. Ann. Nucl. Energy 2018, 112, 395–399. [Google Scholar] [CrossRef]
- Zhou, Z.J.; Chang, L.L.; Hu, C.H.; Han, X.X.; Zhou, Z.G. A New BRB-ER-Based Model for Assessing the Lives of Products Using Both Failure Data and Expert Knowledge. IEEE Trans. Syst. Man Cybern. Syst. 2016, 46, 1529–1543. [Google Scholar] [CrossRef]
- Feng, Z.C.; Zhou, Z.J.; Hu, C.H.; Chang, L.L.; Hu, G.Y.; Zhao, F.J. A new belief rule base model with attribute reliability. IEEE Trans. Fuzzy Syst. 2019, 27, 903–916. [Google Scholar] [CrossRef]
- Kong, G.L.; Xu, D.L.; Yang, J.B.; Wang, T.B.; Jiang, B.G. Evidential Reasoning Rule-Based Decision Support System for Predicting ICU Admission and In-Hospital Death of Trauma. IEEE Trans. Syst. Man Cybern. Syst. 2021, 51, 7131–7142. [Google Scholar] [CrossRef]
- Zhao, F.J.; Zhou, Z.J.; Hu, C.H.; Chang, L.L.; Zhou, Z.G.; Li, G.L. A New Evidential Reasoning-Based Method for Online Safety Assessment of Complex Systems. IEEE Trans. Syst. Man Cybern. Syst. 2018, 48, 954–966. [Google Scholar] [CrossRef]
- Ma, Z.Z.; Zhu, J.J.; Chen, Y. A Probabilistic Linguistic Group Decision-Making Method from a Reliability Perspective Based on Evidential Reasoning. IEEE Trans. Syst. Man Cybern. Syst. 2020, 50, 2421–2435. [Google Scholar] [CrossRef]
- Ho, Y.C. On the perturbation analysis of discrete-event dynamic systems. J. Optim. Theory Appl. 1985, 46, 535–545. [Google Scholar] [CrossRef]
- Tang, S.W.; Zhou, Z.J.; Hu, C.H.; Yang, J.B.; Cao, Y. Perturbation Analysis of Evidential Reasoning Rule. IEEE Trans. Syst. Man Cybern. Syst. 2021, 51, 4895–4910. [Google Scholar] [CrossRef]
- Xu, J.N.; Ni, Y.L.; Zhu, C.B. Remaining Useful Life Prediction for Lithium-Ion Batteries Based on Improved Support Vector Regression. Trans. China Electrotech. Soc. 2021, 36, 3693–3704. [Google Scholar]
- Yang, J.B. Rule and utility based evidential reasoning approach for multi-attribute decision analysis under uncertainties. Eur. J. Oper. Res. 2001, 131, 31–61. [Google Scholar] [CrossRef]
- Mondragon, A.E.C.; Mastrocinque, E.; Tsai, J.F.; Hogg, P.J. An AHP and Fuzzy AHP Multifactor Decision-Making Approach for Technology and Supplier Selection in the High-Functionality Textile Industry. IEEE Trans. Eng. Manag. 2021, 68, 1112–1125. [Google Scholar] [CrossRef]
Disclaimer/Publisher’s Note: The statements, opinions and data contained in all publications are solely those of the individual author(s) and contributor(s) and not of MDPI and/or the editor(s). MDPI and/or the editor(s) disclaim responsibility for any injury to people or property resulting from any ideas, methods, instructions or products referred to in the content. |
© 2023 by the authors. Licensee MDPI, Basel, Switzerland. This article is an open access article distributed under the terms and conditions of the Creative Commons Attribution (CC BY) license (https://creativecommons.org/licenses/by/4.0/).