Article

State-of-Health Estimation of Lithium-Ion Battery Based on Constant Voltage Charging Duration

1
State Grid Fujian Electric Power Research Institute, Fuzhou 350007, China
2
School of Automation, Guangdong University of Technology, Guangzhou 510006, China
3
Brunel Interdisciplinary Power Systems Research Centre, Department of Electronic and Electrical Engineering, Brunel University London, London UB8 3PH, UK
*
Author to whom correspondence should be addressed.
Batteries 2023, 9(12), 565; https://doi.org/10.3390/batteries9120565
Submission received: 26 October 2023 / Revised: 16 November 2023 / Accepted: 22 November 2023 / Published: 24 November 2023

Abstract

:
It is imperative to determine the State of Health (SOH) of lithium-ion batteries precisely to guarantee the secure functioning of energy storage systems including those in electric vehicles. Nevertheless, predicting the SOH of lithium-ion batteries by analyzing full charge–discharge patterns in everyday situations can be a daunting task. Moreover, to conduct this by analyzing relaxation phase traits necessitates a more extended idle waiting period. In order to confront these challenges, this study offers a SOH prediction method based on the features observed during the constant voltage charging stage, delving into the rich information about battery health contained in the duration of constant voltage charging. Innovatively, this study suggests using statistics of the time of constant voltage (CV) charging as health features for the SOH estimation model. Specifically, new features, including the duration of constant voltage charging, the Shannon entropy of the time of the CV charging sequence, and the Shannon entropy of the duration increment sequence, are extracted from the CV charging phase data. A battery’s State-of-Health estimation is then performed via an elastic net regression model. The experimentally derived results validate the efficacy of the approach as it attains an average mean absolute error (MAE) of only 0.64%, a maximum root mean square error (RMSE) of 0.81%, and an average coefficient of determination (R2) of 0.98. The above statement serves as proof that the suggested technique presents a substantial level of precision and feasibility for the estimation of SOH.

1. Introduction

In order to address the environmental issues stemming from traditional vehicle greenhouse gas emissions, the electrification of automobiles has emerged as a primary direction for the global automotive industry’s transformation and upgrading, with a focus on energy conservation and emission reduction [1,2,3]. Against this backdrop, fuel cell electric vehicles, pure electric vehicles, and hybrid energy electric vehicles composed of lithium-ion batteries and fuel cells have come into existence. Fuel cell electric vehicles have garnered attention for their long-range and fast hydrogen refueling advantages [4,5]. Electric vehicles primarily utilize lithium-ion batteries as energy storage systems, offering the advantages of high overall energy efficiency and low operational costs [6,7,8]. Hybrid energy electric vehicles combine the strengths of fuel cells and lithium-ion batteries, achieving higher energy efficiency.
In order to ensure the efficient and safe operation of lithium-ion battery energy storage systems, the Battery Management System (BMS) is an indispensable component [3,9,10,11,12]. Furthermore, accurately estimating the SOH holds significant importance in BMS to diagnose the degree of battery life decay. These data play a vital role in guaranteeing the secure functioning of energy storage systems, as well as ensuring the reliability and range performance of electric vehicles [13,14,15,16].
Current studies have divided the techniques for evaluating the SOH into two categories: model-based and data-driven methodologies [17,18]. To perform model-based SOH estimation, researchers usually build models of lithium-ion batteries utilizing electrochemical models [19,20], equivalent circuit models [21,22,23], or empirical models [24,25]. This estimation identifies and estimates battery characteristic parameters by constructing physicochemical models through the computational processing of experimental data, thereby achieving a practical SOH estimation [17]. However, building battery models requires many multidimensional parameters, making parameter identification difficult. Choosing the right model that finds a middle ground between the precision of SOH estimation and computational sophistication is no easy task, leading to limitations in the practical application of model-based approaches.
Unlike model-based approaches, data-driven techniques obviate the need of prior knowledge on intricate battery deterioration mechanisms. Rather, they attain superior estimation precision via the analysis and processing of copious amounts of battery data [17]. As of late, data-driven techniques have garnered considerable interest. In particular, the estimation of SOH is deemed a customary regression quandary in data-driven methodologies. Among these methods, Support Vector Machine (SVM) [26,27,28], Relevance Vector Machine (RVM) [29], Long Short-Term Memory (LSTM) [30,31,32], Gaussian Process Regression (GPR) [33,34], and other techniques have been widely used. In order to precisely acquire the non-linear correlation between SOH and the external health attributes of batteries, prompt measures are required [35,36], and there is an increasing trend toward utilizing complex algorithms for model construction, increasing model complexity significantly. Therefore, it is imperative to streamline the model and enhance its computational efficiency while upholding its precision [17]. In addition to building efficient and well-performing algorithmic models, high-quality feature engineering directly enhances the criticality of SOH estimation methods.
Most existing research on feature engineering relies primarily on extracting health features for the SOH estimation from complete constant current and constant voltage (CCCV) charge–discharge curves. Ref. [37] has demonstrated that CCCV charging and discharging cycles can gather the majority of information required for battery health estimation. Ref. [38] incorporated the energy employed in the CC charging phase and equal discharge voltage intervals as input features. Ref. [39] proposed 14 features from the complete CCCV charge–discharge curve and selected eight features, including CC charge curve area, CC charge duration, CV charge duration, and their ratios, as health indicators. These methods achieved good estimation accuracy by extracting different features. However, these methods require collecting relatively complete CCCV charge–discharge process data for each battery cycle. The effective functioning of energy storage systems greatly relies on the extent of battery charge and discharge, which is primarily determined by the operational demands of the load, which leads to some randomness in the starting point of charging. Therefore, applying CCCV charge–discharge curves to estimate the SOH of batteries in energy storage systems is challenging.
For achieving practicality in an SOH estimation, extracting health features based on relaxation voltage data is an effective solution. These methods extract features from the relaxation voltage data after battery charge and discharge, avoiding the randomness of the starting point of charging. In [40], relaxation time deviation voltage was extracted as a health feature. Ref. [41] employs a 30 s rest voltage to estimate the health status of the battery. Ref. [42] removed features from the 30 min relaxation voltage curve after the battery was fully charged, including the variance, maximum value, and skewness of the relaxation voltage. Although these methods do not require specific conditions and set voltage ranges, they still require the battery to be placed for an extended period to extract features. Achieving an accurate SOH estimation with shorter sluggish times remains a challenge.
In the CCCV charging mode, the initial charging state does not have any impact on the process of charging the CV, which exhibits robustness to the previous discharge process. This has been observed in a recent study that emphasized on extracting health features using data from the CV charging phase [43]. CV charging refers to the battery continuing to charge at a constant voltage after the CC charging is completed. Based on the analysis above, using the CV charging phase data for feature extraction is unaffected by the starting point of charging and the waiting time required compared to the relaxation phase. Ref. [44] proposed using a CV to assess aging factors as health features. Ref. [45] utilized the time constant of the decoupled CV current as a metric for ascertaining health, which has proven to be effective. However, this approach entails a complex identification process for determining the appropriate parameters. To extract features directly from the CV charging phase, Ref. [46] suggested that the duration of CV charging may serve as a simple yet potent measure to gauge the SOH. Additionally, Ref. [43] developed a model for estimating the SOH focused on the duration of constant voltage charging while also accounting for the impact of the cutoff current on the length of said charging period, effectively improving the accuracy of SOH estimation. Ref. [47] extracted multiple time intervals of constant voltage current differences in the CV charging phase as features and demonstrated a strong correlation between time intervals and SOH. These methods have achieved an SOH estimation by extracting health features from the CV charging phase. However, a further improvement in the SOH estimation accuracy is constrained due to the insufficient exploration of the battery health information contained in the CV charging phase data.
To address the shortcomings identified in the existing literature mentioned above, this study utilizes statistical methods to extract battery health information from CV charging time data. It proposes a new set of feature combinations to enhance the SOH estimation accuracy. Initially, CV charging durations are extracted, and the charging durations are divided based on the intervals of CV currents. This results in CV charging duration sequences and CV charging duration variation sequences. Shannon entropy processing [48] is applied to both sequences, resulting in a feature combination composed of CV charging durations, the Shannon entropy of the CV charging duration sequence, and the Shannon entropy of the CV charging duration variation sequence. The Pearson correlation coefficient was wielded to validate the correlation of the three extracted features with the battery’s SOH. A model for estimating the SOH was established using the Elastic Net Regression [49]. The estimation accuracy of the model was quantitatively analyzed using RMSE, MAE, and R2. T The effectiveness and superiority of the proposed method were confirmed by evaluating the feature combination’s performance in estimating the SOH under various experimental conditions. The main contributions of this study can be summarized as follows:
(1)
Thoroughly delving into the abundant data about battery health found in the durations of CV charging and suggesting the implementation of CV charging duration statistics as indicators of battery health. A new health feature combination consists of CV charging durations, the Shannon entropy of the CV charging duration sequence, and the Shannon entropy of the CV charging duration variation sequence. The empirical evidence confirms that the suggested combination of features brings about an elevation in the accuracy of SOH estimation, enabling a more accurate estimation of the battery health status.
(2)
This study is completely dependent on the CV charging phase to extract features without being influenced by the initial charging point, adapting it for a wider array of application scenarios. In addition, when compared to relaxation phase feature combinations that necessitate lengthy idle periods, the precision of an SOH estimation is notably enhanced with the employment of the feature combination postulated in this paper.

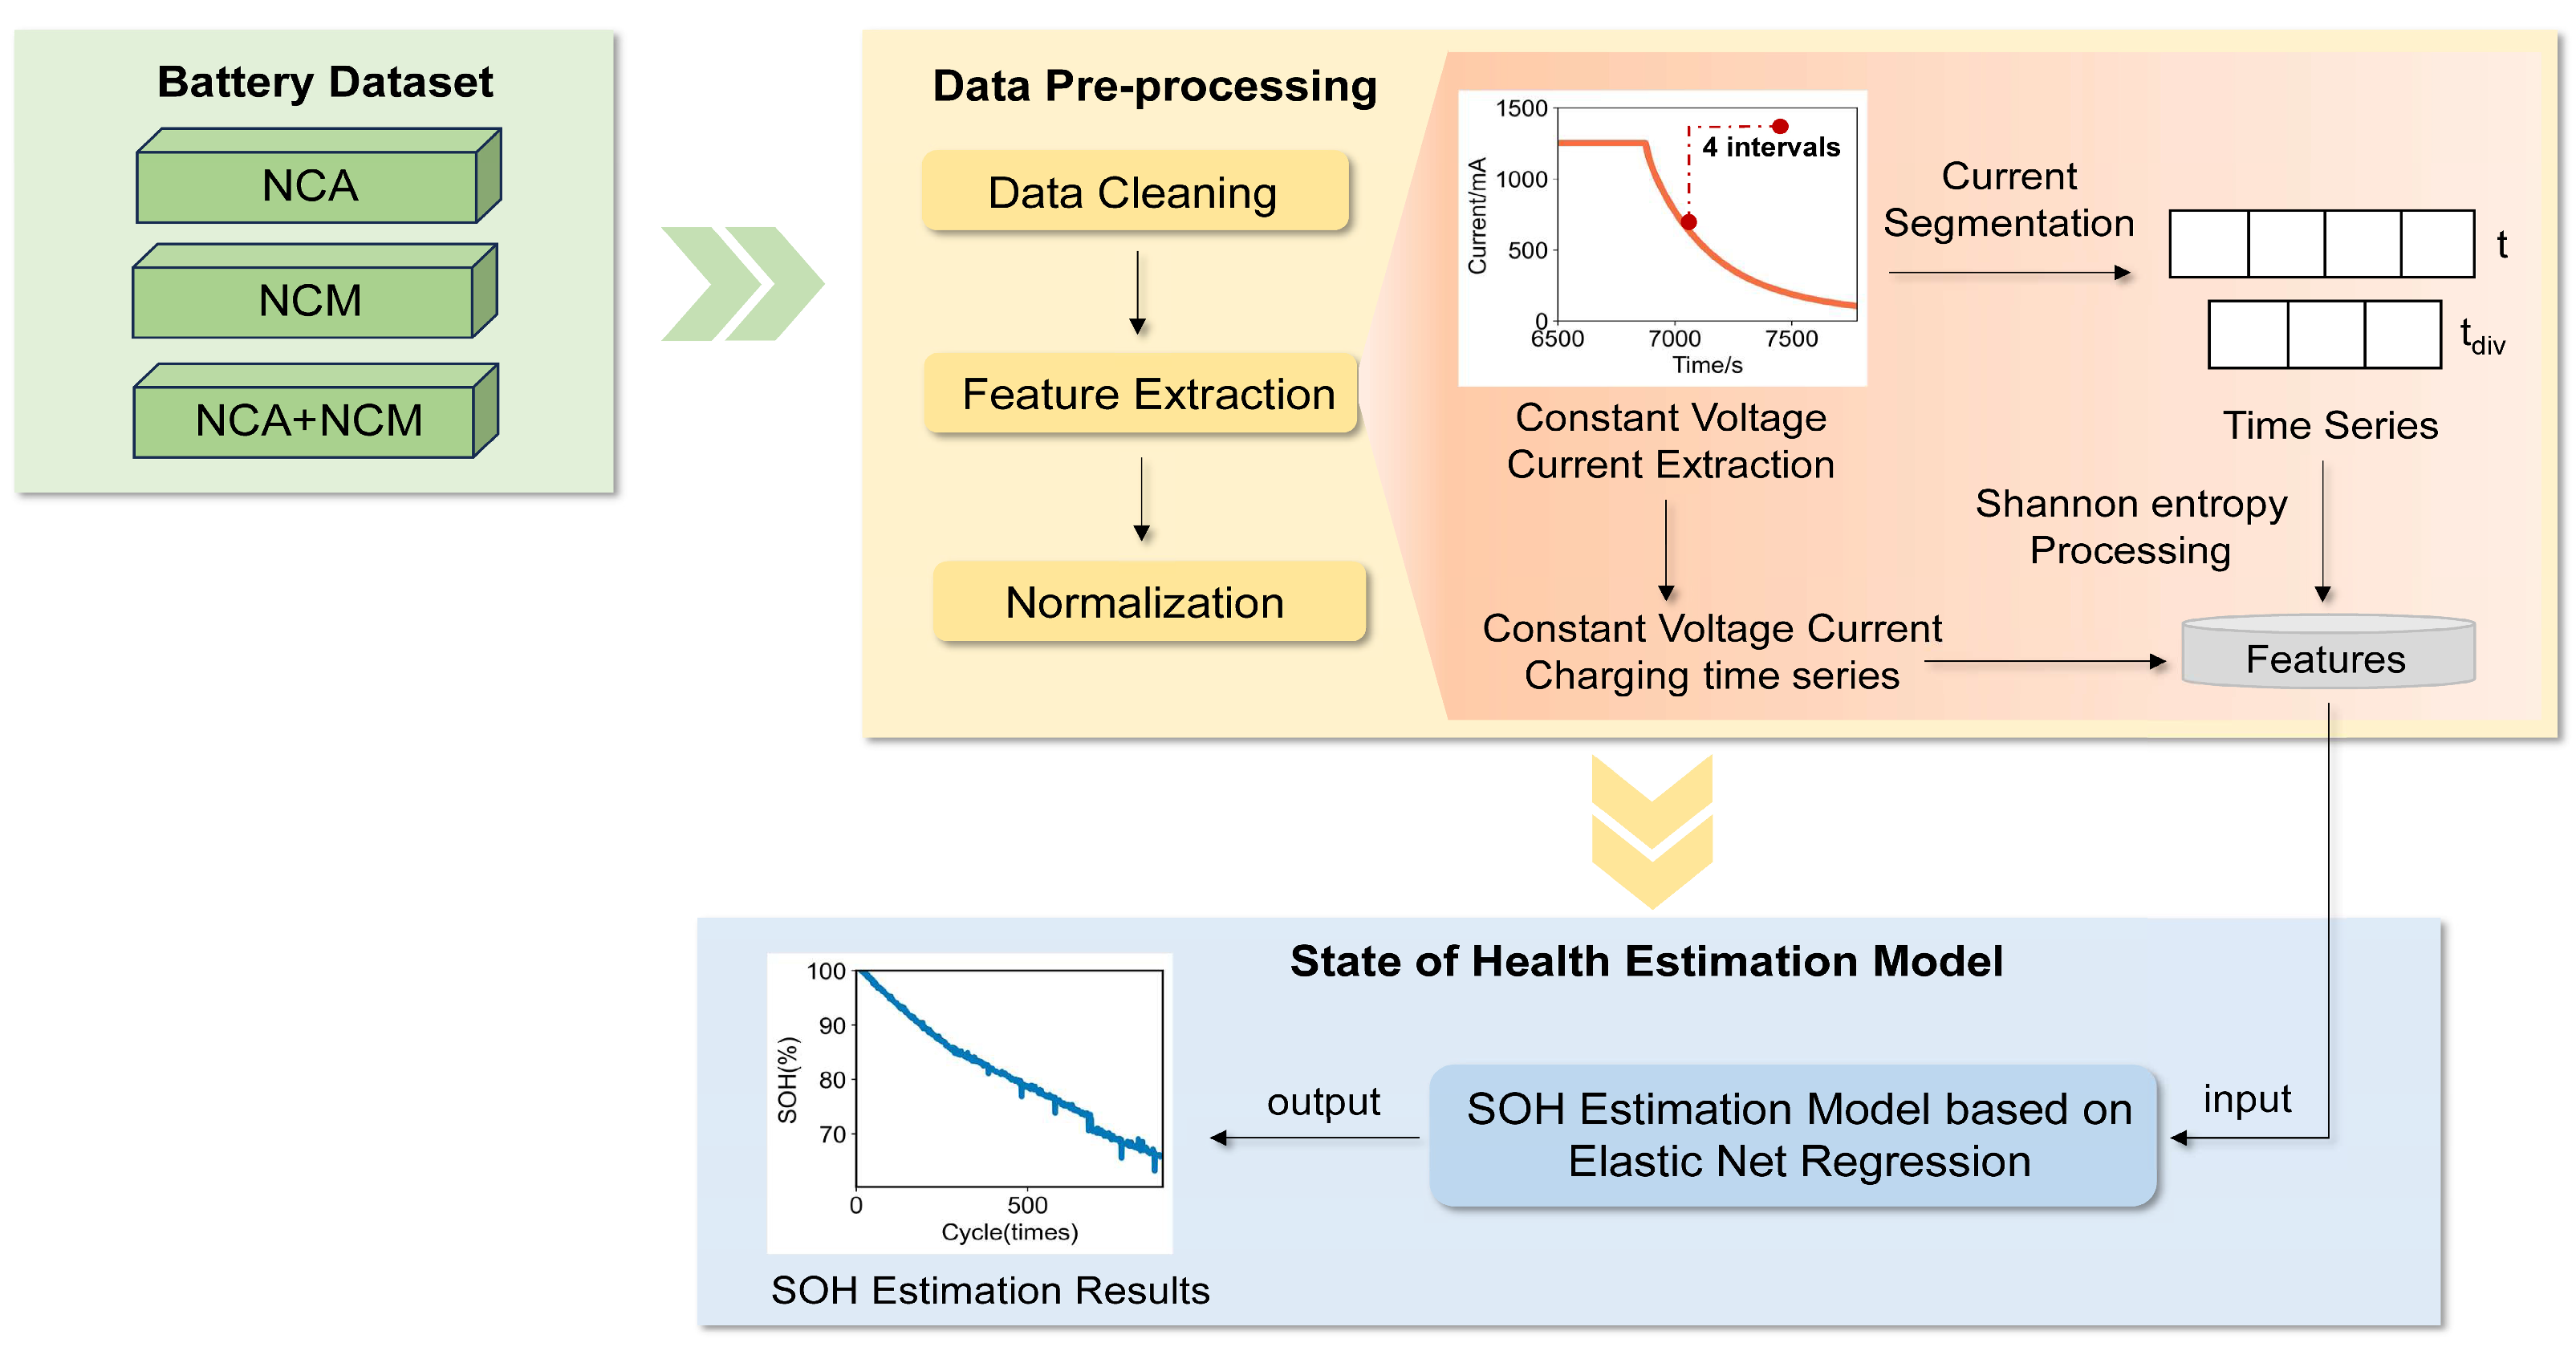
2. Experimental Data Processing

2.1. Introduction to the Dataset

This paper compares and analyzes algorithms and models using the publicly available large-scale battery dataset from the Clean Energy Vehicle Engineering Center at Tongji University [42]. The batteries in the dataset undergo aging cycles in the laboratory. The dataset consists of three sets of data, all utilizing individual cylindrical 18,650 lithium-ion battery cells with repeatable charge–discharge cycles. Table 1 displays an overview of the dataset.
Dataset 1 battery cathode material is an NCA battery, and battery aging experiments were undertaken at 25 °C, 35 °C, and 45 °C, with charging current of 0.25 C, 0.5 C, and 1 C, and discharging current of 1 C, respectively. Dataset 2 battery cathode material is an NCM battery, and the battery aging experiment was performed under the conditions of 25 °C, 35 °C, and 45 °C, with a charging current of 0.25 C, and a discharging current of 1 C. Dataset 3 battery cathode material is NCM + NCA, and battery aging experiments were executed at 25 °C, with a charging current of 0.5 C, and discharge current of 1 C, 2 C, and 4 C, respectively. The battery cycling temperature cell dataset contains five processes of the complete cycle, i.e., CC charging, CV charging, post-charging relaxation, CC discharging, and post-discharge relaxation. In this paper, the battery cathode materials NCA, NCM, and NCM + NCA are used as the nomenclature of datasets 1, 2, and 3, respectively, and they serve the purposes of feature extraction, model training and testing, appraisal, and the enhancement of the overall effectiveness of the suggested approach.

2.2. Feature Extraction

2.2.1. Data Preprocessing

All experiments are conducted on Python 3.11.4 version. To exclude the wrong values in the battery dataset due to experimental errors, measurement errors, recording errors, etc., the dataset is firstly rejected for outliers according to the lousy value range given by [42], i.e., the exclusion of battery data, exhibiting discharging capacities falling between 1650 mA·h and 2510 mA·h and bearing the highest values, guarantees the precision of the model’s predictive results.
In view of the fact that the dataset encompasses the entire battery cycle process, it is imperative that the segment of the CV charging data needs to be localized. By finding all the constant voltage charging data segments in it and distinguishing them from the data segments of other stages, the change curve of battery voltage is utilized to determine the location of the CV charging stage.
Since the CV charging data segment has the characteristics of stable charging voltage and gradually decreasing charging current, the battery voltage will be stabilized at a fixed value. By screening the voltage value, we can identify the precise placement of the CV charging phase. Once the location is confirmed, we can dissect and assess this stage so as to gain an in-depth insight into the battery’s performance.

2.2.2. Feature Analysis

There is a robust correlation between the charging duration and the lithium-ion battery’s maximum available capacity, defining the SOH. As the internal active materials and the electrolyte progressively degrade, the capacity of the battery decreases, its battery performance becomes less stable, and the charging duration may become more irregular and random. Therefore, this paper focuses on extracting constant voltage charging durations and their related statistical features, analyzing their correlation with the SOH estimation.
Shannon entropy is typically used to measure a sequence’s uncertainty or randomness, as shown in Equation (1). Based on the above analysis, as the battery capacity decreases, the charging duration sequence exhibits randomness, and the Shannon entropy of the charging duration sequence may change. This can signify the declining pattern of battery capacity and act as a gauge in approximating the condition of battery health.
H ( t ) = t n p ( t i ) log 1 p ( t i )
where H ( t ) denotes the Shannon entropy of the continuous constant voltage charging time series signal t , and p ( t i ) denotes the constant voltage charging time series, i = 1 , 2 , 3 , , N .
Before calculating the Shannon entropy, it is necessary to segment the constant voltage charging curve. Figure 1 illustrates a schematic diagram of the division of constant voltage charging intervals. This paper adopts equal current intervals as the basis for segmenting constant voltage charging durations. The curve of constant voltage charging durations is divided into four intervals based on the values of the current, with the corresponding current values of boundary points as follows:
I = [ I 41 , I 42 , I 43 , I 44 , I 45 ]
Recording the timestamp corresponding to each current value, where the timestamp corresponding to I 41 is marked as t 1 , the resulting time series is as follows:
t = [ t 1 , t 2 , t 3 , t 4 , t 5 ]
The constant voltage charging duration for each interval is calculated as follows:
t 4 , i = t i + 1 t i
where i = 1 , 2 , 3 , 4 .
The charging durations of each interval are combined to create a constant voltage charging duration sequence as follows:
t = [ t 4 , 1 , t 4 , 2 , t 4 , 3 , t 4 , 4 ]
On the basis of the constant voltage charging duration sequence given in (5), the difference between adjacent intervals’ charging durations is calculated as follows:
Δ t j = t 4 , j + 1 t 4 , j
where j = 1 , 2 , 3 .
A constant voltage charging duration increment sequence is formed as follows:
t d i v = [ Δ t 1 , Δ t 2 , Δ t 3 ]
The Shannon entropy of Equations (5) and (7) is calculated based on Equation (1), the Shannon entropy of the constant voltage charging duration sequence is obtained, defined as T s h a , and the Shannon entropy of the constant voltage charging duration increment sequence is obtained, defined as T s h a 2 . In the following section, we will explore the correlation between T c v , T s h a , and T s h a 2 as features and the SOH, in which T c v represents the constant voltage charging duration.

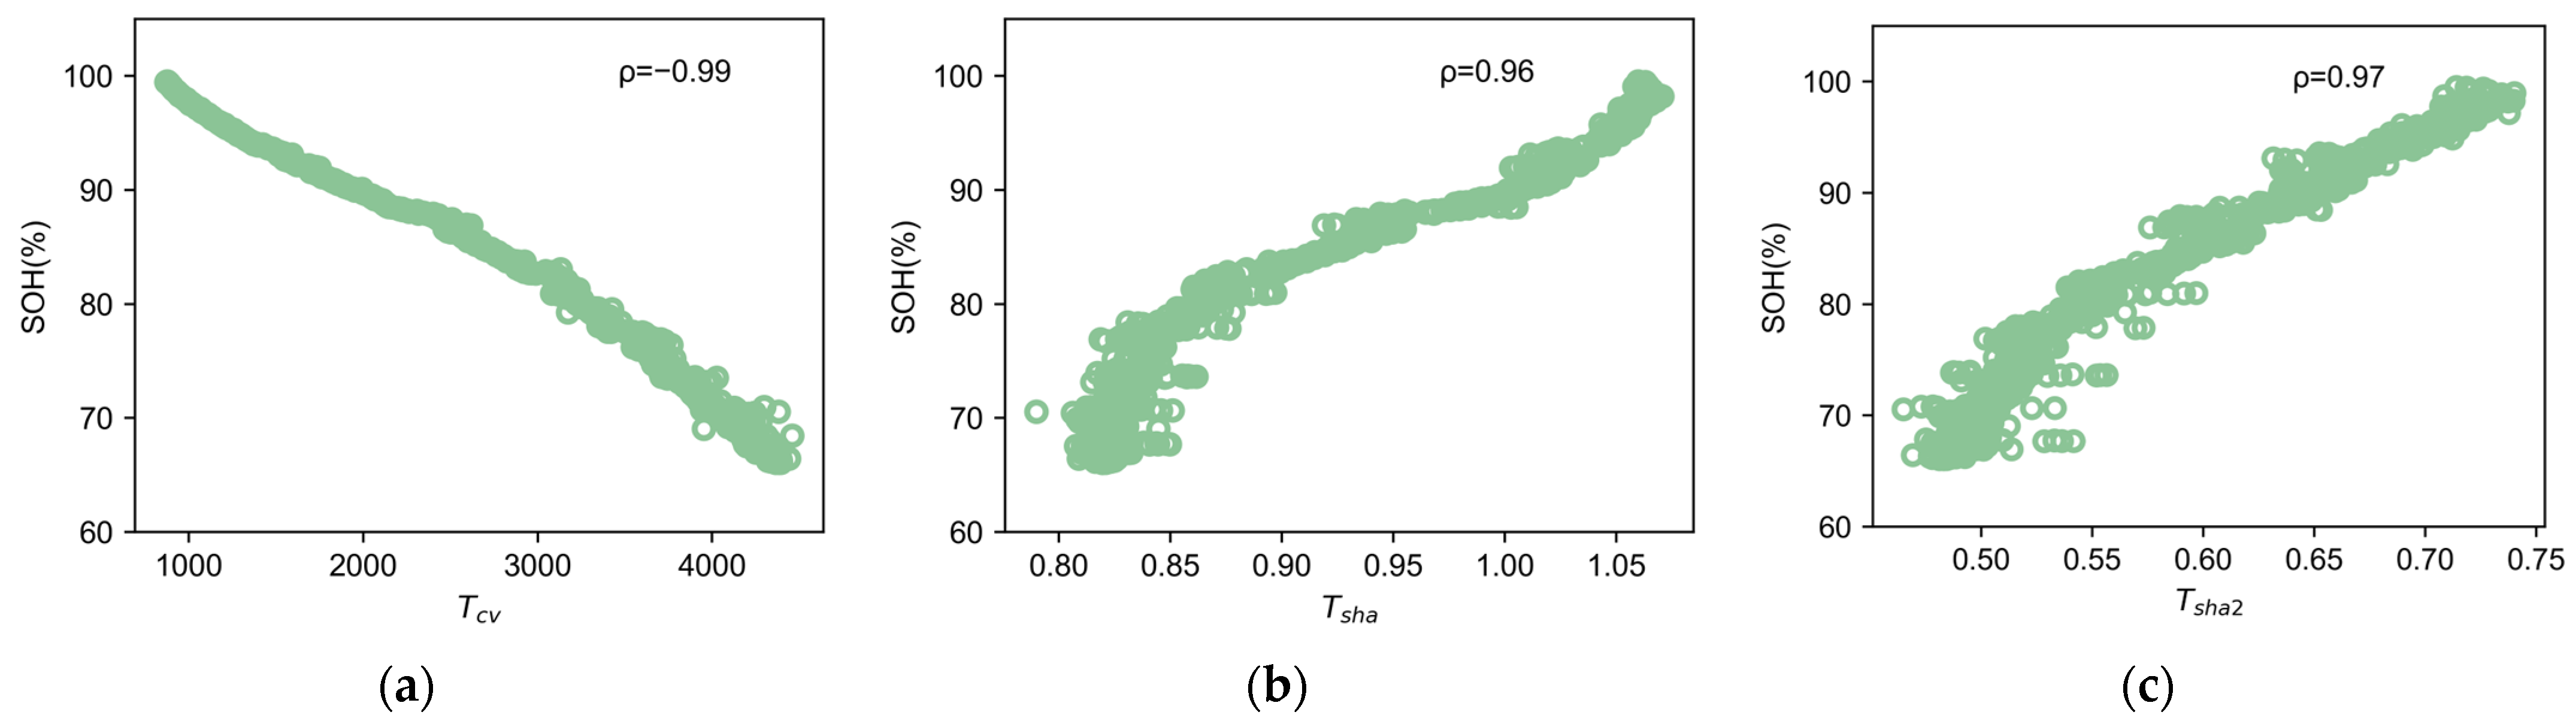
2.2.3. Feature Correlation Analysis

To discern how the features and the SOH relate to one another, we treat them as two distinct variables and employ a correlation analysis methodology to ascertain the connection between their respective patterns and the intensity of correlation. In the correlation analysis, the Pearson correlation coefficient is customarily utilized to determine the extent of linear correlation between the two variables [50], as well as to assess the similarity between features and categories.
Here, the Pearson coefficient is utilized to scrutinize the correlation that exists among Tcv, Tsha, and Tsha2, and the SOH. Correlation analysis experiments are conducted using batteries from the NCM + NCA dataset with a cycling temperature of 25 °C, a charging rate of 0.5 C, and a discharge rate of 4 C.
The Pearson coefficient represents the covariance ratio between two elements equal to the product of their respective standard deviations, as derived in Equations (8) and (9).
C o v ( X , S O H ) = E [ ( X μ X ) ( S O H μ S O H ) ]
where X is the corresponding characteristic element, μ X is the standard deviation of the X element, μ S O H is the standard deviation of SOH, and C o v ( X , S O H ) is the covariance between X and SOH.
ρ = C o v ( X , S O H ) σ X σ S O H
where ρ is the Pearson coefficient.
As per the evaluative metrics of the Pearson correlation coefficient, a higher absolute ρ value points towards a stronger correlation. Table 2 illustrates that the basic values of the Pearson coefficients are higher than 0.95 for all three independent variables and the SOH, which unequivocally denotes a robust correlation.
Figure 2a–c represent the Pearson correlation plots for the three features and the SOH. From the figures, it is evident that the feature Tcv has a pronounced negative correlation with SOH, while Tsha and Tsha2 exhibit positive correlations with SOH.

3. Methodology

3.1. Mathematical Model of Elastic Net Regression

The Elastic Net Regression model is a form of linear regression that incorporates both L1 and L2 norms as regularization terms while undergoing training. Through the amalgamation of L1 and L2 regularization, the model becomes more stable, capable of better generalizing new data, and less susceptible to the influence of outliers or extreme values. Additionally, when dealing with a large amount of battery information, using Elastic Net Regression can control model complexity and prevent overfitting, which significantly aids in simplifying SOH estimation models.
In (10), the penalty term for Elastic Net Regression is illustrated to consist of a fusion of L1 and L2 regularization.
F ( ω ) = α ( μ i = 1 n ω i + ( 1 μ ) i = 1 n ω i 2 )
Here, F ( ω ) represents the penalty term for Elastic Net Regression, α represents the regularization coefficient for Elastic Net Regression, μ represents the mixing parameter that controls the weighting of L1 and L2 regularization in the combination, n signifies the number of features, and ω i stands for the coefficient for the ith feature.
The loss function for Elastic Net Regression is represented by Equation (11).
L ( ω ) = 1 2 m i = 1 m ( h ω ( x ( i ) ) y ( i ) ) 2
Here, m is a data sample, and the ‘ith’ sample’s estimated SOH by the model is represented by h ω ( x ( i ) ) , while the actual SOH label for the ‘ith’ sample is represented by y ( i ) .
Due to the effective control of computational complexity, Elastic Net Regression can efficiently handle a large amount of battery data. When estimating the battery health status, Elastic Net Regression can rapidly extract critical information from a plethora of feature data, reducing data dimensionality. Therefore, using Elastic Net Regression simplifies data processing and modeling complexity, effectively conserving computational resources. It enhances the SOH estimation efficiency while maintaining the estimation accuracy.

3.2. SOH Estimation Method Based on Elastic Net Regression Model

Figure 3 depicts the overall framework for estimating battery health status using the Elastic Net Regression model. After thoroughly examining the tenets of the Elastic Net Regression model and taking into account the current circumstances surrounding lithium-ion batteries, we have crafted a model to estimate the SOH in accordance with the Elastic Net Regression.
The following are the steps for constructing the model.
(1)
Data preprocessing: remove outliers, convert capacity to the SOH defined by capacity, and standardize the dataset.
(2)
Dataset construction: allocate the estimation dataset as a training set and a test set on a per-battery basis, with a 1:1 ratio of training batteries to test batteries.
(3)
Define input and output: use T c v , T s h a , and T s h a 2 as model inputs, with the corresponding SOH data as model output.
(4)
Set model hyperparameters: set the Elastic Net regression model parameters with the best regularization coefficient as 0.00001, and the Elastic Net mixing parameter as 0.1, representing a combination of L1 and L2 regularization penalties.
(5)
Train and test the SOH estimation model, and reverse standardize the output results.

4. Analysis of Experimental Results

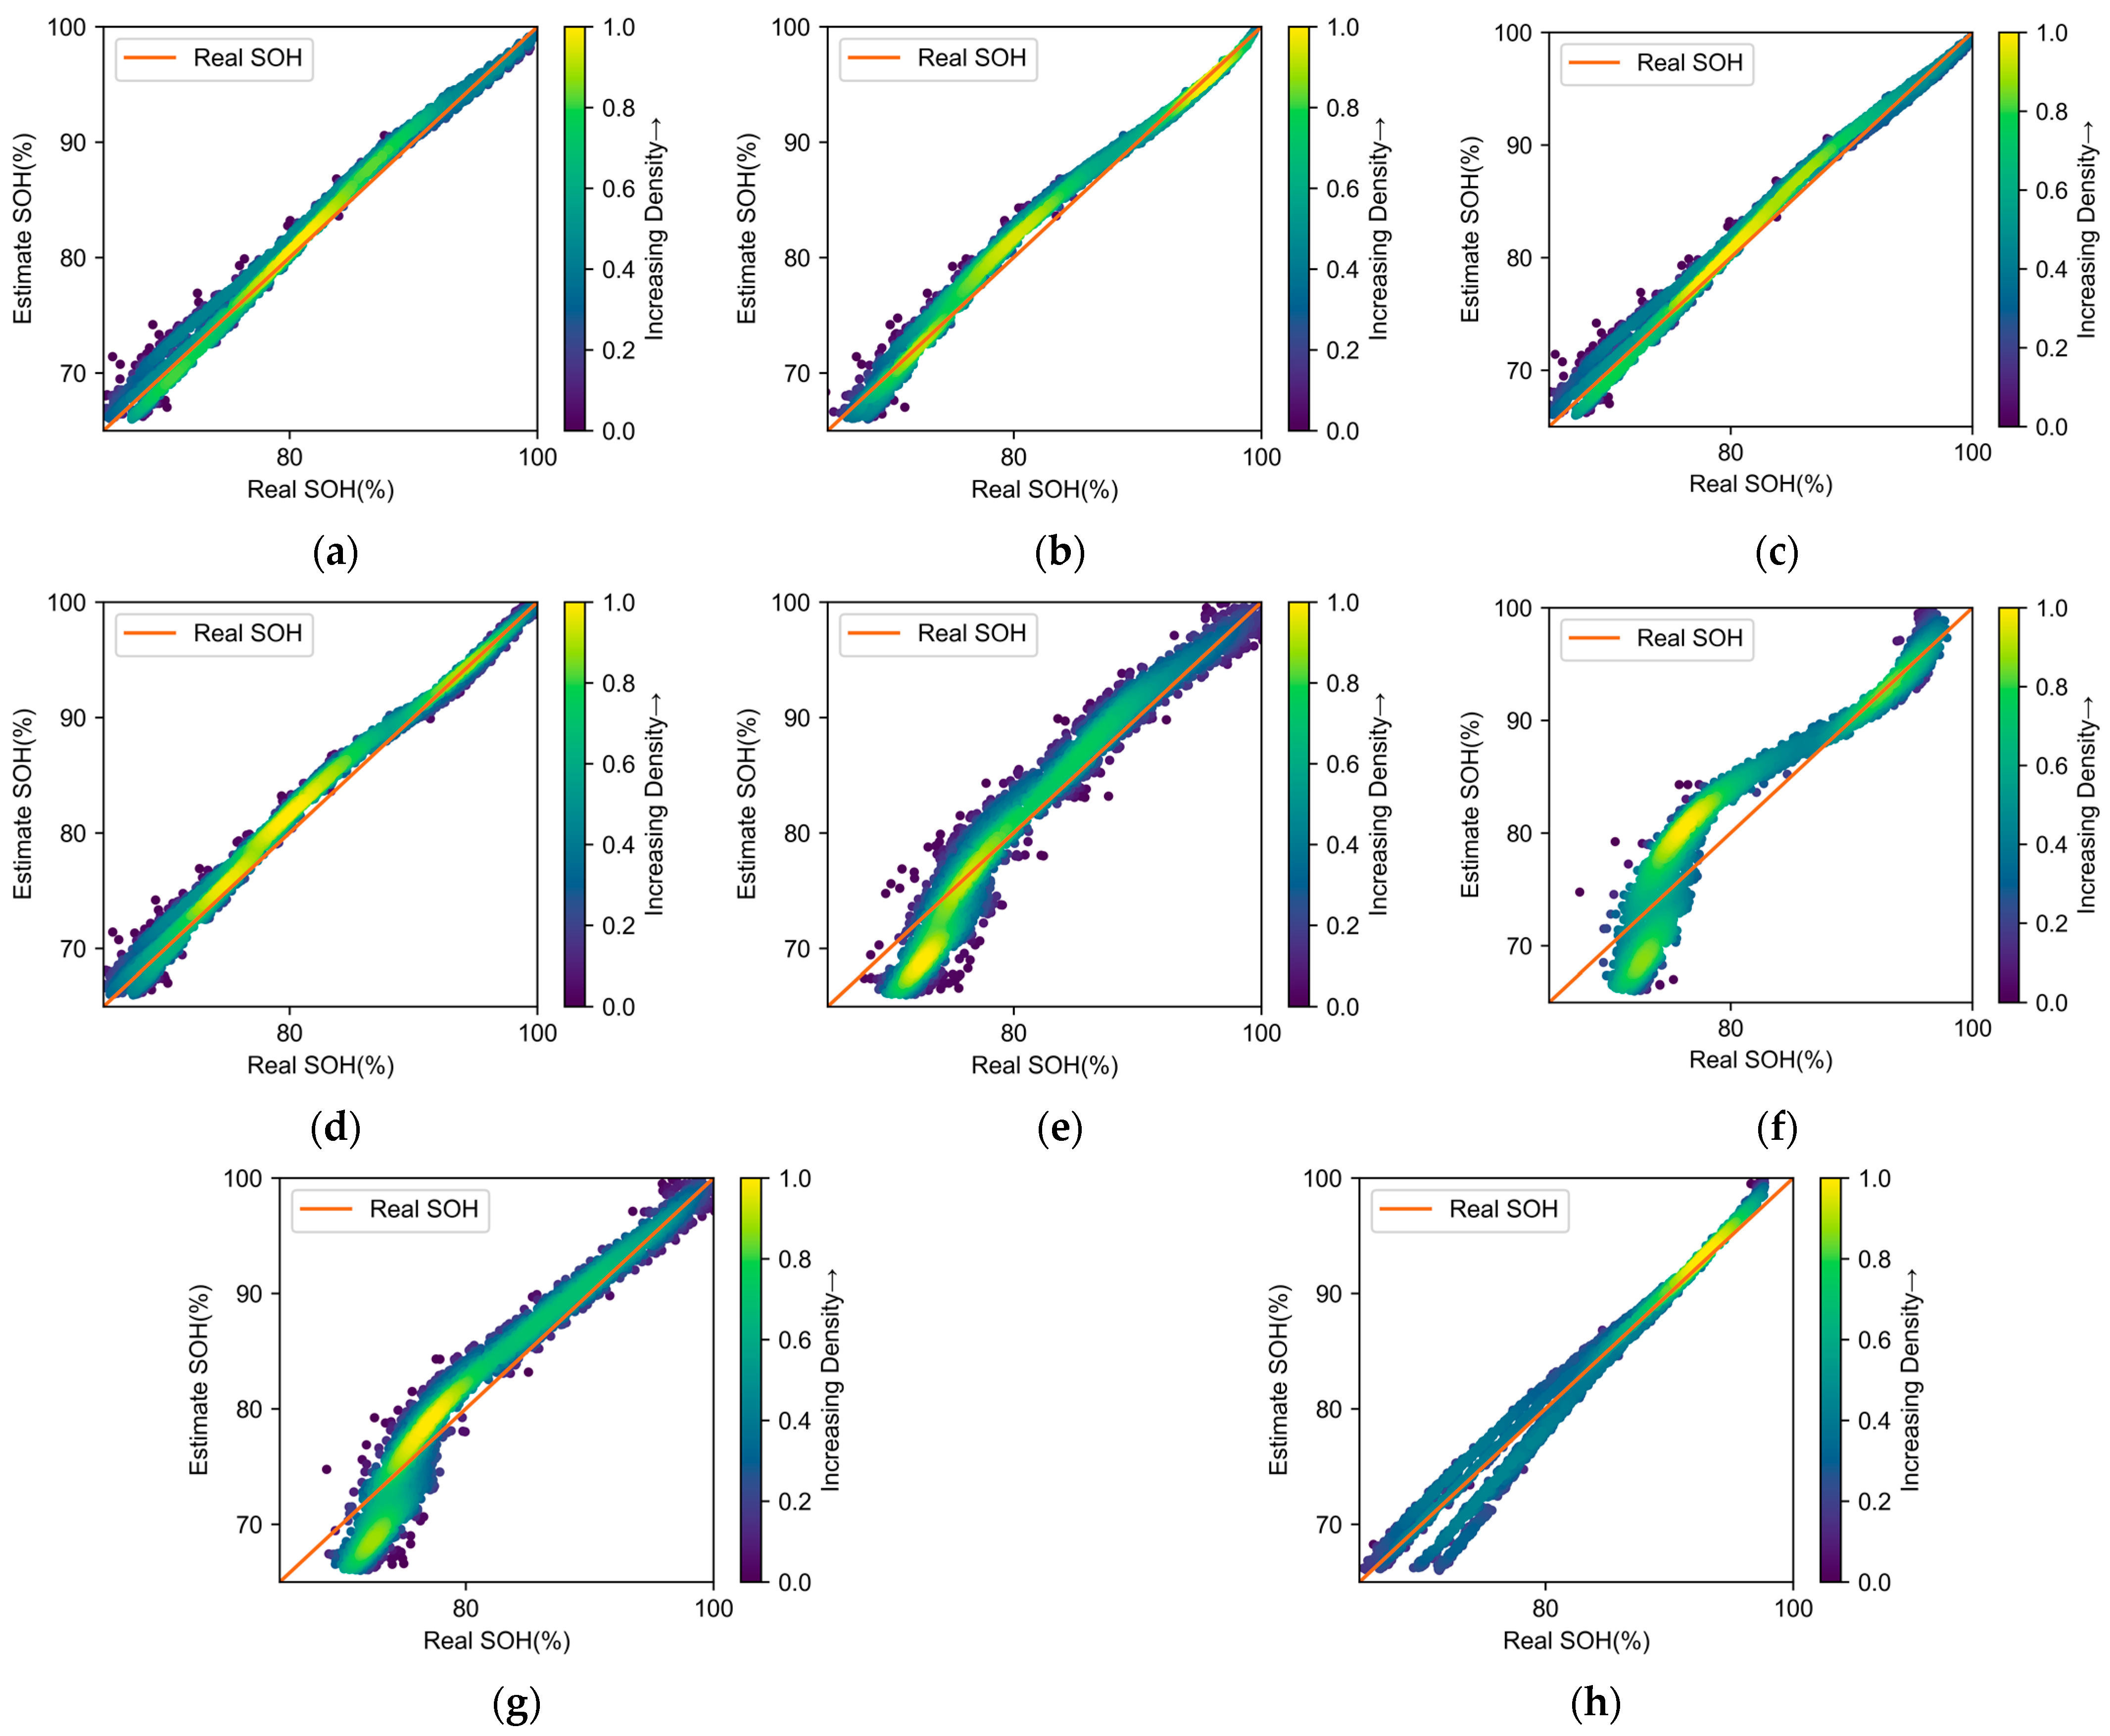
4.1. Evaluation Metrics

This study employs three evaluation metrics, namely, MAE, RMSE, and R2, to gauge estimation accuracy. These metrics serve as vital benchmarks for assessing model performance in machine learning. Here is an introduction to these three evaluation metrics:
MAE is represented as the average of absolute errors, which is, in fact, a more general form of the average error. A smaller MAE value indicates a higher model accuracy. Its expression is as shown in (12).
M A E = 1 m i = 1 m ( S O H i S O H i ^ )
where m denotes the quantity of samples, S O H i stands for the factual maximum battery capacity, while S O H i ^ corresponds to the anticipated maximum battery capacity.
RMSE measures the average magnitude of errors in the measurements. A smaller value indicates a higher model accuracy. Its expression is as shown in (13).
R M S E = 1 m i = 1 m ( S O H i S O H i ^ ) 2
The R2, referred to as the coefficient of determination, denotes the proportion of the entire data variance that a model is capable of accounting for. It serves as a performance metric for models and is commonly used for comparative analysis of different model performances. Its value ranges from [0, 1]. A higher R2 indicates a better model fit. Its expression is as shown in (14).
R 2 = 1 i = 1 m ( S O H i ^ S O H i ) 2 i = 1 m ( S O H i ¯ S O H i ) 2

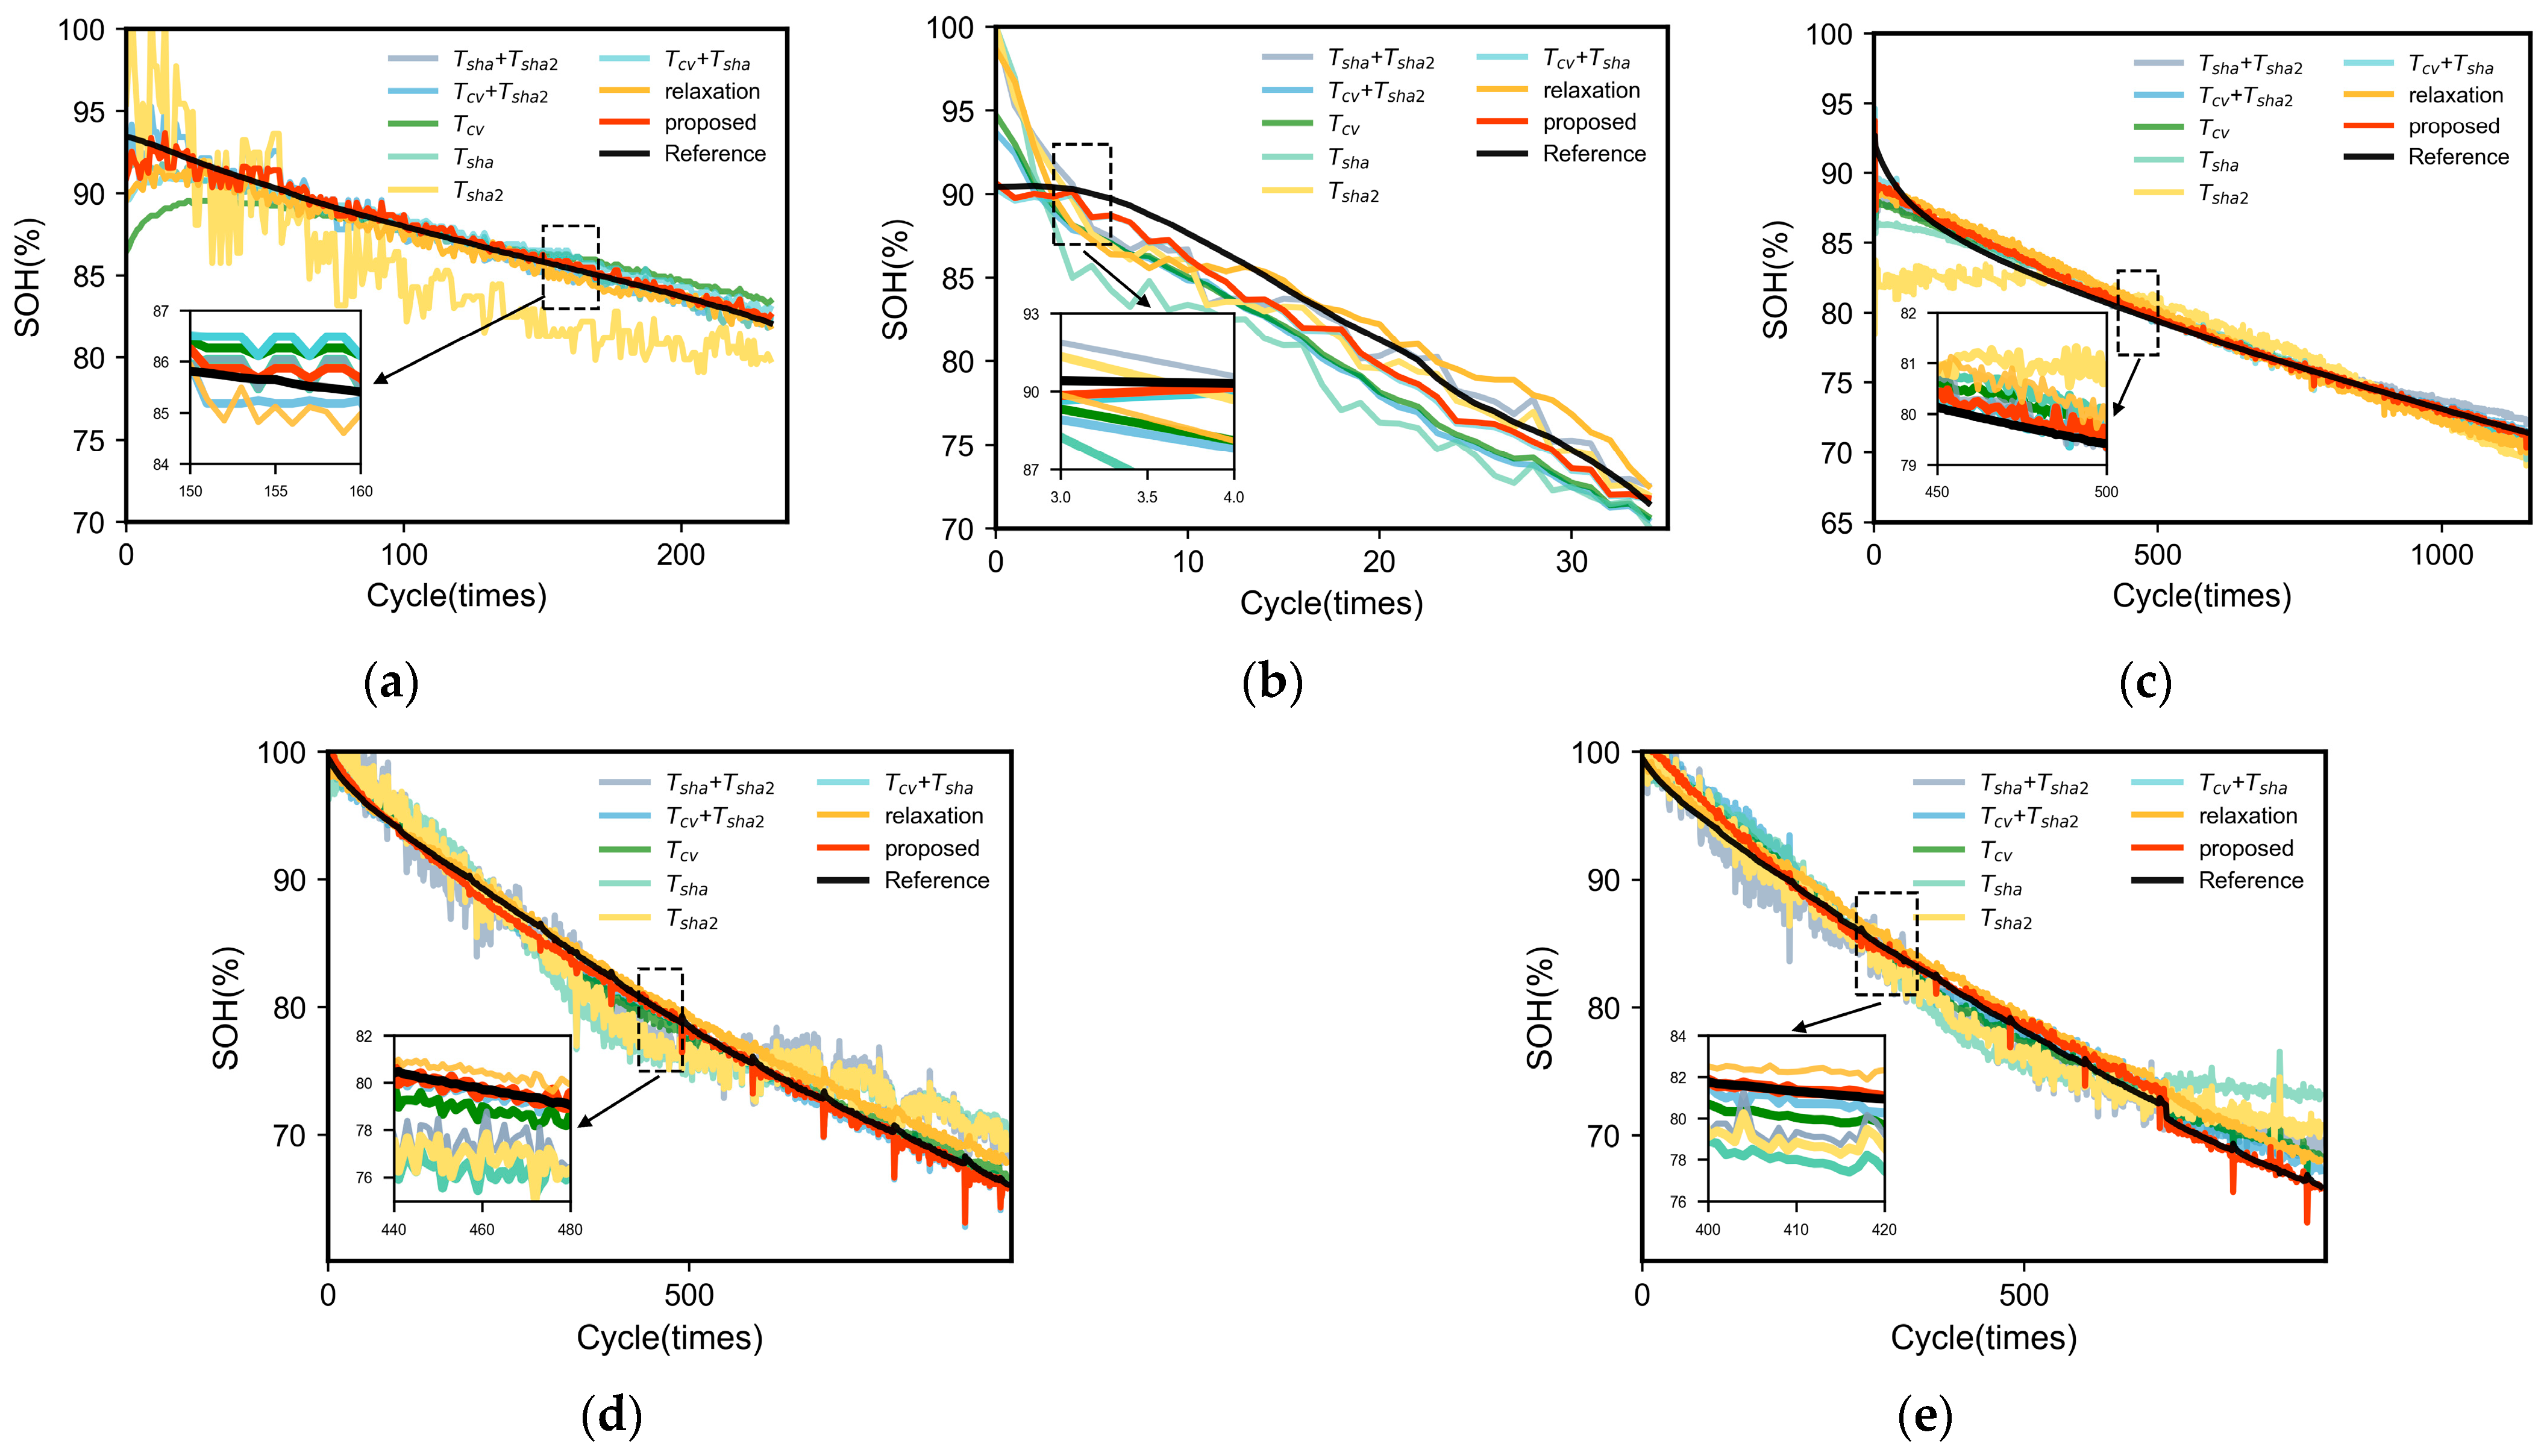
4.2. Comparison with Other Similar Features

For the purpose of validating the eminence of the proposed health attribute, constant voltage charging duration, this section contrasts the outcomes of experiments performed solely with it against the combined results of constant voltage charging duration and the remaining two statistical features. We investigate the performance of the feature combination, i.e., Tcv, Tsha, and Tsha2, proposed in this study, including the duration of CV charging, the Shannon entropy of the CV charging duration sequence, and the Shannon entropy of the CV charging duration increment sequence, in estimating the SOH.

4.2.1. Comparison Experiment with Other Similar Features under the Same Condition

Three different conditions were randomly selected from the three datasets for analysis in the experiments conducted under the same conditions. In dataset NCA, conditions 1 and 2 were selected, where condition 1 represents batteries cycled at 25 °C, utilizing a charge current rate of 0.25 C alongside a discharge rate of 1 C. Condition 2 represents batteries cycled at 25 °C, with a charge current rate of 1 C, and a discharge rate of 1 C. In dataset NCM, condition 3 was selected, representing batteries cycled at 35 °C, with a charge current rate of 0.5 C, and a discharge rate of 1 C. In the dataset, NCM + NCA, conditions 4 and 5 were selected, where condition 4 represents batteries cycled at 25 °C, with a charge current rate of 0.5 C, and discharge rates of 1 C and 4 C. Condition 5 represents batteries cycled at 25 °C, with a charge current rate of 0.5 C, and a discharge rate of 1 C.
Table 3 and Table 4 present the SOH estimation errors for different combinations of constant voltage features. As shown in the tables, when using only one constant voltage charging feature or combining them pairwise as health features, the SOH estimation errors are relatively large, and the estimation performance is not very stable. When using the feature combination proposed in this study to build the SOH estimation model, the average MAE and RMSE are the lowest, and the estimation accuracy is the highest. It can be observed that combining constant voltage charging duration with its statistical parameters under different operating conditions can achieve better estimation results, demonstrating that using statistical parameters of constant voltage charging duration as features effectively complements the missing battery health information in constant voltage charging duration.
Figure 4a–e displays the SOH fitting curves using the Elastic Net Regression model with different feature combinations under the same conditions. From the curves, it can be observed that the fitting effect of SOH using the feature combination proposed in this study is better, and it closely follows the real SOH curve compared to other feature combinations. The present study has effectively demonstrated that utilizing statistics related to the constant voltage charge duration as health indicators can duly enhance the precision of SOH estimation. This proved the superiority of the feature combination stated in the study.

4.2.2. Comparison Experiment with Other Similar Features under the Cross Condition

An analysis was conducted using the NCM + NCA dataset as an example of cross-condition evaluation. The training and testing sets included batteries from three different conditions within the NCM + NCA dataset. Batteries underwent numerous cycles at an operating temperature of 25 °C, during which the charge rate was set at 0.5 C and the discharge rates were set at 1 C, 2 C, and 4 C.
Figure 5a–g shows scatter plots of the SOH estimates for different feature combinations under cross-condition conditions. In the illustration, the arrows indicate the direction of increasing density. It is evident from the figures that when using this specific feature combination for the SOH estimation, the estimation yields the best results, with the estimation points exhibiting the highest density along the actual SOH curve. Table 3 and Table 4 display the MAE, RMSE, and R2 values for the SOH estimation under cross-condition conditions using these different feature combinations. Among them, the SOH estimation error is the smallest, and the fitting performance is the best when employing the proposed feature combination.

4.3. Comparison with Relaxation Features

In addition, this section conducts comparative experiments between the proposed feature combination and the relaxation stage feature combination. A comparison analysis is performed with the feature combination proposed in [42], which consists of relaxation voltage variance (Var), relaxation voltage skewness (Ske), and relaxation voltage maximum value (Max). This feature combination will be labeled as (Var, Ske, Max) in the following text.

4.3.1. Comparison Experiment with Relaxation Features under the Same Condition

This section uses the same experimental batteries as in Section 4.2.1 for five identical functional condition experiments. Figure 4a–e, respectively, display the SOH estimation results under identical conditions using the feature combination proposed in this study and the relaxation feature combination. The figures clearly show that the proposed combination of features yields superior fitting outcomes and bears a greater resemblance to the authentic SOH curve when juxtaposed with the relaxation feature.
The estimation error results for the SOH using the Elastic Net Regression model with two feature combinations under the same operating conditions are presented in Table 5, with MAE, RMSE, and R2 as evaluation metrics. As shown in the table, utilizing the feature combination proposed in this paper for the SOH estimation demonstrates a significant superiority, with an average MAE of 0.64%, an average RMSE of 0.81%, and an average R2 of 0.98. The estimation errors for each operating condition using the proposed feature combination are consistently lower than those with the relaxation segment feature combination, indicating a better fitting performance.

4.3.2. Comparison Experiment with Relaxation Features under the Cross Condition

This section utilizes the same cross-condition experimental conditions as in Section 4.2.2. Under these cross conditions, the SOH estimation errors using the feature combination proposed in this study and the relaxation feature combination are presented in Table 5. Additionally, the scatter plots for the SOH estimation are illustrated in Figure 5a,h. The experimental outcomes clearly demonstrate that utilizing the suggested features in cross-condition experiments leads to considerably lower SOH estimation errors, signifying an overall improved fitting performance.

5. Conclusions

Based on the preceding discussion, we can summarize the main contributions and innovations of this study. Firstly, this study extensively explores the constant voltage charging duration, which contains rich information about the battery health status. We propose using CV charging duration statistics as a health feature, extracting feature combinations highly correlated with the health status of lithium-ion batteries during the constant voltage charging stage. Secondly, this study only relies on the CV charging phase for feature extraction, unaffected by the charging initiation point, making it applicable to a broader range of scenarios. It provides a practical and highly accurate battery health estimation solution for battery manufacturers, BMS manufacturers, and electric vehicle charger manufacturers. This contributes to improving the safety of lithium-ion battery energy storage systems. Additionally, it enables electric vehicle users to obtain more accurate information about the battery’s health status, thereby advancing the safety of electric vehicles.
The experimental results indicate that the feature combination proposed in this paper achieves a high accuracy in the SOH estimation, with both the average MAE and RMSE less than 0.81%. The R2 is above 0.98, demonstrating a significant superiority. However, this study should be improved in the following directions. Firstly, considering that battery performance is influenced by other factors such as temperature and humidity, we will further explore the impact of environmental factors on the SOH estimation based on the above methods. Additionally, this study utilizes a laboratory battery dataset, lacking real-world application data, which may not fully account for battery performance in complex environmental conditions. Therefore, in the future work, to better align with real-world usage scenarios, we plan to collect real vehicle data to train and test the proposed method, making it more comprehensive in adapting to the complexity and variability of the real world.

Author Contributions

Conceptualization, J.C., D.C. and C.S.L.; methodology, X.H.; software, X.H.; validation, J.C., D.C. and Z.L.; formal analysis, W.Z.; investigation, W.Z.; resources, J.C.; data curation, X.H.; writing—original draft preparation, J.C. and X.H.; writing—review and editing, D.C. and C.S.L.; visualization, Z.L.; supervision, W.Z. and Z.L.; project administration, C.S.L.; funding acquisition, J.C. All authors have read and agreed to the published version of the manuscript.

Funding

This research was funded by Guided (Key) Projects for Industry in Fujian Province under grant 2022H0046.

Data Availability Statement

The data presented in this study are openly available in reference number [42] able.

Conflicts of Interest

Author J.C., D.C., Z.L., W.Z was employed by the company State Grid Fujian Electric Power Research Institute. Author C.S.L. was employed by the Brunel Interdisciplinary Power Systems Research Centre. The remaining authors declare that the research was conducted in the absence of any commercial or financial relationships that could be construed as a potential conflict of interest.

References

  1. Bayani, R.; Soofi, A.F.; Waseem, M.; Manshadi, S.D. Impact of Transportation Electrification on the Electricity Grid—A Review. Vehicles 2022, 4, 1042–1079. [Google Scholar] [CrossRef]
  2. Nguyen, R.T.; Eggert, R.G.; Severson, M.H.; Anderson, C.G. Global Electrification of Vehicles and Intertwined Material Supply Chains of Cobalt, Copper and Nickel. Resour. Conserv. Recycl. 2021, 167, 105198. [Google Scholar] [CrossRef]
  3. Gabbar, H.; Othman, A.; Abdussami, M. Review of Battery Management Systems (BMS) Development and Industrial Standards. Technologies 2021, 9, 28. [Google Scholar] [CrossRef]
  4. Cunanan, C.; Tran, M.-K.; Lee, Y.; Kwok, S.; Leung, V.; Fowler, M. A Review of Heavy-Duty Vehicle Powertrain Technologies: Diesel Engine Vehicles, Battery Electric Vehicles, and Hydrogen Fuel Cell Electric Vehicles. Clean Technol. 2021, 3, 474–489. [Google Scholar] [CrossRef]
  5. Ajanovic, A.; Glatt, A.; Haas, R. Prospects and Impediments for Hydrogen Fuel Cell Buses. Energy 2021, 235, 121340. [Google Scholar] [CrossRef]
  6. Mo, T.; Li, Y.; Lau, K.-T.; Poon, C.K.; Wu, Y.; Luo, Y. Trends and Emerging Technologies for the Development of Electric Vehicles. Energies 2022, 15, 6271. [Google Scholar] [CrossRef]
  7. Karki, A.; Phuyal, S.; Tuladhar, D.; Basnet, S.; Shrestha, B. Status of Pure Electric Vehicle Power Train Technology and Future Prospects. Appl. Syst. Innov. 2020, 3, 35. [Google Scholar] [CrossRef]
  8. Ho, J.C.; Huang, Y.-H.S. Evaluation of Electric Vehicle Power Technologies: Integration of Technological Performance and Market Preference. Clean. Responsible Consum. 2022, 5, 100063. [Google Scholar] [CrossRef]
  9. Miranda, J.P.D.; Barros, L.A.M.; Pinto, J.G. A Review on Power Electronic Converters for Modular BMS with Active Balancing. Energies 2023, 16, 3255. [Google Scholar] [CrossRef]
  10. Calearo, L.; Ziras, C.; Thingvad, A.; Marinelli, M. Agnostic Battery Management System Capacity Estimation for Electric Vehicles. Energies 2022, 15, 9656. [Google Scholar] [CrossRef]
  11. Rottoli, M.; Dirnaichner, A.; Pietzcker, R.; Schreyer, F.; Luderer, G. Alternative Electrification Pathways for Light-Duty Vehicles in the European Transport Sector. Transp. Res. D Transp. Environ. 2021, 99, 103005. [Google Scholar] [CrossRef]
  12. Lawder, M.T.; Suthar, B.; Northrop, P.W.C.; De, S.; Hoff, C.M.; Leitermann, O.; Crow, M.L.; Santhanagopalan, S.; Subramanian, V.R. Battery Energy Storage System (BESS) and Battery Management System (BMS) for Grid-Scale Applications. Proc. IEEE Inst. Electr. Electron. Eng. 2014, 102, 1014–1030. [Google Scholar] [CrossRef]
  13. Si, J.; Tang, Y.; Li, X.; Zhang, L. Comprehensive Reliability Assessment Method for Lithium Battery Energy Storage Systems. J. Phys. Conf. Ser. 2023, 2474, 012009. [Google Scholar] [CrossRef]
  14. Urquizo, J.; Singh, P. A Review of Health Estimation Methods for Lithium-Ion Batteries in Electric Vehicles and Their Relevance for Battery Energy Storage Systems. J. Energy Storage 2023, 73, 109194. [Google Scholar] [CrossRef]
  15. Gismero, A.; Nørregaard, K.; Johnsen, B.; Stenhøj, L.; Stroe, D.-I.; Schaltz, E. Electric Vehicle Battery State of Health Estimation Using Incremental Capacity Analysis. J. Energy Storage 2023, 64, 107110. [Google Scholar] [CrossRef]
  16. Meng, J.; Cai, L.; Stroe, D.-I.; Ma, J.; Luo, G.; Teodorescu, R. An Optimized Ensemble Learning Framework for Lithium-Ion Battery State of Health Estimation in Energy Storage System. Energy 2020, 206, 118140. [Google Scholar] [CrossRef]
  17. Liu, Y.; Liu, C.; Liu, Y.; Sun, F.; Qiao, J.; Xu, T. Review on Degradation Mechanism and Health State Estimation Methods of Lithium-Ion Batteries. J. Traffic Transp. Eng. 2023, 10, 578–610. [Google Scholar] [CrossRef]
  18. Ren, Z.; Du, C. A Review of Machine Learning State-of-Charge and State-of-Health Estimation Algorithms for Lithium-Ion Batteries. Energy Rep. 2023, 9, 2993–3021. [Google Scholar] [CrossRef]
  19. Zhu, G.; Kong, C.; Wang, J.V.; Kang, J.; Wang, Q.; Qian, C. A Fractional-Order Electrochemical Lithium-Ion Batteries Model Considering Electrolyte Polarization and Aging Mechanism for State of Health Estimation. J. Energy Storage 2023, 72, 108649. [Google Scholar] [CrossRef]
  20. Liu, B.; Tang, X.; Gao, F. Joint Estimation of Battery State-of-Charge and State-of-Health Based on a Simplified Pseudo-Two-Dimensional Model. Electrochim. Acta 2020, 344, 136098. [Google Scholar] [CrossRef]
  21. Vennam, G.; Sahoo, A. A Dynamic SOH-Coupled Lithium-Ion Cell Model for State and Parameter Estimation. IEEE Trans. Energy Convers. 2023, 38, 1186–1196. [Google Scholar] [CrossRef]
  22. Amir, S.; Gulzar, M.; Tarar, M.O.; Naqvi, I.H.; Zaffar, N.A.; Pecht, M.G. Dynamic Equivalent Circuit Model to Estimate State-of-Health of Lithium-Ion Batteries. IEEE Access 2022, 10, 18279–18288. [Google Scholar] [CrossRef]
  23. Çarkıt, T.; Alçı, M. Investigation of Voc and SoH on Li-Ion Batteries with an Electrical Equivalent Circuit Model Using Optimization Algorithms. Electr. Eng. 2022, 1–12. [Google Scholar] [CrossRef]
  24. Zhang, J.; Wang, P.; Gong, Q.; Cheng, Z. SOH Estimation of Lithium-Ion Batteries Based on Least Squares Support Vector Machine Error Compensation Model. J. Power Electron. 2021, 21, 1712–1723. [Google Scholar] [CrossRef]
  25. Singh, P.; Chen, C.; Tan, C.M.; Huang, S.-C. Semi-Empirical Capacity Fading Model for SoH Estimation of Li-Ion Batteries. Appl. Sci. 2019, 9, 3012. [Google Scholar] [CrossRef]
  26. Kheirkhah-Rad, E.; Moeini-Aghtaie, M. A Novel Data-Driven SOH Prediction Model for Lithium-Ion Batteries. In Proceedings of the 2021 31st Australasian Universities Power Engineering Conference (AUPEC), Perth, Australia, 26–30 September 2021. [Google Scholar] [CrossRef]
  27. Xiong, W.; Mo, Y.; Yan, C. Online State-of-Health Estimation for Second-Use Lithium-Ion Batteries Based on Weighted Least Squares Support Vector Machine. IEEE Access 2021, 9, 1870–1881. [Google Scholar] [CrossRef]
  28. Aggab, T.; Avila, M.; Vrignat, P.; Kratz, F. Unifying Model-Based Prognosis with Learning-Based Time-Series Prediction Methods: Application to Li-Ion Battery. IEEE Syst. J. 2021, 15, 5245–5254. [Google Scholar] [CrossRef]
  29. Chen, Z.; Shi, N.; Ji, Y.; Niu, M.; Wang, Y. Lithium-Ion Batteries Remaining Useful Life Prediction Based on BLS-RVM. Energy 2021, 234, 121269. [Google Scholar] [CrossRef]
  30. Heinrich, F.; Pruckner, M. Virtual Experiments for Battery State of Health Estimation Based on Neural Networks and In-Vehicle Data. J. Energy Storage 2022, 48, 103856. [Google Scholar] [CrossRef]
  31. Liu, Q.; Kang, Y.; Qu, S.; Duan, B.; Wen, F.; Zhang, C. An Online SOH Estimation Method Based on the Fusion of Improved ICA and LSTM. In Proceedings of the 2020 IEEE/IAS Industrial and Commercial Power System Asia (I&CPS Asia), Weihai, China, 13–15 July 2020; pp. 1163–1167. [Google Scholar] [CrossRef]
  32. Ma, Y.; Shan, C.; Gao, J.; Chen, H. A Novel Method for State of Health Estimation of Lithium-Ion Batteries Based on Improved LSTM and Health Indicators Extraction. Energy 2022, 251, 123973. [Google Scholar] [CrossRef]
  33. Wang, J.; Deng, Z.; Yu, T.; Yoshida, A.; Xu, L.; Guan, G.; Abudula, A. State of Health Estimation Based on Modified Gaussian Process Regression for Lithium-Ion Batteries. J. Energy Storage 2022, 51, 104512. [Google Scholar] [CrossRef]
  34. He, Y.-J.; Shen, J.-N.; Shen, J.-F.; Ma, Z.-F. State of Health Estimation of Lithium-Ion Batteries: A Multiscale Gaussian Process Regression Modeling Approach. AIChE J. 2015, 61, 1589–1600. [Google Scholar] [CrossRef]
  35. Fan, Y.; Xiao, F.; Li, C.; Yang, G.; Tang, X. A Novel Deep Learning Framework for State of Health Estimation of Lithium-Ion Battery. J. Energy Storage 2020, 32, 101741. [Google Scholar] [CrossRef]
  36. He, W.; Li, Z.; Liu, T.; Liu, Z.; Guo, X.; Du, J.; Li, X.; Sun, P.; Ming, W. Research Progress and Application of Deep Learning in Remaining Useful Life, State of Health and Battery Thermal Management of Lithium Batteries. J. Energy Storage 2023, 70, 107868. [Google Scholar] [CrossRef]
  37. Pózna, A.I.; Hangos, K.M.; Magyar, A. Design of Experiments for Battery Aging Estimation. IFAC-PapersOnLine 2018, 51, 386–391. [Google Scholar] [CrossRef]
  38. Gong, D.; Gao, Y.; Kou, Y.; Wang, Y. State of Health Estimation for Lithium-Ion Battery Based on Energy Features. Energy 2022, 257, 124812. [Google Scholar] [CrossRef]
  39. Guo, P.; Cheng, Z.; Yang, L. A Data-Driven Remaining Capacity Estimation Approach for Lithium-Ion Batteries Based on Charging Health Feature Extraction. J. Power Sources 2019, 412, 442–450. [Google Scholar] [CrossRef]
  40. Ghosh, N.; Garg, A.; Warnecke, A.; Panigrahi, B.K. State of Health Estimation of Lithium-Ion Batteries for Dynamic Driving Profiles Based on Feature Extraction from Battery Relaxation Time Using Machine Learning. In Proceedings of the IECON 2022—48th Annual Conference of the IEEE Industrial Electronics Society, Brussels, Belgium, 17–20 October 2022. [Google Scholar] [CrossRef]
  41. Baghdadi, I.; Briat, O.; Gyan, P.; Vinassa, J.M. State of Health Assessment for Lithium Batteries Based on Voltage–Time Relaxation Measure. Electrochim. Acta 2016, 194, 461–472. [Google Scholar] [CrossRef]
  42. Zhu, J.; Wang, Y.; Huang, Y.; Bhushan Gopaluni, R.; Cao, Y.; Heere, M.; Mühlbauer, M.J.; Mereacre, L.; Dai, H.; Liu, X.; et al. Data-Driven Capacity Estimation of Commercial Lithium-Ion Batteries from Voltage Relaxation. Nat. Commun. 2022, 13, 2261. [Google Scholar] [CrossRef]
  43. Yang, J.; Li, X.; Sun, X.; Cai, Y.; Mi, C. An Efficient and Robust Method for Lithium-Ion Battery Capacity Estimation Using Constant-Voltage Charging Time. Energy 2023, 263, 125743. [Google Scholar] [CrossRef]
  44. Wang, Z.; Zeng, S.; Guo, J.; Qin, T. State of Health Estimation of Lithium-Ion Batteries Based on the Constant Voltage Charging Curve. Energy 2019, 167, 661–669. [Google Scholar] [CrossRef]
  45. Yang, J.; Cai, Y.; Mi, C.C. State-of-Health Estimation for Lithium-Ion Batteries Based on Decoupled Dynamic Characteristic of Constant-Voltage Charging Current. IEEE Trans. Transp. Electrif. 2022, 8, 2070–2079. [Google Scholar] [CrossRef]
  46. Yun, Z.; Qin, W. Remaining Useful Life Estimation of Lithium-Ion Batteries Based on Optimal Time Series Health Indicator. IEEE Access 2020, 8, 55447–55461. [Google Scholar] [CrossRef]
  47. Pan, W.; Chen, Q.; Zhu, M.; Tang, J.; Wang, J. A Data-Driven Fuzzy Information Granulation Approach for Battery State of Health Forecasting. J. Power Sources 2020, 475, 228716. [Google Scholar] [CrossRef]
  48. Qiu, Y.; Cao, W.; Peng, P.; Jiang, F. A Novel Entropy-Based Fault Diagnosis and Inconsistency Evaluation Approach for Lithium-Ion Battery Energy Storage Systems. J. Energy Storage 2021, 41, 102852. [Google Scholar] [CrossRef]
  49. Zhang, Z.; Lai, Z.; Xu, Y.; Shao, L.; Wu, J.; Xie, G.-S. Discriminative Elastic-Net Regularized Linear Regression. IEEE Trans. Image Process. 2017, 26, 1466–1481. [Google Scholar] [CrossRef]
  50. Scarpelli, C.; Gazzarri, J.; Huria, T.; Lutzemberger, G.; Ceraolo, M. Neural Network for the Estimation of LFP Battery SOH Cycled at Different Power Levels. J. Energy Storage 2023, 66, 107027. [Google Scholar] [CrossRef]
Figure 1. Schematic diagram of constant voltage charging interval duration division.
Batteries 09 00565 g001
Figure 2. Relationship plots between each feature and the SOH: (a) Tcv, (b) Tsha, and (c) Tsha2.
Batteries 09 00565 g002
Figure 3. Holistic framework for estimating battery health status based on Elastic Net Regression.
Batteries 09 00565 g003
Figure 4. SOH estimation results for different feature combinations using the Elastic Net Regression Model under identical conditions: (a) condition 1, (b) condition 2, (c) condition 3, (d) condition 4, and (e) condition 5.
Batteries 09 00565 g004
Figure 5. The scatter plots of SOH estimation points using different feature combinations with Elastic Net Regression under cross conditions: (a) proposed, (b) Tcv, (c) Tcv and Tsha, (d) Tcv and Tsha2, (e) Tsha and Tsha2, (f) Tsha, (g) Tsha2, and (h) relaxation.
Batteries 09 00565 g005
Table 1. Introduction to dataset loop conditions.
DatasetCharge Voltage—Discharge Voltage (V)Capacity in
Ampere-Hours (Ah)
Cycle
Temperature (°C)
Charge Current/Discharge Current Multiplier
NCA4.2–2.653.5250.25/1
0.5/1
1/1
350.5/1
450.5/1
NCM4.2–2.53.5250.5/1
350.5/1
450.5/1
NCM + NCA4.2–2.52.5250.5/1
0.5/2
0.5/4
Table 2. Pearson correlation degree of the characteristic.
FeaturePearson’s Correlation
Tcv−0.99
Tsha0.96
Tsha20.97
Table 3. SOH estimation error under the proposed feature combination and individual CV features.
ConditionTcv, Tsha, Tsha2Only TcvOnly TshaOnly Tsha2
MAE/%RMSE/%R2MAE/%RMSE/%R2MAE/%RMSE/%R2MAE/%RMSE/%R2
Condition 10.380.530.971.141.690.720.450.600.963.073.38−0.14
Condition 21.081.190.962.312.420.843.824.190.531.682.470.84
Condition 30.330.500.990.500.710.980.631.000.961.542.350.78
Condition 40.450.631.000.700.840.992.282.670.921.992.330.94
Condition 50.620.820.991.061.250.982.463.060.891.632.000.96
Cross Condition0.981.200.981.091.350.982.523.040.892.032.480.93
Overall Mean0.640.810.981.131.380.922.032.430.861.992.500.72
The bolded numbers in the table indicate the average values of MAE, RMSE, and R2 for the proposed feature combination and individual CV features under different conditions.
Table 4. SOH estimation error under the proposed feature combination and its pairwise combinations.
ConditionTcv, Tsha, Tsha2Tcv, TshaTcv, Tsha2Tsha, Tsha2
MAE/%RMSE/%R2MAE/%RMSE/%R2MAE/%RMSE/%R2MAE/%RMSE/%R2
Condition 10.380.530.970.680.920.920.560.790.940.450.600.96
Condition 21.081.190.961.181.290.962.462.550.821.512.320.85
Condition 30.330.500.990.400.530.990.330.520.990.510.710.98
Condition 40.450.631.000.450.631.000.550.730.992.012.420.93
Condition 50.620.820.990.620.820.991.011.240.981.461.760.97
Cross Condition0.981.200.981.001.220.981.121.370.982.032.520.93
Overall Mean0.640.810.980.720.900.971.011.200.951.331.720.94
The bolded numbers in the table indicate the average values of MAE, RMSE, and R2 for the proposed feature combination and its pairwise combinations under different conditions.
Table 5. SOH estimation error based on Elastic Net Regression under two features combination.
Condition(Tcv, Tsha, Tsha2)(Var, Ske, Max)
MAE/%RMSE/%R2MAE/%RMSE/%R2
Condition 10.380.530.970.630.870.93
Condition 21.081.190.961.822.450.84
Condition 30.330.500.990.790.930.97
Condition 40.450.631.000.720.870.99
Condition 50.620.820.991.171.280.98
Cross Condition0.981.200.981.381.830.96
Overall Mean Value0.640.810.981.091.370.94
The bolded numbers in the table indicate the average values of MAE, RMSE, and R2 for two features combination under different conditions.
Disclaimer/Publisher’s Note: The statements, opinions and data contained in all publications are solely those of the individual author(s) and contributor(s) and not of MDPI and/or the editor(s). MDPI and/or the editor(s) disclaim responsibility for any injury to people or property resulting from any ideas, methods, instructions or products referred to in the content.

