3.1. Defect Chemistry and Phase Transition
Defects in the solid-state structure, which are often accompanied by phase transition and local structure distortion, directly affect active Li
+ and vacancy concentrations. Since the Li
+ hopping process is very sensitive to these concentrations, tuning defects can be an effective strategy towards a facile Li
+ hopping process, which in turn boosts the ionic conductivity in orders of magnitude. The ion transport via vacancies is the predominant migration behavior for many kinds of superionic conductors [
39]. According to one study [
39], in the close-packed lattice, the Li
+ migration barrier through vacancies is much lower than the direct or ring exchange diffusion process. In a layered structure, the Li
+ ion would prefer to migrate from one octahedron site to another via their adjacent tetrahedral vacancy. For layered Li
3MX
6-type halides, when the compound is stoichiometric, there are 1/3 vacancies that reside in octahedral interstitial sites. These vacancies are essential in achieving high ionic conductivity in the Li
3MX
6 structure.
An aliovalent substitution of metal ions could readily enrich the active Li
+ and vacancy concentration to improve the ionic conductivity. The increased vacancy concentration may lead to a redistribution of Li ions, and even bring new Li
+ sites (as new active Li
+). It also should be noted that aliovalent substitution often triggers phase transition and distortion in the lattice. Here we discuss four published works [
24,
40,
41,
42] to show how NPD assists the above study.
The first work is about a Zr
4+ substituted halide system Li
3−xM
1−xZr
xCl
6 (M = Y, Er) (
x = 0–0.6) that mainly involves the finding of a new Li
+ site after phase transition, as reported by Park et al. [
24]. Zr
4+ (r = 72 pm) was specifically adopted to substitute Y
3+ (r = 90 pm) and Er
3+ (r = 89 pm) since its ionic radius is larger than other M
4+ metal ions. After substitution, the halide transits from a trigonal to an orthorhombic structure, and achieves a highest room-temperature ionic conductivity of 1.1 × 10
−3 S cm
−1 at
x = 0.367 for Li
3−xEr
1−xZr
xCl
6 (phase III, orthorhombic
Pnma), and 1.4 × 10
−3 S cm
−1 at
x = 0.5 for Li
3−xY
1−xZr
xCl
6 (phase III, orthorhombic
Pnma). Such ionic conductivity is among the top class of reported chloride compounds. The author also discovered that orthorhombic Li
3−xM
1−xZr
xCl
6 has excellent electrochemical oxidation stability against non-coated 4 V-class cathode materials that does not show any observable oxidative interfacial decomposition in full cells. It was concluded that the phase transition from trigonal to orthorhombic structure and additional Li
+ sites (marked as Li3) account for the superior conductivity.
TOF NPD was performed in combination with single crystal XRD. First, they used single-crystal XRD to solve the location of heavy ions Er
3+, Y
3+, Zr
4+, Cl
−. Second, this model was directly used in neutron diffraction Rietveld refinements to refine the Li
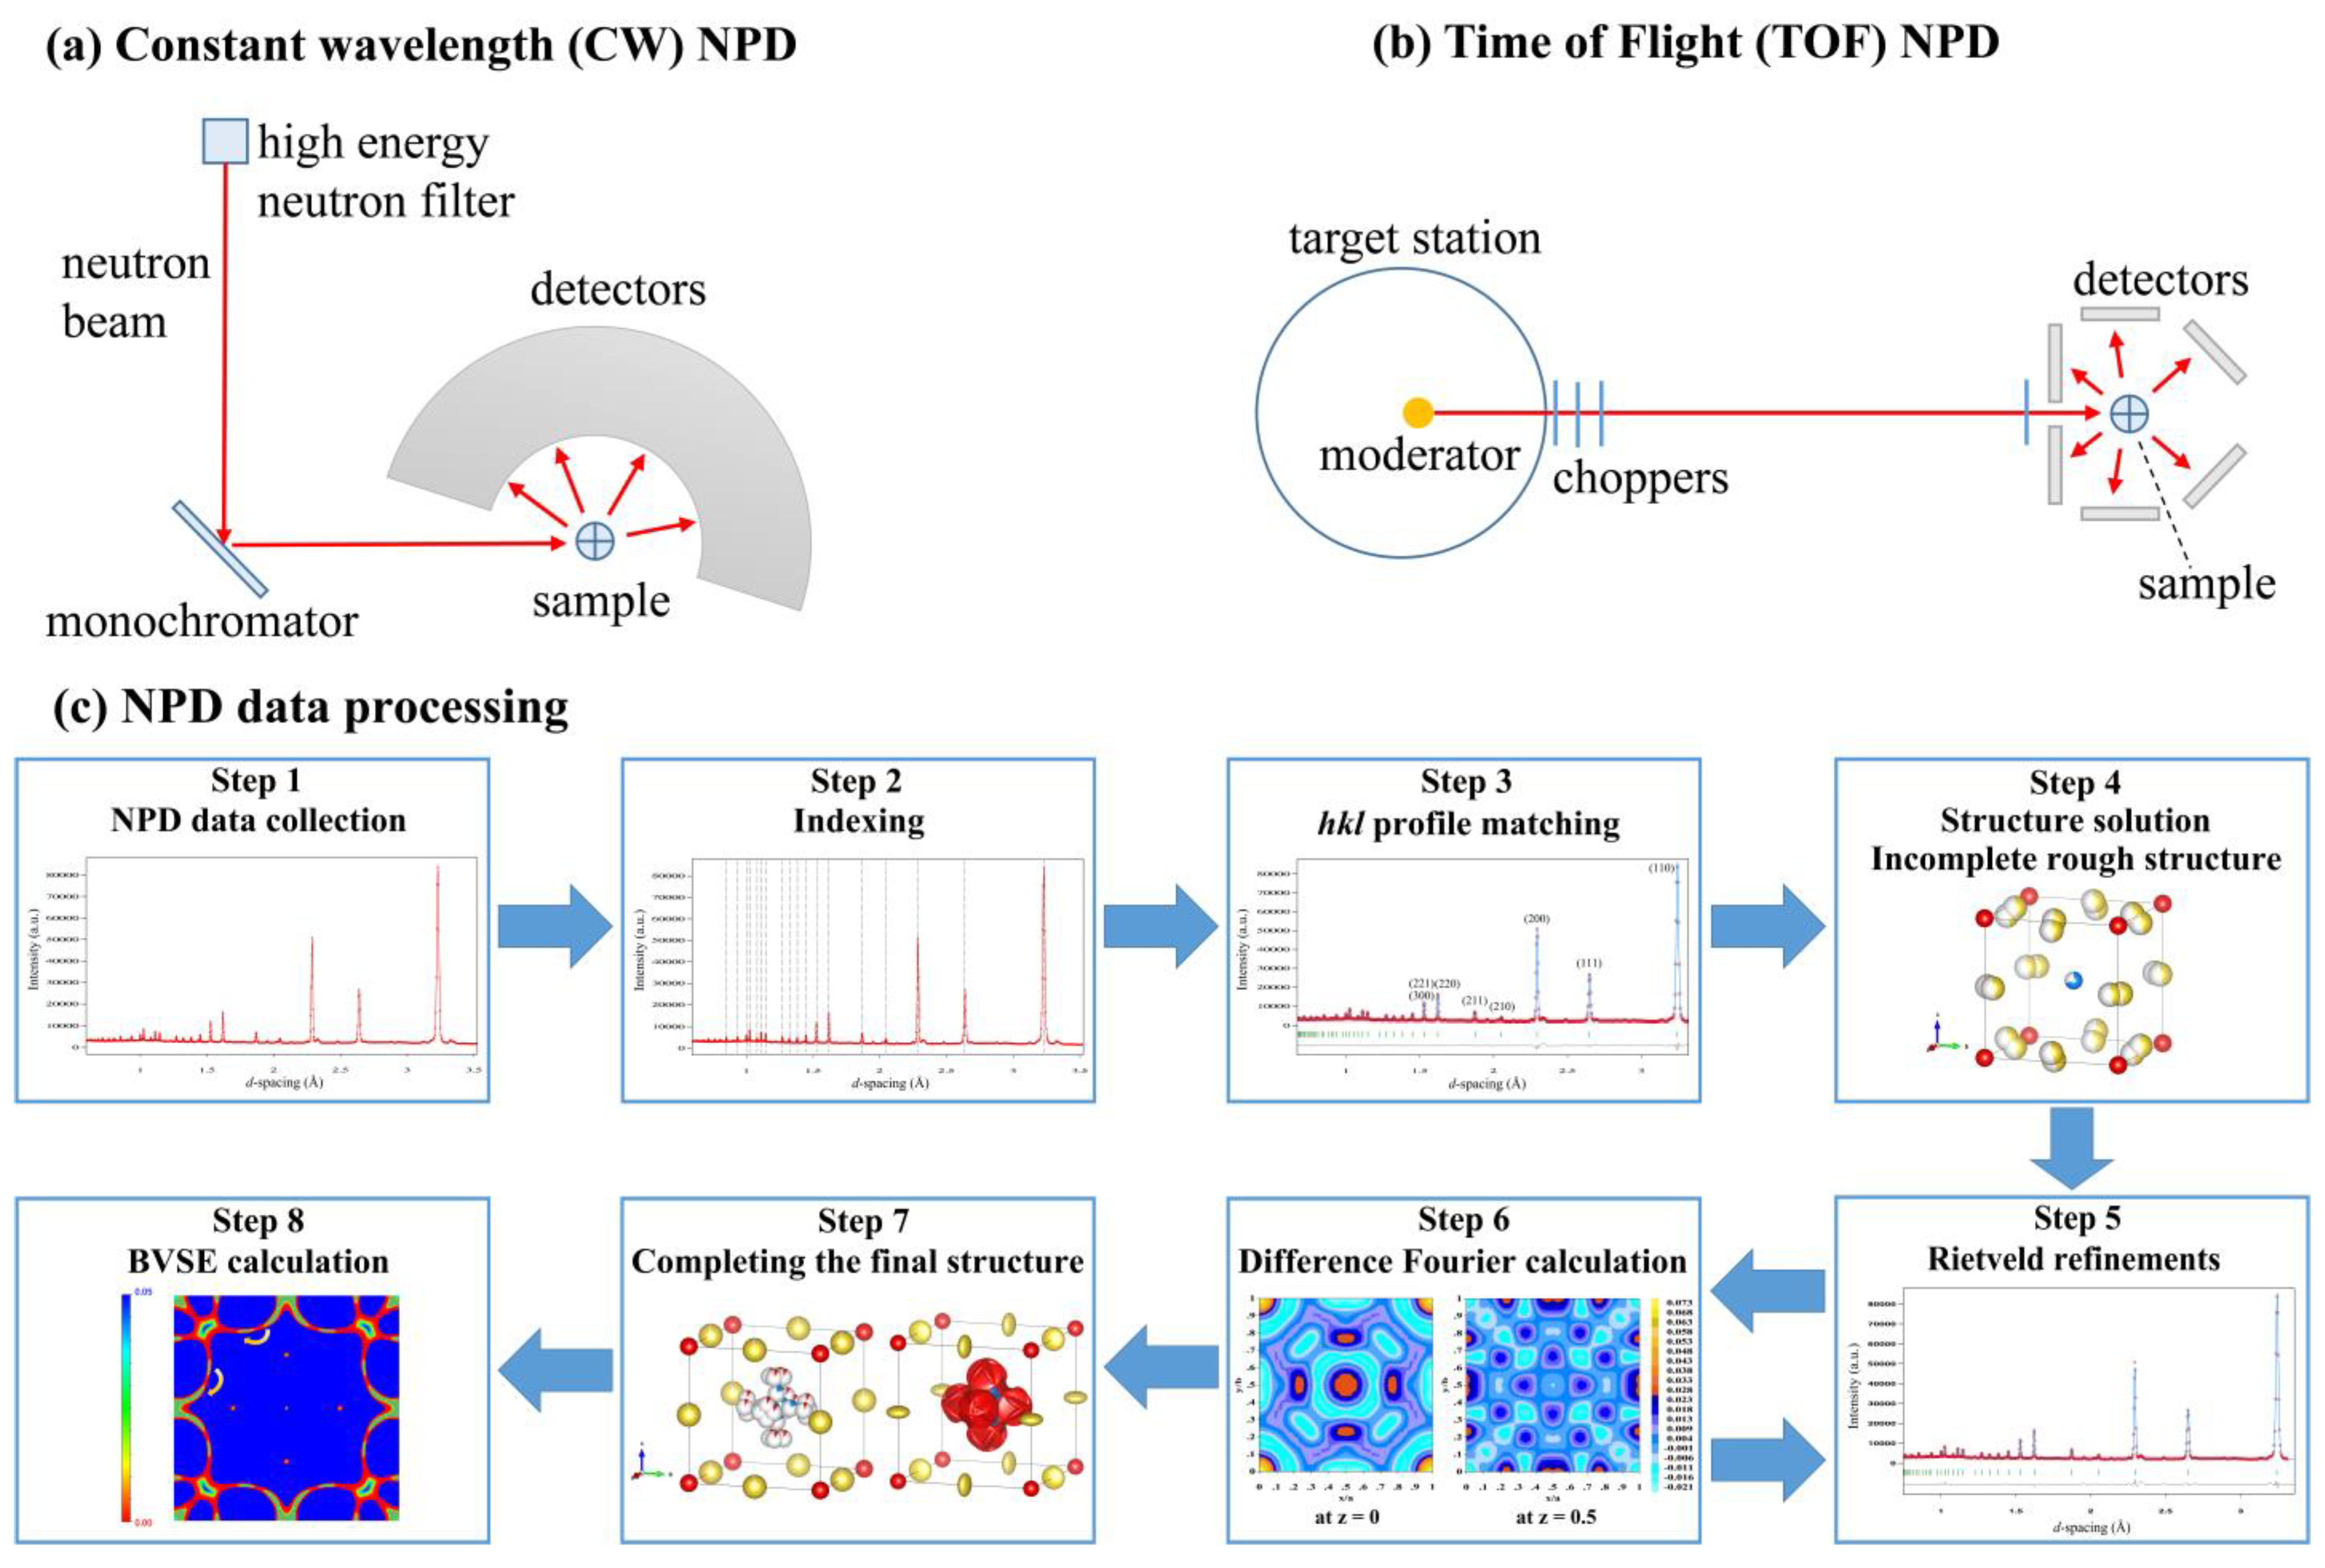
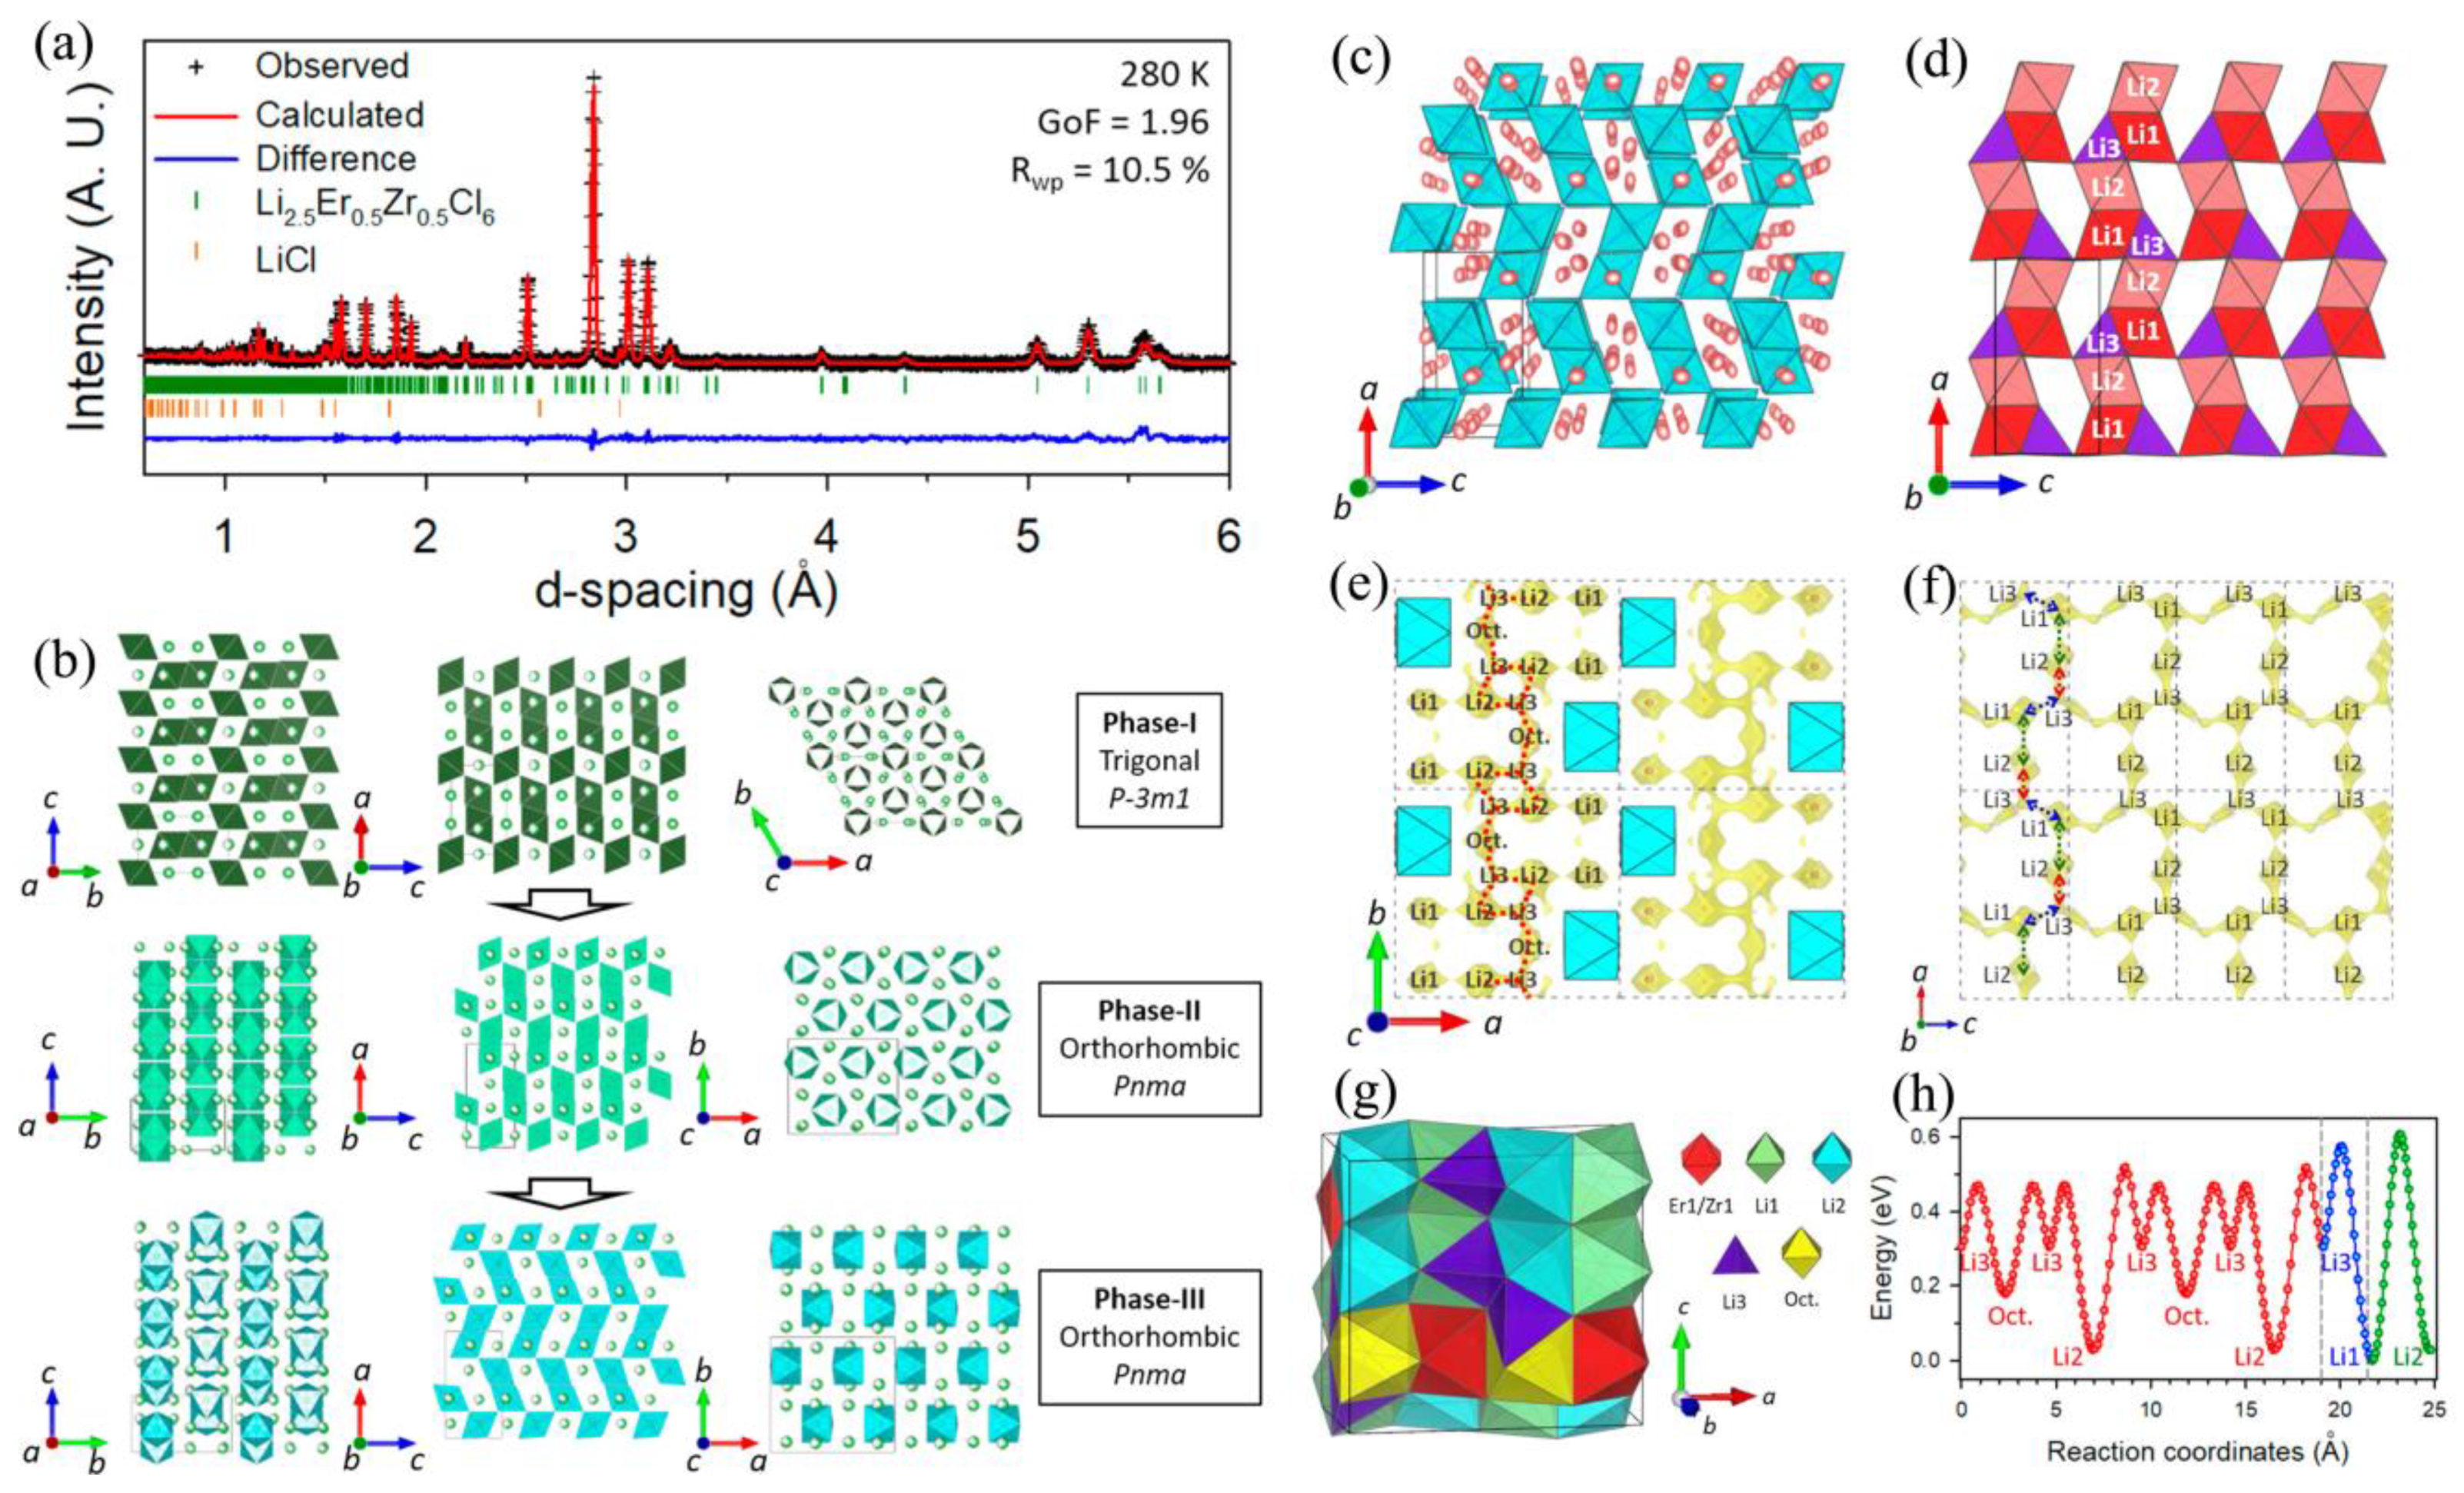
+ position (while keeping the heavy ions fixed). Third, the Er/Zr ratio was set to the single-crystal value while other parameters like occupancies and thermal displacements were freely refined. Note that a constraint on total Li occupancy was added for charge balance. The final NPD refinement plot is shown in
Figure 1a, which is often presented in research papers including observed neutron data, a mathematically calculated line obtained from the final structure, index of diffraction peaks (indicating which plane the peak belongs to), and difference between observed and calculated data. Empirically, when the
χ2 (=GoF
2) is lower than 2, along with a residual factor
Rwp lower than 13%, the refinement result is acceptable.
The trigonal-to-orthorhombic phase transition as identified by NPD data is shown in
Figure 1b. Pristine Li
3ErCl
6 and Li
3YCl
6 are trigonal in structure (space group
P-3
m1, marked as phase I). When Zr
4+ is 0.2 ≤
x ≤ 0.3, the phase transition occurs and an orthorhombic Li
3LuCl
6-typed [
43] structure (
Pnma, phase II) appears. At higher substitution levels (0.367 ≤
x ≤ 0.600), the MCl
6 octahedra undergo further tilting that distorts the orthorhombic structure (
Pnma, phase III). Tilting or distortion of octahedra often happen with phase transition.
The new tetrahedral Li3 site that is about 20% occupied was only observed in phase III, as shown in
Figure 1c,d. In phase III, the Li1 and Li2 octahedra are face-shared in pairs, and the Li3 tetrahedron connects these Li1/Li2 octahedral pairs in a trigonal face-shared manner to establish Li
+ ion diffusion chains along the
a-axis. Note that all three Li
+ sites contain a significant vacancy population between 25% and 80%. The emergence of a Li3 tetrahedral site indicates a redistribution of Li
+ ions. As concluded by the author, these Li3 sites and vacancies are responsible for the higher Li
+ conductivity in phase III.
Bond-valence site energy (BVSE) methods [
36,
37] can calculate the energy landscape of the Li
+ diffusion pathway. In
Figure 1e, the [Li3–Oct.–Li3–Li2] zigzag chain running along the [010] direction was the most desired one-dimensional pathway. This pathway along the
b-axis intersects with [Li2–Li3–Li1] chains of the
ac-plane (
Figure 1f) to form a 3D network for Li
+ migration. In
Figure 1g, a metastable octahedral interstitial site, namely “Oct”, which is face-shared with Er/Zr octahedra, was suggested to participate in the Li
+ migration. Moreover, the site energy profile (
Figure 1h) extracted from the overall landscape reveals a lower energy barrier for orthorhombic Li
2.5Er
0.5Zr
0.5Cl
6 (phase III). The barrier for trigonal Li
3ErCl
6 (phase I) was claimed be about 1.5-fold higher than this orthorhombic one.
The second work is about Li
3−xIn
1−xZr
xCl
6 [
40] that mainly involves octahedral distortion, accompanied with Li
+ redistribution and Li
+-metal cations disorder (disorder will be discussed further in a following section). The author concluded that local M2/Li4 octahedra distortion, along with Li
+ redistribution and disorder, accounts for the conductivity improvement from 0.47 mS·cm
−1 of Li
3InCl
6 to 1.25 mS·cm
−1 of Li
2.6In
0.6Zr
0.4Cl
6. It should be noted that pristine Li
3InCl
6 has been reported to possess higher conductivity (~1.49 mS·cm
−1 [
22], ~2 mS cm
−1 [
23,
44]) than in this work. However, this should be related to the synthesis method. It can be expected that after optimization on a synthesis route, Li
2.6In
0.6Zr
0.4Cl
6 would achieve higher conductivity than Li
3InCl
6 of 1.49~2 mS cm
−1.
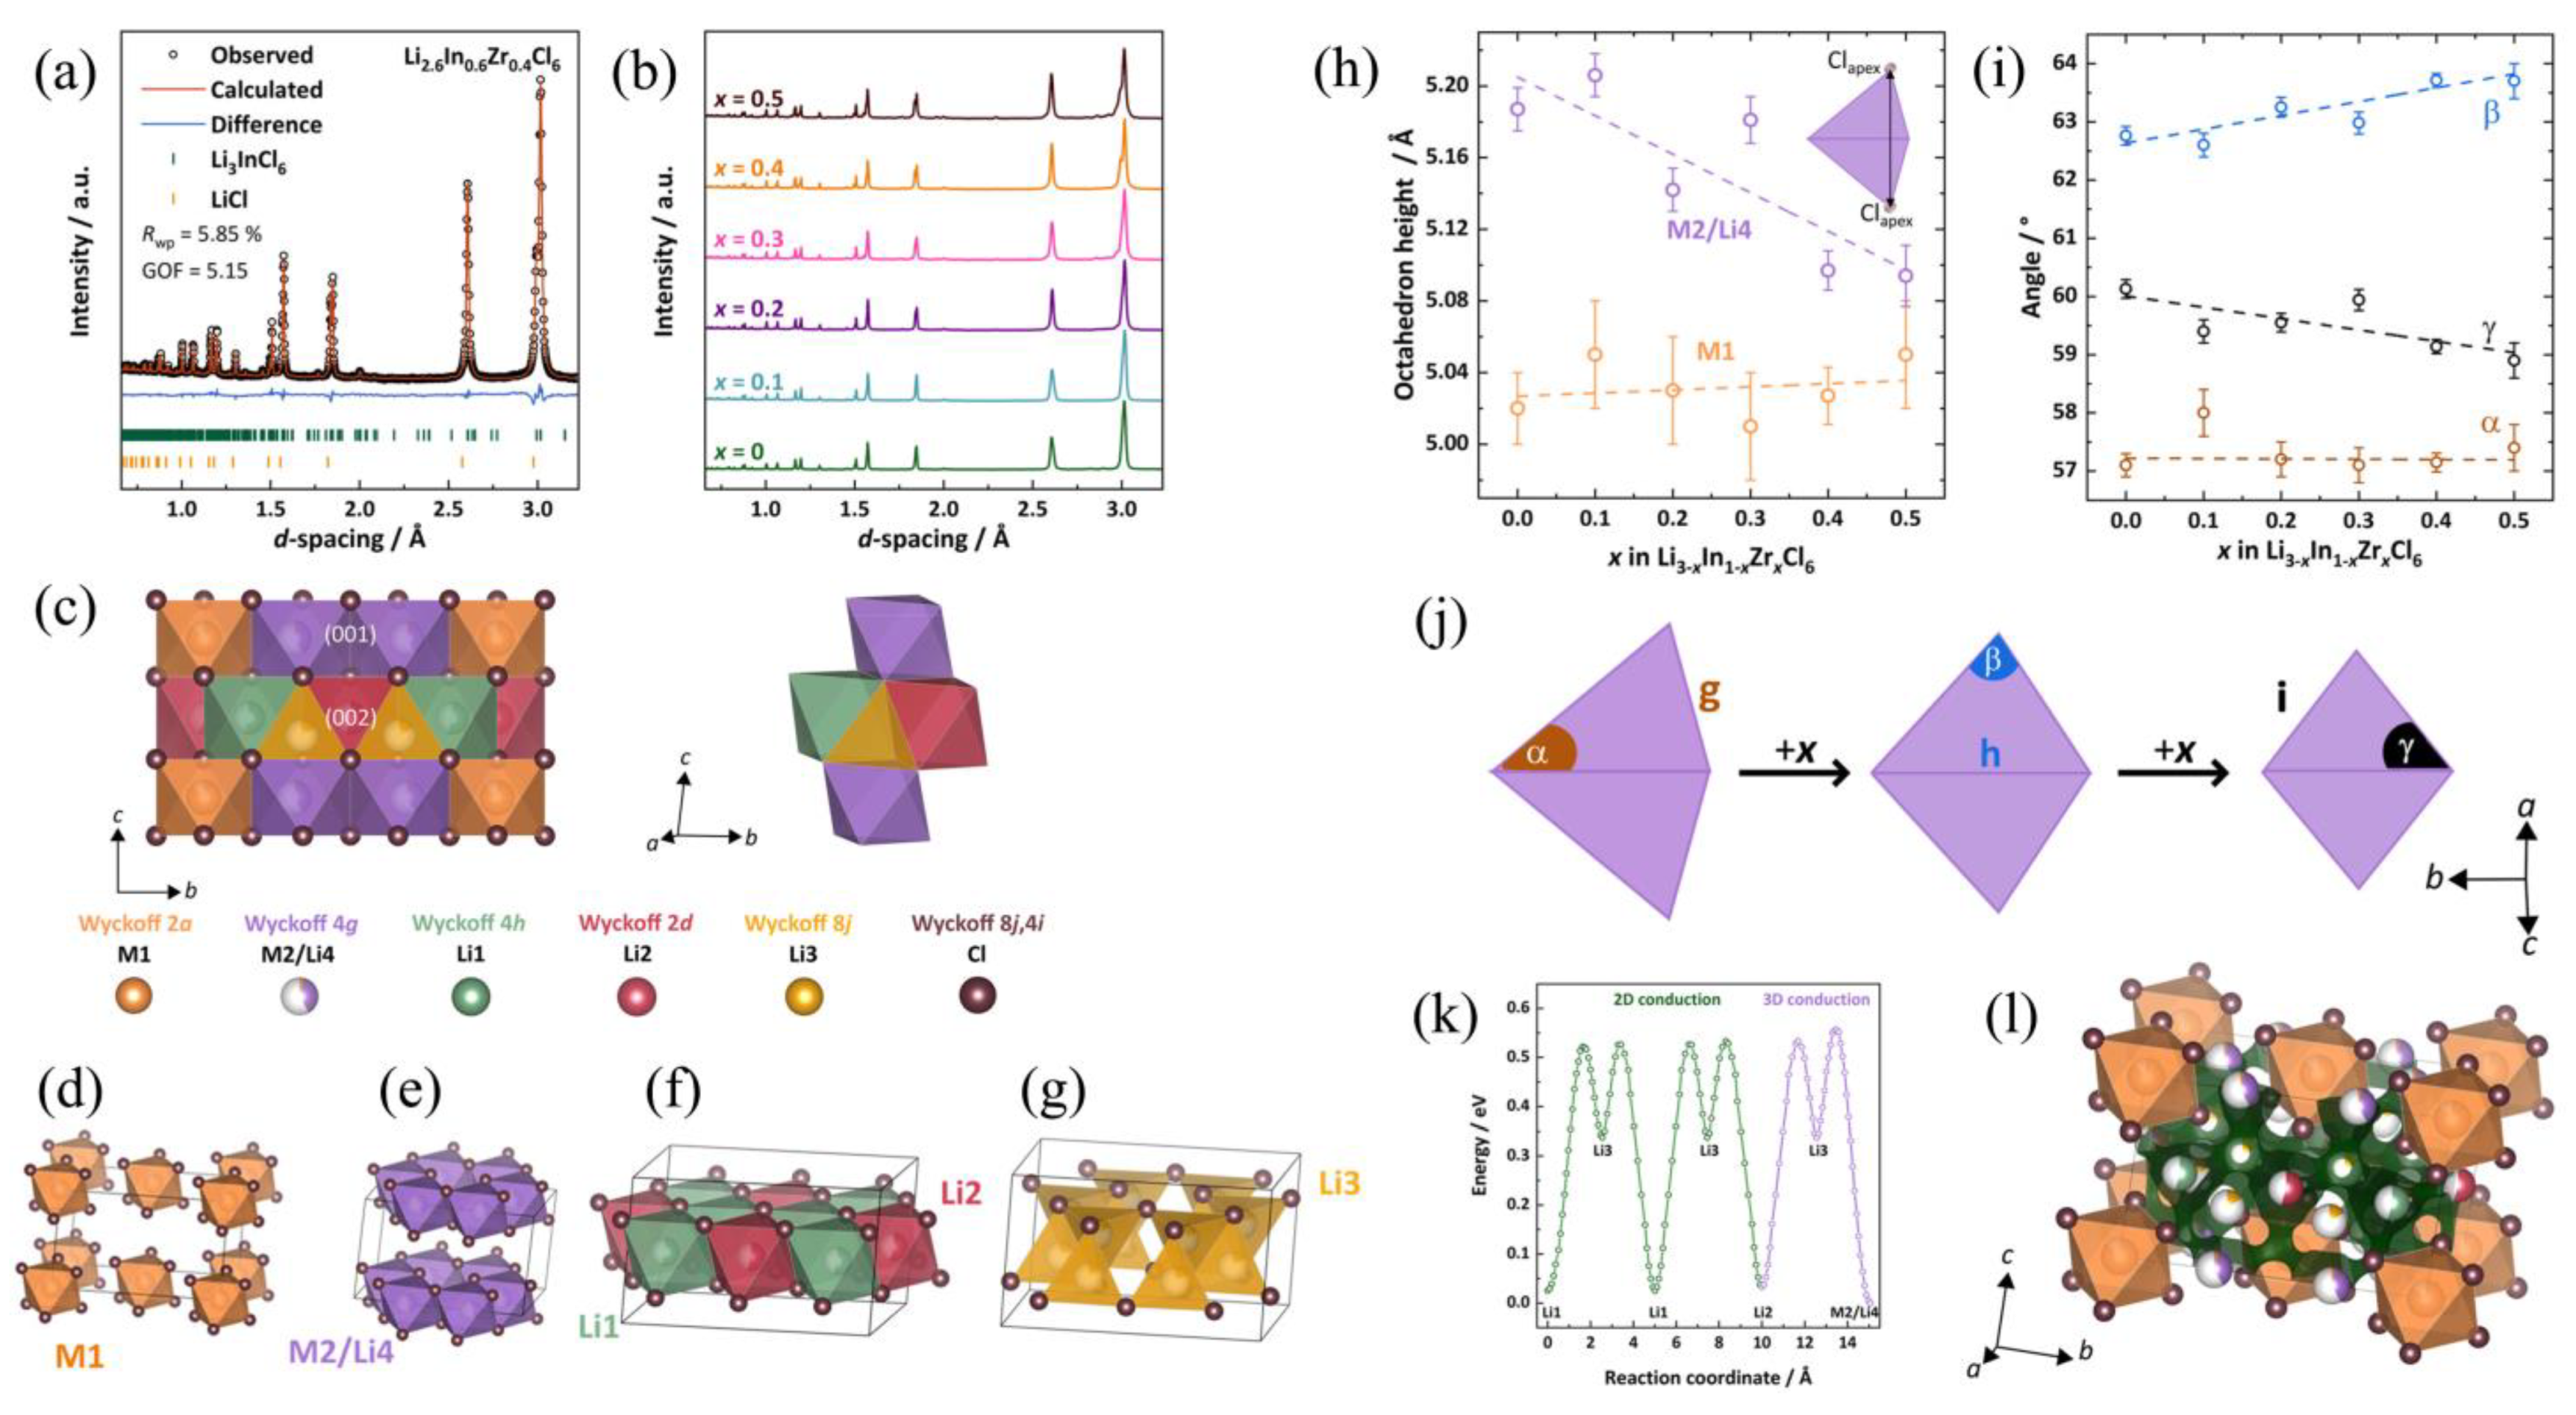
The indication of the existence of octahedral distortion is the lattice compression along the
c-axis. The NPD refinements on the Li
3−xIn
1−xZr
xCl
6 series as shown in
Figure 2a,b reveal that, as Zr increases, lattice parameters
a and
b are nearly unchanged, while
c decreases, possibly due to the smaller ionic radius of Zr
4+ than In
3+ ions [
33]. This represents a compression on the
c direction and lattice volume asymmetric shrinkage, which would act on Li/metal octahedra to undergo asymmetric distortion.
However, to further understand this distortion from atomic scale, structure determination based on NPD is very necessary. The crystallography is shown in
Figure 2c–g. The substituted Li
3−xIn
1−xZr
xCl
6 is isostructural to Li
3InCl
6. For a typical Li
3InCl
6, it adopts a monoclinic layered structure with space group
C2/
m. The (InCl
6)
3− octahedra are exclusively located within the (001) lattice plane (marked as M1 and M2/Li4 in
Figure 2d,e). In this (001) plane, most In
3+ ions occupy M1 isolated octahadral sites, while only a few of them occupy M2 honeycomb sites (occupancy 5–10%). Li
+ ions only occupy M2 sites (occupancy ~40%) to make M2/Li4 co-occupation (
Figure 2e). In the (002) plane, only (LiCl
6)
5− octahedra and (LiCl
4)
3− tetrahedra (occupancy ~17%) reside in this layer (marked as Li1, Li2, and Li3 in
Figure 2f,g).
The most intriguing factor with structure is that, with Zr
4+ substitution, In
3+ and Zr
4+ still prefer M1 positions with a few on the M2/Li4 position, while Li
+ ions would remarkably occupy a M2/Li4 position, together with a gradually decrease of occupancy on Li1, Li2 octahedral sites, and a total loss of occupancy on Li3 tetrahedral sites. The Li3 tetrahedral site is explained to be a higher-energy intermediate site [
16] that would be depopulated first when removing Li
+ from the system. (For charge balance, Li
+ will be removed as Zr
4+ increases.) These results represent a redistribution of Li
+ ions and a Li-In-Zr disorder on the M2/Li4 position, which may lead to a 3D diffusion pathway for facile Li
+ migration.
Bearing the above in mind, octahedral distortion can be discussed and its correlation with the Li sublattice can be unraveled. With Zr
4+ substitution, the octahedron height of the M2/Li4 site significantly decreases (
Figure 2h), while the M1 octahedron height keeps almost constant. These changes are the main reason for the
c-direction compression. In addition, the apex Cl
− approaches the center, accompanied by angle changes (
Figure 2i) that alter the degree of octahedral distortion (
Figure 2j). Since M2/Li4 sites are preferably occupied by Li
+ with Zr
4+ substitution, the primary driven force for this distortion should be lithium redistribution and disorder. Finally, BVSE [
36,
37] based on neutron data provides the 3D migration pathway (
Figure 2l) with its site energy profile (
Figure 2k).
The third [
42] and fourth [
41] works are both about rare-earth metal halides that mainly involve phase transition. It has been known that Li
3MCl
6 (M = Ln
3+) can crystallize in a trigonal (space group
P-3
m1), orthorhombic (space group
Pnma) and monoclinic (space group
C2/
m) structure. Different symmetric arrangements of cations and vacancies lead to a distinct Li
+ migration. Conventionally, Li
3MCl
6 (M = Tb, Dy, Ho, Er, Tm) crystallizes in a trigonal
P-3
m1 structure. However, Liang et al. [
42] modified the Li/M ratio to induce a phase transition from trigonal to orthorhombic structure and successfully achieved a series of orthorhombic Li
3−3xM
1+xCl
6 (−0.14 <
x ≤ 0.5, M = Dy, Ho, Y, Er, Tm) with enhanced ionic conductivity. Taking orthorhombic Li
3−3xHo
1+xCl
6 (0.04 <
x ≤ 0.2) as an instance, a tiny modification of the Li/Ho ratio (
x = 0.09) could boost the room-temperature ionic conductivity from 2.9 × 10
−4 S cm
−1 to 1.3 × 10
−3 S cm
−1. NPD refinement clearly confirmed the rearrangement of the cation and anion sublattice after phase transition, and an expansion in the triangular area of face-shared octahedra/tetrahedral. It is explained that such an expansion broadens the size of the bottleneck for a facile Li
+ diffusion along the
c-lattice direction. The diffusion in the c direction via face-sharing octahedral is faster than that in the
xy-plane via a face-sharing octa-tetra-octahedra path. Its activation energy is also reduced compared to that in the trigonal phase.
The above study can be seen as a typical example of isovalent self-substitution, in which its own rare-earth content was tuned to trigger Li vacancies and phase transition. Their success with orthorhombic Li
2.73Ho
1.09Cl
6 encouraged Zhou et al. [
41] to perform aliovalent substitution on the Li
3−xZr
xHo
1−xCl
6 and Li
3−xZr
xLu
1−xCl
6 series. Zr substitution is also beneficial in relieving the dependence on rare-earth elements and promoting scalable production. In their work, Zr
4+ substitution lifts the ionic conductivities up to ~1.8 mS cm
−1, and suppresses the activation energies down to ~0.34 eV. At cutoff potentials of both 4.3 and 4.6 V vs. Li
+/Li, their ASSB, comprised of Li
2.6Zr
0.4(Ho/Lu)
0.6Cl
6 SSE paired with LiNi
0.85Co
0.1Mn
0.05O
2 (NCM85), show stable cycling. Even upon 4.8 V, their ASSB still exhibits long-term stable cycling. When assembled with an Si or Li
0.7Si anode, NCM85 ASSBs with Li
2.6Zr
0.4Lu
0.6Cl
6 as the SSE still perform long-term stable cycling at a high areal capacity of 16 mAh cm
−2.
Pure Li
3HoCl
6 has a trigonal structure. Similar to the above mentioned Li
2.73Ho
1.09Cl
6 and Li
3−xZr
x(Y/Er)
1−xCl
6 [
24], the Zr
4+ substituted Li
3−xZr
xHo
1−xCl
6 (0.2 <
x ≤ 0.8) series transform from a trigonal to an orthorhombic-II structure (space group
Pnma). Li
3LuCl
6 itself is an orthorhombic-I structure (space group
Pnma), but Li
3−xZr
xLu
1−xCl
6 (0.2 ≤
x ≤ 0.8) also transform to the orthorhombic-II structure with (Lu/Zr)Cl
6 octahedra tilting. All solid solutions Li
3−xZr
x(Ho/Lu)
1−xCl
6 (0.2 ≤
x ≤ 0.6) exhibit superior conductivities (up to 1.8 mS cm
−1) compared to pristine Li
3HoCl
6 and Li
3LuCl
6 (~0.1 mS cm
−1).
NPD plays a key role in Li
3−xZr
x(Ho/Lu)
1−xCl
6 structure phase transition analysis and Li occupancy. In layers of the
ab-plane, trigonal Li
3HoCl
6 and orthorhombic-I Li
3LuCl
6 both possess honeycomb-ordered shared-edge Li
+ octahedra adjacent with their interstitial tetrahedral voids, which allow Li
+ ions to diffuse in the
ab-plane via the Oct–Tet–Oct pathway. Along the
c axis, the LiCl
6 octahedra are directly linked in a face-shared manner to establish a
c-direction Li
+ pathway. Similar to the above, substituted orthorhombic-II Li
2.4Zr
0.6(Lu/Ho)
0.4Cl
6 still maintains a honeycomb ordered layer but arranged on the
bc-plane. These layers have a stacking fault along the
a-axis that forms a zigzag chain of faced-shared or edge-shared LiCl
6 octahedra along the
a-axis, which allows Li
+ migration along this direction. All of these Li sites in the above structures are not fully occupied, leaving abundant Li vacancies in the diffusion pathway, as confirmed by BVSE calculation [
36,
37] based on NPD. From NPD refinements, Li
2.4Zr
0.6(Lu/Ho)
0.4Cl
6 possesses prominently more vacancies in its Li octahedral sites in honeycomb layers and zigzag chains compared to Li
3HoCl
6 and Li
3LuCl
6. This is the explanation for its higher conductivity triggered by phase transition.
3.2. Disorder and Blocking Effect
The disorder discussed here refers to Li+ disorder and metal cation disorder. Both of these are accompanied with vacancies. As we know, disorder is very common in solid structures, and also in metal halide SSEs. Even within the same anion sublattice, there could there be a remarkable difference in the disorder, according to the different type of cations. Since the structure provided by neutron/XRD refinements is actually a space-and-time-averaged one, the most common instance we can find of so-called disorder is the multiple crystallographic sites for Li+ and cations with different partial occupancies. The common way to induce disorder is to vary the components or valence of metal cations. The induced disorder will in turn promote the Li+ hopping in its pathway. The blocking effect means that the M cation on its position will yield a Coulombic repulsion to Li+ migration. Therefore, the Li+ diffusion via the interstitial tetrahedral site surrounding the M cation is to some extent blocked. Tuning or decreasing the M contents to relieve the blocking effect is plausible for better ionic conductivity.
Utilizing disorder strategies, Zhou et al. [
29] construct a Li
+ and cation disordered halo-spinel chloride Li
2Sc
2/3Cl
4 with superionic conductivity as high as 1.5 mS cm
−1 that has far surpassed other spinel-type halides Li
2MgCl
4, Li
2ZnCl
4 (<10
−3 mS cm
−1 at room temperature) [
45,
46], and most halides including Li
3InCl
6, Li
3YCl
6, Li
3ErCl
6, and Li
3−xM
1−xZr
xCl
6 (M = Er, Y) (0.31–1.49 mS cm
−1) [
21,
24]. Such superior ionic conductivity was ascribed to the significant Li-site disorder, which creates a redistribution of Li
+ ions that brings about new Li sites (marked as Li2 and Li3). These new interstitial Li sites serve as intermediate sites residing on the pathway that are critical for Li
+ ion diffusion.
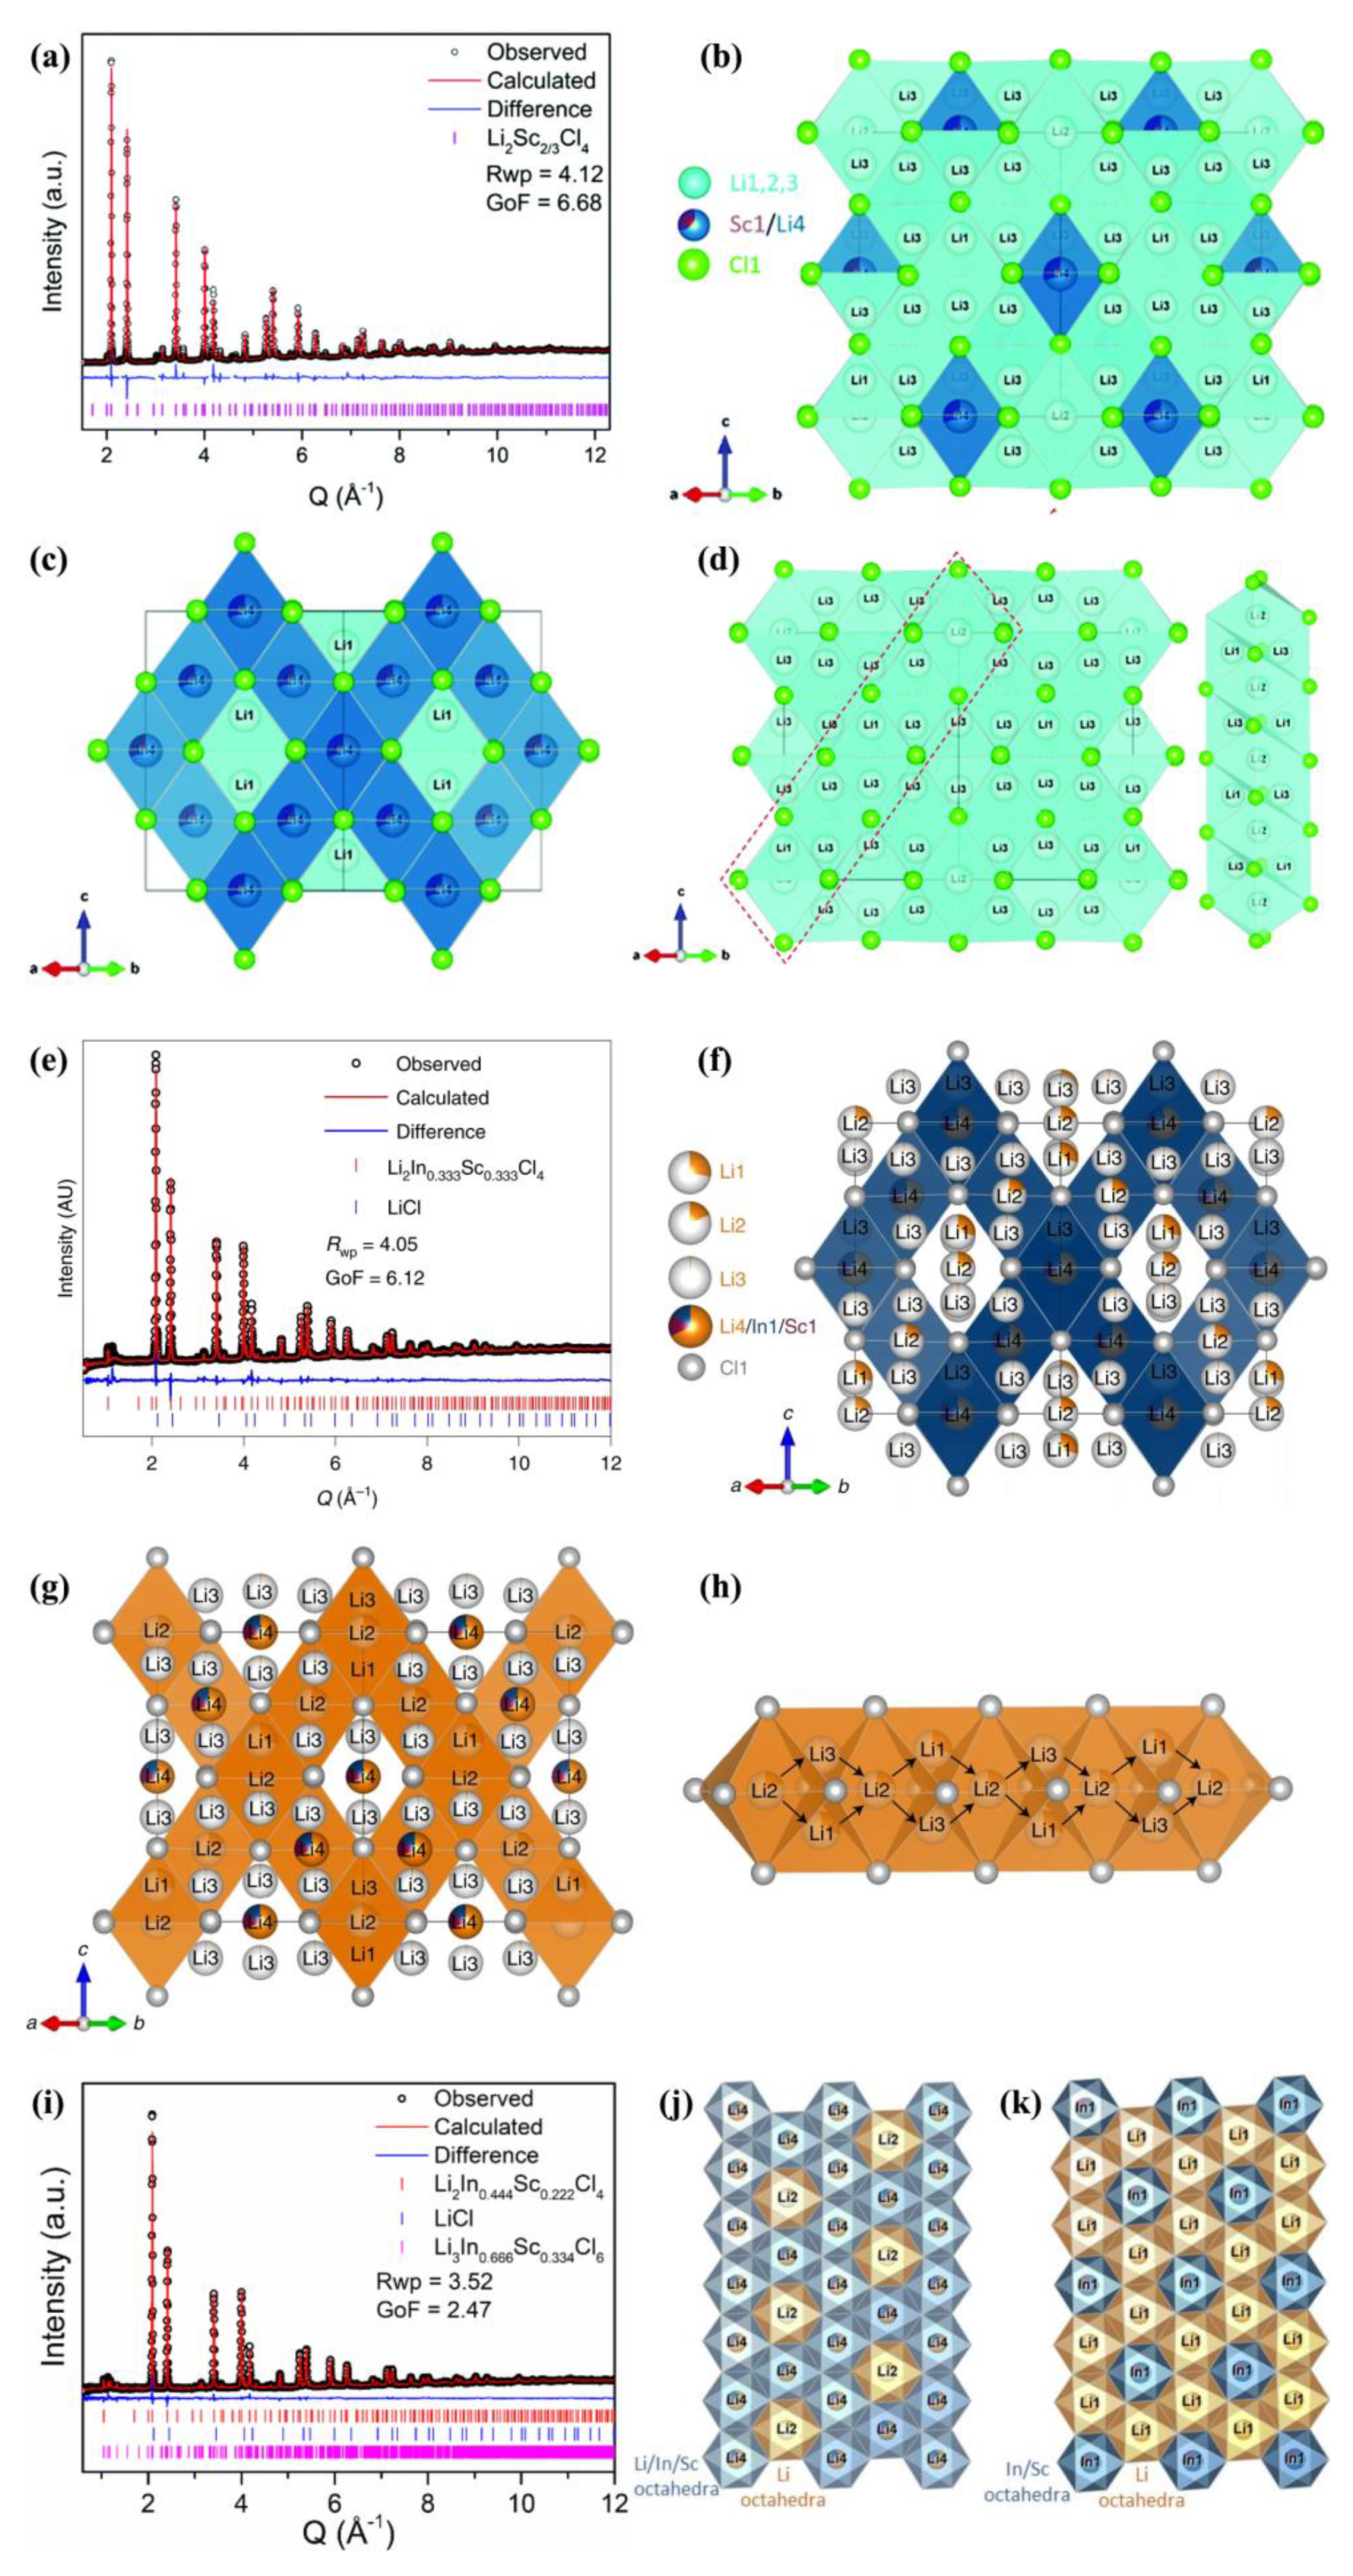
Above explanation is actually based on time-of-flight (TOF) NPD refinements that exactly determine Li
+ distribution and occupancy on each crystallographic site. As shown in
Figure 3a, the neutron pattern is well refined by the Li
2Sc
2/3Cl
4 spinel structure with cubic space group
Fd-3
m. The crystal structure of spinel Li
2Sc
2/3Cl
4 are shown in
Figure 3b,c. The framework of Li
2Sc
2/3Cl
4 is somewhat similar to spinel Li
2MgCl
4, but the atomic occupancies are quite different. Li
2Sc
2/3Cl
4 possesses four Li sites: Li2 and Li3 are newly discovered positions while Li1 and Li4 are original positions similar to Li
2MgCl
4. The conventional spinel Li
2MgCl
4 is constituted of edge-shared Mg1 and Li2 octahedra where both Mg and Li take a half occupation, and Li1 fills the corner-sharing Li1 tetrahedra site (Li1 coordinates: 1/8, 1/8, 1/8). However, in Li
2Sc
2/3Cl
4, its edge-shared Sc1 and Li4 octahedra have a Sc:Li4 occupation ratio of 0.311:0.689, which means that more Sc ions are substituted by Li ions. While Li1 also take the same position of tetrahedra sites (similar to Li
2MgCl
4), its new Li2 fills the edge-sharing Li2 octahedra site, and its new Li3 occupy another edge-sharing tetrahedra site.
The most striking point is that the wide spread of new Li2 and Li3 over the whole lattice links the Li1 tetrahedra, Li2 octahedra, and Li3 tetrahedra all together in series in a face-shared manner that forms an infinite pathway for Li
+ diffusion in Li
2Sc
2/3Cl
4 (
Figure 3d). This new pathway plays the decisive role in the ionic conductivity enhancement. In this new pathway, the relatively low occupancies of the Li1,2,3 sites have provided abundant vacancies which would help to skip the defect formation step during Li+ ion migration. Moreover, the Li
+ redistribution over tetrahedra and octahedra sites also indicates that the Li
+ site energies on the sites are probably similar, that is, a flat energy landscape for facile ion diffusion [
47,
48].
A blocking effect may reside on the Sc1/Li4 octahedra site, as reflected by NPD refinements that the thermal displacement parameter of Li4 on this octahedral site is very low. Although Sc1/Li4 octahedra also border Li3 tetrahedra in a face-shared manner, trivalent Sc
3+ ions still sit in this octahedra site that may block Li
+ ion diffusion, as Mg
2+ does in Li
2MgCl
4 [
49]. Hence, Li
+ ions on this site appear to show small thermal displacements and low mobility. Therefore, the main diffusion pathway may not involve Sc1/Li4 octahedra sites. Overall, these new possible Li1,2,3 diffusion pathways with considerable amounts of vacancies achieve a relatively low activation energy for Li
+ hopping. In a battery test, Li
2Sc
2/3Cl
4 also shows excellent performance in a potential window up to 4.6 V due to its high oxidative stability, when assembled with uncoated LiCoO
2 (LCO), LiNi
0.6Mn
0.2Co
0.2O
2 (NCM622) and high-Ni LiNi
0.85Mn
0.1Co
0.05O
2 (NCM85) cathodes.
It would be very meaningful to induce a higher extent of disorder into Li
2Sc
2/3Cl
4 to further improve ionic conductivity, along with good stability against electrodes. Zhou et al. [
50] continued their research and developed an isovalent In
3+ substituted Li
2In
xSc
0.666−xCl
4 (0 <
x < 0.666) system as a fast Li ion conducting chloride SSE, which exhibits an improved ionic conductivity up to 2.0 mS cm
−1 (Li
2Sc
2/3Cl
4 is 1.5 mS cm
−1). According to their report, incorporating only 10 wt% Li
2In
1/3Sc
1/3Cl
4 with cathode active material (CAM, typical 4V, LiCoO
2, LiNi
1−x−yCo
xMn
yO
2) [
11] could form a cathode composite with a low-impedance SE/CAM interface that enables excellent electrochemical performance. All-solid-state Li batteries (ASSBs) utilizing uncoated LCO, NCM622 and NCM85 could exhibit a superior rate capability and apparently more stable long-term cycling up to 4.8 V versus Li
+/Li, compared with most advancing ASSBs. Their high-voltage, high-loading and ultra-stable solid-state cells indeed provide inspiration for the design of advancing ASSBs.
In this Li
2In
xSc
0.666−xCl
4 series, a highly disordered Li
+ distribution was observed. It was then concluded that such disorder brought about a lattice with metastable intermediate Li
+ sites that enable a fast Li
+ diffusion and rate capability. The phase of Li
2In
xSc
0.666−xCl
4 series can be varied according to In
3+ x contents. When
x is between 0~0.444, the obtained Li
2In
xSc
0.666−xCl
4 is a cubic spinel phase with little impurity, as illustrated in
Figure 3e, exampled with spinel Li
2In
1/3Sc
1/3Cl
4. However, when
x content goes higher, typically ≥ 0.555, the fractions of monoclinic Li
3MCl
6-typed phase and LiCl impurities begin to increase, as illustrated in
Figure 3i, exampled with spinel Li
2In
0.444Sc
0.222Cl
4 and Li
3ScCl
6-typed Li
3In
2/3Sc
1/3Cl
6. The structure of Li
2In
1/3Sc
1/3Cl
4 (
Figure 3f) is similar to the halo-spinel Li
2Sc
2/3Cl
4 [
29] mentioned before, and also contains four Li
+ sites (with two new sites) per unit cell, though with different occupancies. From
Figure 3f,g, one can readily see the significant Li
+ disorder as metastable intermediate Li sites that are supposed to benefit Li-ion mobility and fast rate capability. The face-shared Li2 octahedra and Li1 or Li3 tetrahedra with relatively low occupancies (~0.2–0.3) construct a 3D Li
+ migration pathway (
Figure 3g,h). Benefiting from a relatively low activation energy (0.33 eV simulated from EIS measurements) for Li
+ diffusion, and 3D migration pathways (from BVSE calculation based on NPD Rietveld refinements) with considerable amounts of site vacancies (i.e., disorder, based on NPD Rietveld refinements), a high ionic conductivity of 2.0 mS cm
−1 was finally achieved. As for Li
3ScCl
6-typed monoclinic phase Li
3In
2/3Sc
1/3Cl
6 (
Figure 3i), its main diffraction peaks overlapped with that of spinel Li
2In
0.444Sc
0.222Cl
4. One difference between the spinel Li
2In
0.444Sc
0.222Cl
4 and monoclinic Li
3In
2/3Sc
1/3Cl
6 is that, in spinel Li
2In
0.444Sc
0.222Cl
4 its Li4/Sc1/In1 metal sites are all shared (
Figure 3j), but in monoclinic Li
3In
2/3Sc
1/3Cl
6 its Li1 sites and Sc1/In1 metal sites are all crystallographically distinct, that is, ordered (
Figure 3k). In one word, this work can be seen as an intuitive illustration of how metal contents switch the cation arrangements between order and disorder.
Figure 3.
(
a) Time-of-flight NPD Rietveld refinement on Li
2Sc
2/3Cl
4. (
b) Structure of disordered spinel Li
2Sc
2/3Cl
4. (
c) Structure without showing Li2 octahedra and Li3 tetrahedra. One can see that it basically has a Li
2MgCl
4-typed structure framework but with different site occupancies. (
d) Li
+ diffusion pathway of Li
2Sc
2/3Cl
4 along the face-shared Li1, Li3 tetrahedra and Li2 octahedra; right inset is the expansion of the red dot area illustrating a potential diffusion pathway through Li2 octahedra and Li1, Li3 tetrahedra. Reproduced with permission: Copyright 2020, Royal Society of Chemistry [
29]. (
e) TOF NPD Rietveld refinement of Li
2In
1/3Sc
1/3Cl
4. (
f) Structure of Li
2In
1/3Sc
1/3Cl
4 viewed as only Li4/In1/Sc1 octahedral framework. (
g) Li
+ diffusion pathway via face-shared Li1 tetrahedra and Li2 octahedra. (
h) Enlarged Li
+ diffusion pathway through Li2 octahedra and adjacent Li1 or Li3 tetrahedra. (
i) NPD Rietveld refinements with spinel Li
2In
0.444Sc
0.222Cl
4 and monoclinic Li
3In
0.666Sc
0.334Cl
6. (
j) Illustration of spinel structure in which Sc/In/Li sites are all shared. (
k) Illustration of monoclinic structure in which In/Sc and Li sites are distinct. Reproduced with permission: Copyright 2022, Springer Nature [
50].
![Batteries 09 00510 g003]()
3.3. Dual-Halogen and Lattice Dynamics
Tuning halogen anions in halides (F
−, Cl
−, Br
−, I
−) or introducing dual-halogen mixing can be an effective way to lower the Li
+ migration barrier, and improve moisture tolerance and electrode compatibility. In fact, this strategy of anion modulation involves changes on the polarizability of anions and the lattice. The host lattice polarizability can affect the lattice vibration strength (that is, lattice dynamics) and correspondingly the Li
+ mobility kinetics, which has been rationalized by the Arrhenius equation [
51] in which the activation barrier and prefactor are modulated. According to Wakamura et al.’s [
52] study, low activation energies of Li
+ migration correspond to “low-energy” phonon frequencies (that is, low lithium vibration frequency) and a high frequency dielectric constant. From this perspective, a softer and more polarizable anion sublattice much favors a facile ionic transport. The polarizability of different metal cations and anions is shown in
Table 1. It can be found that F
− has the lowest polarizability, and fluorides often exhibit low ionic conductivity (less than 10
−5 S cm
−1). Bromide and iodide generally show higher polarizability than chloride, and hence higher ionic conductivity has been observed [
21,
53,
54]. In one word, halogens with higher polarizability are expected to facilitate Li migration.
Bearing this in mind, Liu et al. [
55] utilized bromide with higher polarizability to make an anion-mixed halide Li
3Y(Br
3Cl
3) via the hot-pressing method to promote conductivity, along with optimization on the grain boundary. Conventionally, Li
3Cl
6 yields the trigonal phase while Li
3YBr
6 yields the monoclinic phase. The ball-milled Li
3Y(Br
3Cl
3) was initially a mixture of Li
3YCl
6 and Li
3YBr
6. However, after hot-pressing, the Li
3Y(Br
3Cl
3) mixture transformed into a single Li
3YBr
6-type monoclinic phase and then reached a strikingly high conductivity of 7.2 mS cm
−1 (room-temperature). The author then ascribes this to the high occupancy of tetrahedral Li sites and the optimized contact between grain boundaries that resulted from the hot-pressing method.
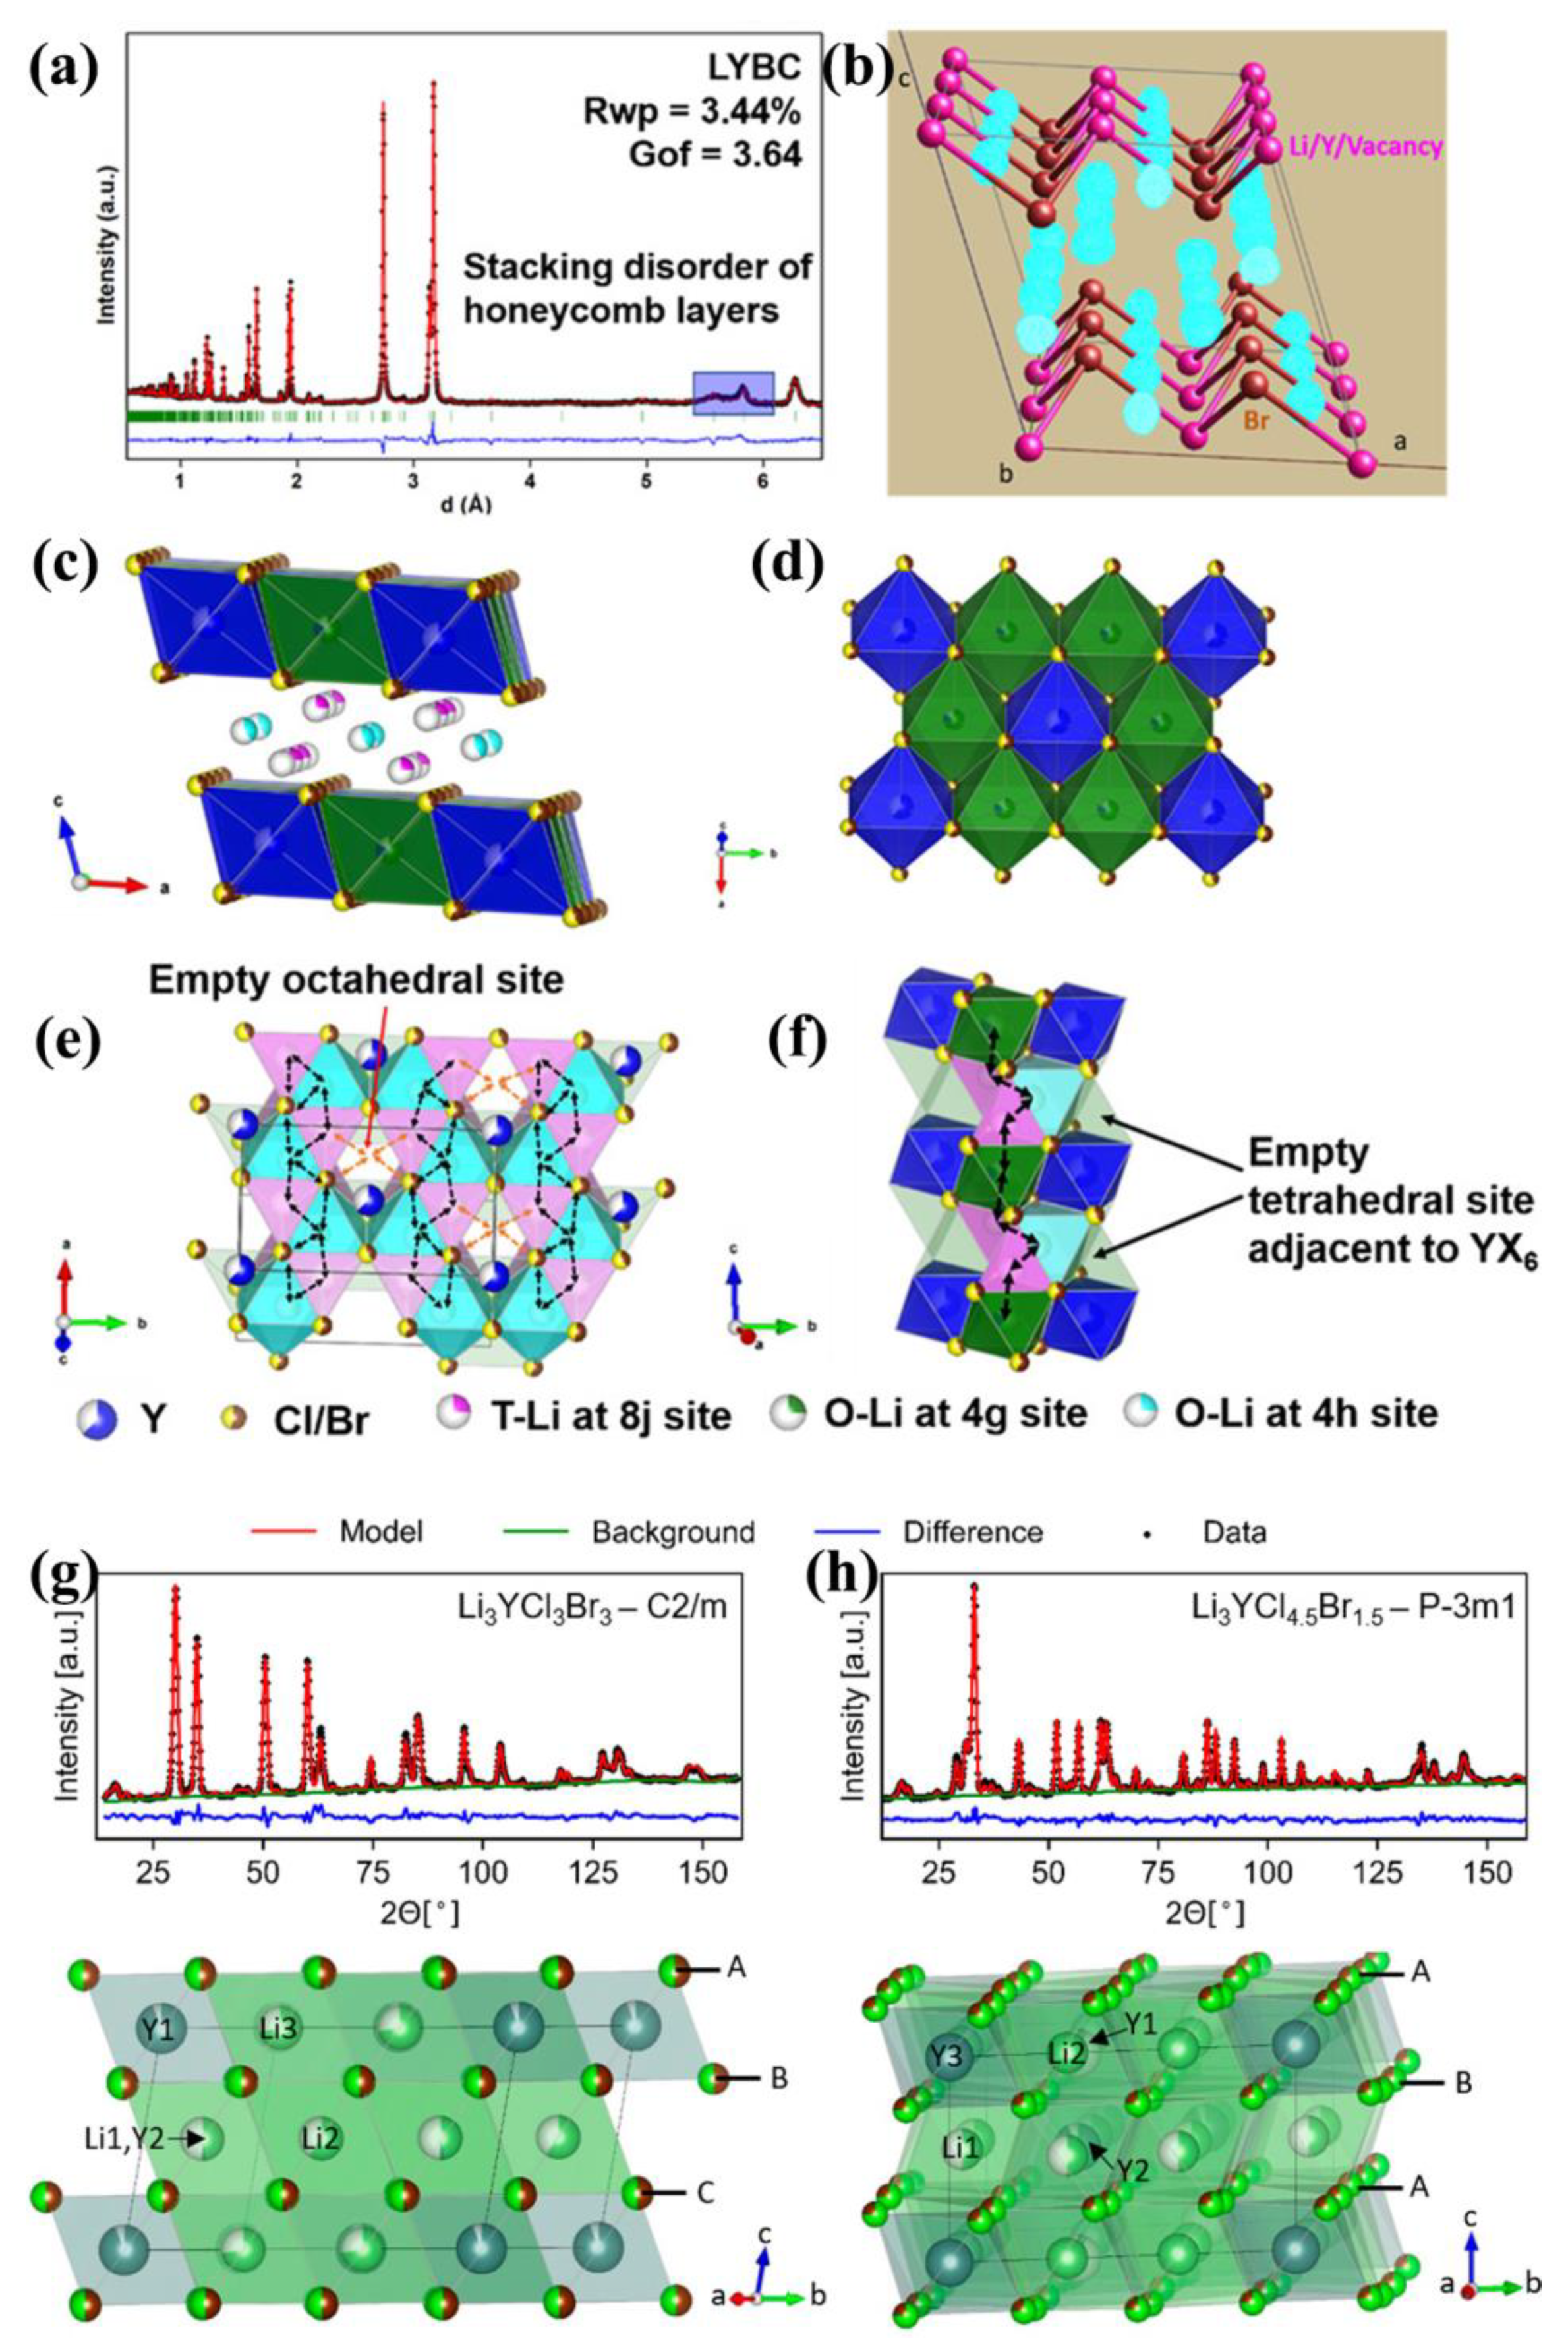
NPD refinement (
Figure 4a) clearly confirmed the whole structure and the significant amounts of additional tetrahedral Li sites (cyan sphere in
Figure 4b) in the lattice. The refinement was completed on the basis of the Li
3YBr
6 structure model with half of the Br replaced by Cl. The whole structure consists of a transition metal chloride layer and lithium chloride layer (
Figure 4c). In the metal chloride layer, Li
+ ions partially occupy the Y
3+ ions’ position to form a honeycomb-type local ordering of YX
6 and LiX
6 (X = Br and Cl) octahedra (
Figure 4d), along with some vacancies on both sites. This honeycomb ordering has been mentioned above [
40,
41], and is also similar to Li-Mn rich cathode materials [
56]. Moreover, a stacking faults along the
c-axis could be confirmed by NPD refinements on 5.5~6 A data, representing a long-range disorder of the honeycomb’s location along the
c-axis, which is also observed in layered oxide Na(Ni
2/3Sb
1/3)O
2 [
57].
The above-mentioned tetrahedral Li sites are actually located by an NPD Difference Fourier map (cyan sphere in
Figure 4b). We have mentioned this Difference Fourier procedure in
Section 2.3; it is very effective in locating residue density which probably represents missing Li
+ ions. Four different tetrahedral sites (pink sphere in
Figure 4c,e,f), with two sites in the lithium layer and the other two in the transition metal layer, were successfully located using this procedure. They were found to coexist with Li
+ octahedral sites in their lithium chloride layer. However, the author mentioned that the residual densities on these sites probably result from the presence of stacking faults along the
c-axis, and some of them are very likely to be empty tetrahedral sites due to repulsion from Y
3+ ions [
16,
21] (
Figure 4e,f). Through BVSE calculation [
36,
37], the author proposed that the presence of these tetrahedral Li
+ sites (marked as “T-Li at 8j site”) depopulates the octahedral Li
+ occupancies (that is, creates more vacancies); in which case, it brings about a more flat energy landscape for a concerted Li
+ diffusion. Such Li
+ distribution enables an octahedra–tetrahedra–octahedra (O-T-O) Li
+ hopping chain along the
a-direction, which is then connected by octahedral sites (
2d) to form a 2D diffusion network in the
ab-plane (
Figure 4e). Along the
c-direction, hopping along an “O-T-O-T” zigzag route nearby Y
3+ sites is allowed, which fulfills a 3D diffusion pathway (
Figure 4f). In a word, tetrahedral Li
+ lowers the diffusion activation energy in the
ab-plane and promotes O-T-O-T zigzag diffusion along the
c-direction.
In addition, the low resistance grain boundaries as formed during hot-pressing are also beneficial to conductivity enhancements. Such boundaries are proposed to originate from partial melting during the hot-pressing process, and the formation of fused grain boundaries might be relevant to the eutectic melting of multiple halide components. This study indicates that these anion-mixed halides have higher than expected potential as promising SSEs. Their easy-forming fused grain boundaries are quite advantageous in large scale fabrication.
However, the incorporations Br and I would lower the oxidation stability according to thermodynamic calculation. Therefore, one needs to carefully consider the trade-off between high ionic conductivity and good stability, and try to balance these two by delicately controlling the ratio of halogens. Bearing this in mind, Maas et al. [
58] delicately designed the Cl/Br ratio in a Li
3YBr
xCl
6−x system and successfully realized the above. They found that Br
−-rich halides are more conductive (5.36 × 10
−3 S/cm at 30 °C for Li
3YBr
4.5Cl
1.5) but less oxidative stable (∼3 V) compared to Li
3YCl
6 (~3.5 V). Thus, they introduced only a small quantity of Br
− in the halide, that is Li
3YBr
1.5Cl
4.5, to keep its oxidative stability unaffected but make its ionic conductivity substantially improved (2.1 × 10
−3 S/cm at 30 °C), compared to pristine Li
3YCl
6 (0.049 × 10
−3 S/cm at 30 °C). Neutron diffraction refinement (
Figure 4g,h) revealed that as Br contents increase, a phase transition happens, from the
P-3
m1 trigonal phase of Li
3YBr
xCl
6−x at
x = 0, 1.5 with hexagonal close-packing (hcp) lattice, to monoclinic
C2/
m phase of Li
3YBr
xCl
6−x at
x = 3, 4.5, 6 with a cubic close-packing (ccp) lattice. In all series, Br and Cl were randomly distributed on halogen sites. This study highlights that appropriate modulation of halogen substituents in the anion framework to optimize the balance between conductivity and stability is reasonable and feasible.
Figure 4.
(
a) NPD Rietveld refinement of hot-pressed Li
3Y(Br
3Cl
3). Black dots are observed data, red lines are simulated data. (
b) Fourier difference map based on NPD Rietveld refinements of hot-pressed Li
3Y(Br
3Cl
3). The light-blue spheres represent the tetrahedral Li sites. (
c,
d) Monoclinic structure of hot-pressed Li
3Y(Br
3Cl
3) shown in different directions. (
e,
f) Li
+ diffusion pathways depicted by black and red arrows in
ab-plane and along
c-direction. Reproduced with permission: Copyright 2020, American Chemical Society [
55]. (
g,
h) Neutron powder diffraction of monoclinic and trigonal phase. Their corresponding structure are shown below. Reproduced with permission: Copyright 2022, Royal Society of Chemistry [
58].
Regardless of oxidative stability, using iodine to yield the possibly largest polarizability in a halide lattice would provide a good chance for studying lattice polarizability effects. Schlem et al. [
54] report the first experimentally obtained iodine-based halide superconductor Li
3ErI
6, of which the Li
+ ionic conductivity is close to 1 mS cm
−1. In their work, Iodine (I) was adopted as a more-polarization anion to make a softer lattice of Li
3ErI
6 compared to Li
3ErCl
6. Using NPD, they performed a thorough investigation of the highly polarized lattice and the transport mechanism. Through their investigation of the Debye frequency of the lattice and impedance spectroscopy, they corroborated that improved ionic transport results from the iodide anion induced softer and more polarizable framework. Their results demonstrate that the idea of softer lattices also holds up in this class of materials.
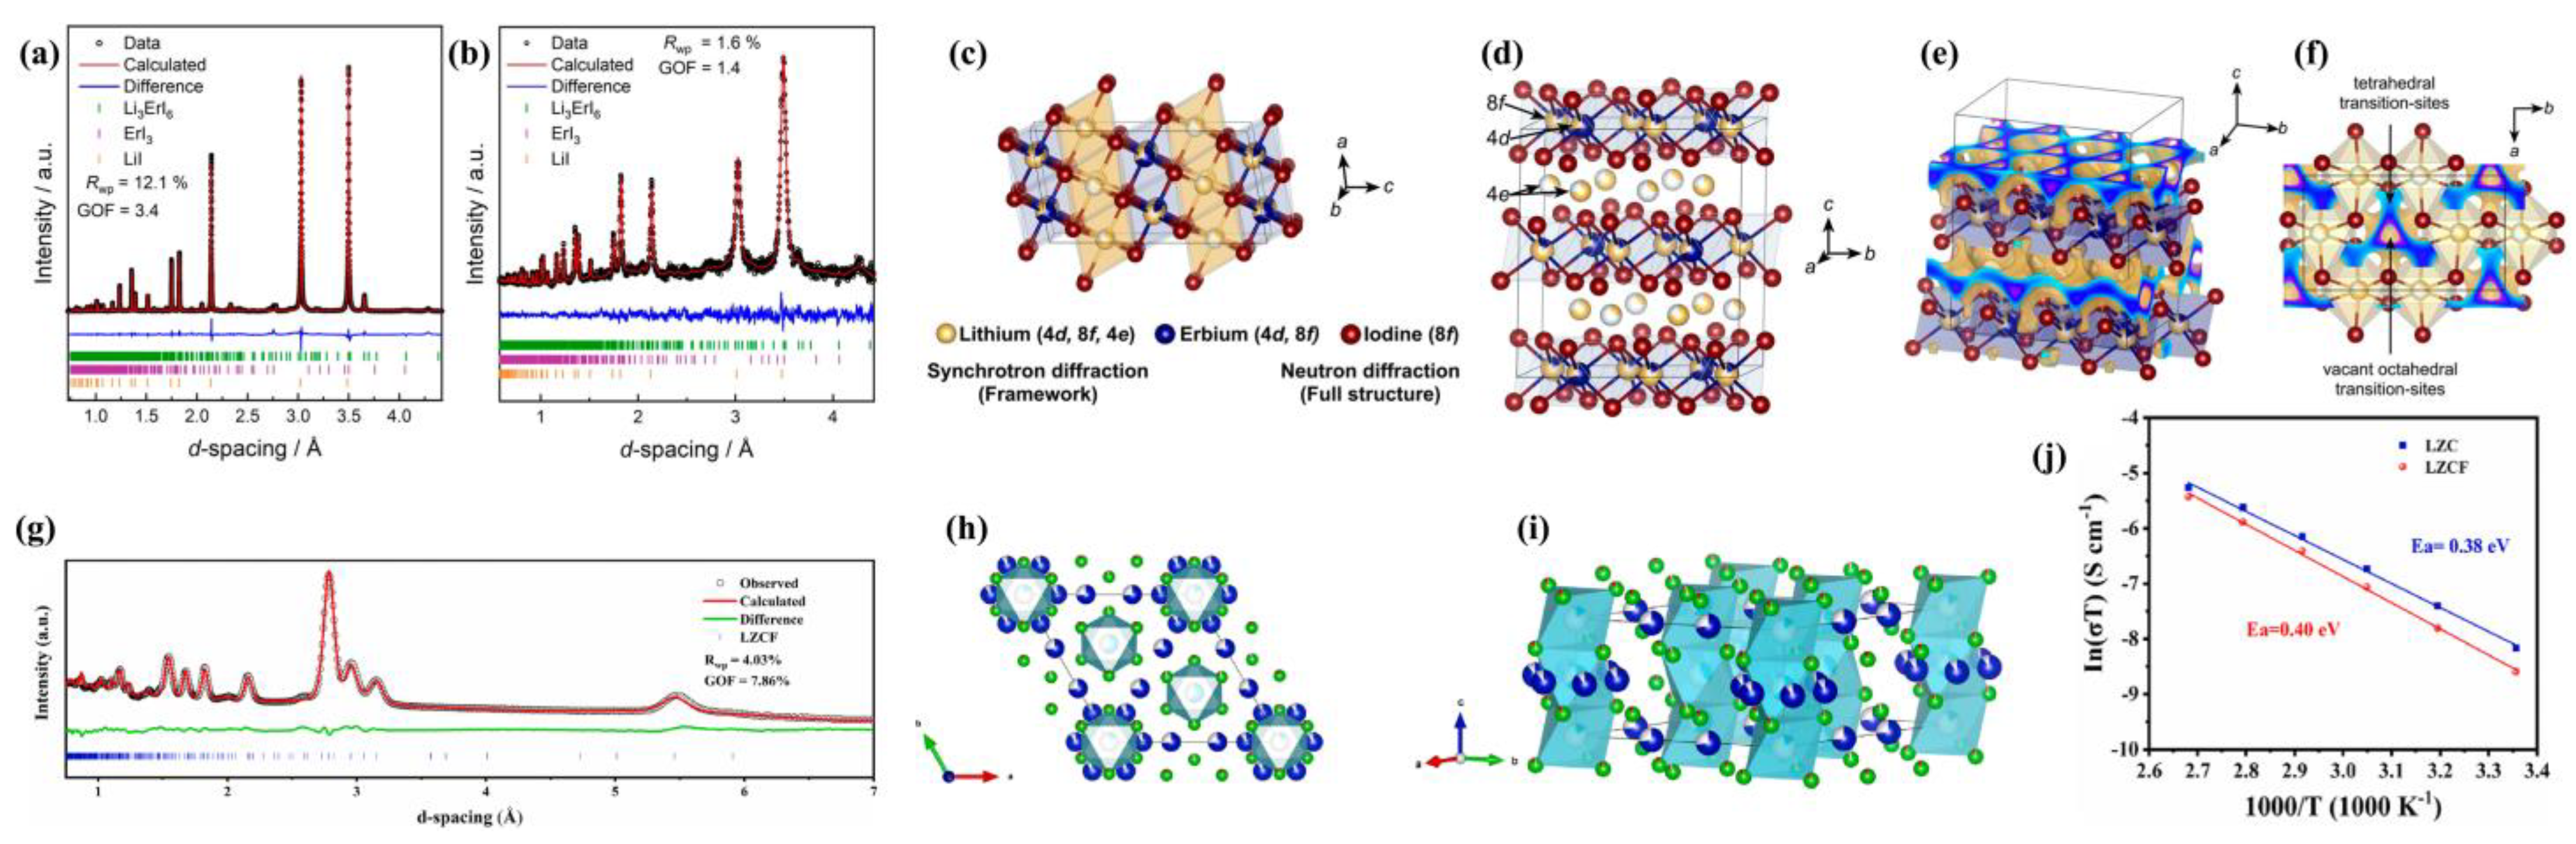
Refinements on NPD and Synchrotron diffraction data are shown in
Figure 5a,b. Li
3ErI
6 resembles a new monoclinic structure (space group
C2/
c). Synchrotron diffraction data was firstly refined to identify the lattice parameters, space group, Er
3+, I
− ion positions and their thermal displacements. Later, NPD was refined to determine the coordinates and thermal displacements of Li
+. The final structure (
Figure 5c,d) consists of isolated layers of edge-shared ErI
63− octahedra, with LiI
65− octahedra interlayers between them. Er
3+ partially occupies two different Wyckoff positions (8
f, 4
d) with remarkably different occupancies, which can be seen as a rare-earth cation disorder. Interestingly, the Li
+ ions also occupy these partially vacant Er
3+ sites, resulting in a Li
+-Er
3+ disorder within these layers. Essentially, the structure can be seen as alternating layers of Er/Li co-occupied edge-shared [Er
xLi
(1−x)I
6(5−2x)−] octahedra (on Wyckoff 8
f, 4
d sites) and edge-sharing [LiI
65−] octahedra (on Wyckoff 4e sites). In addition, through BVSE calculation [
36,
37] a two-dimensional Li
+ diffusion pathway in the
ab plane has been revealed (
Figure 5e,f). The beige isosurface corresponds to the possible Li
+ residence representing diffusion pathway. The blue section of this isosurface in the
ab-plane is to show the interconnectivity of Li
+ residence. Note that the interstitial tetrahedral voids and vacant octahedral sites (
Figure 5f) could both serve as transition-sites for Li
+ diffusion.
Incorporating I
− anion could soften the lattice and decrease the entropy of migration, which is correlated with the activation barrier as rationalized by the Arrhenius prefactor of the ionic conductivity [
59]. The author conducted speed of sound measurements and found that from Li
3ErCl
6 (for comparison) to Li
3ErI
6, the longitudinal, transverse, mean speed, and calculated Debye frequencies, all decrease. Such a decline reflects the weakening in average bond strength and increase in bond length. Hence, the iodide anions indeed bring a softer anionic framework in Li
3ErI
6. Li3ErI
6 shows a lower prefactor
σ0, lower activation barriers
Ea and higher room-temperature conductivity
σRT as a function of Debye frequency.
Finally, fluorine substitution was also reported by Tang et al. [
60]. They successfully fabricated a dual-halogen trigonal Li
2ZrCl
6−xF
x. Admittedly, among all halogens, fluorine has the least polarizability and strongest electronegativity, leading to inferior conductivity. However, a fluorine substitution strategy has been proposed to inhibit interfacial reaction against electrodes and moisture corrosion owing to its strong electronegativity [
61,
62]. Therefore, similar to the above-mentioned Cl-Br mixing [
58], a trade-off between conductivity and stability has been investigated by Tang et al. [
60] in their Li
2ZrCl
6−xF
x system.
Dual-halogen trigonal Li
2ZrCl
6−xF
x systems have considerable moisture stability and excellent electrode compatibility. In their optimal Li
2ZrCl
6−xF
x (
x = 0.4), there are three crystallographic Cl
− sites, and the F
− occupancies on these three sites are a little different: that is 7.9%, 8.5% and 4.8% on the Cl1 (6i), Cl2 (6i) and Cl3 (6i) sites, respectively, as confirmed by NPD refinements shown in
Figure 5g. The refined structure is shown in
Figure 5h,i, in which Li
2ZrCl
6−xF
x (
x = 0.4) adopts a trigonal hcp anion stacking, forming [LiX
6] and [ZrX
6] (X = Cl, F) octahedral with vacancies. There are two Li sites along the
c-direction, one occupies about 3/4 of the Li1 layer on (001) planes, and the other one almost fully occupies the Li2 layer on (002) planes. Each ZrX
63− octahedron is surrounded and connected by six LiX
65− octahedra in an edge-shared manner that forms a honeycomb arrangement in the
ab-plane.
However, since the F-Li bond is stronger and its bond length is shorter than Cl-Li, F substitution will cause Li
+ octahedra distortion along with lattice contraction, which would reversibly increase the Li
+ migration energy barrier and decrease ionic conductivity. Therefore, the fluorine contents have to be carefully controlled and the best one is Li
2ZrCl
6−xF
x (
x = 0.4), which retains an ionic conductivity of 3.21 × 10
−4 S cm
−1 that is very close to non-fluorine Li
2ZrCl
6 (
Figure 5j). Moreover, Li
2ZrCl
6−xF
x can be applied to protective-layer-free ASSLBs with a lithium alloy anode and high-voltage cathode LiCoO
2. These cells were reported to have an initial coulombic efficiency as high as 95.57%, and to be able to reversibly cycle in a wide potential window from 2.52 to 4.32 V (versus Li
+/Li). The author concluded that a self-passivating behavior of Li
2ZrCl
6−xF
x SSE occurring on its contacting surface against the Li alloy anode was found to be responsible for its interfacial stabilization. The thin solid-electrolyte interphase (SEI) layers containing LiCl and LiF as a passivating layer would prevent Li
2ZrCl
6−xF
x from decomposition by limiting its electron transfer, but it still allows facile Li
+ transport. In addition, the stronger stability against moisture in LZCF could originate from robust Li-F and Zr-F bonds due to more electronegativity of F
−.
Figure 5.
Rietveld refinements on (
a) synchrotron diffraction data and (
b) NPD data with the monoclinic
C2/
c structure of Li
3ErI
6. (
c,
d) Refined crystal structure of Li
3ErI
6, showing alternating layers of [Er
xLi
(1−x)I
6(5−2x)−] and [LiI
65−] octahedra. (
e) BVSE [
36,
37] calculation for possible Li
+ migration pathway. The beige isosurface is actually an electrostatic estimation. It means the probable lithium residence and lithium diffusion pathway. The blue section in the
ab-plane is to show the strongly interconnected nature of Li sites, possibly related to a fast in-plane diffusion. (
f) Tetrahedral voids are adjacent to edge-shared LiI
65− octahedral. Both the voids and octahedral vacancies may act as transitional states for Li
+ diffusion. Reproduced with permission: Copyright 2022, American Chemical Society [
54]. (
g) Rietveld refinement of the NPD data for the Li
2ZrCl
6−xF
x (
x = 0.4). (
h,
i) The crystal structure obtained from above refinement. The blue, cyan, green and red balls represent Li, Zr, Cl and F, respectively. (
j) Arrhenius plots of Li
2ZrCl
6−xF
x (
x = 0.4) (LZCF) and Li
2ZrCl
6 (LZC). Reproduced with permission: Copyright 2023, Elsevier [
60].
![Batteries 09 00510 g005]()
3.4. Structure Determination in New Halide System
In search of SSEs, it would be very exhilarating to discover a novel halide system as a promising SSE to support the ASSB battery. In fact, this crystalline novel halide system strongly needs NPD to reveal its inner mechanism. Utilizing NPD data to solve its unprecedented structure with an unconventional Li sublattice is also a good reflection of NPD’s superiority. Here we take a recently reported new LaCl
3-based halide system [
63] as an example to discuss NPD’s role in this study.
Yin et al. [
63] have made shocking progress on a new LaCl
3-based halide system as a lithium superionic conductor, which possesses promising interfacial electrochemical compatibility with lithium metal anodes. According to their report, unlike conventional Li
3MCl
6 (M = Sc, Y, In, and Ho) [
21,
22,
26,
42], this halide system possesses a UCl
3-type LaCl
3 structure with large 1D channels that enable fast Li
+ conduction. These 1D channels are interconnected via La vacancies induced by Ta doping, in which case a 3D Li
+ migration network is established. In their optimized Li
0.388Ta
0.238La
0.475Cl
3, the Li
+ ionic conductivity (at 30 °C) is as high as 3.02 mS cm
−1 and the activation energy is as low as 0.197 eV. It also fulfills a long-term cycling in Li symmetric cell with 1 mAh cm
−2 for more than 5000 h. The author ascribed such stability to the gradient interfacial passivation layer that helps stabilize the Li metal electrode. It is also reported that, under a cutoff voltage of 4.35 V and with the areal capacity of more than 1 mAh cm
−2, the battery with Li
0.388Ta
0.238La
0.475Cl
3 SSE assembled with a Li metal anode and uncoated LiNi
0.5Co
0.2Mn
0.3O
2 cathode can run for more than 100 cycles. Rapid Li
+ conduction was also demonstrated in this lanthanide-based system (LnCl3; Ln = La, Ce, Nd, Sm and Gd).
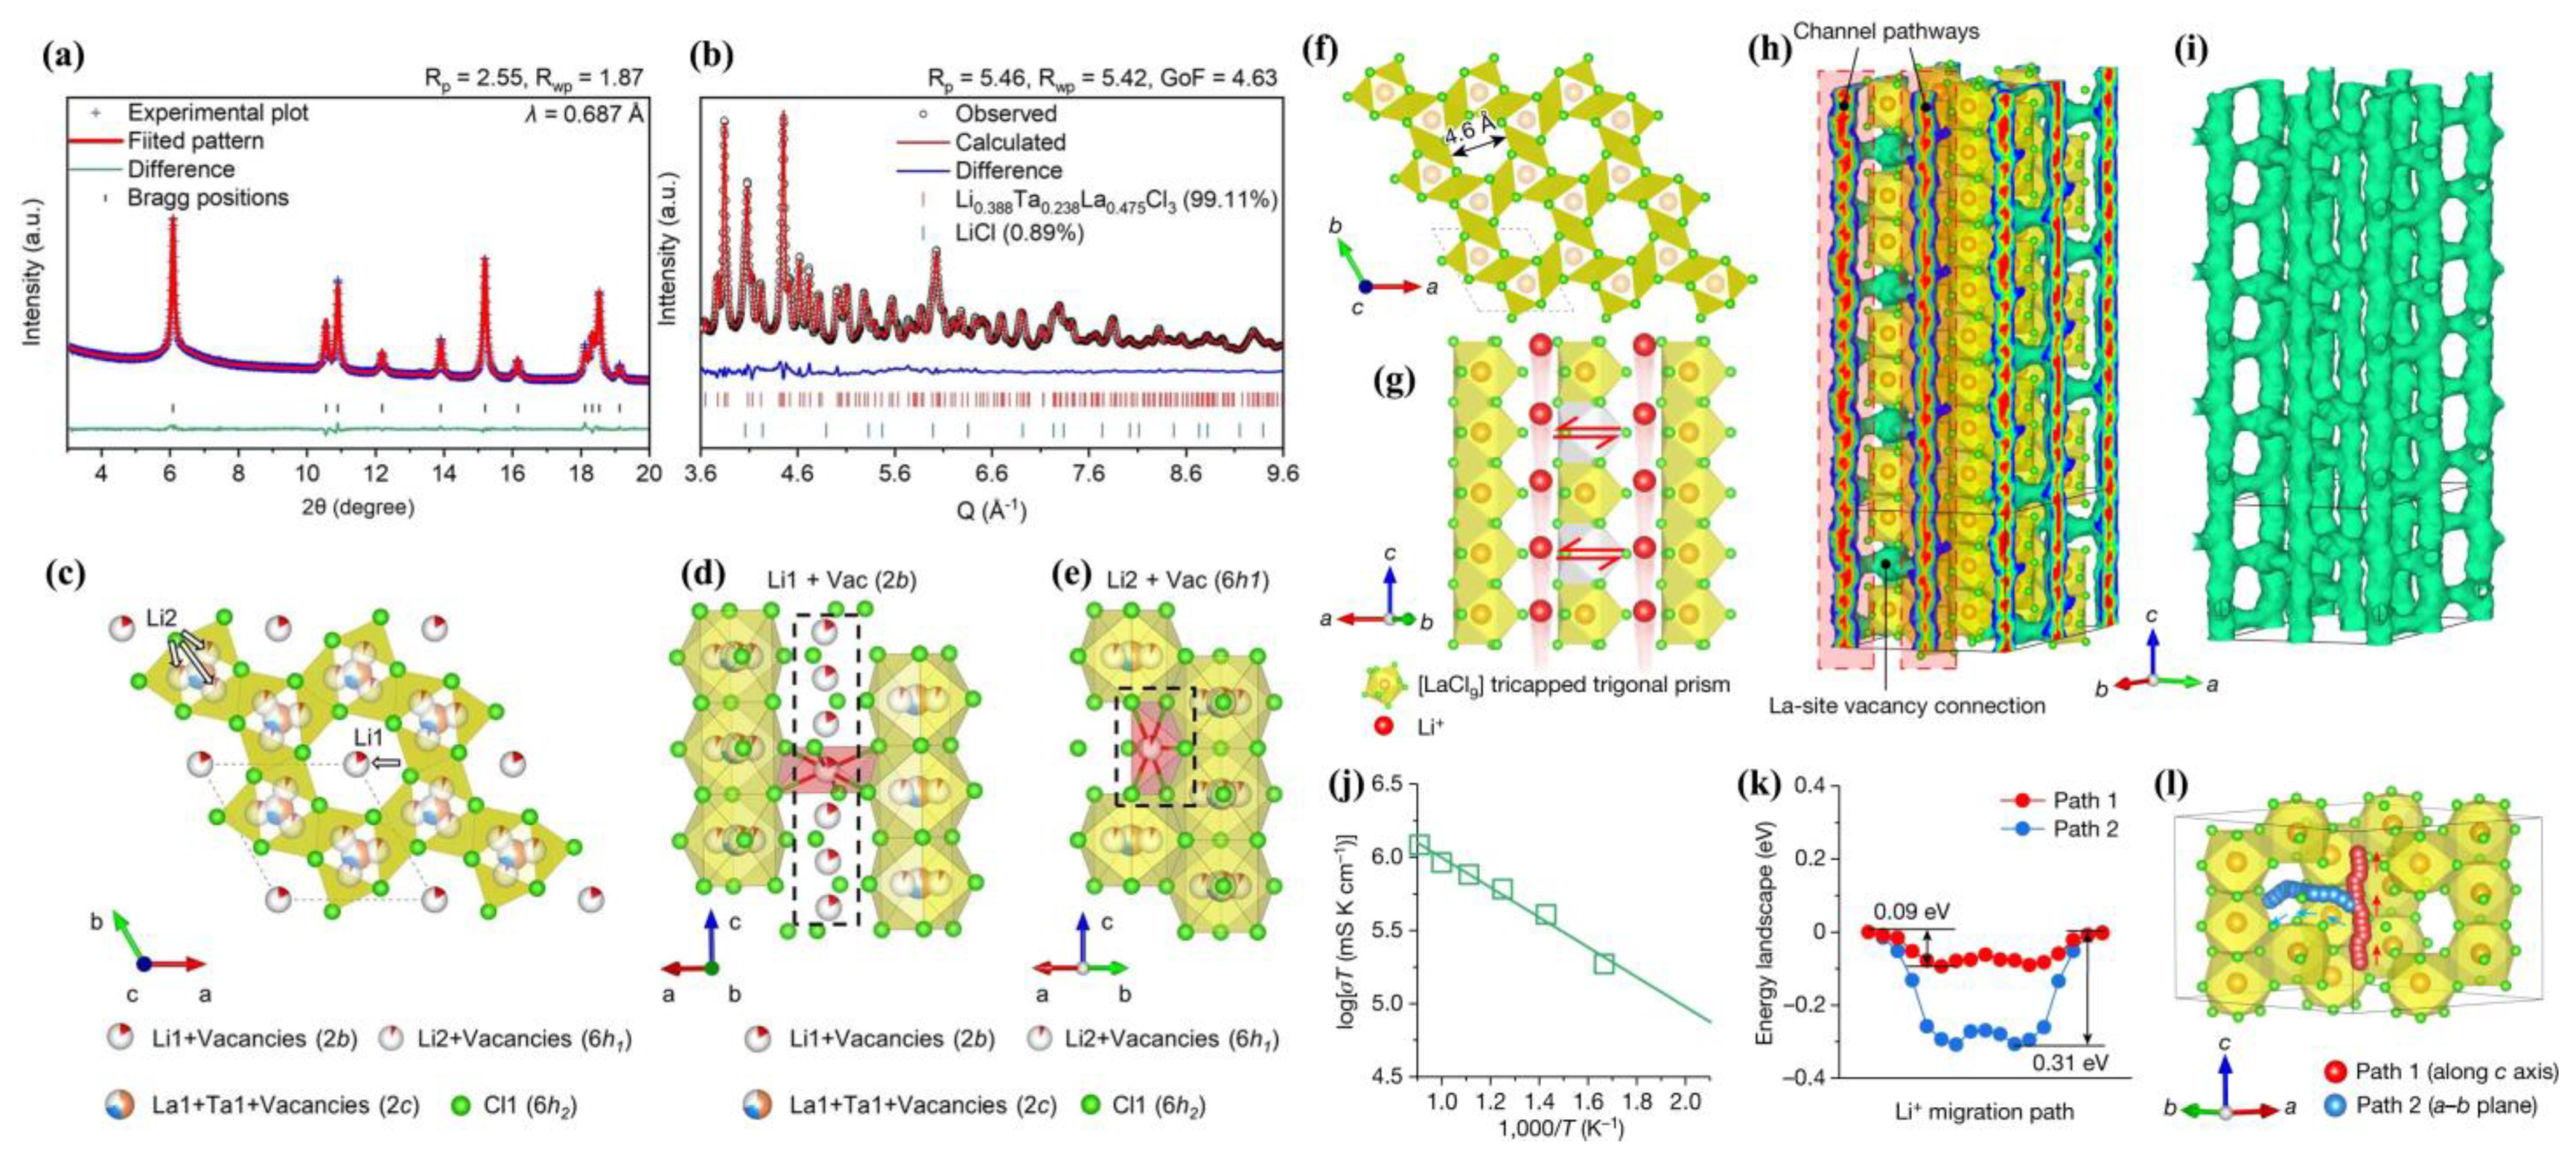
Neutron powder diffraction has played an indispensable role in this inspiring work, especially in determining the new crystal structure with explicit Li distribution/occupation, and elucidating the Li migration pathway, which provides a fundamental understanding of structural design for property enhancements.
Figure 6a,b provide a joint refinement of synchrotron X-ray and Neutron diffraction. The synchrotron X-ray identifies Ta, La, Cl, especially La/Ta vacancies to confirm the whole lattice framework, while the neutron data confirm lithium distribution. We can see that neutron data ranges from approximately 0.28 Å (Q ~3.6 Å
−1) to 0.1 Å (Q ~9.6 Å
−1). Such low
d-spacing data is especially beneficial in determining the local coordination environment and Li
+ disorder.
The lattice presents a UCl
3-type structure with
P6
3/
m space group (
Figure 6c–e), possessing a channel-typed non-close-packed anion lattice different from hcp Li
3YCl
6 and ccp Li
3InCl
6 types [
21,
22,
26,
42]. La
3+ vacancies were clearly found after introducing Ta
5+. Two Li
+ positions were found, namely Li1 and Li2, along with their surrounding Cl
− constituting the compressed [Li1Cl
6] octahedra in the channels and [Li2Cl
5] rectangular pyramids near La sites. The author mentioned that 6h1 is an intermediate Li site in a metastable state that is critical in supporting the Li
+ fast motion across adjacent channels.
Figure 6f clearly shows 1D channels constructed by six columns of edge-shared [LaCl
9] tricapped trigonal prisms in the LaCl
3 lattice. Its large inner diameter around 4.6 Å offers a wide space that accommodates abundant octahedral sites for Li
+ ionic motion. The author further proposed that 1D channels are interconnected by La vacancies to form a 3D Li-diffusion lattice, as shown in
Figure 6g. The lithium not only migrates along the 1D channel but also migrates to the neighboring one via La vacancies sites. This could be supported by bond valence site energy (BVSE) analysis [
36,
37] on the basis of an NPD-determined structure. Finally, BVSE calculation illustrates an energetically favored 1D diffusion chain [Li1–Li2–Li1] along the
c-direction, with an energy barrier of merely 0.18 eV that is much lower than that of 0.5 eV for diffusion across adjacent channels via La vacancies.
Ab initio molecular dynamics (AIMD) simulations also confirm a fast Li
+ transport along a spread of closely spaced sites in the 1D channels (
Figure 6h). The irregularly elongated Li
+ probability density was suggested to be related to Li
+ site disordering, which was considered to be a crucial factor to fulfill rapid Li
+ conduction [
64]. The Li
+ could migrate between adjacent channels via La vacancies (
Figure 6h). The interconnected 3D Li
+ diffusion pathway is depicted in
Figure 6i (all polyhedrons are omitted). The AIMD simulation yields a calculated ionic conductivity as high as 13.8 mS cm
−1 at 300 K (
Figure 6j). The energy landscape in
Figure 6k clearly illustrates two different Li
+ diffusion pathways, with an energy barrier of 0.09 eV along the
c-direction channels (red path in
Figure 6k,l), and an energy barrier of 0.31 eV across channels in the
a–
b plane (blue path in
Figure 6k,l). Both values are lower than the above BVSE results. These results imply that La
3+ vacancies, which mainly originate from Ta
5+ doping, are of vital importance to endow the LaCl
3 lattice with a rapid Li
+ conduction.
These unique structure features and interconnected migration pathways allow the halide system to reach its best ionic conductivity σ of 3.02 mS cm−1 (at 30 °C) in Li0.388Ta0.238La0.475Cl3. It also exhibits an excellent electrode compatibility that allows stable cycling with an areal capacity of 1.16 mAh cm−2 in Li/Li0.388Ta0.238La0.475Cl3/NCM523 full cell. This research also manifests the superiority of the electrode compatibility of LaCl3-based SEs. It can be expected that this work in future will inspire far more investigation of this brand new UCl3-type SSE system of LnCl3 lattice with multiple element-doping choices.
3.5. In Situ NPD Study on Phase Evolution (Transition)
In situ NPD can directly monitor the dynamics process of phase evolution (or transition). The in situ NPD utilization discussed here mainly involves phase analysis during the dehydration process and heating process. The first work on dehydration analysis comes from an investigation on Li3InCl6 humidity tolerance and degradation. The second work on heating analysis come from an investigation of Li2ZrCl6 thermal stability.
In terms of humidity tolerance, it has been acknowledged that most SSEs will degrade when exposed to ambient air [
65,
66,
67]; however, Li
3InCl
6 appears to possess much stronger humidity tolerance than others [
30], along with high ionic conductivity and high voltage compatibility [
22,
23]. According to Li et al.’ s study [
30], Li
3YCl
6 is unstable even in low humidity, and will decompose to simple chloride hydrates LiCl·H
2O and YCl
3·6H
2O after exposure in air for 12 h with 3−5% humidity. This decomposition cannot be recovered by reheating in an inert atmosphere. However, when introducing certain amounts of In
3+ into Li
3YCl
6, the humidity tolerance was significantly improved. This is because Li
3Y
1−xIn
xCl
6 (with
x > 0.5) [
30] and also Li
3InCl
6 after humidity exposure can form Li
3Y
1−xIn
xCl
6·H
2O and Li
3InCl
6·H
2O intermediates rather than decompose to simple chloride hydrates. More importantly, the Li
3Y
1−xIn
xCl
6 SSEs could be regained after reheating at 260 °C. The above results demonstrate that high In
3+ contents could help to retain the (Y/In)Cl
63− octahedral frameworks after humidity exposure by forming hydrated intermediates, which could then be regenerated after a careful dehydration process.
Since Li
3Y
1−xIn
xCl
6 (with
x > 0.5) and Li
3InCl
6 all adopt a
ccp monoclinic structure rather than
hcp orthorhombic structure as in Li
3YCl
6, we deduce that the stronger humidity tolerance is possibly related to this
ccp monoclinic structure that is able to accommodate water molecules in the lattice without being broken. This is also a possible explanation why Li
3InCl
6 can be synthesized via a water-mediated route followed by controlled dehydration [
23].
Nevertheless, there is still some remaining further debate. For instance, how does the phase change during dehydration? Why does the conductivity of reheated Li3Y1−xInxCl6 not fully recover after dehydration (retention: 85.37% for Li3Y0.2In0.8Cl6, 87.22% for Li3Y0.1In0.9Cl6)? Apparently, deciphering the dehydration/tolerance process in this halide system could be of much significance.
Bearing this in mind, the first work discussed here is about the in situ NPD/XRD study of the dehydration process of Li
3InCl
6 (that is from Li
3InCl
6·1.5H
2O to pure Li
3InCl
6) conducted by Sacci et al. [
44]. They emphasize that careful consideration should be taken during the dehydration process and a strong vacuum is indispensable. In situ NPD revealed that the dehydration process actually involves multiple phase transitions that could significantly vary the conductivity. The lithium conductivity can be related to the amount of residual H
2O, the structural stability and ordering of the lithium sublattice.
As shown in
Figure 7a,c, in situ XRD measurements detected two sets of diffraction peaks upon heating, which represents a single transition of the host framework from the fully hydrated to the anhydrous phase. The hydrate Li
3InCl
6·1.5H
2O can maintain from 30 to 80 °C, which bares a
P2
1/
c space group. Above 80 °C, the anhydrous phase appears with a
C2/
m space group, and the remaining hydrate transforms to anhydrate rapidly between 110 and 150 °C. However, under in situ neutron diffraction (
Figure 7b) (deuterated water is used in sample synthesis), at least four distinct phases could be identified with overlapping on their temperature ranges. The reason for this is that XRD lacks sensitivity with light elements like Li or H, so that structural changes in the Li sublattice would not be observed. The variation of neutron data demonstrates that, as they dehydrate, the sublattices of Li
+ and H
+ are drastically modulated. Note that in neutron data the transition from phase 2 (Li
3InCl
6·
xH
2O) to 3 (Li
3InCl
6·0.5H
2O) also occurs above 80 °C. This coincides well with the XRD transition temperature and the conductivity boost. Since not much change is observed in XRD above 90 °C, this means that the In and Cl host frameworks basically lock in above 90 °C. In other words, the In–Cl octahedra support the layered structure frameworks for H
2O and Li ions to reside within.
As the remaining H
2O is further removed, Li transport becomes more facile, and reaches its maximum when water molecules are totally removed. Subsequent cooling in the absence of water makes no observable change on the ionic conductivity, demonstrating that water molecules in the hydrate lattice are the main cause for its inferior conductivity. Dehydration is accompanied by pellet contraction, with the observation of clear grain boundary formation shown in
Figure 7d. The dehydrate Li
3InCl
6 exhibits orders of magnitude higher conductivity (1.1 × 10
−3 S cm
−1) than hydrate Li
3InCl
6·1.5H
2O (3.5 × 10
−7 S cm
−1). The author concludes that the presence of H
2O molecules would probably extend the required Li
+ or block the original facile Li
+ transport pathway, and eventually lead to the decrease in Li mobility.
The grain boundary as formed during dehydration (
Figure 7d) may be one reason that the above-mentioned reheated Li
3Y
1−xIn
xCl
6 [
30] fails to fully recover its ionic conductivity. Although dehydration of the hydrate is a feasible and facile synthesis route toward Li
3InCl
6, the final removal of trace H
2O would inevitably lead to stress fractures and therefore the formation of the grain boundary. It may be possible to alleviate grain boundaries’ formation by careful control of the dehydration rate or exertion of mechanical pressure. The author finally emphasized that the control of the as-formed grain boundary implies high-through put processing during roll-to-roll fabrication of solid electrolytes.
The second work is about the in situ NPD analysis of the phase transition of Li
2ZrCl
6 [
68] while heating. The Li
2ZrCl
6 (LZC) system generally preserves high humidity tolerance, good deformability, excellent compatibility with 4V-class cathodes, and significantly low cost in terms of the raw materials. Unlike Li
3InCl
6, Li
2ZrCl
6 undergoes neither moisture uptake nor conductivity deterioration after being exposed to the atmosphere with 5% relative humidity. However, it undergoes phase transition during heating. As reported by Wang et al. [
68], two type of Li
2ZrCl
6 (LZC) phases exist, i.e., trigonal
α-LZC from ball-milling (without calcined) and monoclinic
β-LZC from annealing at 350 °C. Trigonal
α-LZC has higher room-temperature ionic conductivity (8.08 × 10
–4 S cm
−1).
Phase transition from trigonal
α- to monoclinic
β-LZC occurs above 277 °C, accompanied by a decrease in conductivity. After annealing at 350 °C, the ionic conductivity of LZC at 25 °C will decrease by two orders of magnitude, that is, from 8.08 × 10
–4 S cm
–1 of
α-LZC, to 5.81 × 10
–6 S cm
–1 of
β-LZC. The XRD and in situ NPD analysis (
Figure 8a,b) reveal a
α-LZC phase below 277 °C, and the coexistence of
α- and
β-LZC phases from 277 °C to 350 °C. Above 350 °C, only
β-LZC could be observed, and above 450 °C the LZC would melt. The
α-LZC is isostructural to Li
3YCl
6 (space group
P-3
m1, trigonal), while
β-LZC is isostructural to Li
3InCl
6, (space group
C2/
m, monoclinic). Considering that the material annealed at 350 °C, then followed by furnace cooling, still maintains a pure
β-LZC structure (
Figure 8a) rather than turning into
α-LZC structure, it could be deduced that
α-LZC is likely a metastable phase originating from the high energy planetary mill. This is the quite distinctive to other chlorides in which planetary mill can only change the crystallinity rather than the crystal structure [
21,
22,
30].
Through NPD refinements (
Figure 8c), they found that Li+ ions in as-milled
α-LZC prefer to occupy 6h sites (
Figure 8d), but in contrast, in Li
3YCl
6 two Li sites (6g and 6h) are both well-occupied (occupancy > 0.50) [
21]. The BVSE method [
36,
37] calculates the migration pathway and energy barrier (
Figure 8e–l). For
α-LZC, the most energetically favorable diffusion pathway is the [Li1–Li2–Li1] chain along the
c-direction, as marked in red in
Figure 8f–h. Beside this diffusion chain, Li
+ is also likely to diffuse along the [Li1–i1–Li1–i2–Li1] pathway (i represents the interstitial site), or [Li2–i3–Li2] pathway, as marked in blue and green, respectively, in
Figure 8f–h. These two alternative pathways could link the above [Li1–Li2–Li1] chains to establish a 3D diffusion network, of which the migration barrier is 0.803 eV (
Figure 8g,h). For the β-LZC structure (
Figure 8i), the relatively favorable Li
+ pathways reside within the layers in the
ab-plane, as marked in red in
Figure 8j–l, with a similar barrier of 0.809 eV (
Figure 8l). However, the barrier of migration between adjacent layers is significantly higher (2.987 eV), as marked in blue in
Figure 8k,l.
However, the author proposed that the true reason for the higher ionic conductivity of α-LZC should be attributed to non-periodic features including defects, surface structure, amorphous phase, etc., which are induced by the high-energy intense ball milling during synthesis. This is because, first, the effective migration barriers of α-LZC (0.803 eV) and β-LZC (0.809 eV) are similar, and second, the conductivity of as-milled α-LZC will drop to 3.22 × 10⁻⁵ S cm–1 after being annealed at 215 °C. Yet, further investigation using advanced techniques with ultrahigh spatial resolution is still required to identify the microscopic mechanism of the fast ionic transport and make a rational optimization. In spite of this, this work can be seen as a good illustration of how an in situ NPD technique provides an in-depth understanding of the structure–property relationship of advanced SSEs. Li2ZrCl6 SSE is cost-effective, moisture-resistant (5% relative humidity), deformable, and cathode compatible (4 V-class). Specifically, its merits of humidity tolerance and cost-effectiveness remove two major obstacles in the way towards wide usage of SSEs.


