Article

Classification of Lithium-Ion Batteries Based on Impedance Spectrum Features and an Improved K-Means Algorithm

1
Power Research Institute of State Grid Ningxia Electric Power Co., Ltd., Yinchuan 750001, China
2
School of Electrical Engineering and Automation, Anhui University, Hefei 230601, China
*
Author to whom correspondence should be addressed.
Batteries 2023, 9(10), 491; https://doi.org/10.3390/batteries9100491
Submission received: 18 August 2023 / Revised: 16 September 2023 / Accepted: 22 September 2023 / Published: 26 September 2023

Abstract

:
This article presents a classification method that utilizes impedance spectrum features and an enhanced K-means algorithm for Lithium-ion batteries. Additionally, a parameter identification method for the fractional order model is proposed, which is based on the flow direction algorithm (FDA). In order to reduce the dimensionality of battery features, the Pearson correlation coefficient is employed to analyze the correlation between impedance spectrum features. The battery classification is carried out using the improved K-means algorithm, which incorporates the optimization of the initial clustering center using the grey wolf optimization (GWO) algorithm. The experimental results demonstrate the effectiveness of this method in accurately classifying batteries and its high level of accuracy and robustness. Consequently, this method can be relied upon to provide robust support for battery performance evaluation and fault diagnosis.

Graphical Abstract

1. Introduction

The energy crisis and environmental pollution have greatly accelerated the rapid development of electric vehicles (EVs) and battery energy storage systems (BESSs) [1]. Within these systems, battery packs serve as critical components responsible for energy storage and buffering. Lithium-ion batteries are the preferred choice for battery packs due to their numerous advantages, including high energy density, long cycle life, memory-free effect, and environmentally friendly nature [2]. However, due to limitations in materials and manufacturing processes, variations in the initial performance of batteries are inevitable. The inconsistent integration of batteries can further amplify differences in cell performance, leading to a shortened service life and increased safety hazards [3]. Therefore, it is imperative to strictly sort the cells before proceeding with the integrated manufacturing of battery packs in order to ensure optimal performance [4].
There are two essential links in battery sorting: consistency feature extraction and sorting methods. Consistency features are crucial for battery sorting. Capacity and internal resistance are essential parameters for batteries, which can effectively characterize the internal performance status of batteries. Ref. [5] proposes a battery classification method based on the radial basis function neural network, which takes internal resistance and capacity as consistency features. Voltage is one of the necessary signals for the battery management system (BMS). It is used as a consistency feature for battery sorting combined with a convolutional neural network [6]. A classification framework based on random forest (RF) is proposed for battery sorting in Ref. [7]. The support vector machine (SVM) can effectively handle minor sample classification problems [8]. A classification method for retired batteries based on SVM is proposed in Ref. [9]. Clustering can more intuitively display sample categories, which are widely used for battery classification and screening. Clustering can more intuitively display sample categories. Therefore, clustering methods are widely used for battery classification and screening [10]. Ref. [11] extracts consistency feature parameters from vehicle data and establishes a battery classification method based on improved GK clustering. Capacity is one of the critical parameters of consistency. It is used as one of the input features of the Gaussian mixture model for battery classification in Ref. [12]. The charging voltage curve can intuitively reflect the consistency of batteries. Ref. [13] mines consistent features from the voltage curve and combines them with the improved K-means algorithm for battery classification. The current pulse testing can capture more battery parameter information. A battery screening scheme based on an improved bisecting K-means algorithm combined with fast pulse testing is proposed in Ref. [14]. The consistent information is implied in the voltage-time series. Mode distance is used to analyze the voltage dispersion in Ref. [15]. Battery sorting is achieved by K-medoid clustering. Ref. [16] selects voltage as the feature and uses the density-based spatial clustering of applications with noise (DBSCAN) algorithm for battery clustering. Finding the optimal clustering center is a crucial aspect of battery classification algorithms based on clustering, as it directly influences the accuracy of battery sorting.
This work acknowledges that extracting features based on external characteristics may be straightforward, but it is challenging to accurately represent the actual performance status of batteries. The random initialization of clustering centers may also hinder effective battery clustering. To address these challenges, this study proposes a battery classification method that utilizes electrochemical impedance spectroscopy (EIS) features and an improved K-means algorithm. The key contributions of this work can be summarized as follows:
(a)
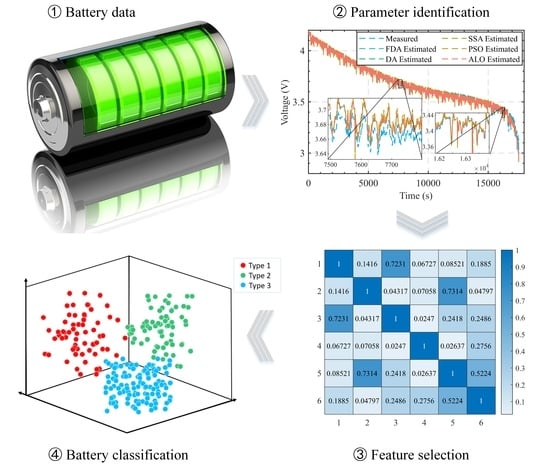
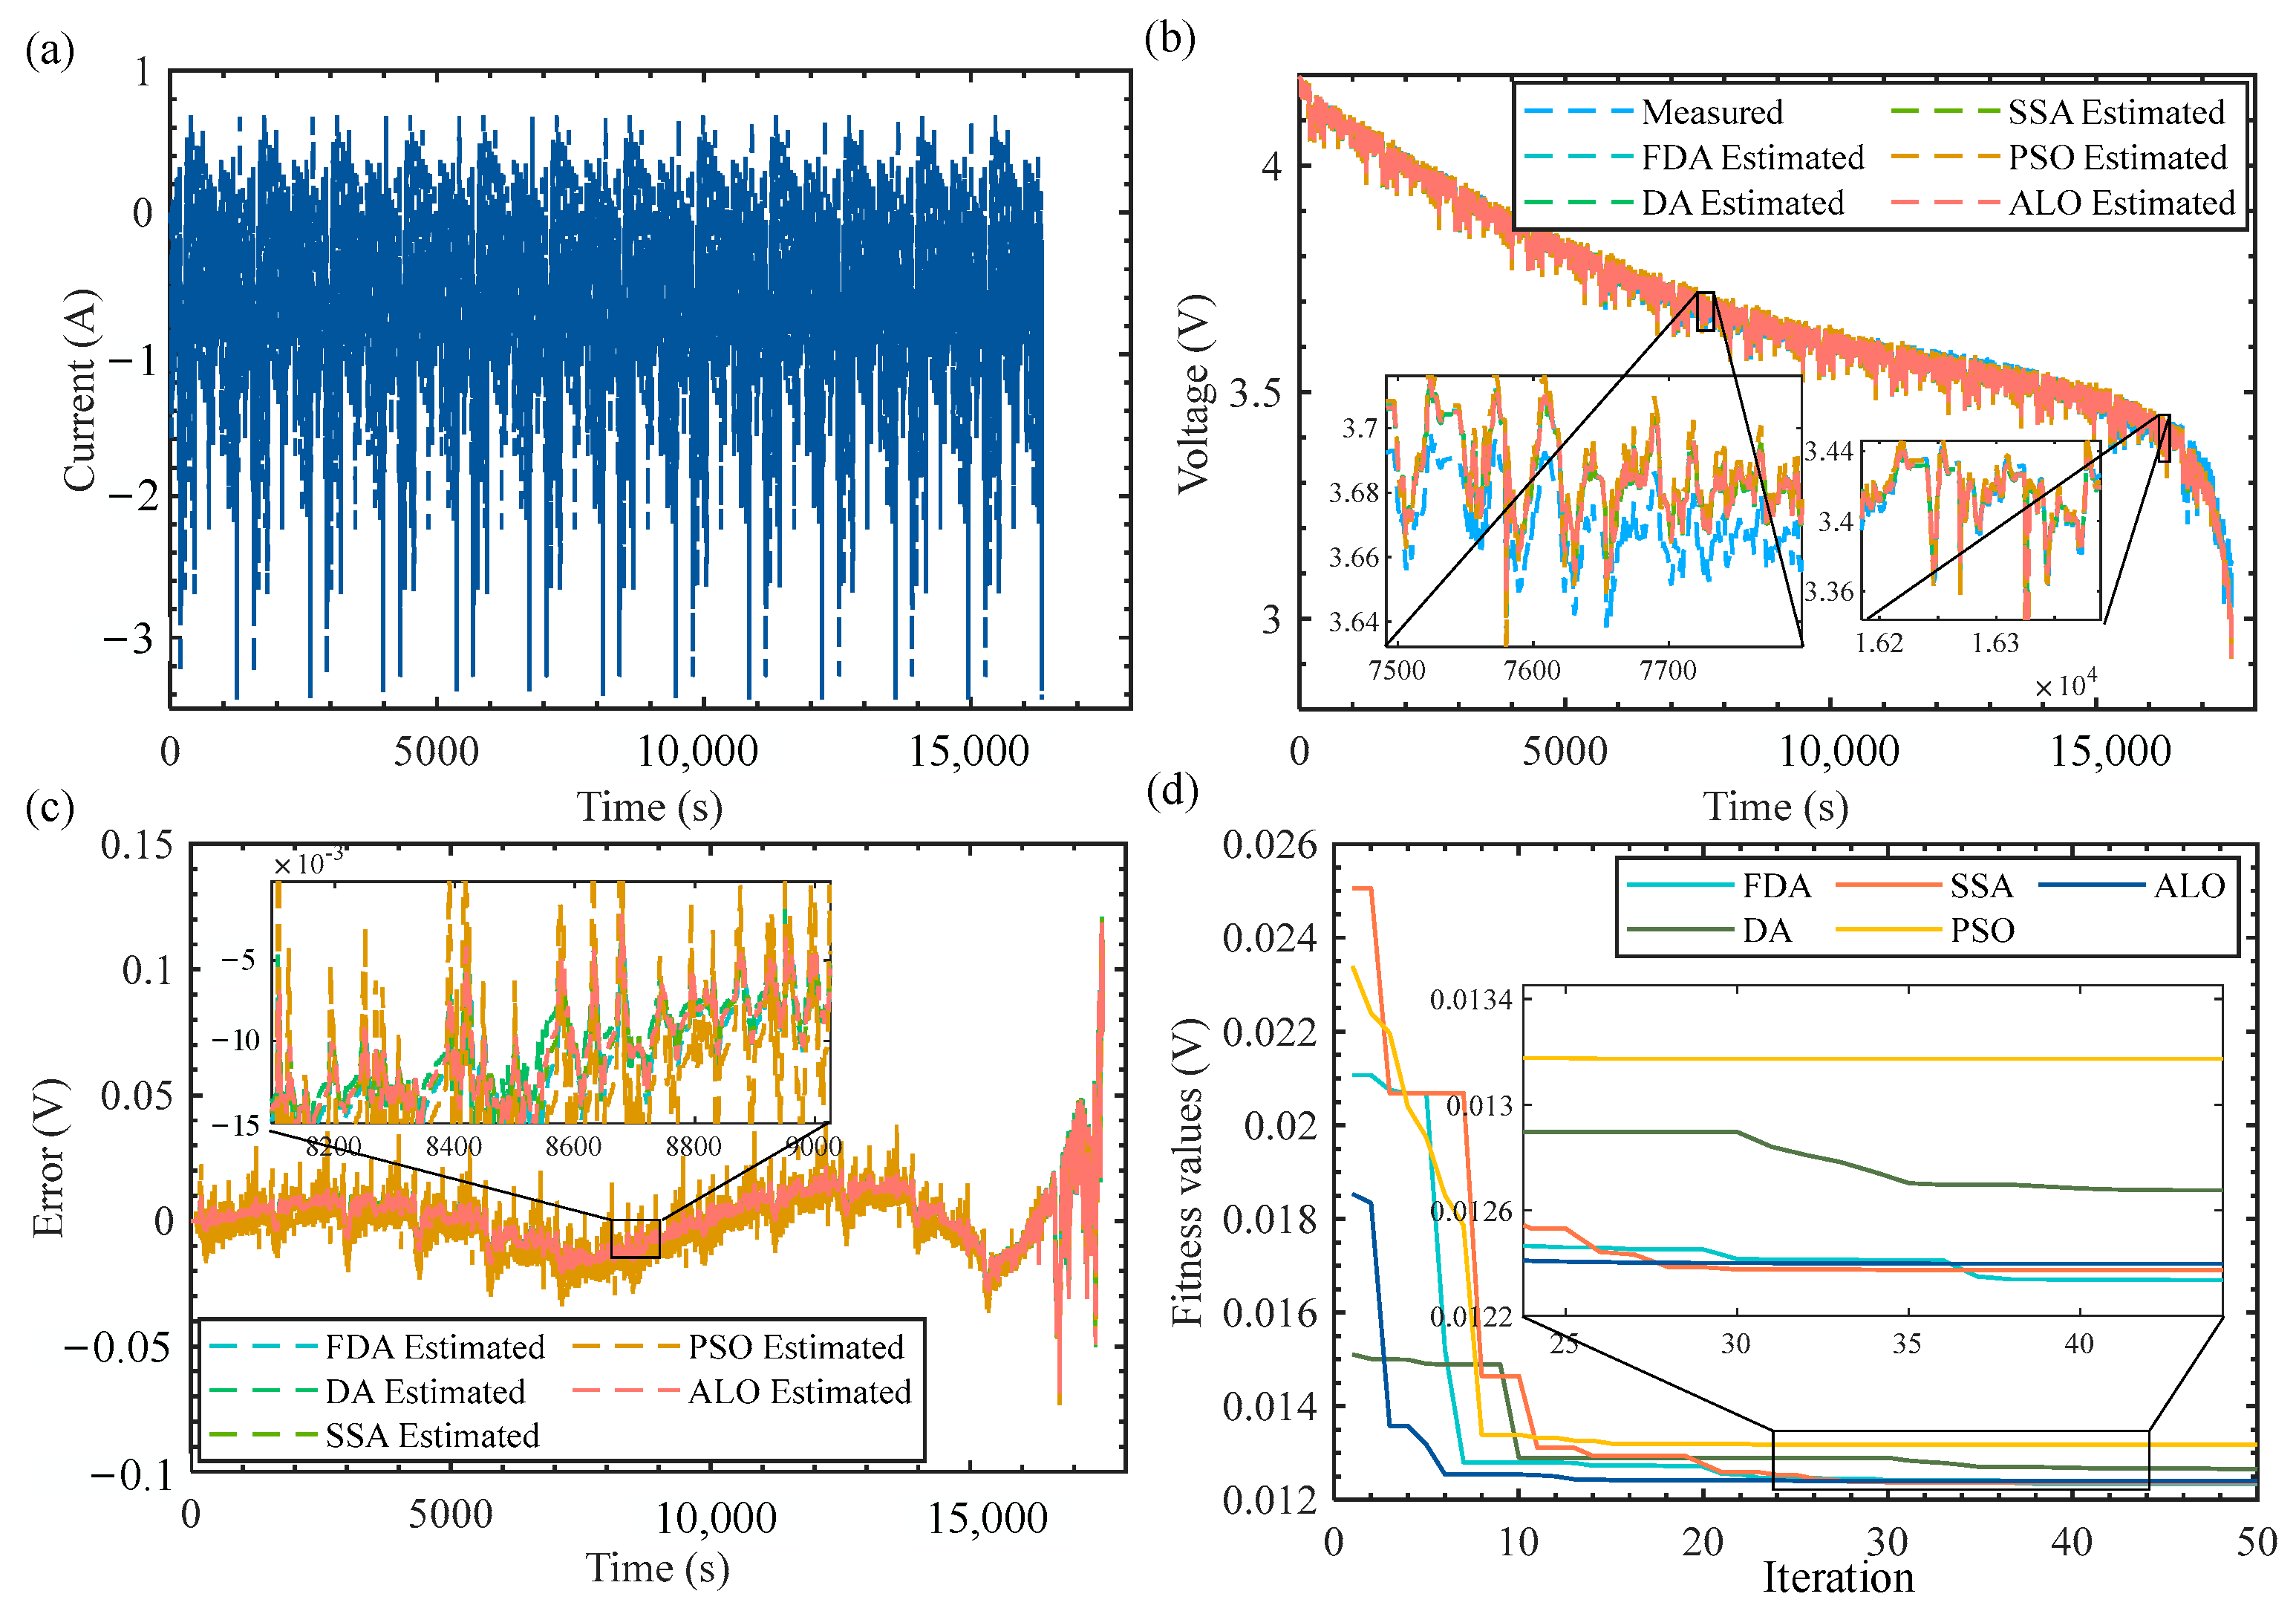
A parameter identification method for battery fractional order models is proposed, utilizing the FDA and compared with other optimization algorithms such as the dragonfly algorithm (DA), salp swarm algorithm (SSA), ant lion optimizer (ALO), and particle swarm optimization (PSO) algorithm. This method aims to effectively identify the parameters of fractional order models.
(b)
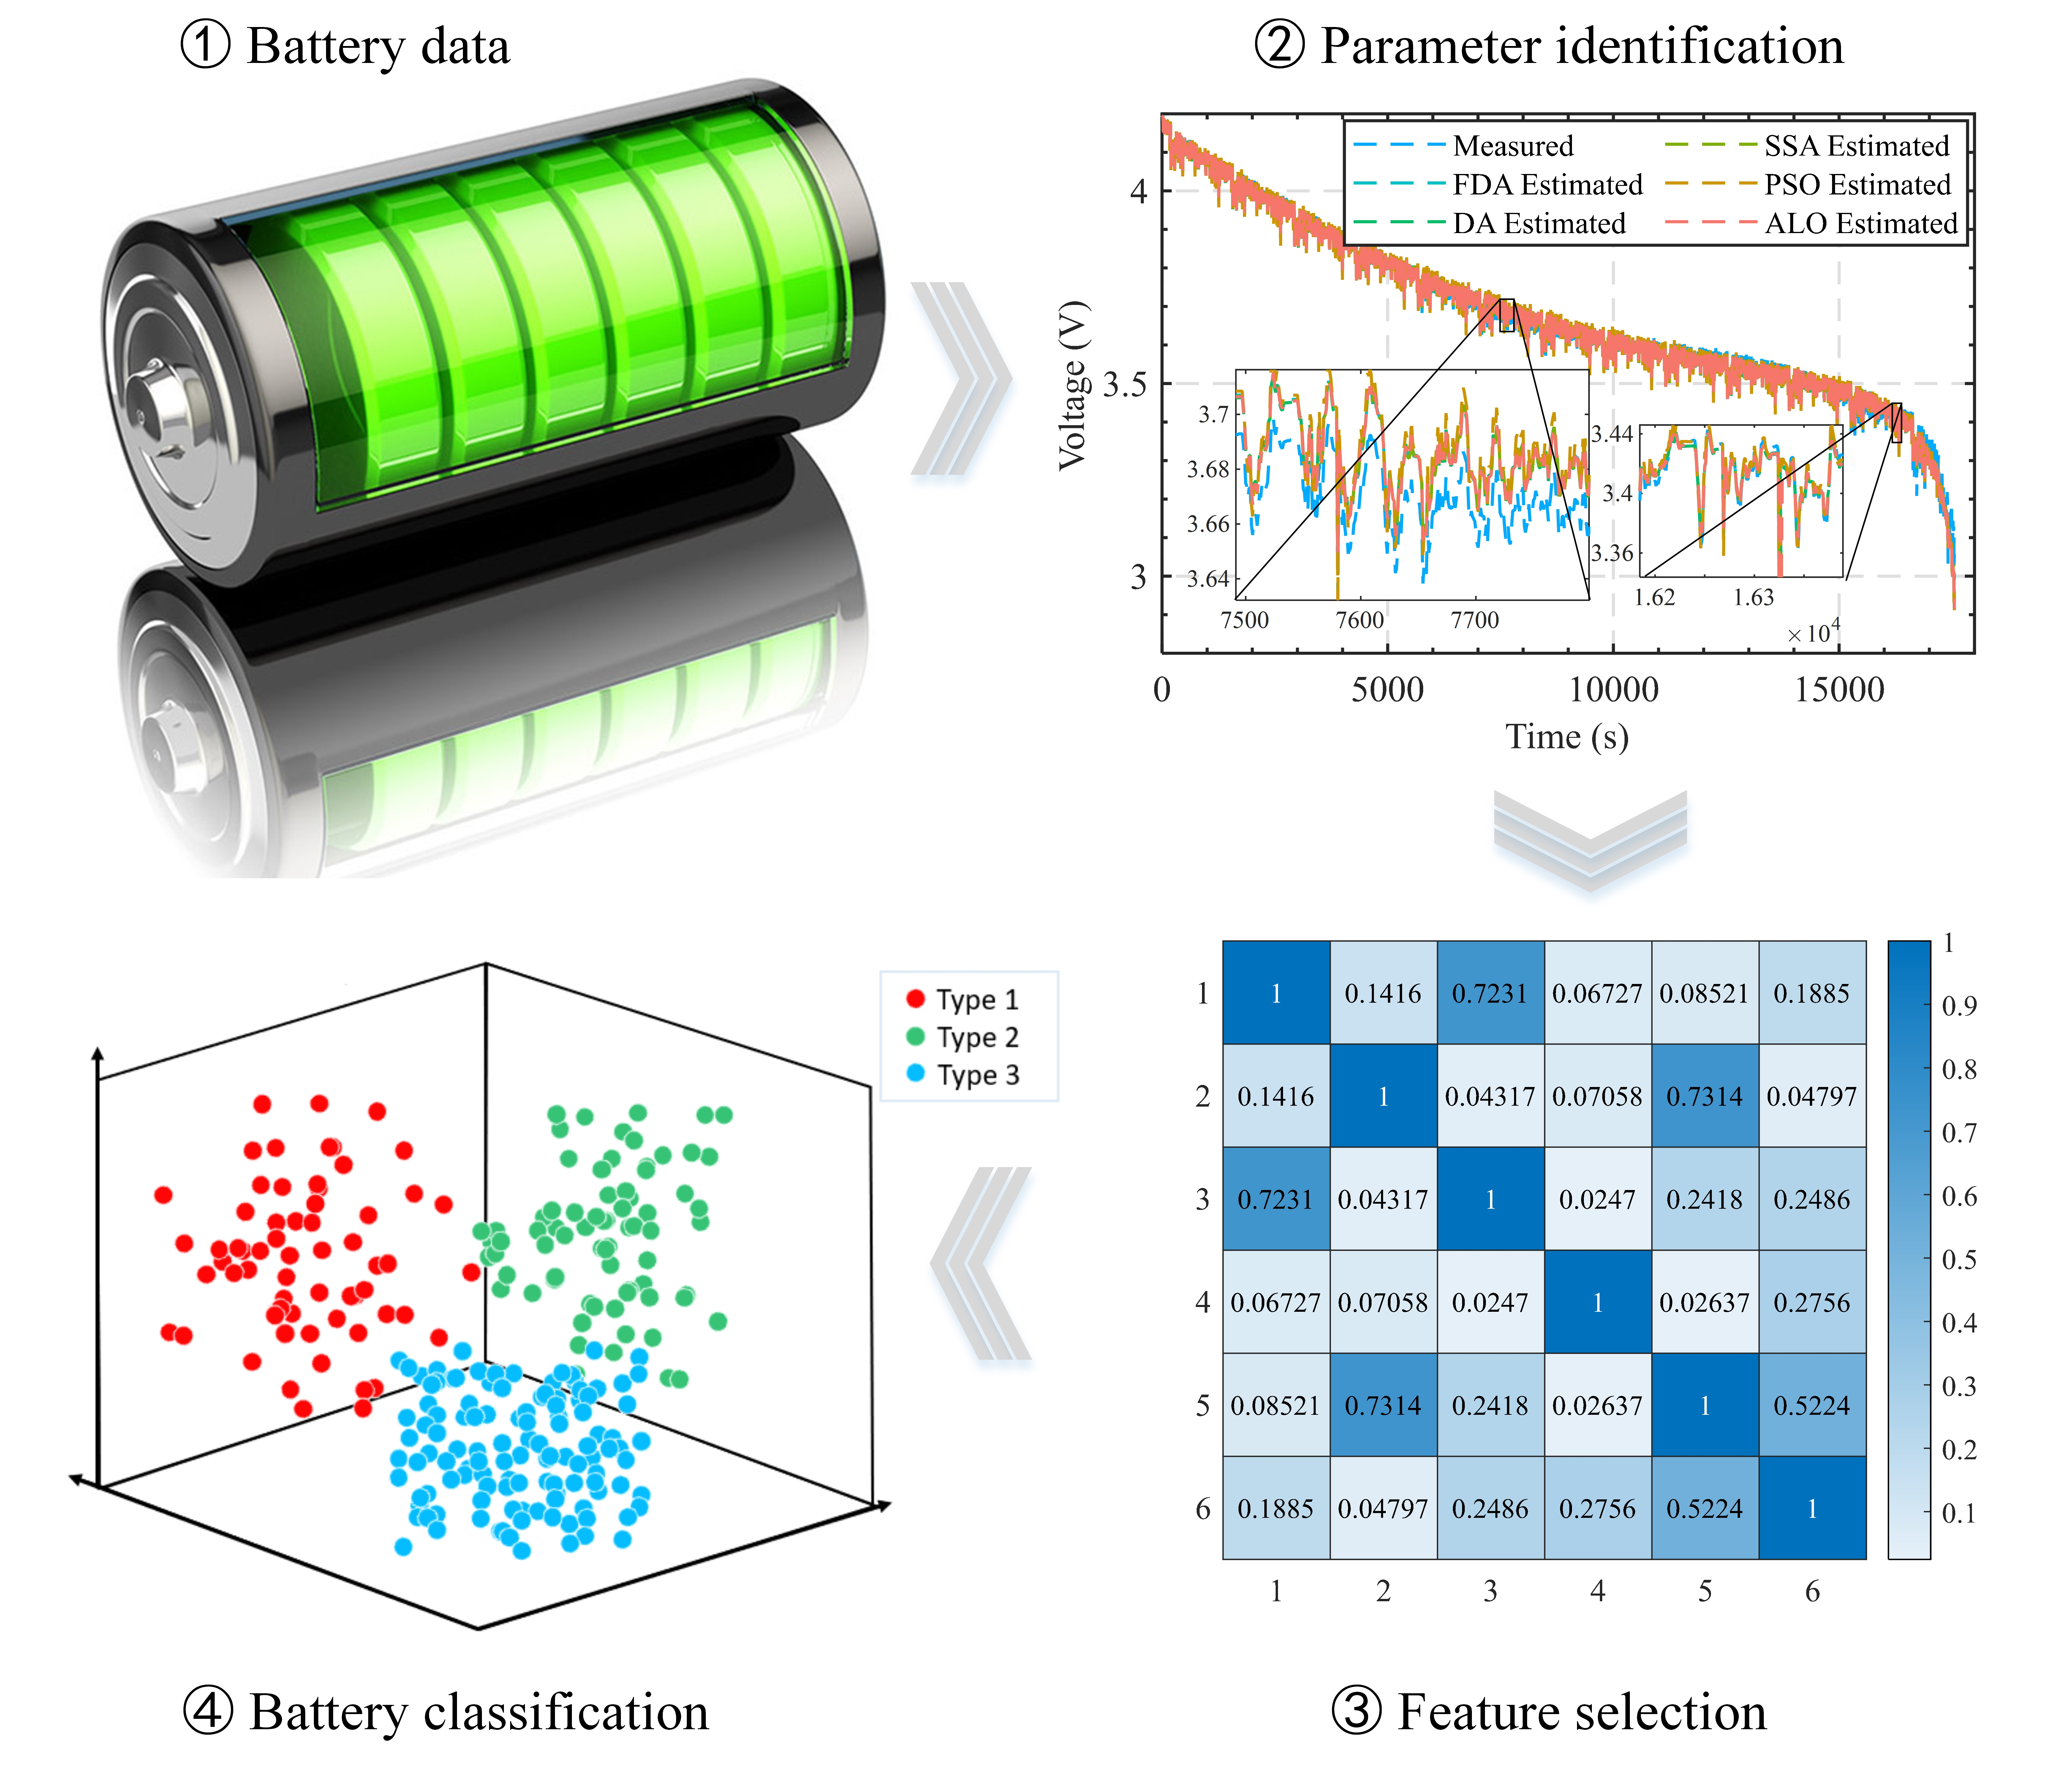
The correlation between battery model parameters is analyzed using Pearson correlation coefficients. These coefficients are then presented as thermodynamic diagrams to guide feature dimensionality reduction. This analysis helps to understand the relationships between different battery model parameters.
(c)
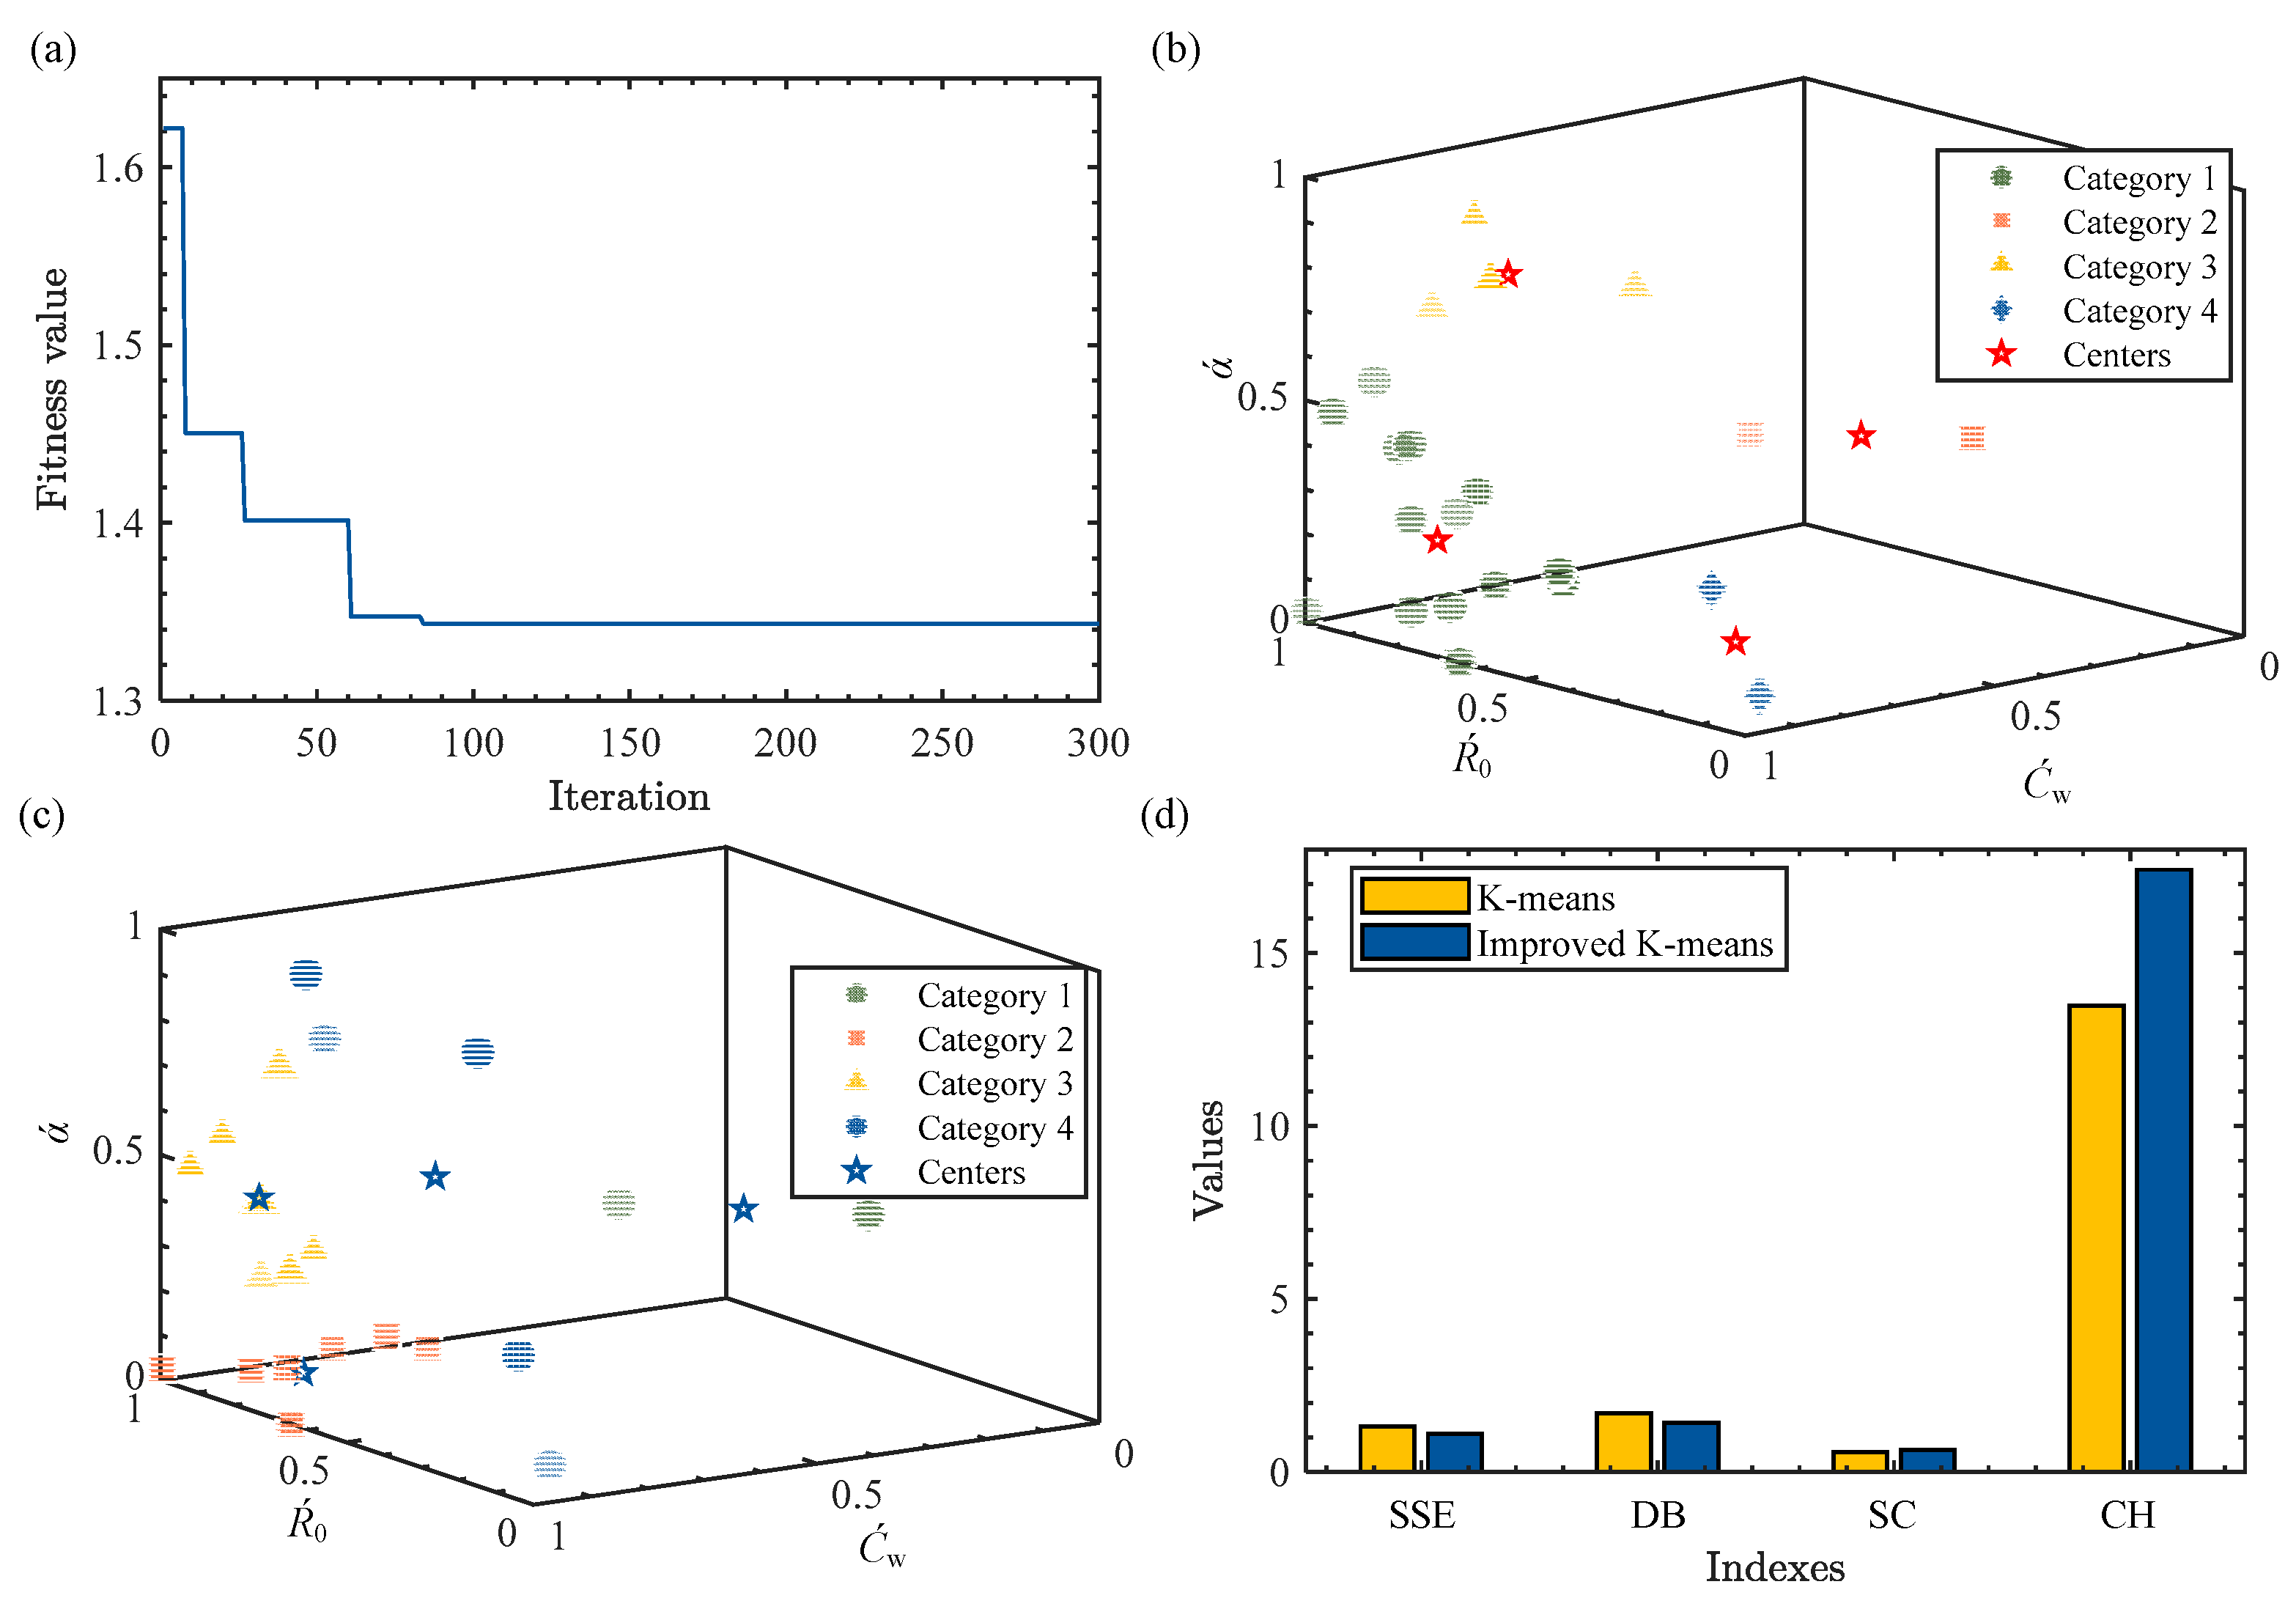
An improved K-means algorithm is introduced for battery classification. It employs the GWO algorithm to optimize the cluster centers. This adaptation addresses the issue of traditional K-means algorithms being highly sensitive to the initial cluster center selection.
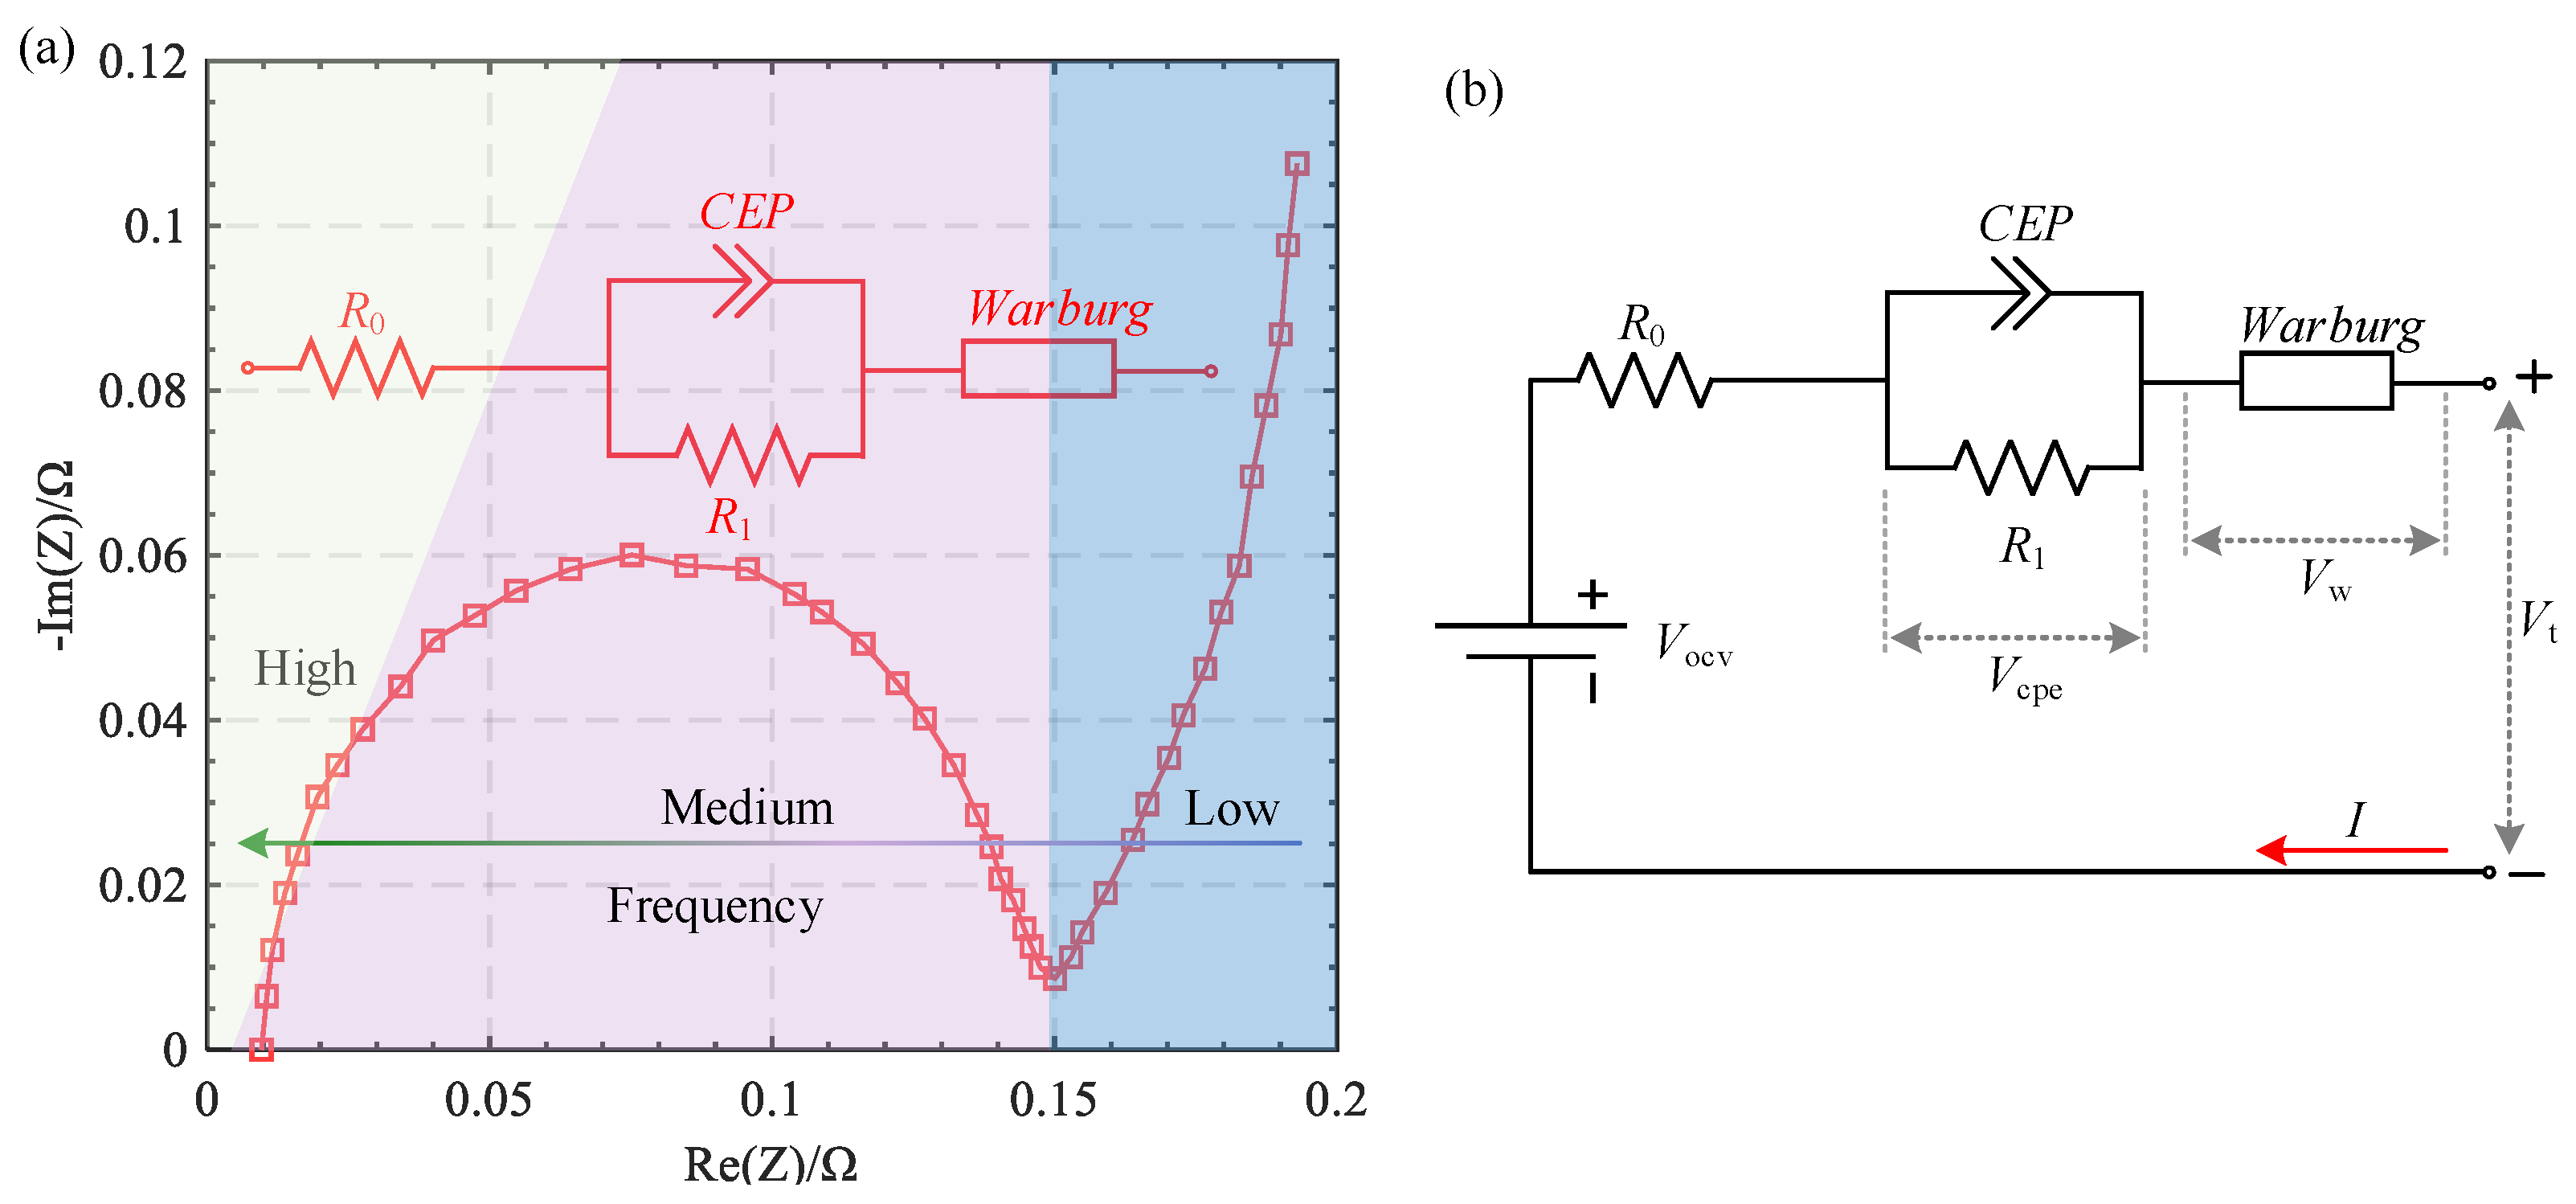
The subsequent sections of the paper are organized as follows. Section 2 provides an introduction to the fractional order model. Section 3 outlines the parameter identification method based on the FDA algorithm. Section 4 presents the experimental setup and validation process. Finally, Section 5 concludes the paper and summarizes the findings.

2. Battery Modeling

Electrochemical impedance spectroscopy (EIS) is a non-destructive measurement technique and an effective method for understanding the dynamic behavior of batteries. It is widely utilized for battery state estimation [17], health assessment [18], and fault diagnosis [19]. During an EIS measurement, a small amplitude sine wave voltage signal with frequency w1 is applied to the battery system. In response, the system generates a sine wave current with frequency w2. The ratio of excitation voltage to response current represents the battery’s impedance spectrum, commonly referred to as the Nyquist curve [20].
Figure 1a illustrates the Nyquist diagram of lithium-ion batteries, presenting approximate representations of high-, medium-, and low-frequency bands. The internal resistance of a battery refers to the overall resistance across the electrode, electrolyte, and separator, which is denoted by the initial x-axis intercept value on the Nyquist diagram. The impedance spectrum at medium to high frequencies reflects the impedance of the battery’s solid electrolyte and the polarization impedance of the electrode. The high-frequency part of EIS reflects the characteristics of charge transfer process and interface reaction inside the battery. In the high-frequency part, the impedance of the battery is mainly influenced by the charge transfer process and interface reactions, which are related to the electrolyte conductivity inside the battery, the electrochemical reaction rate on the electrode surface, and the interface characteristics between the electrode and electrolyte. The medium-frequency of EIS describes the diffusion effect of charges. The constant phase element (CPE) is used in parallel with the transfer resistor representing charge diffusion to describe the diffusion effect of charges [21]. In the low-frequency portion, the Nyquist curve approximately forms a 45° straight line, indicative of the concentration polarization impedance [22]. The impedance spectrum of the battery electrochemical system at low frequencies can be used to reflect the diffusion dynamic characteristics inside spherical particles described by Fick’s second law [23]. Due to the non-standard semicircular shape of the Nyquist curve in the mid- to high-frequency range, conventional integer order polarization networks fail to accurately represent it. Hence, fractional-order RC networks serve as effective models for describing this characteristic [24].
Figure 1b displays the fractional-order model of lithium-ion batteries, encompassing an open-circuit voltage source, an ohmic internal resistance, a Warburg element, and a polarization network. The polarization network consists of a polarization resistor and a constant phase element (CPE) connected in parallel. The difference between the terminal voltage V t and the open circuit voltage V ocv is defined as:
V ( t ) = V t ( t ) V ocv ( t )
The transfer function of the model can be expressed as:
V ( s ) I ( s ) = R 0 + R 1 Z cpe ( s ) R 1 + Z cpe ( s ) + Z w ( s )
where Z cpe and Z w denote the impedances of the CPE and Warburg elements, respectively. They are defined as:
Z cpe ( s ) = 1 C cpe s α
Z w ( s ) = 1 C w s β
where C cpe and C W represent the capacitive resistance coefficient and capacitance coefficient, respectively. α and β denote the derivative order of the CPE and Warburg elements, which are taken to be in the interval [0, 1]. Equation (2) is inversely transformed by Laplace to the time domain as follows:
C w β + R 1 C cpe C w α + β V ( t ) = 1 + R 0 + R 1 C w β + R 1 C cpe α + R 0 R 1 C cpe C w α + β I ( t )
where j (j = α, β, α + β) represents the jth order derivative, which is defined as Equation (6).
j g ( t ) = lim T 0 1 T j i = 0 t / T 1 i j i g ( t i T )
where g and T are the function and the sampling period, respectively. t / T is the memory length. The binary coefficient j i is expressed as Equation (7).
j i = j ! i ! j i = Γ ( j + 1 ) Γ ( i + 1 ) Γ ( j i + 1 )
where the Gamma function Γ ( x ) is defined as:
Γ ( x ) = 0 τ x 1 e τ d τ
where x is the independent variable. The terminal voltage can be expressed as:
V t ( t ) = V ocv ( t ) V cpe ( t ) R 0 I ( t ) V w ( t )
where V cpe and V w are the voltages of the CPE and Warburg elements, respectively. V ocv is a nonlinear function of the state of charge (SOC), as follows:
V ocv ( t ) = k 0 + k 1 S O C ( t ) + k 2 S O C ( t ) 2 + k 3 In S O C ( t ) + k 4 In 1 S O C ( t )
where k i (i = 0, 1, …, 4) is the function coefficient. SOC is defined as an ampere-hour integral form as Equation (11).
S O C ( t ) = S O C ( t 0 ) + η Q t 0 t I ( τ ) d τ
where Q , η , and t 0 denote the battery capacity, Coulombic efficiency, and initial time, respectively.

3. Parameter Identification

This work proposes a parameter identification method based on FDA for the fractional order model. The objective is to identify the model parameters by minimizing the root mean square error (RMSE) of the voltage. The objective function f is defined as follows:
f = g ( V t , V o c v , Θ ) = 1 N k = 1 N ( V t ( k ) V ^ t ( k , Θ ) ) 2 0.5
where V t and V ocv represent the sequence of measured voltage and open circuit voltage, respectively. N denotes the sequence length. V ^ t ( k ) denotes the estimated voltage at time k, which is described as Equation (9). Θ denotes the parameter vector, which is expressed as:
Θ = R 0 , R 1 , C cpe , C w , α , β
The FDA is a physics-based algorithm that simulates the flow direction of the exit point with the lowest height in a watershed [25]. The water flow moves to a neighbor with the lowest, highest, or best objective function. In the FDA algorithm, the initial location of the ith flow X f ( i ) is expressed as:
X f ( i ) = b l + ( b u b l ) × r a n d ( )
where b u and b l  are the upper and lower bounds of the decision variables, respectively. rand(⋅) is a random function with values between 0 and 1. The position of the jth neighborhood around the ith flow X f ( i ) is defined as:
X n ( j ) = X f ( i ) + Δ × r a n d ( )
where Δ denotes the neighborhood radius. A more significant value Δ is beneficial for global search, but it is challenging to find the optimal value. A smaller value Δ is beneficial for the algorithm to perform the refined search, but it is prone to falling into local optima. In order to balance the two aspects of the algorithm’s capabilities, Δ is taken as follows:
Δ = X r a n d × r a n d ( ) X f ( i ) × r a n d ( ) × X b e s t X f ( i ) × W
where X b e s t is the optimal decision vector. X r a n d is a randomized position, which is defined as:
X r a n d = i = 1 N R i φ × Δ t
where R i , Δ t , φ , and N represent rainfall, time interval, hourly rainfall (cm/h), and number of time steps, respectively. W is a nonlinear weight, which is defined as:
W = 1 n i t e r N max 2 × r a n d ( ) × V ˜ × n i t e r N max × V ˜
where n i t e r and N max are the current and maximum iterations, respectively. V ˜ is a random vector with uniform distribution. The flow velocity of the fluid is V , which is related to the slope gradient.
V = S × r a n d ( )
where the slope vector can be represented as:
S ( i , j , d ) = F f i t , f ( i ) F f i t , n ( j ) x f ( i , d ) x n ( j , d )
where S ( i , j , d ) is the slope vector in the dth direction of the ith flow to the jth neighbor. f f i t , f ( i ) and f f i t , n ( j ) are the objective function values for the ith flow to the jth neighbor, respectively. The new location of the ith flow X f , n e w ( i ) can be represented as:
X f , n e w ( i ) = X f ( i ) + V × X f ( i ) X n ( j ) x f ( i ) x n ( j )
If the objective function of a neighboring flow is found to be smaller than the objective function of the current flow, the flow will move in the same direction as the neighboring flow. On the other hand, if the objective function of the neighboring flow is greater, the flow will move in the direction of the dominant slope. This process can be formulated as:
X f , n e w ( i ) = X f ( i ) + V ˜ × X f ( r ) X f ( i ) F f i t , f ( r ) < F f i t , f ( i ) X f , n e w ( i ) = X f ( i ) + 2 X b e s t X f ( i ) × r a n d ( ) F f i t , f ( r ) F f i t , f ( i )
where f f i t , f ( r ) is the fitness function of the neighbor flow. The pseudo-code of the FDA-based parameter identification of fractional-order models is shown in Table 1.

4. Experiments and Discussions

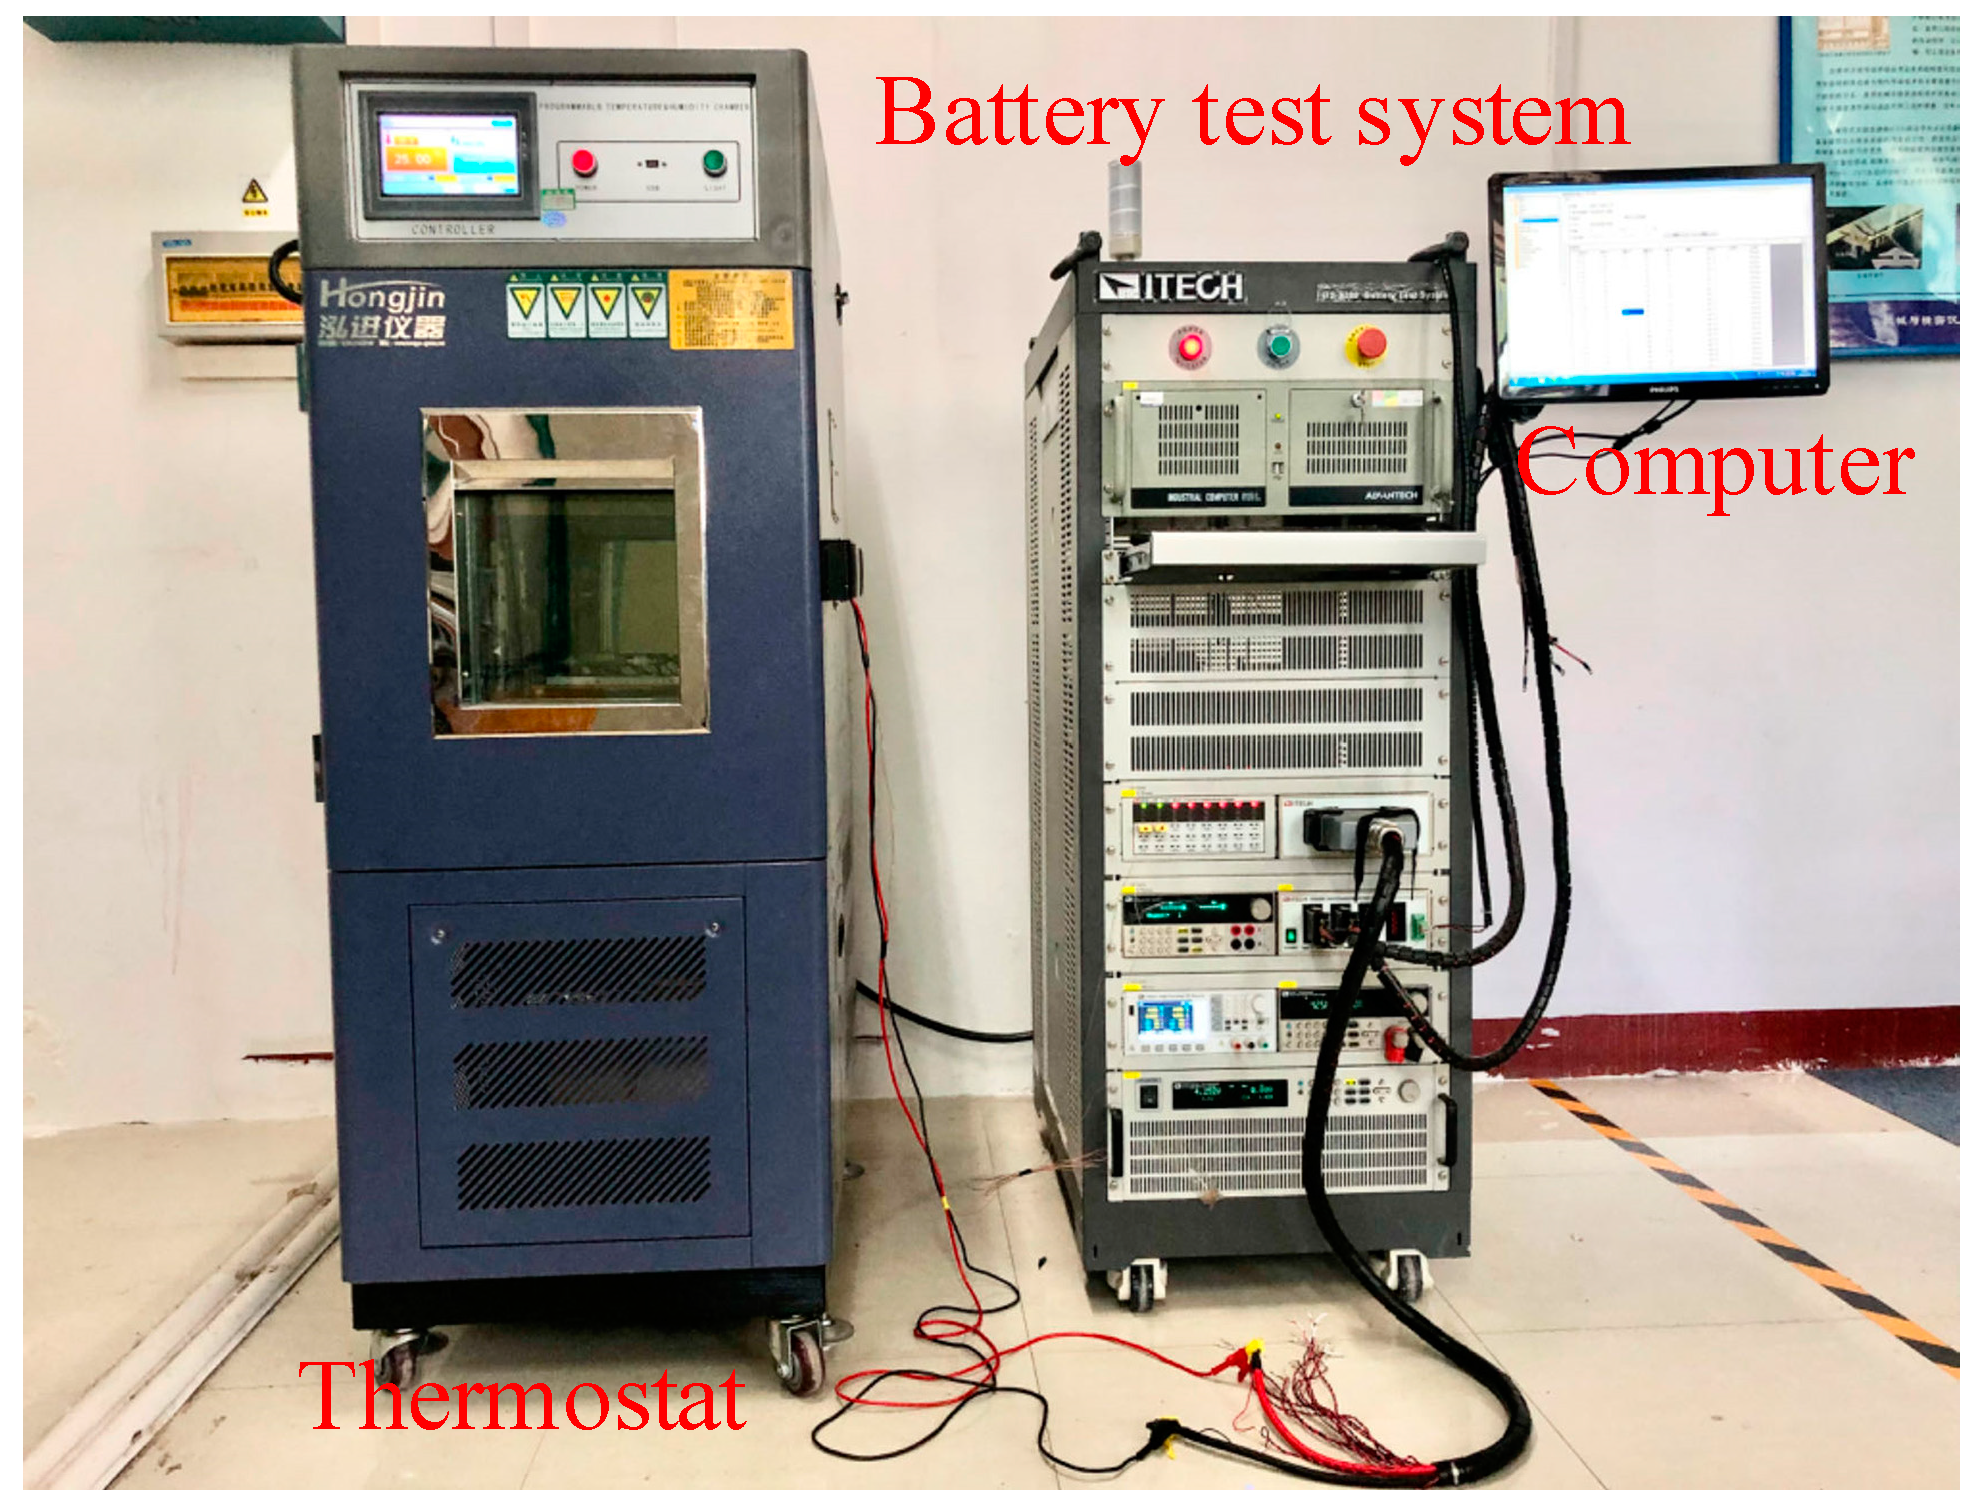
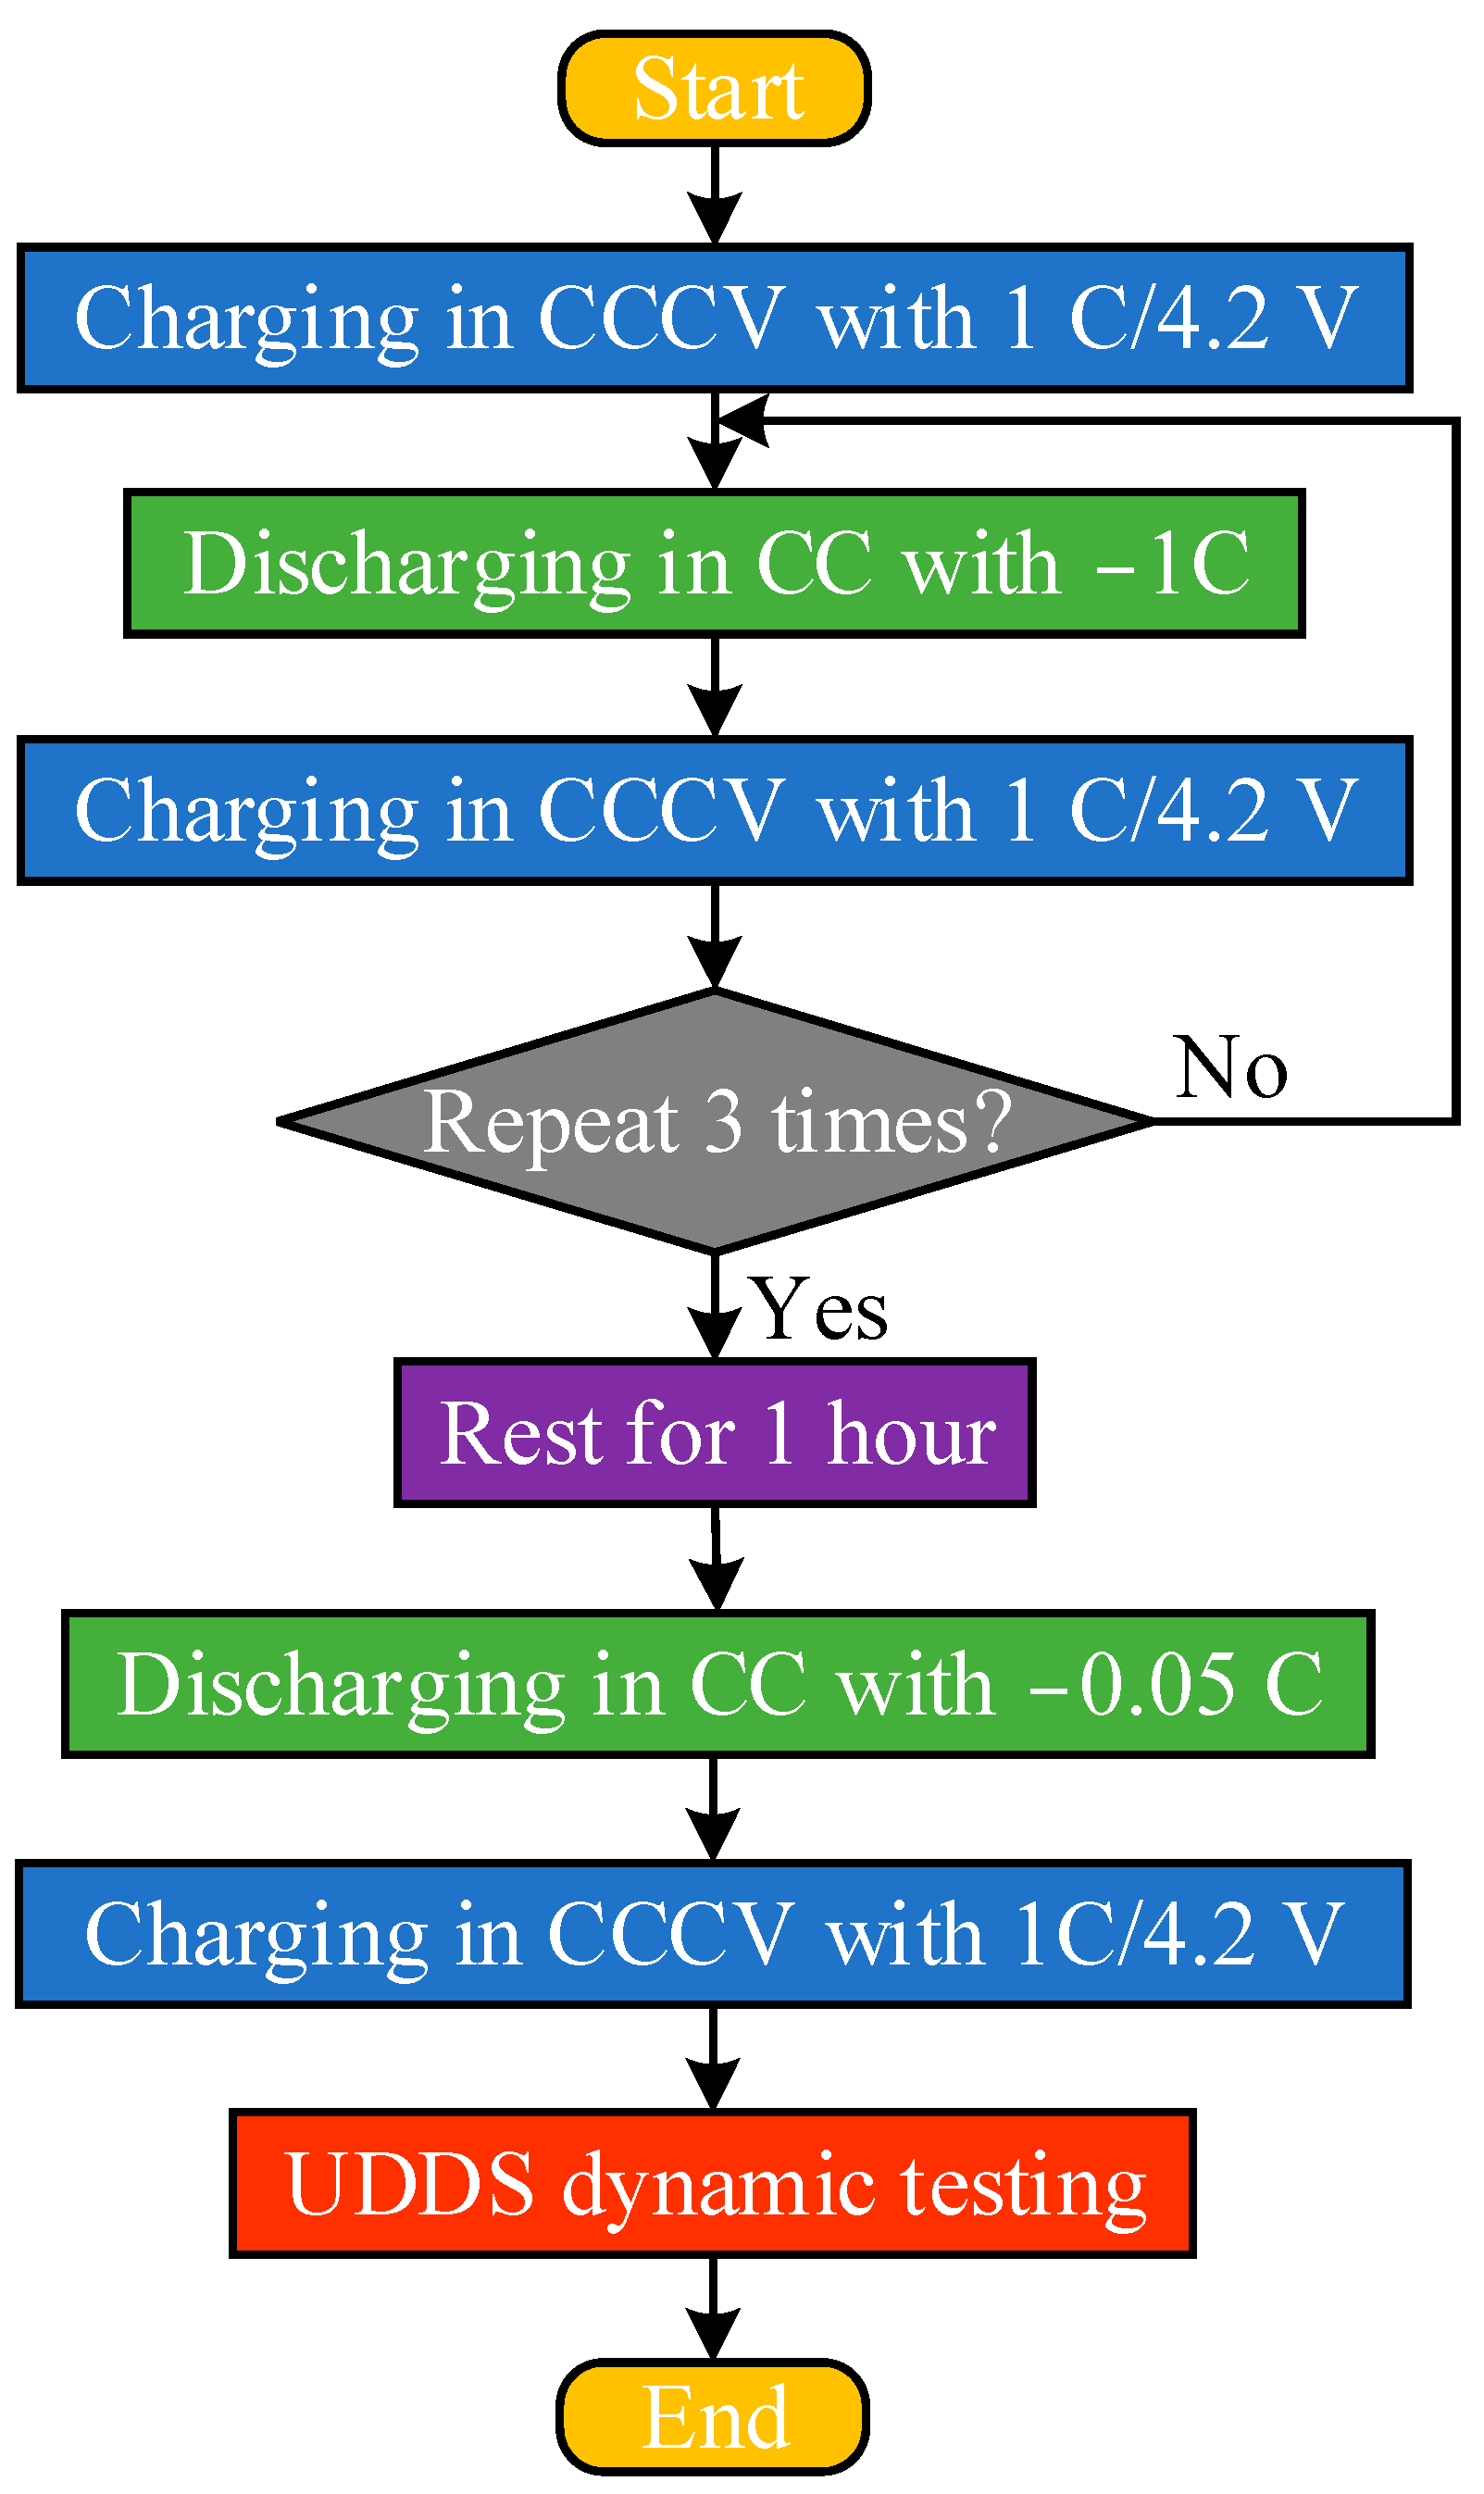
4.1. Experimental Platforms and Schemes

To validate the efficacy of the proposed scheme, an experimental platform is set up, as depicted in Figure 2. The platform comprises a battery testing system (ITECH ITS5300), a thermostat (HJ-223251), and an industrial computer. It is employed to perform battery open circuit voltage (OCV) and dynamic voltage testing. The parameters of the tested battery can be found in Table 2. Detailed parameters can be found in Ref. [26].
In Figure 3, the capacity and OCV testing schemes are presented. The battery undergoes three cycles of constant current constant voltage (CCCV) charging and constant current (CC) discharging. The average discharge capacity obtained from these cycles represents the actual capacity of the battery. To ensure that the battery can be fully charged, the charging current is set at 1 C, the maximum voltage is limited to 4.2 V, and the cut-off current is 0.03 C in CCCV charging. For the constant current discharge, the discharge current is −1 C, and the cut-off voltage is 3.0 V. Before OCV testing, the battery is rested for 1 h. The purpose of battery shelving is to achieve electrochemical balance within the battery to eliminate internal polarization effects. Then, the battery is discharged with the current of −0.05 C for battery OCV testing. When the OCV testing is completed, the battery is fully charged using CCCV. Subsequently, the battery is subjected to dynamic testing under urban dynamometer driving schedule (UDDS) conditions.

4.2. Parameter Identification and Validation

The coefficients of the OCV-SOC function are determined by fitting. The function coefficients are listed in Table 3. The identification results of battery 1# are shown in Figure 4. The UUDS working condition is an internationally standardized battery testing condition that can effectively capture the internal parameters of the battery [27]. Its current profile is plotted in Figure 4a. In this work, the DA, SSA, PSO, and ALO algorithms were compared with FDA in parameter identification. The boundary ranges of the parameters are listed in Table 4. Figure 4b shows the voltage estimation results. It can be seen that the estimated voltage and measured values have a good degree of coincidence. The voltage errors are basically not within ±15 mV, as shown in Figure 4c. The mean absolute error (MAE) [28], RMSE [29], and parameter identification results are listed in Table 5. The FDA algorithm has the lowest RMSE and MAE, which means it has a higher identification accuracy. Figure 4d shows the fitness curves of algorithms. The FDA algorithm converges with lower fitness values in approximately the 28th generation. The identification results of the other 23 batteries are listed in Table 6.

4.3. Clustering-Based Battery Classification

Clustering is an unsupervised learning method that classifies samples into different categories or clusters based on their similarity. In the context of battery classification problems, clustering algorithms can identify similarities among battery samples. In this study, battery parameters are utilized as clustering features. To reduce feature redundancy, the correlation between parameters is analyzed using the Pearson correlation coefficient. The absolute values of the correlations between the six features are visualized in a thermal map (Figure 5). The range of Pearson correlation coefficient values is [−1, 1], where 1 represents complete positive correlation, −1 represents complete negative correlation, and 0 represents no correlation. Based on the correlation coefficient, features with a higher correlation can be selected for preservation, while features with a lower correlation can be ignored for feature dimensionality reduction. When the correlation coefficient between two samples exceeds 0.5, it indicates a relatively strong correlation [30]. From the thermal map, we observe that the absolute values of the correlation between R0 and Ccpe, R1 and α, and α and β are 0.7231, 0.7314, and 0.5224, respectively. These correlations exceed the threshold of 0.5, signifying a strong association between the corresponding parameters. Consequently, we reduce the feature dimensionality to [R0, Cw, α], which effectively captures the battery’s characteristics at high, low, and medium frequencies.
The K-means clustering algorithm is a widely utilized unsupervised classification technique. Its objective is to minimize the sum of squared errors (SSE) within each cluster, ensuring that samples within the same cluster are as similar as possible, while samples between different clusters are as dissimilar as possible. This algorithm is known for its simplicity and efficiency, as it facilitates fast calculations. However, one drawback is its sensitivity to the initial selection of clustering centers, which can result in convergence to local optima. In order to address this issue, we employ the GWO algorithm to optimize the selection of centers for the K-means algorithm. The fitness value reflects the similarity between data objects within each class, and a smaller fitness value indicates a closer degree of integration of data within the class, resulting in a better clustering performance. In this work, the sum of Euclidean distances from the intra class data to the cluster center is used as the fitness value. The objective function is constructed as follows:
J = i = K j = 1 N i d i s t C i j , C e n t e r i
where J is the fitness value. K is the number of categories. Ni is the total number of samples included in ith category. Centeri and Cij are the ith cluster center and the jth sample, respectively. Due to the normalization of the samples, the range of Centeri is [0, 1]. This integration helps to enhance the overall performance of the clustering process.The principle of the improved K-means is summarized in Table 7.
Figure 6 presents the effectiveness of the two algorithms in battery classification. In Figure 6a, the fitness function value of the GWO is plotted. It can be observed that convergence occurs around the 85th generation. To avoid the impact of feature dimension and magnitude on clustering performance, features are normalized before clustering. Figure 6b,c depict the clustering performance of the K-means algorithm before and after improvement, respectively. In the traditional K-means algorithm, the clustering effect is relatively average. Due to its sensitivity to the initial clustering centers, the algorithm is prone to falling into local optima, which may result in deviations or inaccuracies in the clustering results. However, after applying the Grey Wolf algorithm to optimize the K-means algorithm, the selection of clustering centers is improved. As a result, the clustering effect is enhanced. The GWO effectively boosts overall clustering performance by simulating the collaborative search behavior of individuals in a grey wolf population. This simulation leads to more accurate and stable clustering results. In order to better quantify the clustering performance of algorithms, the SSE, silhouette coefficient (SC), Davies–Bouldin (DB), and Calinski–Harabasz (CH) indexes are adopted, which are defined as follows:
S S E = k = 1 K x i C k x i μ k 2
where K and Ck represent the number of categories and the k-th category, respectively. xi and μk represent the i-th sample and the centers of the k-th category, respectively. The smaller the SSE, the more accurately the sample is classified.
S C = 1 N i = 1 N b ( i ) a ( i ) max { a ( i ) , b ( i ) }
where N is the total number of samples. a(i) is the average distance of the i-th sample in its own category. b(i) is the average distance of the i-th sample in another category closest to it. SC represents the ratio of the average distance between each sample and its cluster to the average distance from the nearest cluster, with a value close to 1, indicating better clustering.
D B = 1 N i = 1 N max ( j i ) σ i + σ j d ( c i , c j )
where σs (s = i, j) represents the degree of dispersion of the s-th category. d(·) represents the distance between the centers of the i-th and j-th category. DB represents the ratio of the average distance between clusters to the average distance within the cluster, with a smaller value indicating a better clustering performance.
C H = t r ( B k ) ( N K ) t r ( W k ) ( K 1 )
B k = j = 1 k n j c j c e c j c e T
W k = j = 1 k x c j x c j x c j T
where tr(Bk) represents the trace of the dispersion matrix between categories. tr(Wk) represents the trace of the intra-category dispersion matrix. Ce represents the center of the dataset. nj represents the number of samples in the j-th category. CH represents the ratio of the variance between clusters to the variance within clusters, with a more significant value indicating a better clustering performance.
The quantitative results of the four indexes are depicted in Figure 6d and Table 8. Comparative to the traditional K-means algorithm, the improved K-means algorithm exhibits a reduction of approximately 19.85% and 19.72% in SSE and DB, respectively. Moreover, in terms of SC and CH, the improved K-means algorithm showcases an improvement of about 10.64% and 22.59%, respectively. The main reasons can be summarized as follows. The K-means algorithm optimized by the GWO algorithm achieves a higher accuracy in battery classification. This is primarily due to the fact that the K-means algorithm, when enhanced by the GWO algorithm, can effectively identify optimal clustering centers. Consequently, the battery samples are more accurately categorized. On the contrary, the traditional K-means algorithm is more susceptible to limitations in the selection of initial clustering centers, thereby resulting in a lower classification accuracy. Overall, the improved K-means clustering algorithm has a better classification ability.

5. Conclusions

In the context of electric vehicles and renewable energy storage systems, lithium-ion batteries serve as crucial energy storage devices. Therefore, accurately classifying their performance is of significant importance. This research introduces a battery classification approach that leverages impedance spectrum features and an improved K-means algorithm. The methodology begins with conducting an impedance spectroscopy test on lithium-ion batteries to obtain their electrochemical impedance spectra at various frequencies. Subsequently, a fractional order model of the battery is established. To identify impedance parameters, an algorithm based on the FDA is proposed. Furthermore, the Pearson correlation coefficient is employed to measure the correlation between the obtained features, facilitating dimensionality reduction. This step aids in reducing the complexity of the dataset without sacrificing critical information. An improved K-means algorithm is proposed for battery classification. This enhancement involves optimizing the initial centers of the K-means algorithm using the GWO algorithm. By integrating GWO, the clustering process is improved, leading to more accurate and stable battery classification. The experimental results demonstrate that the proposed method achieves high accuracy and stability in lithium-ion battery classification tasks. This approach holds promise for effectively assessing the performance of lithium-ion batteries in practical applications. In our future research endeavors, we will expand our exploration of battery mechanisms and behavioral consistency features, including electrical, thermal, and health characteristics. We will attempt to explore the mapping relationship between internal and external characteristics of batteries and reveal the evolution mechanism of battery pack consistency. Furthermore, we plan to enhance the development of battery classification algorithms, striving for greater efficiency.

Author Contributions

Conceptualization, Q.Z.; methodology, Q.Z. and J.T.; formal analysis, Z.Y., X.L. and T.P.; data curation, Z.Y., X.L. and T.P.; writing—original draft preparation, Q.Z. and J.T.; writing—review and editing, Q.Z. and J.T.; project administration, Q.Z. and J.T.; funding acquisition, Q.Z. and J.T. All authors have read and agreed to the published version of the manuscript.

Funding

This work is supported in part by the Science and Technology Project of State Grid Ningxia Electric Power Co., Ltd. (No. 5229DK23000N), in part by the Ningxia Natural Science Foundation Project (No. 2022AAC03625).

Data Availability Statement

Not applicable.

Conflicts of Interest

The authors declare no conflict of interest.

References

  1. Lyu, Z.; Zhang, Y.; Wang, G.; Gao, R. A semiparametric clustering method for the screening of retired Li-ion batteries from electric vehicles. J. Energy Storage 2023, 63, 107030. [Google Scholar] [CrossRef]
  2. Zhang, M.; Liu, Y.; Li, D.; Cui, X.; Wang, L.; Li, L.; Wang, K. Electrochemical impedance spectroscopy: A new chapter in the fast and accurate estimation of the state of health for lithium-ion batteries. Energies 2023, 16, 1599. [Google Scholar] [CrossRef]
  3. Liu, X.; Chang, G.; Tian, J.; Wei, Z.; Zhang, X.; Wang, P. Flexible path planning-based reconfiguration strategy for maximum capacity utilization of battery pack. J. Energy Chem. 2023, 86, 362–372. [Google Scholar] [CrossRef]
  4. Lai, X.; Deng, C.; Tang, X.; Gao, F.; Han, X.; Zheng, Y. Soft clustering of retired lithium-ion batteries for the secondary utilization using Gaussian mixture model based on electrochemical impedance spectroscopy. J. Clean. Prod. 2022, 339, 130786. [Google Scholar] [CrossRef]
  5. Zhou, P.; He, Z.; Han, T.; Li, X.; Lai, X.; Yan, L.; Lv, T.; Xie, J.; Zheng, Y. A rapid classification method of the retired LiCoxNiyMn1−x−yO2 batteries for electric vehicles. Energy Rep. 2020, 6, 672–683. [Google Scholar] [CrossRef]
  6. Liu, C.; Tan, J.; Shi, H.; Wang, X. Lithium-ion cell screening with convolutional neural networks based on two-step time-series clustering and hybrid resampling for imbalanced data. IEEE Access 2018, 6, 59001–59014. [Google Scholar] [CrossRef]
  7. Liu, K.; Hu, X.; Zhou, H.; Tong, L.; Widanage, W.; Marco, J. Feature analyses and modeling of lithium-ion battery manufacturing based on random forest classification. IEEE/ASME Trans. Mechatron. 2021, 26, 2944–2955. [Google Scholar] [CrossRef]
  8. Marchetti, F.; Perracchione, E. Local-to-global support vector machines (LGSVMs). Pattern Recognit. 2022, 132, 108920. [Google Scholar] [CrossRef]
  9. Zhou, Z.; Duan, B.; Kang, Y.; Shang, Y.; Cui, N.; Chang, L.; Zhang, C. An efficient screening method for retired lithium-ion batteries based on support vector machine. J. Clean. Prod. 2020, 267, 121882. [Google Scholar] [CrossRef]
  10. Lai, X.; Huang, Y.; Deng, C.; Gu, H.; Han, X.; Zheng, Y.; Ouyang, M. Sorting, regrouping, and echelon utilization of the large-scale retired lithium batteries: A critical review. Renew. Sustain. Energy Rev. 2021, 146, 111162. [Google Scholar] [CrossRef]
  11. Tian, J.; Wang, Y.; Liu, C.; Chen, Z. Consistency evaluation and cluster analysis for lithium-ion battery pack in electric vehicles. Energy 2020, 194, 116944. [Google Scholar] [CrossRef]
  12. Tian, J.; Liu, X.; Chen, C.; Xiao, G.; Wang, Y.; Kang, Y.; Wang, P. Feature fusion-based inconsistency evaluation for battery pack: Improved gaussian mixture model. IEEE Trans. Intell. Transp. Syst. 2023, 24, 446–458. [Google Scholar] [CrossRef]
  13. Lai, X.; Deng, C.; Li, J.; Zhu, Z.; Han, X.; Zheng, Y. Rapid sorting and regrouping of retired lithium-ion battery modules for echelon utilization based on partial charging curves. IEEE Trans. Veh. Technol. 2021, 70, 1246–1254. [Google Scholar] [CrossRef]
  14. Zhou, Z.; Ran, A.; Chen, S.; Zhang, X.; Wei, G.; Li, B.; Kang, F.; Zhou, X.; Sun, H. A fast screening framework for second-life batteries based on an improved bisecting K-means algorithm combined with fast pulse test. J. Energy Storage 2020, 31, 101739. [Google Scholar] [CrossRef]
  15. Feng, X.; Zhang, X.; Xiang, Y. An inconsistency assessment method for backup battery packs based on time-series clustering. J. Energy Storage 2020, 31, 101666. [Google Scholar] [CrossRef]
  16. Wang, L.; Ke, J.; Zhan, M.; Aina, T. Efficient and fast active equalization method for retired battery pack using wide voltage range bidirectional converter and DBSCAN clustering algorithm. IEEE Trans. Power Electron. 2022, 37, 13824–13833. [Google Scholar]
  17. Li, M.; Wang, L.; Wang, Y.; Chen, X.; Chen, Z. A framework for states co-estimation of hybrid energy storage systems based on fractional-order theory. IEEE J. Emerg. Sel. Top. Power Electron. 2023, 11, 224–233. [Google Scholar] [CrossRef]
  18. Zhu, Y.; Zhu, J.; Jiang, B.; Wang, X.; Wei, X.; Dai, H. Insights on the degradation mechanism for large format prismatic graphite/LiFePO4 battery cycled under elevated temperature. J. Energy Storage 2023, 60, 106624. [Google Scholar] [CrossRef]
  19. Yu, Q.; Dai, L.; Xiong, R.; Chen, Z.; Zhang, X.; Sheng, W. Current sensor fault diagnosis method based on an improved equivalent circuit battery model. Appl. Energy 2022, 310, 118588. [Google Scholar] [CrossRef]
  20. Xiong, R.; Tian, J.; Shen, W.; Lu, J.; Sun, F. Semi-supervised estimation of capacity degradation for lithium ion batteries with electrochemical impedance spectroscopy. J. Energy Chem. 2023, 76, 404–413. [Google Scholar] [CrossRef]
  21. Singh, A.; Kim, M.; Meena, A.; Wi, T.; Lee, H.; Kim, K. Na/Al Codoped layered cathode with defects as bifunctional electrocatalyst for high-performance Li-ion battery and oxygen evolution reaction. Small 2021, 17, 2005605. [Google Scholar] [CrossRef]
  22. Du, X.; Meng, J.; Peng, J.; Peng, Q.; Wu, J.; Lin, M. A two-stage optimization framework for fast Lithium-ion battery impedance measurement. IEEE Trans. Power Electron. 2023, 38, 5659–5664. [Google Scholar] [CrossRef]
  23. Tang, X.; Lai, X.; Liu, Q.; Zheng, Y.; Zhou, Y.; Ma, Y.; Gao, F. Predicting battery impedance spectra from 10-second pulse tests under 10 Hz sampling rate. IScience 2023, 26, 106821. [Google Scholar] [CrossRef]
  24. Wang, Y.; Zhao, G.; Li, X.; Chen, Z. A fractional-order model-based state estimation approach for lithium-ion battery and ultra-capacitor hybrid power source system considering load trajectory. J. Power Sources 2020, 449, 227543. [Google Scholar] [CrossRef]
  25. Karami, H.; Anaraki, M.; Farzin, S.; Mirjalili, S. Flow direction algorithm (FDA): A novel optimizer approach for solving optimization problems. Comput. Ind. Eng. 2021, 156, 107224. [Google Scholar] [CrossRef]
  26. Liu, X.; Li, Y.; Kang, Y.; Zhao, G.; Dun, B.; Zhang, C. An accurate co-estimation of core temperature and state of charge for Lithium-ion batteries with electro-thermal model. IEEE J. Emerg. Sel. Top. Power Electron. 2023. [Google Scholar] [CrossRef]
  27. Wu, L.; Liu, K.; Liu, J.; Pang, H. Evaluating the heat generation characteristics of cylindrical lithium-ion battery considering the discharge rates and N/P ratio. J. Energy Storage 2023, 64, 107182. [Google Scholar] [CrossRef]
  28. Feng, F.; Song, B.; Xu, J.; Na, W.; Zhang, K.; Chai, Y. Multiple time scale state-of-charge and capacity-based equalisation strategy for lithium-ion battery pack with passive equalizer. J. Energy Storage 2022, 53, 105196. [Google Scholar] [CrossRef]
  29. Tang, X.; Zhou, Y.; Gao, F.; Lai, X. Joint estimation of state-of-charge and state-of-health for all cells in the battery pack using “leader-follower” strategy. Etransportation 2023, 15, 100213. [Google Scholar] [CrossRef]
  30. Lin, M.; You, Y.; Meng, J.; Wang, W.e.i.; Wu, J.; Stroe, D. Lithium-ion batteries SOH estimation with multimodal multilinear feature fusion. IEEE Trans. Energy Convers. 2023. [Google Scholar] [CrossRef]
Figure 1. Battery model. (a) Nyquist diagram of battery. (b) Fractional order model.
Batteries 09 00491 g001
Figure 2. The experimental platform.
Batteries 09 00491 g002
Figure 3. Flowchart of battery testing schemes.
Batteries 09 00491 g003
Figure 4. Parameter identification results. (a) Current. (b) Voltage. (c) Errors. (d) Fitness values.
Batteries 09 00491 g004
Figure 5. Thermodynamic diagram of parameter correlation.
Batteries 09 00491 g005
Figure 6. Battery classification: (a) GWO algorithm fitness value. (b) Improved K-means algorithm classification results. (c) K-means algorithm classification results. (d) Evaluation indexes.
Batteries 09 00491 g006
Table 1. The pseudo-code of the FDA-based parameter identification.
Require: The number of flows N, the maximum number of iterations Nmax, upper and lower bounds of decision variables bu, bl, etc.
  1. Initialize the positions of flows:
  2.       Xf = [X1, X2, …, XN]T, Xi = [ x 1 i , x 2 i , …, x d i ]
  3. Calculate the fitness function for each flow.
  4.       Ffit = [ffit,1, ffit,2, …, ffit,N]
  5. Sort the results and select the best result.
  6. Initialize the velocity of flows.
  7.       Vmax = 0.1 × (bubl), Vmin = −0.1 × (bu − bl)
  8. For (niter = 1 to Nmax) do
  9.   Update the nonlinear weight as Equation (18).
  10.   For (i = 1 to α) do
  11.     For (j = 1 to β) do
  12.       Calculate the location of the ith flow as Equation (14).
  13.       Calculate the neighborhood radius as Equation (15).
  14.       Calculate the fitness value of neighbor flow Ffin,n(j).
  15.     End for
  16.     Sort position of neighborhoods as [~,indx] = sort(Ffin,n).
  17.     If Ffin,n(indx(1)) < Ffin,f(i)
  18.       Calculate the slope to the neighborhood as Equation (20).
  19.       Update the velocity of each flow as Equation (19).
  20.      If V < Vmin than
  21.       V = −Vmin
  22.      else V > Vmax than
  23.       V = −Vmax
  24.      End if
  25.      Flow moves to the best neighborhood as Equation (21).
  26.      Flow moves to rth flow as Equation (22).
  27.   End for
  28.   Calculate the fitness function of new flow Ffit,f,new(i).
  29.   If Ffit,f,new(i) < Ffit,f(i)
  30.     Xf(i) = Xf,new(i)
  31.     Ffit,l(i) = Ffit,f,new(i)
  32.   End if
  33.   If Ffit,l(i) < Ffit,best
  34.     Xbest = Xfit,l(i)
  35.     Ffit,best = Ffit,l(i)
  36.   End if
  37. End for
Table 2. The parameters of the tested battery [26].
ParametersValuesUnits
Nominal capacity2500mAh
Nominal voltage3.6V
Maximum charge voltage4.2V
Minimum discharge voltage3.0V
Operating temperature−20~+60°C
Cathode materialNickel-cobalt-manganese-
Anode materialGraphite-
Table 3. The coefficients of OCV-SOC function.
Coefficientsk0k1k2k3k4
Values3.9194−0.82591.11410.16560.0062
Table 4. The boundary range of parameters.
BoundaryR0 (Ω)R1 (Ω)Ccpe (F/sα)Cw (F/sβ)αβ
Lower0.050.0550500.30.3
Upper0.50.712040001.01.0
Table 5. Identification results of battery parameters.
AlgorithmsR0 (Ω)R1 (Ω)Ccpe (F/sα)Cw (F/sβ)αβRMSE/VMAE/V
FDA0.01860.021597.123801.340.5390.3030.01230.0087
DA0.02300.020119.371039.320.3020.4300.01260.0091
SSA0.01410.024651.401407.230.4150.3200.01230.0088
PSO0.03500.2054100.943901.520.3010.3080.01310.0093
ALO0.00720.025220.020630.900.4700.3220.01240.0088
Table 6. Identification results of battery parameters.
CellR0 (Ω)R1 (Ω)Ccpe (F/sα)Cw (F/sβ)αβ
1#0.01980.019899.753986.390.3620.769
2#0.01860.021597.123801.340.53930.3026
3#0.01810.024595.981924.540.55610.3049
4#0.01650.027689.213716.700.44730.3130
5#0.01830.023990.523999.860.30720.7709
6#0.02290.028495.993989.250.32230.7604
7#0.01840.024196.683994.720.30660.7596
8#0.00980.030332.233894.950.36020.3040
9#0.01220.026140.003655.870.47520.3254
10#0.01850.026192.833971.760.51830.3387
11#0.01810.013461.373823.720.84890.3053
12#0.01900.036094.363899.550.37490.3019
13#0.02120.015394.043912.600.67210.3142
14#0.01790.018590.08351.670.49210.3047
15#0.02030.046385.692754.040.34860.3128
16#0.02030.015194.363709.590.77670.3103
17#0.01810.002286.213943.020.94570.3004
18#0.02170.024593.803605.420.55730.3099
19#0.02090.026796.613718.610.46810.3188
20#0.02100.020994.633702.660.57480.3053
21#0.01840.027898.473717.060.40500.3028
22#0.02280.012593.513825.610.60300.3327
23#0.01700.021722.883037.730.82040.3013
Table 7. The principle of the improved K-means.
1: Initialize the number of cluster centers K, generate K grey wolves (cluster centers) randomly, and calculate initial fitness.
2: Determine the current optimal Alpha Grey Wolves, suboptimal Beta Grey Wolves, and third-best Delta Grey Wolves based on their fitness.
3: The positions of other wolves are updated based on the positions of Alpha, Beta, and Delta Grey Wolves.
4: Recalculate the fitness of each grey wolf based on its new location.
5: If the termination condition is met (reaching the maximum number of iterations or fitness reaching a threshold), the algorithm ends. Otherwise, return to Step 3.
6: The output result shows that the final Alpha Grey Wolf position is the optimized K-means clustering center.
Table 8. Clustering evaluation indexes.
AlgorithmsSSEDBSCCH
K-means1.31861.69850.564213.4763
Improved K-means1.10021.41870.631417.4081
Disclaimer/Publisher’s Note: The statements, opinions and data contained in all publications are solely those of the individual author(s) and contributor(s) and not of MDPI and/or the editor(s). MDPI and/or the editor(s) disclaim responsibility for any injury to people or property resulting from any ideas, methods, instructions or products referred to in the content.

