Abstract
This paper presents the simulations of the cooling system of a battery pack (BTPC) consisting of lithium-ion (LIN) plate batteries. The BTPC includes six battery cells (BTCL) in two rows with three BTCLs, which are placed in a channel with one inlet and two outlets. The laminar and steady airflow flows in the channel. Phase-change material (PCM)-filled rectangular cubic enclosures enclose every BTCL. Transiently adjusting the cavity aspect ratio (AR) every 6000 s is how this investigation is conducted. For four values of AR, the values of the PCM volume percentage surrounding each BTCL in the BTPC, and the temperature of each BTCL are calculated. The simulations are performed using the FEM and COMSOL software. The results demonstrate that the maximum changes in temperature of the battery (TOB) pack by changing the AR occur when the TOB pack is reduced. The maximum temperature reduction at this time is 1.88 °C which occurs between AR2 and AR4 at 720 s. The maximum temperature corresponds to AR3 and AR4 and the minimum one is related to AR1 and AR2. From 1260 to 3500 s, the effect of AR on PCM volume fraction is maximal. The value of solid PCM for AR1 and AR2 is higher than that for AR3 and AR4 at different times. Additionally, an increment in the value of the AR enhances the amount of channel pressure drop by 14%.
1. Introduction
The need for energy sources is felt more and more with the progress of science and technology as well as the enhancement of industrial and non-industrial production due to the increase in population and the emergence of new requirements [1,2,3,4]. On the other hand, the availability of these resources and their portability, as well as the quality and form of energy that these resources provide to consumers, are crucial [5,6,7,8,9]. One of these sources of energy storage is LIN batteries, which store electrical energy [10,11,12,13,14], one of the highest quality energies, and supply it to the system when necessary. However, one of the major problems with LIN batteries is their temperature enhancement during processes of the discharging and charging [15]. Therefore, many works have been conducted on enhancing the heat transfer rate in these batteries [16]. Conversion, consumption, and recycling of energy in many processes; evaporation and condensation of refrigerants used in ventilation and cooling systems; and cooling of machines and electronic equipment include the heat exchange process [17,18]. Improving the performance of heat transfer devices enhances efficiency and reduces the cost of designing and fabricating these systems [19]. The need to improve the efficiency of heat exchangers, which affects the cost, materials, and energy required, leads to the use of methods to increase heat transfer [20]. Therefore, different techniques are assessed by various investigators to cool the batteries [21,22].
Xiao et al. [23] examined the thermal conductivity of a system consisting of paraffin with a melting temperature of 60 °C, copper and nickel metal foams with a porosity of 97%, and a number of holes of 25.5 per inch experimentally. They observed that copper and nickel foams enhance the effective thermal conductivity coefficient by 15 and 3 times, respectively, while the latent heat of paraffin foam composite was about 22–30% less than pure paraffin. In addition, they demonstrated that if the process of filling metal foam with paraffin is done in the absence of gas and under vacuum pressure, better saturation of the PCM (up to 7%) is obtained in the porous medium. Based on the thermal management (TMGT) of the LIN battery, Wang et al. [24] conducted experimental research on the heat storage capacity of paraffin and paraffin–aluminum foam composite. By maintaining the temperature of the LIN battery within the permitted range, they discovered that paraffin foam composite had an excellent impact on the cooling process. By using 27 thermocouples, they evaluated the temperature distribution in different directions. Their results revealed that adding aluminum foam to paraffin, in addition to creating temperature uniformity in the PCM by enhancing the melting process of paraffin, reduces the heat storage time by approximately 25% in heat fluxes of 7000 and 12,000 W/m2 compared to pure paraffin. Li et al. [25] experimentally assessed a passive TMGT system for high-power LIN batteries with PCM. They considered three states involving free convective heat transfer metal-foam–paraffin composite with different porosities and densities and pure paraffin. The TOB using the air-cooled method exceeded the safety temperature of 65 °C, but it was able to maintain the temperature within the safe range by using the PCM. The metal-foam–paraffin composite lowered the TOB to the minimum value and provided a uniform temperature distribution for the BTPC. By comparing the porosities of 90 to 97, they found that the TOB surface is reduced by decreasing the porosity at a constant density due to the dominant effect of conductive heat transfer and the increment in the effective surface. In addition, they found that the permeability and natural flow of liquid paraffin are reduced, and the TOB surface is enhanced with the number of holes. Jilte et al. [26] numerically and experimentally examined the impact of PCM on the TMGT of cylindrical LIN batteries by dividing the cavity filled with PCM. Their results showed that their system could keep the TOB below 46 °C. Choudhari et al. [27] evaluated the effect of PCM and various types of blades. Their findings showed that the improved system performs better than the standard PCM module. The modified module also enhanced convective heat transmission in the outer shell and improved conductive heat transfer in the PCM. For the present rates of 2C and 3C, it was discovered that the TOB decreased by 2.38% and 9.28%, respectively.
LIN batteries are one of the broadest types of rechargeable batteries employed in industry and human daily life. Many devices, including mobile phones, laptops, tablets, etc., utilize these types of batteries and their performance depends on these batteries [28,29]. Furthermore, the application of many industrial and military devices, such as satellites, spacecrafts, telecommunication devices, etc., depends on this type of battery. For this reason, numerous investigators have performed their studies in the field of this type of battery. The innovations of the present work are the geometry of the battery pack, its cooling system, including the use of PCM and airflow, three-dimensional analysis, and the examination of the effect of changing AR of the PCM enclosure.
2. Problem Definition
Figure 1 illustrates a schematic of the present problem, including six LIN batteries placed in a channel. Six batteries are placed inside a cavity filled with PCM. The heat generated (HGT) in the battery is given to the PCM and causes it to melt. On the other hand, the air inside the channel receives heat from the PCM and transfers the heat to the environment. The airflow enters from the inlet at constant velocity and temperature (293.15 K) and a fully developed uniform flow exits from the other. The no-slip boundary condition is imposed on the walls. According to the figure, the amount of AR in the cavity filled with PCM changes, and its effect on the TOB is examined. There is conductive heat transfer between the walls of the PCM and the battery, and there is convective heat transfer on the PCM wall.
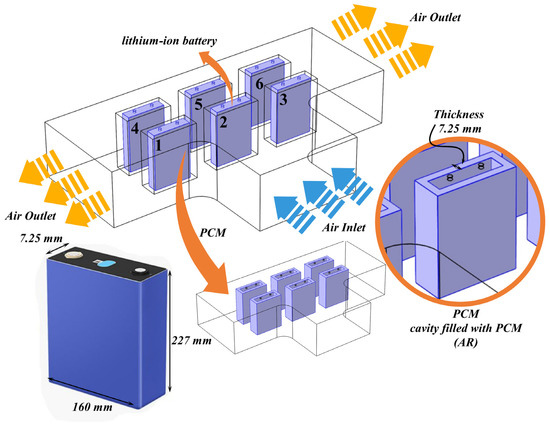
Figure 1.
Schematic of the present problem.
3. Governing Equations
To simulate the electrochemical processes in batteries, COMSOL uses a one-dimensional electrochemical thermal model. This paragraph explains the basic mathematical model of the battery. The reaction kinetics and parameters are covered in great detail by Doyle et al. [30]. The structure of LIN batteries is used to illustrate the model’s multiple components, which include two composite electrodes on each side and a separator space in the center. The solution phase of the composite electrode is described by the following equations [31]:
The following is a description of composite electrodes from the solid phase equations [31]:
The Butler–Volmer kinetic equation for both phases of the composite electrode and the boundary conditions at the electrode’s outer radius are as follows [31]:
where the reaction rate constants for both forward and reverse processes are combined to form k.
The forward and reverse speeds are increased in power based on the charge transport coefficients at the electrode surface. The following is a possible form for the equation involving k and i0:
3D temperature distribution inside batteries during discharging, charging, and resting periods may be determined using the energy balance for a battery [32]:
The battery’s heat conductivity is anisotropic since it is not uniform in all directions due to the several layers made of different materials that make up the battery. Radial active thermal conductivity of the battery is less than axial active. The battery’s active component’s heat conductivity may be represented as follows in both radial and axial directions [31]:
The last component of Equation (10)’s right side, the rate of HGT by the battery, is what primarily determines the battery’s 3D temperature distribution. The heat generated by an electrochemical reaction and the heat generated by the battery’s internal resistance to current flow are the two sources of HGT by the active component of the battery [33] The heat produced by the battery’s active component may be expressed as follows [31]:
Battery characteristics are given in Table 1 [34].

Table 1.
Lithium-ion pouch cell specifications.
The continuity, momentum, and energy equations can be written as follows [31]:
The three-dimensional heat conduction equation in PCM can be expressed as follows, where [35]:
Equations (5) and (6) define the EHC approach. The maximum effective specific heat owing to latent heat during melting is shown by the symbols and , respectively. Additionally, they demonstrate that the effective heat capacity of PCM has an inverse connection with the melting temperature range and is directly proportional to the latent heat of melting during the phase transition process. is the temperature at which the PCM starts to melt and is the temperature at which the PCM is completely melted during the charging process [35].
The charging and discharging operations are simulated using Equation (6). However, Equation (8) is used in lieu of Equation (7). [35].
As a function of the computed temperature T, the molten PCM percentage is explicitly averaged for each time step:
The properties of PCM and air are presented in Table 2 [36].

Table 2.
Thermophysical properties of PCM and air.
The Reynolds number is defined for airflow:
where D represents the hydraulic diameter. In this article, Re = 438.
4. Numerical Method
The COMSOL program is used to run the current simulations. By using different physics available in the software, different problems on a micro scale can be examined effectively. First, the problem of the micro-cylinder set is evaluated. In the first stage, the geometry of the problem is given to the software, and then meshing is done. By selecting the proper physics, boundary conditions and the governing equations are finally stated and solved. Utilizing the finite element method, equations are solved (FEM).
5. Validation and Grid Study
The meshing module of COMSOL software is used for grid generation in such a way that triangular and structured elements are employed. Table 3 presents the characteristics of channel meshing. To obtain a suitable grid that provides independent results, different grid resolutions are considered. An unstructured grid is used for meshing so that the distance between the grid points near the walls of the cavity where the changes are more intense is finer than in other regions. It is observed that the error percentage between the grid with 554032 nodes and the finer grid is too small. In order to replicate the issue, the grid resolution of 554032 is used. A schematic of the grid created for the geometry under study is shown in Figure 2.

Table 3.
The outlet TOB for different grid resolutions.
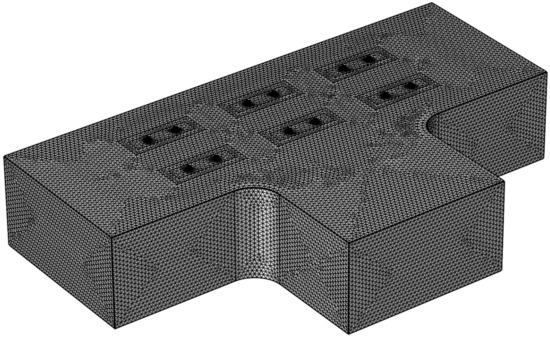
Figure 2.
A schematic of the grid used for the present simulations.
To verify the calculations and ensure the correct operation of the computer code, the outcomes of the current simulations are compared with the numerical results of Yang et al. [37], who examined a new system for cooling the LIN battery. They employed microchannels and PCM for cooling LIN batteries and showed that using the hybrid system can be a suitable method for cooling batteries. The average TOB and the dynamic voltage of the battery are calculated and compared with those reported by Yang et al. [37]. According to Figure 3, there is a very small difference between the results. Therefore, the model used in the software is highly accurate.
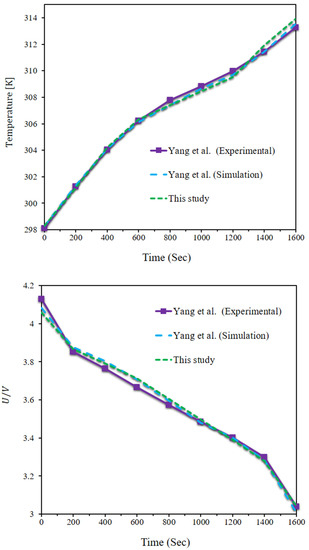
Figure 3.
Comparing the results obtained from the present simulations with those reported by Yang et al. [37].
6. Results and Discussion
Figure 4 displays the temperature contours on BTCLs for various cavity AR values.
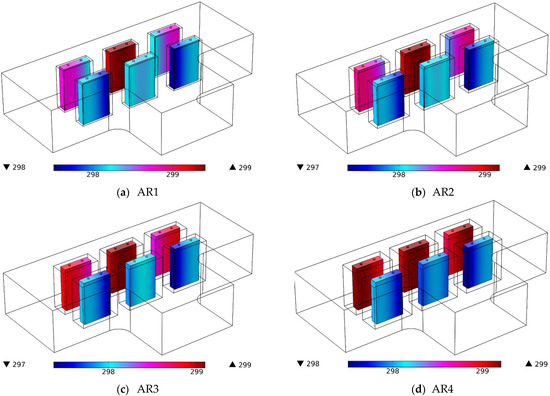
Figure 4.
Temperature contours (in Kelvin) on BTCLs for different values of cavity AR.
The front side of the battery rows is where air enters the BTPC, and it departs on both sides. Due to the symmetry of the geometry, the amount of airflow on both sides of the BTPC is equal. The first row on the air side, which contains three BTCLs, has a lower temperature than the other row of batteries. The airflow over the whole channel ensures that there is little temperature variation between the BTCLs. The airflow causes a portion of each BTCL to have a lower temperature than the other portions. The batteries in the rear row that are closest to the outlet are cooler than the center battery. Especially for smaller values of cavity AR, where the effect of airflow on the TOB cells is greater, the middle battery of the back row has a much higher temperature than the other batteries. An increment in the AR and using more PCM around the batteries lead to the TOB pack becoming more uniform. Additionally, the temperature uniformity in each BTCL is increased.
The isothermal planes in the airflow are shown in Figure 5 for various values of cavity AR. The isothermal planes depend on the airflow. It can be seen that the isothermal planes are perpendicular to the inlet by entering the air from the inlet. These isothermal planes move toward the outlets, TOBs are lowered by the airflow from the intake, and penetration of the airflow in the center of the batteries, while the temperature of the air around the batteries is raised. Therefore, isothermal planes are created due to temperature gradients in the BTPC. Changes in the AR affect the shape and number of isothermal planes, especially in the back row of batteries and on the outlet side. Due to the airflow between the BTCLs, the isothermal planes move between the BTCLs, and their density becomes high in these regions.
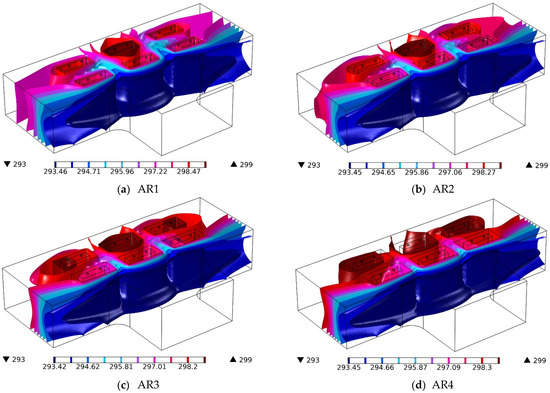
Figure 5.
Isothermal planes (in Kelvin) in the airflow for different values of cavity AR.
Figure 6 shows the air velocity contours on cross-sections of BTPC for different values of cavity AR. The velocity contours are very similar for different values of cavity AR. The velocity changes in the BTPC are due to the changes in the volume of the PCM cavity by changing the AR. At the inlet, the air velocity is constant, but it is lower on the walls due to the collision between the air and the walls of the cavity and the formation of a boundary layer on the walls. As the air passes through the middle of the BTCLs and their PCM cavities, the air velocity is increased in some parts of the BTPC due to the decrease in space for the passage of the airflow. The maximum velocity occurs in front of the front battery row in the BTPC, and the minimum air velocity is in the rear battery row. The maximum velocity in the BTPC is improved by enhancing the AR and the PCM cavity’s thickness. As can be observed, the AR4’s air velocity is much greater than the AR1’s in the center of the BTPC.
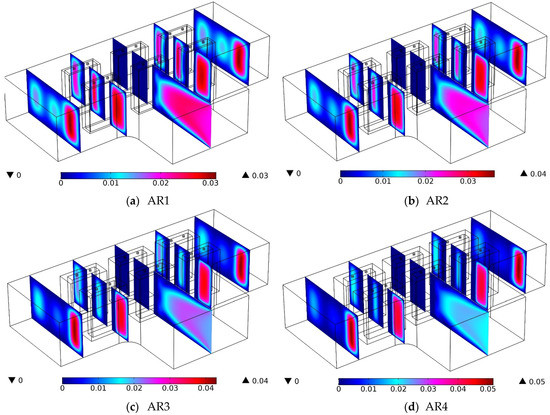
Figure 6.
Air velocity contours (in m/s) on cross-sections of the BTPC for different values of cavity AR.
For various values of cavity AR, Figure 7 shows the temperature contours on the PCM cavity as well as velocity and the air streamlines. Temporal changes and variations in the AR affect the temperature and volume fraction of the PCM inside the cavity. It can be seen that the cold airflow collides with the front row of batteries and is directed toward the outlets. Most of the air is directed towards the outlets, and a smaller part of the air goes towards the middle of the BTCLs and then is directed towards the outlets from the back of the rear row. The air exiting from the back of the BTPC has a higher temperature than that exiting from the front of the battery rows. It can be seen that the BTPCs placed in the front row have more solid PCM than the rear ones. The initial collision of air with these cavities causes the phase change from solid to liquid in the front row to be slower and the phase change from liquid to solid to occur faster. At 600 s, most parts of the PCM are in the liquid phase. At 1000 s, the PCM is completely melted for almost all ARs, and at 2000 s, a significant amount of PCM is converted to the solid phase. The changes in the PCM phase are due to the airflow in the middle of the batteries and also the HGT in the batteries.
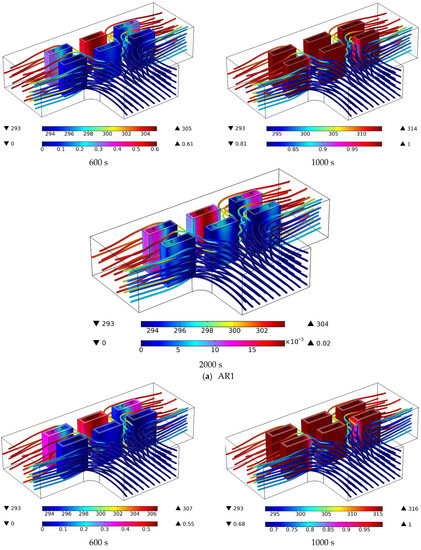
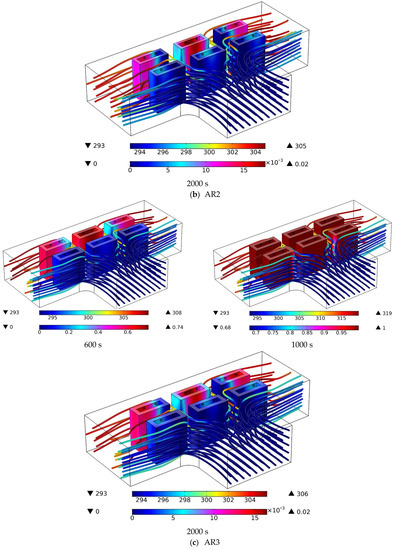
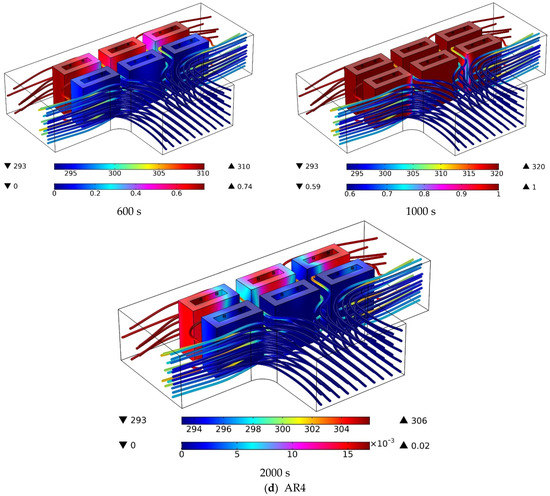
Figure 7.
Temperature contours (in Kelvin) on the PCM cavity and air streamlines and velocity (in m/s) for different values of cavity AR.
Figure 8 shows the TOBs for different values of cavity AR up to 6000 s. The temperature changes on the BTCLs are similar. It can be seen that two temperature enhancements occur in the BTCLs in the first two periods of time. Moreover, a sharp increment occurs in the TOB cells, which causes their temperature to exceed 330 K. After these two temperature enhancements in less than 1000 s, the TOBs have a downward trend. After 1000 s, the temperature of batteries has a decreasing trend according to the ARs used. At first, the reduction of the temperature in the BTCLs is faster. With time, this reduction becomes slower until 6000 s, when the temperature reduction in the batteries is reduced and remains almost constant. At first, due to the high HGT in the batteries, the PCM around them melts in a short time. The TOBs are increased because the air cannot cool the batteries well at this time. After this time, due to the presence of forced air flow next to the batteries and PCM, the TOBs are reduced over time, and at the same time, the PCM phase is changed from liquid to solid until all PCM is converted to solid phase. After this time, the airflow reduces the TOBs again to reach a constant value. Among the different ARs, AR3 has the maximum temperature at different times, especially for times past 1000 s. following AR3, AR4 has the maximum temperature at different times. Two aspect ratios of AR1 and AR2 have a very close temperature.
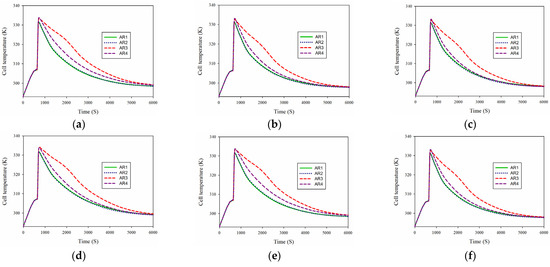
Figure 8.
TOBs for different values of cavity AR up to 6000 s. (a) cell 1 (b) cell 2 (c) cell 3 (d) cell 4 (e) cell 5 (f) cell 6.
Figure 9 shows the TOB pack for different values of cavity AR up to 6000 s. Due to the low air velocity at the inlet, it takes time for the air to circulate well around the batteries. At this time, the PCM melts at a high rate due to the HGT in the batteries. Thus, the TOBs are enhanced too much. The TOB pack is intensified for about 1000 s during two time periods and reaches more than 330 K. In this case, the effect of different ARs on TOB is too low. When the TOB pack reaches its maximum value, which is slightly larger for the aspect ratios of AR3 and AR4 compared to the other two aspect ratios, the TOB pack is reduced slightly. At first, the TOB pack is diminished with a sharp slope and then with a slow slope with time. As the TOB pack approaches 300 K, the temperature changes in the BTPC are decreased. The temperature changes of the BTPC are also small by changing the AR. The maximum changes are seen when the TOB pack is reduced with the AR. At this time, the maximum temperature occurs for AR3 and AR4. The other two aspect ratios are at a lower temperature than AR3 and AR4. At times of more than 5000 s, the temperature is close to each other for all ARs.
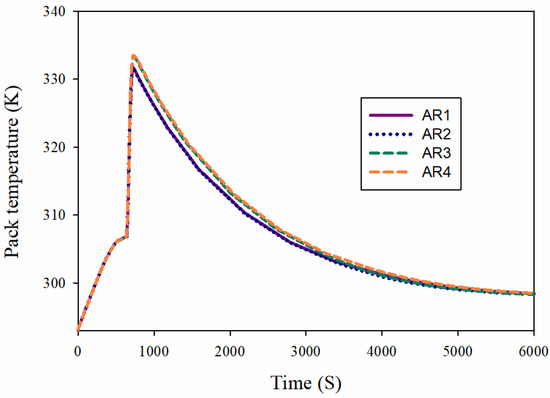
Figure 9.
TOB pack for different values of cavity AR up to 6000 s.
Figure 10 shows the volume fraction of molten PCM around BTCLs for various values of cavity AR up to 6000 s. The changes in PCM liquid and solid values at different times on different BTCLs are similar. At a time of fewer than 1000 s, all the PCM around the batteries is melted in a short time due to generation of heat in batteries. The PCM rest melted around the batteries for about 500 s. After this time, the PCM freezing process starts and the amount of solid PCM around the batteries is enhanced until about 3000 s when all the PCM around the batteries is solid due to the collison of cold air with the batteries. Due to the existence of the airflow at the beginning of the solution and the lack of airflow next to some batteries, the TOB in the battery is increased and all the PCM becomes liquid in a short time. However, due to the steady airflow near the batteries, the PCM is converted to the solid phase. Changing the AR in times less than 1000 s has little effect on the PCM phase change. After this time, its effect on the phase change time and the amount of phase change in some BTCLs is enhanced. The maximum impact of AR on the PCM phase change time occurs for batteries 1 and 3, and then battery 2. The minimum impact occurs on batteries 4, 5, and 6. In batteries 1 and 3, the PCM freezing process starts from the AR1 and then AR2 models. The last aspect ratio model where the PCM freezing process starts is AR4. When AR4 is employed, the PCM complete phase change from liquid to solid takes more than 3000 s, which is longer than other BTCLs. In batteries 4 to 6, the change in AR does not have much effect on the phase change time, and all PCM becomes solid in less than 3000 s. The location of the BTCLs in the pack and the direction of the airflow between them play a critical role in the PCM phase change time.
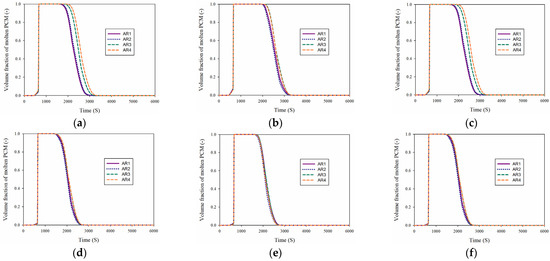
Figure 10.
Volume fraction of molten PCM around BTCLs for various values of cavity AR up to 6000 s. (a) cell 1 (b) cell 2 (c) cell 3 (d) cell 4 (e) cell 5 (f) cell 6.
Figure 11 demonstrates the volume fraction of molten PCM around the BTPC for different values of cavity AR up to 6000 s. The changes in the amount of molten PCM in the BTPC are completely different. From time 620 s to 680 s, all the PCM is converted from the solid phase to the liquid phase. At this time, a high amount of heat reaches the PCM due to the high HGT in the batteries, leading to a phase change in the PCM. The lack of proper airflow next to the batteries causes the PCM to melt a little over time. However, after 1260 s, the PCM freezing process starts and PCM is converted to solid phase rapidly. By creating a steady airflow next to the PCM and taking heat from the PCM and batteries, the PCM is converted to the solid phase. As a result, in a time of less than 3500 s, all the PCM is returned to a solid phase for different ARs. After that time, the melting process does not occur due to the decrease in the TOBs. The quantity of molten PCM varies depending on the AR at various intervals between 1260 and 3500 s. The value of solid PCM for AR1 and AR2 is higher than that for the other two aspect ratios at different times.
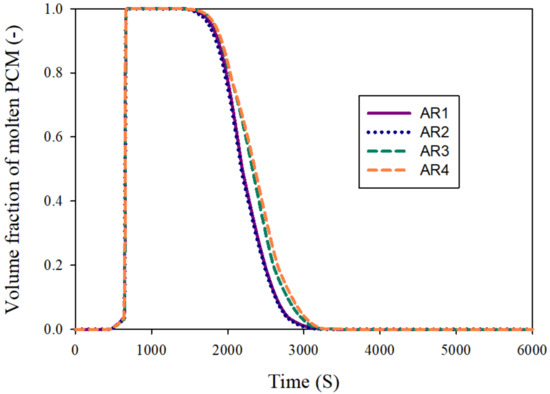
Figure 11.
Volume fraction of molten PCM around the BTPC for different values of cavity AR up to 6000 s.
Table 4 presents the pressure drop for different values of AR. Additionally, the use of air, which has a low viscosity and density, results in a low amount of pressure drop in the system. Furthermore, the presence of two outlets reduces the pressure drop in the channel. It is clear that increasing the AR increases the pressure drop in channel. As the AR is enhanced, more space of the channel is occupied by the battery, leading to an enhancement in the amount of pressure drop.

Table 4.
The pressure drop for different values of AR.
7. Conclusions
This paper presents the simulations of the cooling system of a BTPC consisting of six LIN plate batteries. The BTPC is placed in a channel with one inlet and two outlets. The PCM is placed in cubic enclosures around the batteries. This study is done for four different values of channel AR. The transient study is carried out by examining the temperature of BTCLs, amount of molten PCM and the TOB pack, and the average molten PCM in the BTPC over 6000 s. The following results are obtained:
1-An increment in the AR leads to more uniformity in the TOB pack and the temperature of each BTCL.
2-The battery channels placed in the front row always have more solid PCM than the ones located at the rear. The temperature of these cells is also a little less than that of the rear ones.
3-In the time from 1260 to 3500 s, the amount of solid PCM for AR1 and AR2 is higher than that for the other two aspect ratios at different times.
4-The maximum impact of AR on the PCM phase change time occurs for batteries 1 and 3, and then battery 2. The minimum impact occurs on batteries 4, 5, and 6. In batteries 1 and 3, the PCM freezing process starts from the AR1 and then AR2 models.
5-The temperature variations of the BTPC with the change of the AR are small. The maximum changes are related to the time of decreasing the TOB pack with the change of the AR. At this time, the maximum temperature occurs for AR3 and AR4, and both AR1 and AR2 are at lower temperatures (near 0.2 degrees at 6000 s).
6-Changing the aspect ratio of AR1 to AR4 causes the amount of pressure drop in the channel to enhance by 14%.
Author Contributions
Data curation, J.M.; Investigation, J.M.; Methodology, S.H. and B.J.; Project administration, J.M. and M.S..; Writing—original draft, S.A.; Writing— review and editing, M.S. and G.C. All authors have read and agreed to the published version of the manuscript.
Funding
The Deanship of Scientific Research at Najran University for funding this work under the Research Groups Funding Program, grant code (NU/RG/SERC/11/15).
Data Availability Statement
Not applicable.
Acknowledgments
The authors are thankful to the Deanship of Scientific Research at Najran University for funding this work under the Research Groups Funding Program, grant code (NU/RG/SERC/11/15).
Conflicts of Interest
The authors declare no conflict of interest.
Nomenclature
| Specific heat | PCM | Phase change material | |
| Concentration of lithium ions in the solid (mol/dm3) | PVOF | PCM volume fraction | |
| c | Salt concentration(mol/dm3) | TMGT | Thermal management of battery |
| Ds | Lithium diffusion coefficient in the solid electrode (cm2/s) | TOB | Temperature of the battery |
| E | Specific energy (Wh/kg) | Greek symbols | |
| F | Faraday constant (96,485 C/mol) | λ | PCM of VOF |
| g | Gravitational acceleration [m/s2] | Thermal diffusivity | |
| h | Enthalpy | ε | Volume fraction |
| Current (A) | Dynamic viscosity | ||
| k | Thermal conductivity | Density | |
| Pressure | ϕ | Electrical potential (V) | |
| Electrical resistivity () | η | Electrode potential (V) | |
| T | Temperature [K] | σ | Solid matrix electronic conductivity (S cm−1) |
| t | Time (s) | Subscripts | |
| Chemical reaction heat | eff | Effective | |
| u,v | Velocity components in x and y directions | f | Fluid |
| x,y | Cartesian coordinates, | l | Liquid |
| V | Operating voltage of the battery (V) | s | Solid |
| U | Open circuit voltage (V) | + | Positive electrode |
| Abbreviations | 1 | Solid phase of the electrode | |
| AR | Aspect ratio | 2 | Solution phase of the electrode |
| BTCL | Battery cells | i | Layer in lithium ion battery |
| BTPC | Battery pack | J | Joule heat |
| FEM | finite element method | ||
| LIN | Lithium-ion | ||
References
- Gibbons, L.; Javed, S. A review of HVAC solution-sets and energy performace of nearly zero-energy multi-story apartment buildings in Nordic climates by statistical analysis of environmental performance certificates and literature review. Energy 2022, 238, 121709. [Google Scholar] [CrossRef]
- Tian, G.; Fan, Y.; Gao, M.; Wang, H.; Zheng, H.; Liu, J.; Liu, C. Indoor thermal environment of thin membrane structure Buildings: A review. Energy Build. 2021, 234, 110704. [Google Scholar] [CrossRef]
- Jurasz, J.; Canales, F.A.; Kies, A.; Guezgouz, M.; Beluco, A. A review on the complementarity of renewable energy sources: Concept, metrics, application and future research directions. Sol. Energy 2020, 195, 703–724. [Google Scholar] [CrossRef]
- Lowitzsch, J.; Hoicka, C.E.; van Tulder, F.J. Renewable energy communities under the 2019 European Clean Energy Package–Governance model for the energy clusters of the future? Renew. Sustain. Energy Rev. 2020, 122, 109489. [Google Scholar] [CrossRef]
- Bamisile, O.; Obiora, S.; Huang, Q.; Yimen, N.; Idriss, I.A.; Cai, D.; Dagbasi, M. Impact of economic development on CO2 emission in Africa; the role of BEVs and hydrogen production in renewable energy integration. Int. J. Hydrogen Energy 2021, 46, 2755–2773. [Google Scholar] [CrossRef]
- Shaqsi, A.Z.A.; Sopian, K.; Al-Hinai, A. Review of energy storage services, applications, limitations, and benefits. Energy Rep. 2020, 6, 288–306. [Google Scholar] [CrossRef]
- Agrawal, T.; Ajitkumar, R.; Prakash, R.; Nandan, G. Sodium Silicide As A Hydrogen Source For Portable Energy Devices: A Review. Mater. Today: Proc. 2018, 5, 3563–3570. [Google Scholar] [CrossRef]
- Østergaard, P.A.; Duic, N.; Noorollahi, Y.; Mikulcic, H.; Kalogirou, S. Sustainable development using renewable energy technology. Renew. Energy 2020, 146, 2430–2437. [Google Scholar] [CrossRef]
- Kehrein, P.; Van Loosdrecht, M.; Osseweijer, P.; Garfí, M.; Dewulf, J.; Posada, J. A critical review of resource recovery from municipal wastewater treatment plants–market supply potentials, technologies and bottlenecks. Environ. Sci. Water Res. Technol. 2020, 6, 877–910. [Google Scholar] [CrossRef]
- Lyu, P.; Liu, X.; Qu, J.; Zhao, J.; Huo, Y.; Qu, Z.; Rao, Z. Recent advances of thermal safety of lithium ion battery for energy storage. Energy Storage Mater. 2020, 31, 195–220. [Google Scholar] [CrossRef]
- Killer, M.; Farrokhseresht, M.; Paterakis, N.G. Implementation of large-scale Li-ion battery energy storage systems within the EMEA region. Appl. Energy 2020, 260, 114166. [Google Scholar] [CrossRef]
- Zhang, D.; Tan, C.; Ou, T.; Zhang, S.; Li, L.; Ji, X. Constructing advanced electrode materials for low-temperature lithium-ion batteries: A review. Energy Rep. 2022, 8, 4525–4534. [Google Scholar] [CrossRef]
- Shi, Q.; Zhou, J.; Ullah, S.; Yang, X.; Tokarska, K.; Trzebicka, B.; Ta, H.Q.; Rümmeli, M.H. A review of recent developments in Si/C composite materials for Li-ion batteries. Energy Storage Mater. 2021, 34, 735–754. [Google Scholar] [CrossRef]
- Bose, B.; Garg, A.; Panigrahi, B.; Kim, J. Study on Li-ion battery fast charging strategies: Review, challenges and proposed charging framework. J. Energy Storage 2022, 55, 105507. [Google Scholar] [CrossRef]
- Palacín, M.R. Understanding ageing in Li-ion batteries: A chemical issue. Chem. Soc. Rev. 2018, 47, 4924–4933. [Google Scholar] [CrossRef] [PubMed]
- Raijmakers, L.; Danilov, D.; Eichel, R.-A.; Notten, P. A review on various temperature-indication methods for Li-ion batteries. Appl. Energy 2019, 240, 918–945. [Google Scholar] [CrossRef]
- Sharma, D.K.; Prabhakar, A. A review on air cooled and air centric hybrid thermal management techniques for Li-ion battery packs in electric vehicles. J. Energy Storage 2021, 41, 102885. [Google Scholar] [CrossRef]
- Qian, S.; Yu, J.; Yan, G. A review of regenerative heat exchange methods for various cooling technologies. Renew. Sustain. Energy Rev. 2017, 69, 535–550. [Google Scholar] [CrossRef]
- Okonkwo, E.C.; Wole-Osho, I.; Almanassra, I.W.; Abdullatif, Y.M.; Al-Ansari, T. An updated review of nanofluids in various heat transfer devices. J. Therm. Anal. Calorim. 2021, 145, 2817–2872. [Google Scholar] [CrossRef]
- Yao, J. A Review of Industrial Heat Exchange Optimization. IOP Conf. Ser. Earth Environ. Sci. 2018, 108, 042036. [Google Scholar] [CrossRef]
- Khan, M.; Swierczynski, M.; Kær, S. Towards an Ultimate Battery Thermal Management System: A Review. Batteries 2017, 3, 9. [Google Scholar] [CrossRef]
- Al-Zareer, M.; Dincer, I.; Rosen, M.A. A review of novel thermal management systems for batteries. Int. J. Energy Res. 2018, 42, 3182–3205. [Google Scholar] [CrossRef]
- Xiao, X.; Zhang, P.; Li, M. Preparation and thermal characterization of paraffin/metal foam composite phase change material. Appl. Energy 2013, 112, 1357–1366. [Google Scholar] [CrossRef]
- Wang, Z.; Zhang, Z.; Jia, L.; Yang, L.-X. Paraffin and paraffin/aluminum foam composite phase change material heat storage experimental study based on thermal management of Li-ion battery. Appl. Therm. Eng. 2015, 78, 428–436. [Google Scholar] [CrossRef]
- Li, W.; Qu, Z.; He, Y.; Tao, Y. Experimental study of a passive thermal management system for high-powered lithium ion batteries using porous metal foam saturated with phase change materials. J. Power Sources 2014, 255, 9–15. [Google Scholar] [CrossRef]
- Jilte, R.; Afzal, A.; Panchal, S. A novel battery thermal management system using nano-enhanced phase change materials. Energy 2021, 219, 119564. [Google Scholar] [CrossRef]
- Choudhari, V.; Dhoble, A.; Panchal, S. Numerical analysis of different fin structures in phase change material module for battery thermal management system and its optimization. Int. J. Heat Mass Transf. 2020, 163, 120434. [Google Scholar] [CrossRef]
- Deng, D. Li-ion batteries: Basics, progress, and challenges. Energy Sci. Eng. 2015, 3, 385–418. [Google Scholar] [CrossRef]
- Zubi, G.; Dufo-López, R.; Carvalho, M.; Pasaoglu, G. The lithium-ion battery: State of the art and future perspectives. Renew. Sustain. Energy Rev. 2018, 89, 292–308. [Google Scholar] [CrossRef]
- Doyle, M.; Newman, J.; Gozdz, A.S.; Schmutz, C.N.; Tarascon, J.-M. Comparison of Modeling Predictions with Experimental Data from Plastic Lithium Ion Cells. J. Electrochem. Soc. 1996, 143, 1890. [Google Scholar] [CrossRef]
- Al-Zareer, M.; Dincer, I.; Rosen, M.A. Electrochemical modeling and performance evaluation of a new ammonia-based battery thermal management system for electric and hybrid electric vehicles. Electrochimica Acta 2017, 247, 171–182. [Google Scholar] [CrossRef]
- Amiribavandpour, P.; Shen, W.; Mu, D.; Kapoor, A. An improved theoretical electrochemical-thermal modelling of lithium-ion battery packs in electric vehicles. J. Power Sources 2015, 284, 328–338. [Google Scholar] [CrossRef]
- Karimi, G.; Li, X. Thermal management of lithium-ion batteries for electric vehicles. Int. J. Energy Res. 2013, 37, 13–24. [Google Scholar] [CrossRef]
- Panchal, S.; Khasow, R.; Dincer, I.; Agelin-Chaab, M.; Fraser, R.; Fowler, M. Thermal design and simulation of mini-channel cold plate for water cooled large sized prismatic lithium-ion battery. Appl. Therm. Eng. 2017, 122, 80–90. [Google Scholar] [CrossRef]
- Khetib, Y.; Alotaibi, A.A.; Alshahri, A.H.; Cheraghan, G.; Sharifpur, M.; Meyer, J.P. Study on the Effect of Hole Size of Trombe Wall in the Presence of Phase Change Material for Different Times of a Day in Winter and Summer. Processes 2021, 9, 1886. [Google Scholar] [CrossRef]
- Kant, K.; Shukla, A.; Sharma, A.; Henry Biwole, P. Heat transfer study of phase change materials with graphene nano particle for thermal energy storage. Sol. Energy 2017, 146, 453–463. [Google Scholar] [CrossRef]
- Yang, W.; Zhou, F.; Liu, Y.; Xu, S.; Chen, X. Thermal performance of honeycomb-like battery thermal management system with bionic liquid mini-channel and phase change materials for cylindrical lithium-ion battery. Appl. Therm. Eng. 2021, 188, 116649. [Google Scholar] [CrossRef]
Disclaimer/Publisher’s Note: The statements, opinions and data contained in all publications are solely those of the individual author(s) and contributor(s) and not of MDPI and/or the editor(s). MDPI and/or the editor(s) disclaim responsibility for any injury to people or property resulting from any ideas, methods, instructions or products referred to in the content. |
© 2023 by the authors. Licensee MDPI, Basel, Switzerland. This article is an open access article distributed under the terms and conditions of the Creative Commons Attribution (CC BY) license (https://creativecommons.org/licenses/by/4.0/).