Communication

Influence of Breathing and Swelling on the Jelly-Roll Case Gap of Cylindrical Lithium-Ion Battery Cells

1
Institute for Sustainable Energy Systems, Munich University of Applied Sciences HM, Lothstr. 64, 80335 Munich, Germany
2
Department of Energy and Process Engineering, School of Engineering and Design, Technical University of Munich, Arcisstraße 21, 80333 Munich, Germany
3
TWAICE Technologies GmbH, Joseph-Dollinger-Bogen 26, 80807 Munich, Germany
*
Author to whom correspondence should be addressed.
Batteries 2023, 9(1), 6; https://doi.org/10.3390/batteries9010006
Submission received: 5 October 2022 / Revised: 6 December 2022 / Accepted: 12 December 2022 / Published: 23 December 2022

Abstract

:
Cylindrical 18650 and 21700 lithium-ion batteries are produced with small gaps between the jelly roll and the case. The size of these gaps and the mechanical attachment of the jelly roll to the case can have a significant impact on the thermal and mechanical properties of cells. To investigate the influence of the state of charge (SOC) and state of health (SOH) on the size of the gap, computed tomography (CT) and gray-value analysis was conducted with various cell types at 0% and 100% SOC and after cycling. The results show a significant influence of the SOC on the gap for new cells and a substantial reduction in the gap during the first cycles.

1. Introduction

Mechanical effects are ubiquitous in lithium-ion batteries, even during normal operation, and affect them at all scales from particle to electrode to cell level. At the cell level, various degradation processes contribute to cell internal mechanical stress; among the most important are breathing and swelling, along with their interaction with mechanical constraints such as the case or bracing.
Breathing is the cyclic volume change of the cathode active material and, in particular, of the anode active material (up to 10% in the thickness direction [1,2,3,4,5]) caused by lithium intercalation during charge and discharge cycles. For the anode active material, this behavior is influenced by the lithiation stages of graphite and does not exhibit a linear characteristic; rather, it shows a plateau in the mid state-of-charge (SOC) range [6,7,8,9]. Swelling is a progressive increase in thickness due to aging-related side reactions such as passivation layer growth, binder swelling and lithium plating [10,11,12] that causes a corresponding increase in the cell’s intrinsic stress [13,14,15,16].
The effects of these mechanisms have been investigated with various tools, such as force sensors, strain gauges [17], laser scanning [16], and computed tomography (CT).
CT is often applied for qualitative analyses, such as classification of cell components [18,19,20] and cell structure [21,22], observation of degradation mechanisms such as electrolyte consumption and jelly-roll swelling [23,24], mechanical jelly-roll collapse [25,26,27], damage evaluation from shock and vibration [22,28], failure evaluation due to crushing [29,30], and observation of the thermal runaway (TR) process [31,32,33].
An increasing number of researchers in the battery field have recently published methods for the quantitative analysis of CT images by processing the gray-values of images [34,35]. Layer thicknesses [36] and manufacturing-induced defects [37] have been studied using gray-value analysis along trajectories or lines. Other researchers utilize virtual-unrolling techniques [38,39,40] to analyze SOC dependencies or to study delamination during cyclic aging. Additionally, discretization of cell cross-sections to develop equivalent resistor networks has been conducted [41].
While these tools have been used to study inhomogeneous case deformation [42] and inhomogeneous swelling [40] in lithium-ion batteries, one aspect that has not been analyzed and reported in the literature is the gap between the case and the jelly roll. Although a small gap is required for production, its size is a critical cell-design parameter. Huge gaps do not only have a negative impact on the energy density at the cell level, but they also influence heat transfer from the jelly roll to the case [43] and mechanical parameters such as resonant frequencies and resilience against shocks [44] and vibrations. On the other hand, small gaps do not offer any space to compensate for jelly-roll swelling during formation and cyclic aging. That might become a critical issue for cells with an increased silicon share in the graphite, because increased expansion may cause electrode fracture or even failure of the case, as depicted in Figure 1.
As it is unclear what size jelly-roll gaps commercial cells have, how they are distributed, and how breathing and swelling affects them, the aim of this study is to use CT on various cylindrical cell types to investigate their:
  • Cell-to-cell variations;
  • Differences between cell types;
  • Dependence on SOC;
  • Dependence on SOH.
This may also help to improve the understanding of the underlying mechanisms.

2. Experimental Method

2.1. Cell Types and Test Procedure

The influence of the SOC on the jelly-roll gap and cell-to-cell variations were investigated for four new Samsung INR-18650-25RM cells by computing a radial cross-section in the middle of the cell. In addition, the influence of the position of the cross-section (bottom, middle, or top) was analyzed for the same cell type with cross-sections of 10 m m from the middle position. Subsequently, six types of 18650 and two types of 21700 cells (listed in Table 1) were investigated in a new state at 0 and 100% SOC to evaluate differences among various cell types. The selection of the cell types was made with the intention of analyzing various cell sizes, chemistries, and high-energy and/or high-power designs. Finally, a Samsung INR18650-25RM and a Samsung INR21700-40T cell were cycled to analyze the influence of the SOH. Therefore, first, one CT scan was conducted after every cycle at 100% SOC up until ten cycles, followed by one CT scan at 100% SOC every ten cycles.

2.2. Electrical Test Conditions

Electrical testing was conducted using a cell testing system (SL6/30/0.18BTS20C, Scienlab, Bochum, Germany) with a current accuracy of 0.05 % ± 25 m A and a voltage accuracy of ± 1 m V . All cells were CC-CV charged and discharged with 0.5 C, applying a CC-phase with a 0.1   A cut-off for charging. The influence of rest time was analyzed with no significant difference found between 1 h and 1 day. The electrical testing was performed in a temperature chamber (DM340, ATT Discovery, Dallas, TX, USA) at 25 C .

2.3. CT Scanner and Settings
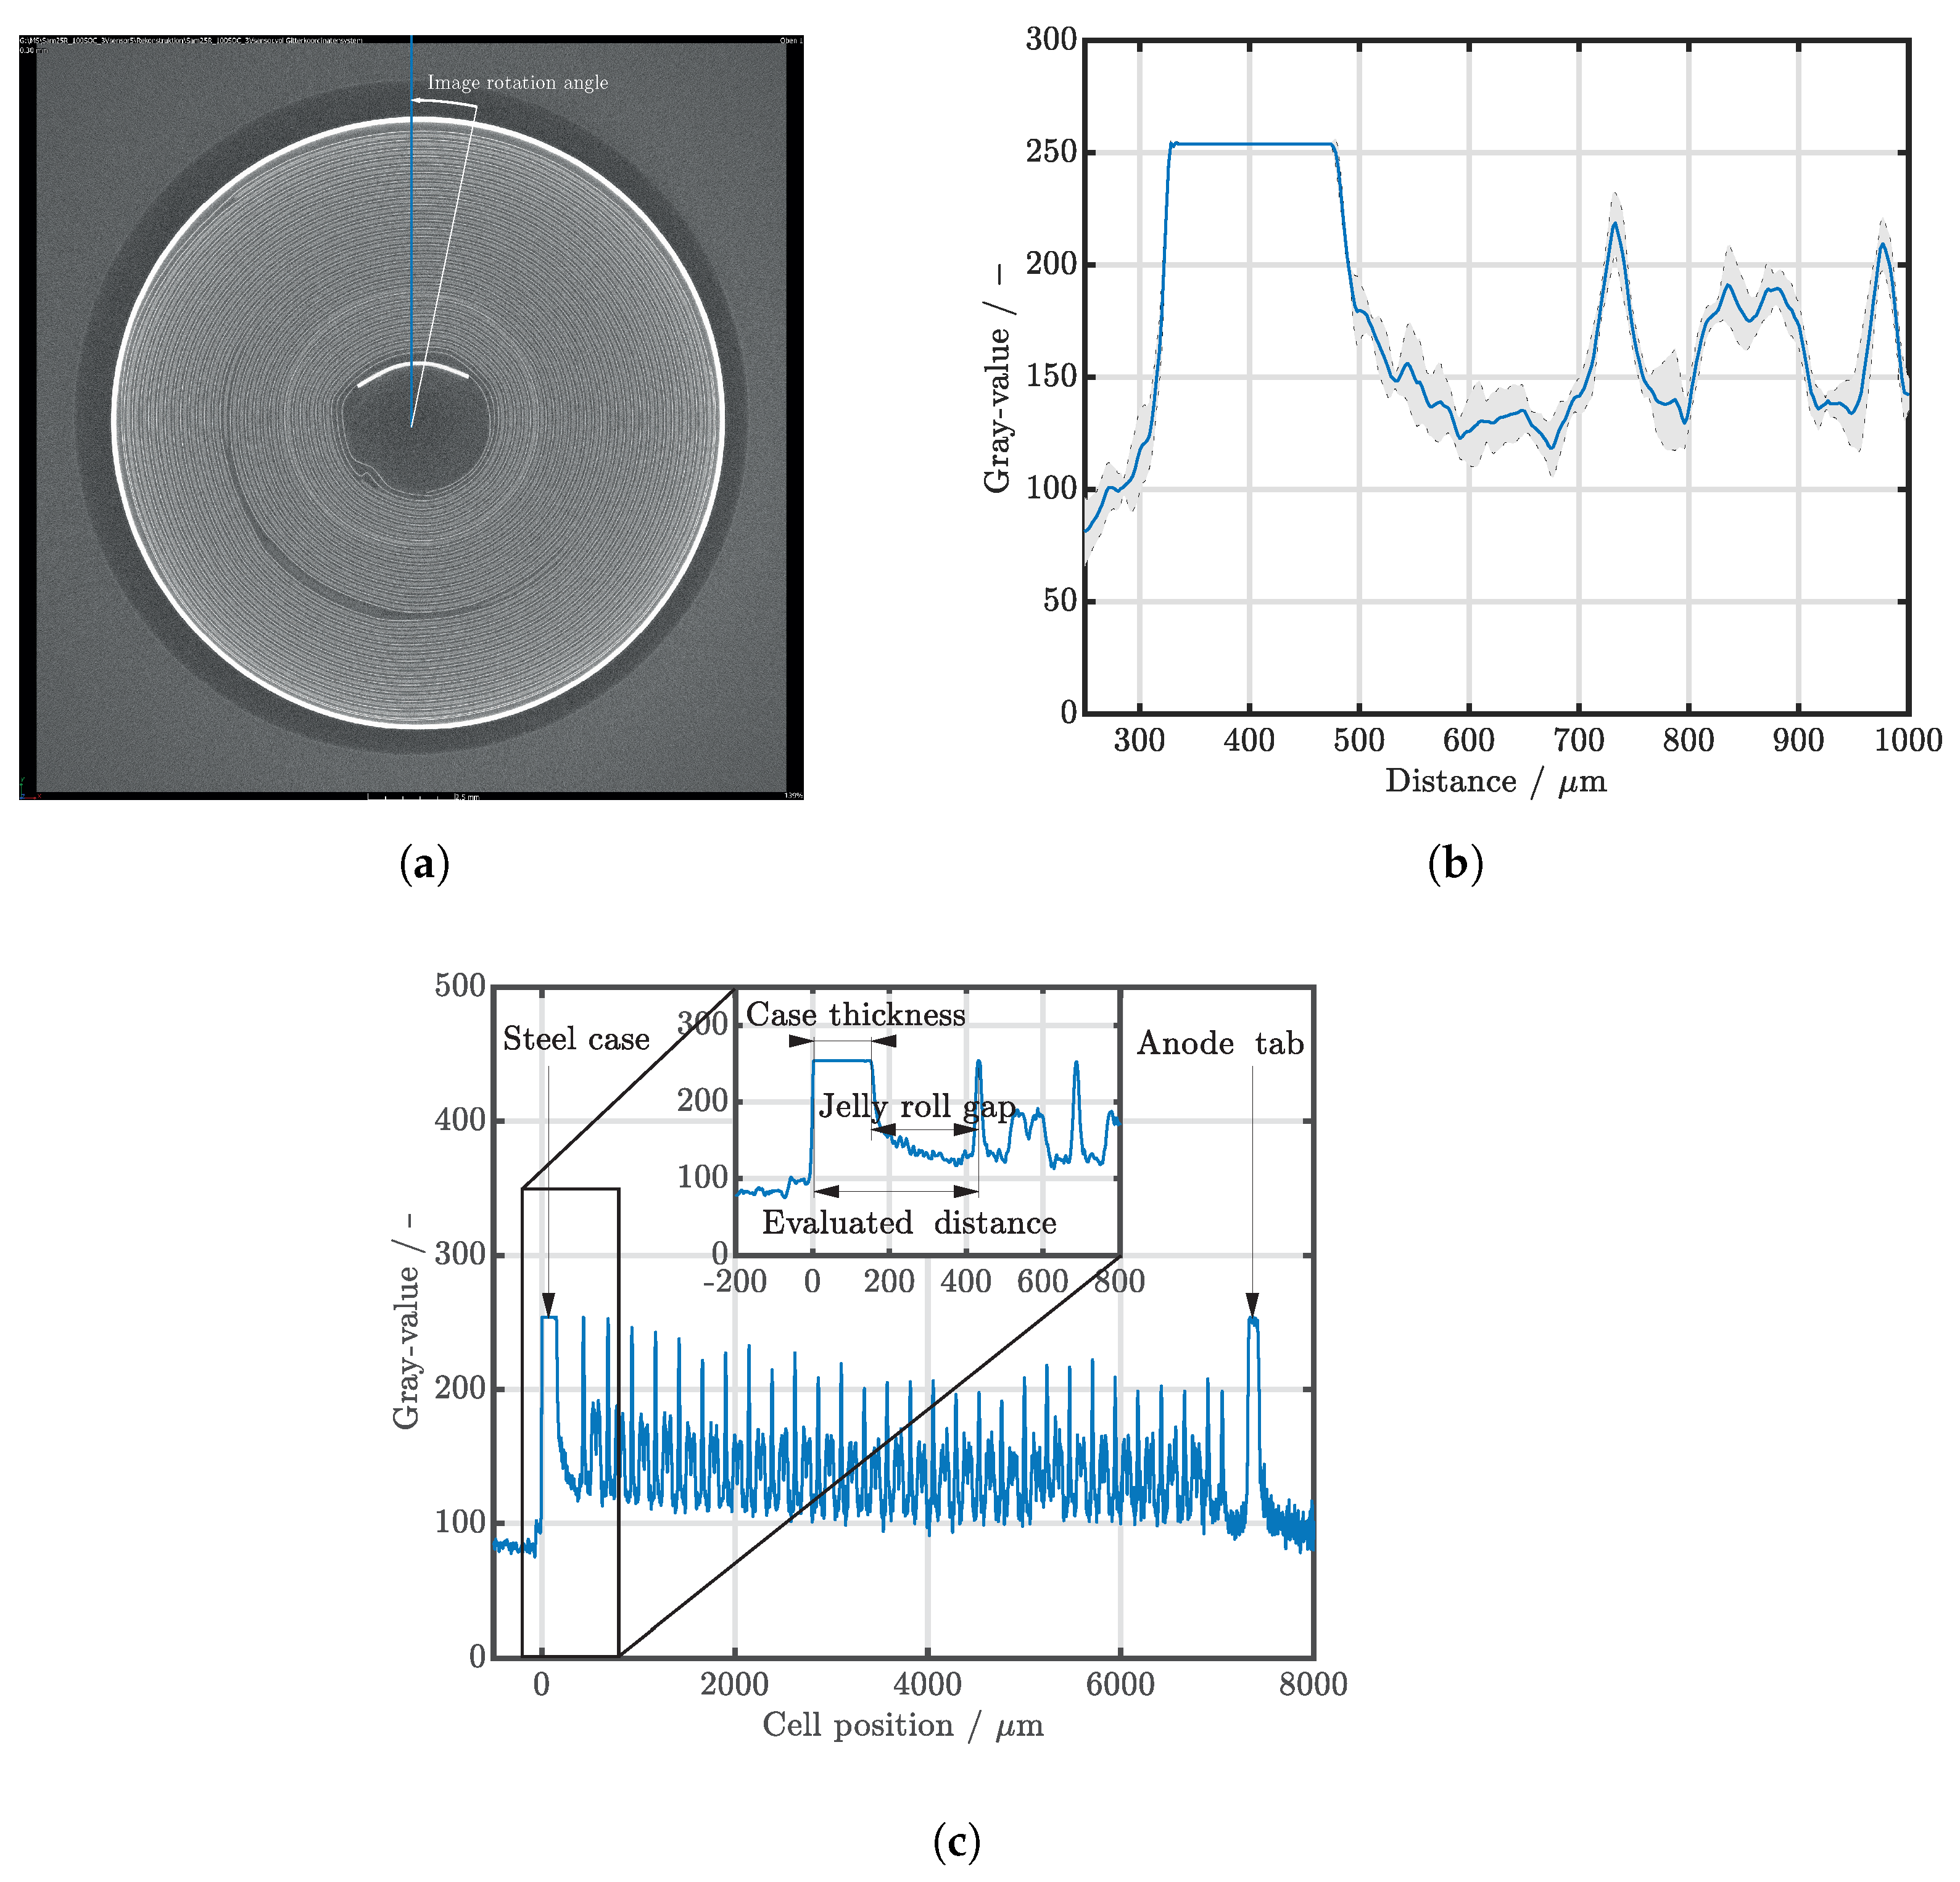
CT scans were conducted using a Phoenix Nanotom S Research|Edition (GE Sensing & Inspection Technologies, Boston, MA, USA) at 140 k V voltage, 140 m A cathode current, 1 × 1 binning, three images averaged per projection, and 1000 images per scan in circumferential orientation. For 18650 cells a voxel size of 9.2   μ m was selected, and for 21700 cells a voxel size of 10.0   μ m was selected.

2.4. Data Analysis

The raw data from the CT scans were further processed with CT visualization and analysis software (myVGL, Volume Graphics GmbH, Heidelberg, Germany). Since the temperature and pressure in the X-ray tube and the aging state of the plug-in cathode varied, the obtained gray-value profiles were not always consistent despite consistent settings. For this reason, the gray-values of the renderings were manually adjusted with linear ramping to allow high contrast of the relevant components with similar gray-values. Cross-sections were exported with a 10,000-pixel image width, and the image was cropped to the cell diameter to reduce the image size.
Further, gray-value analysis was conducted with MATLAB (Image Processing Toolbox and Signal Processing Toolbox) to compute gray-values along 20 parallel lines with a thickness of one pixel each, as depicted in Figure 2a, to filter fluctuations, as depicted in Figure 2b. The results of this were gray-value profiles along these lines, as depicted in Figure 2c. To evaluate the size of the jelly-roll gap, the distance between the outer anode current collectors and the outer surface of the case was measured, as the latter exhibits a steep flank (evaluated distance). For this, find and findpeak functions were used. The average case thickness (distance between inner and outer gray-value flank of the case) was subtracted from this evaluated distance to obtain the distance between the inner case wall and the outer anode current collector, which is referred to as the ‘jelly-roll gap’ in this work. This procedure was conducted for image rotations every 1 , and the results were displayed for each image rotation angle (the images were rotated by applying the imrotate function, while the lines remained in same position for the evaluation). The results for the cycled cells were smoothed (smooth function with moving-average lowpass filter), as this reduced fluctuations and allowed improved presentation of the results. Outliers with gray-value deviations greater than 10 relative to neighboring values were removed. The obtained cross-sections from the CT scans and the script for the gray-value analysis can be found in the digital appendix.
Note that the obtained distance is not the same as the void space between the jelly roll and the case, since many cells have excessive layers of separator or other plastic films wrapped around them that cannot be resolved using this CT scanner. The purpose of such extra layers can be both isolation of the case and compensation for jelly-roll expansion. For cells in which the anode current collector is wrapped excessively around a cell, there could also be more space available to compensate for expansion than analyzed with this method.

3. Results

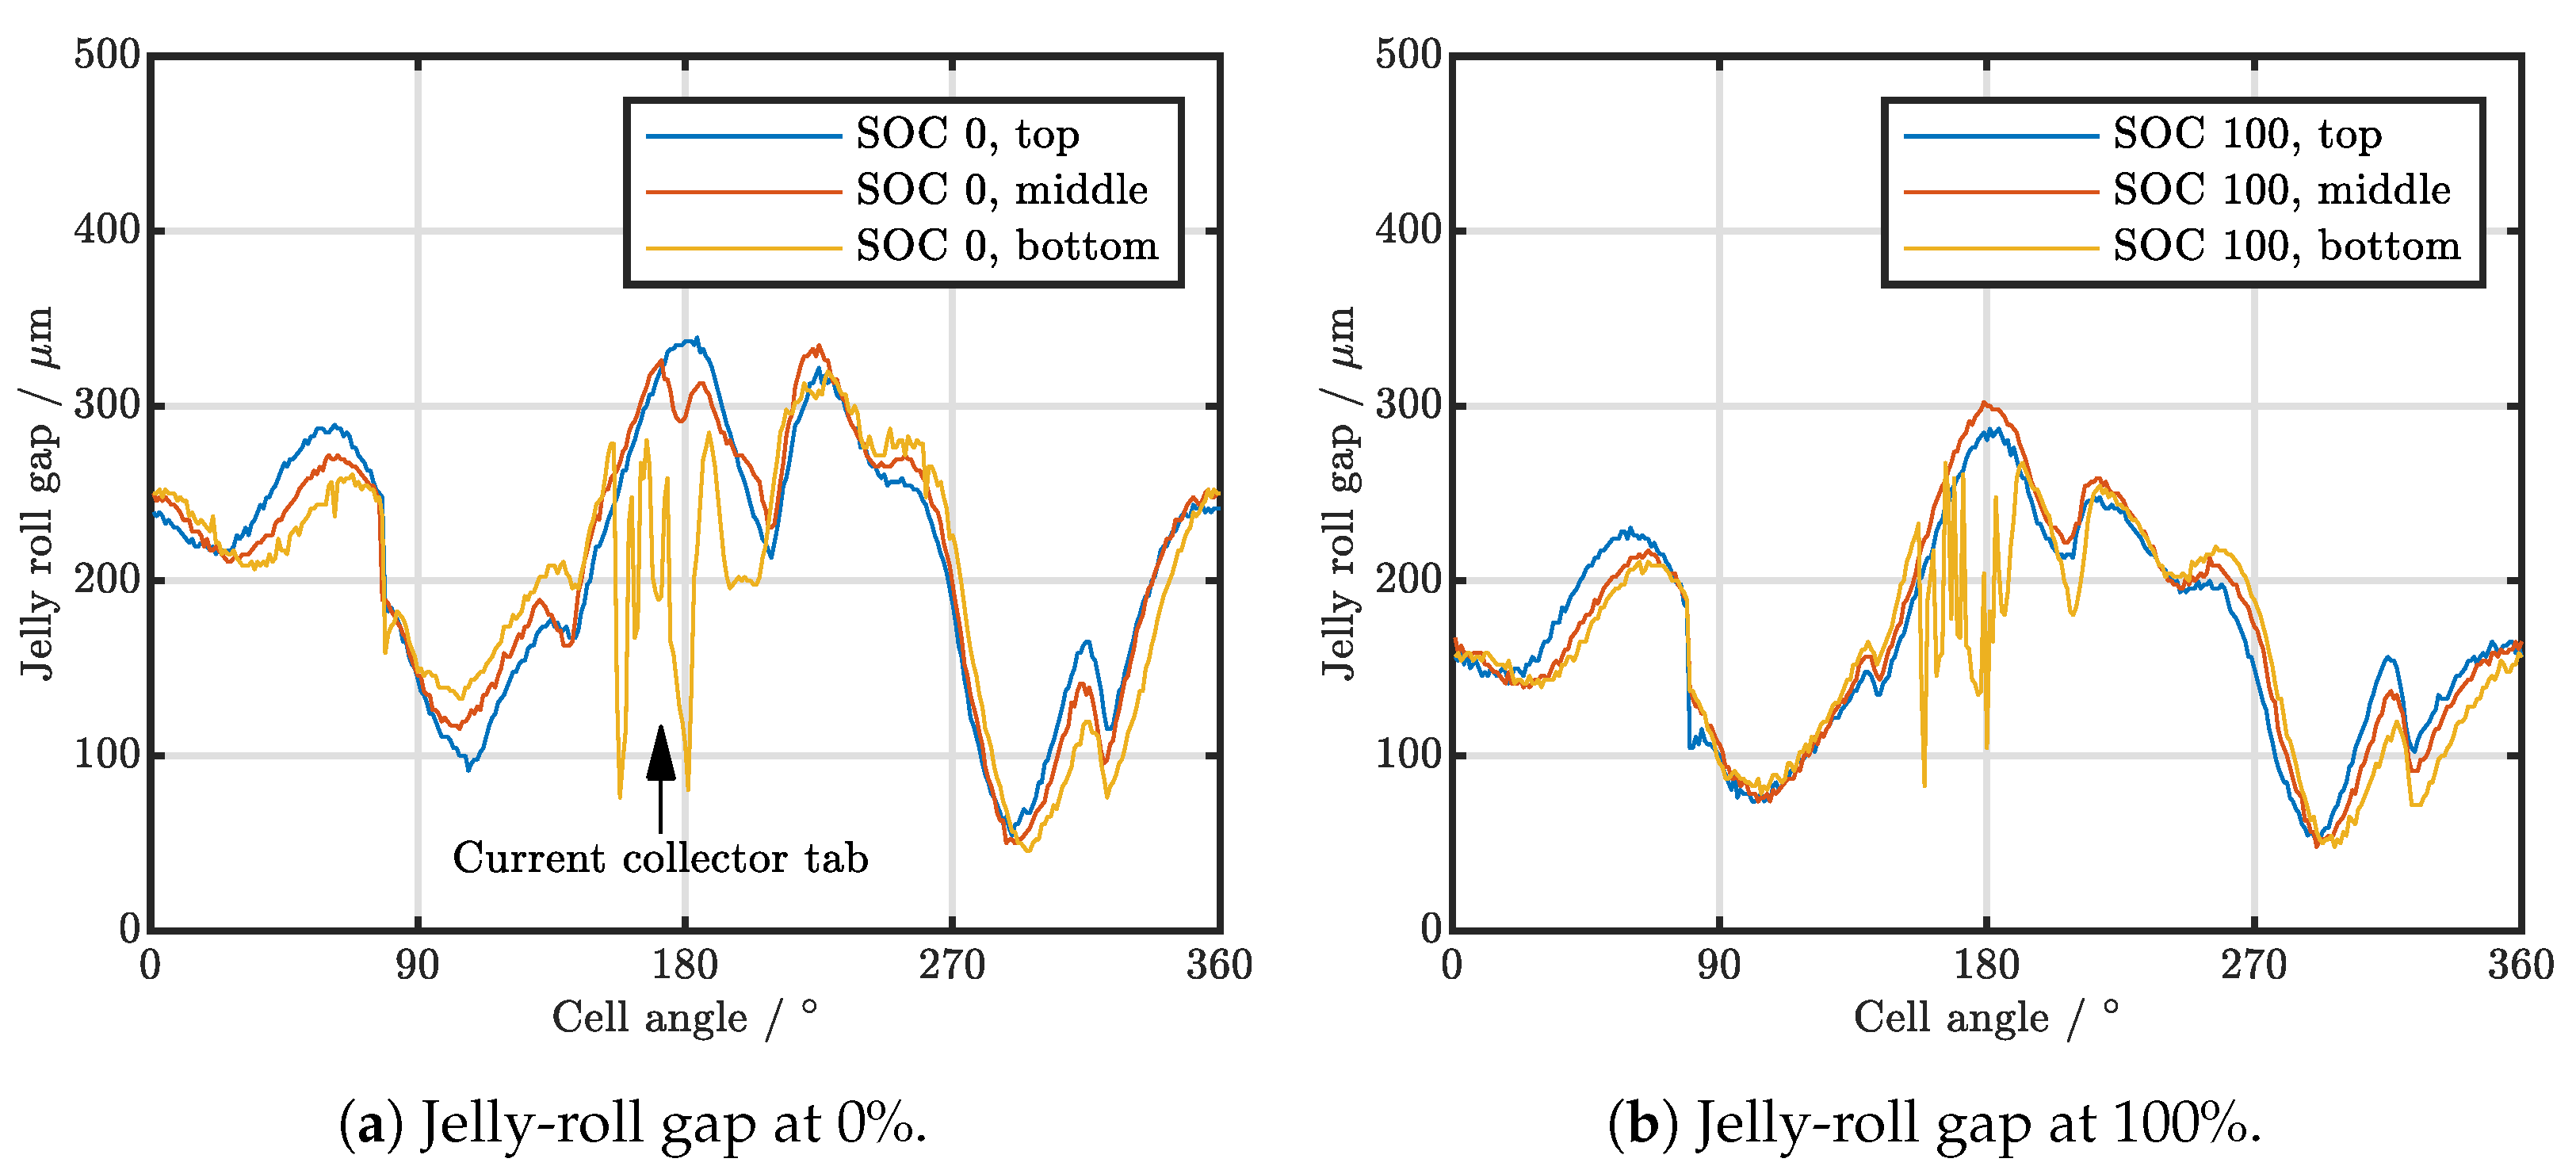
3.1. Cell-to-Cell Variation and Influence of Position

The results of the first investigation regarding cell-to-cell variations and SOC dependence on the jelly-roll gap are depicted in Figure 3a–d for four new Samsung INR18650-25RM cells. For these, the difference between 0% and 100% SOC is substantial, with the difference exceeding 90 μ m at certain locations, for example at 320 for Cell 2. Comparing the results for the four cells, significant differences between them can be seen, but there are also some characteristic similar points.
Analyzing the influence of the position of the cross-section in Figure 4 reveals only slight differences for various axial positions, indicating relatively similar jelly-roll gaps along the axial axis of the cell. For the analysis at the bottom axial position, strong fluctuations are displayed in the plots at around 80 , where the current collector tab is located.
The CT scan in Figure 5a of the bottom part of the cell reveals that characteristic points of the jelly-roll gap at around 90 and around 270 are partly caused by mechanical constraints of the jelly roll from the current collector tab and the contact points of the jelly roll with the case. Differences in the shapes of the curves and of characteristic low points can be explained by different electrode, jelly-roll, and case dimensions and shapes, also referred to as the “potato effect” [42], and different orientation and positioning or minor mechanical deviations, such as the different curvatures of the endings of the anode current collectors, as depicted in Figure 5b. In addition, the current collector tabs within the jelly roll also pose a mechanical constraint. While, as might be expected, the cell-to-cell variations are smaller at locations where the cell is mechanically constrained, in the regions that are not directly constrained, substantially higher cell-to-cell variations occur.

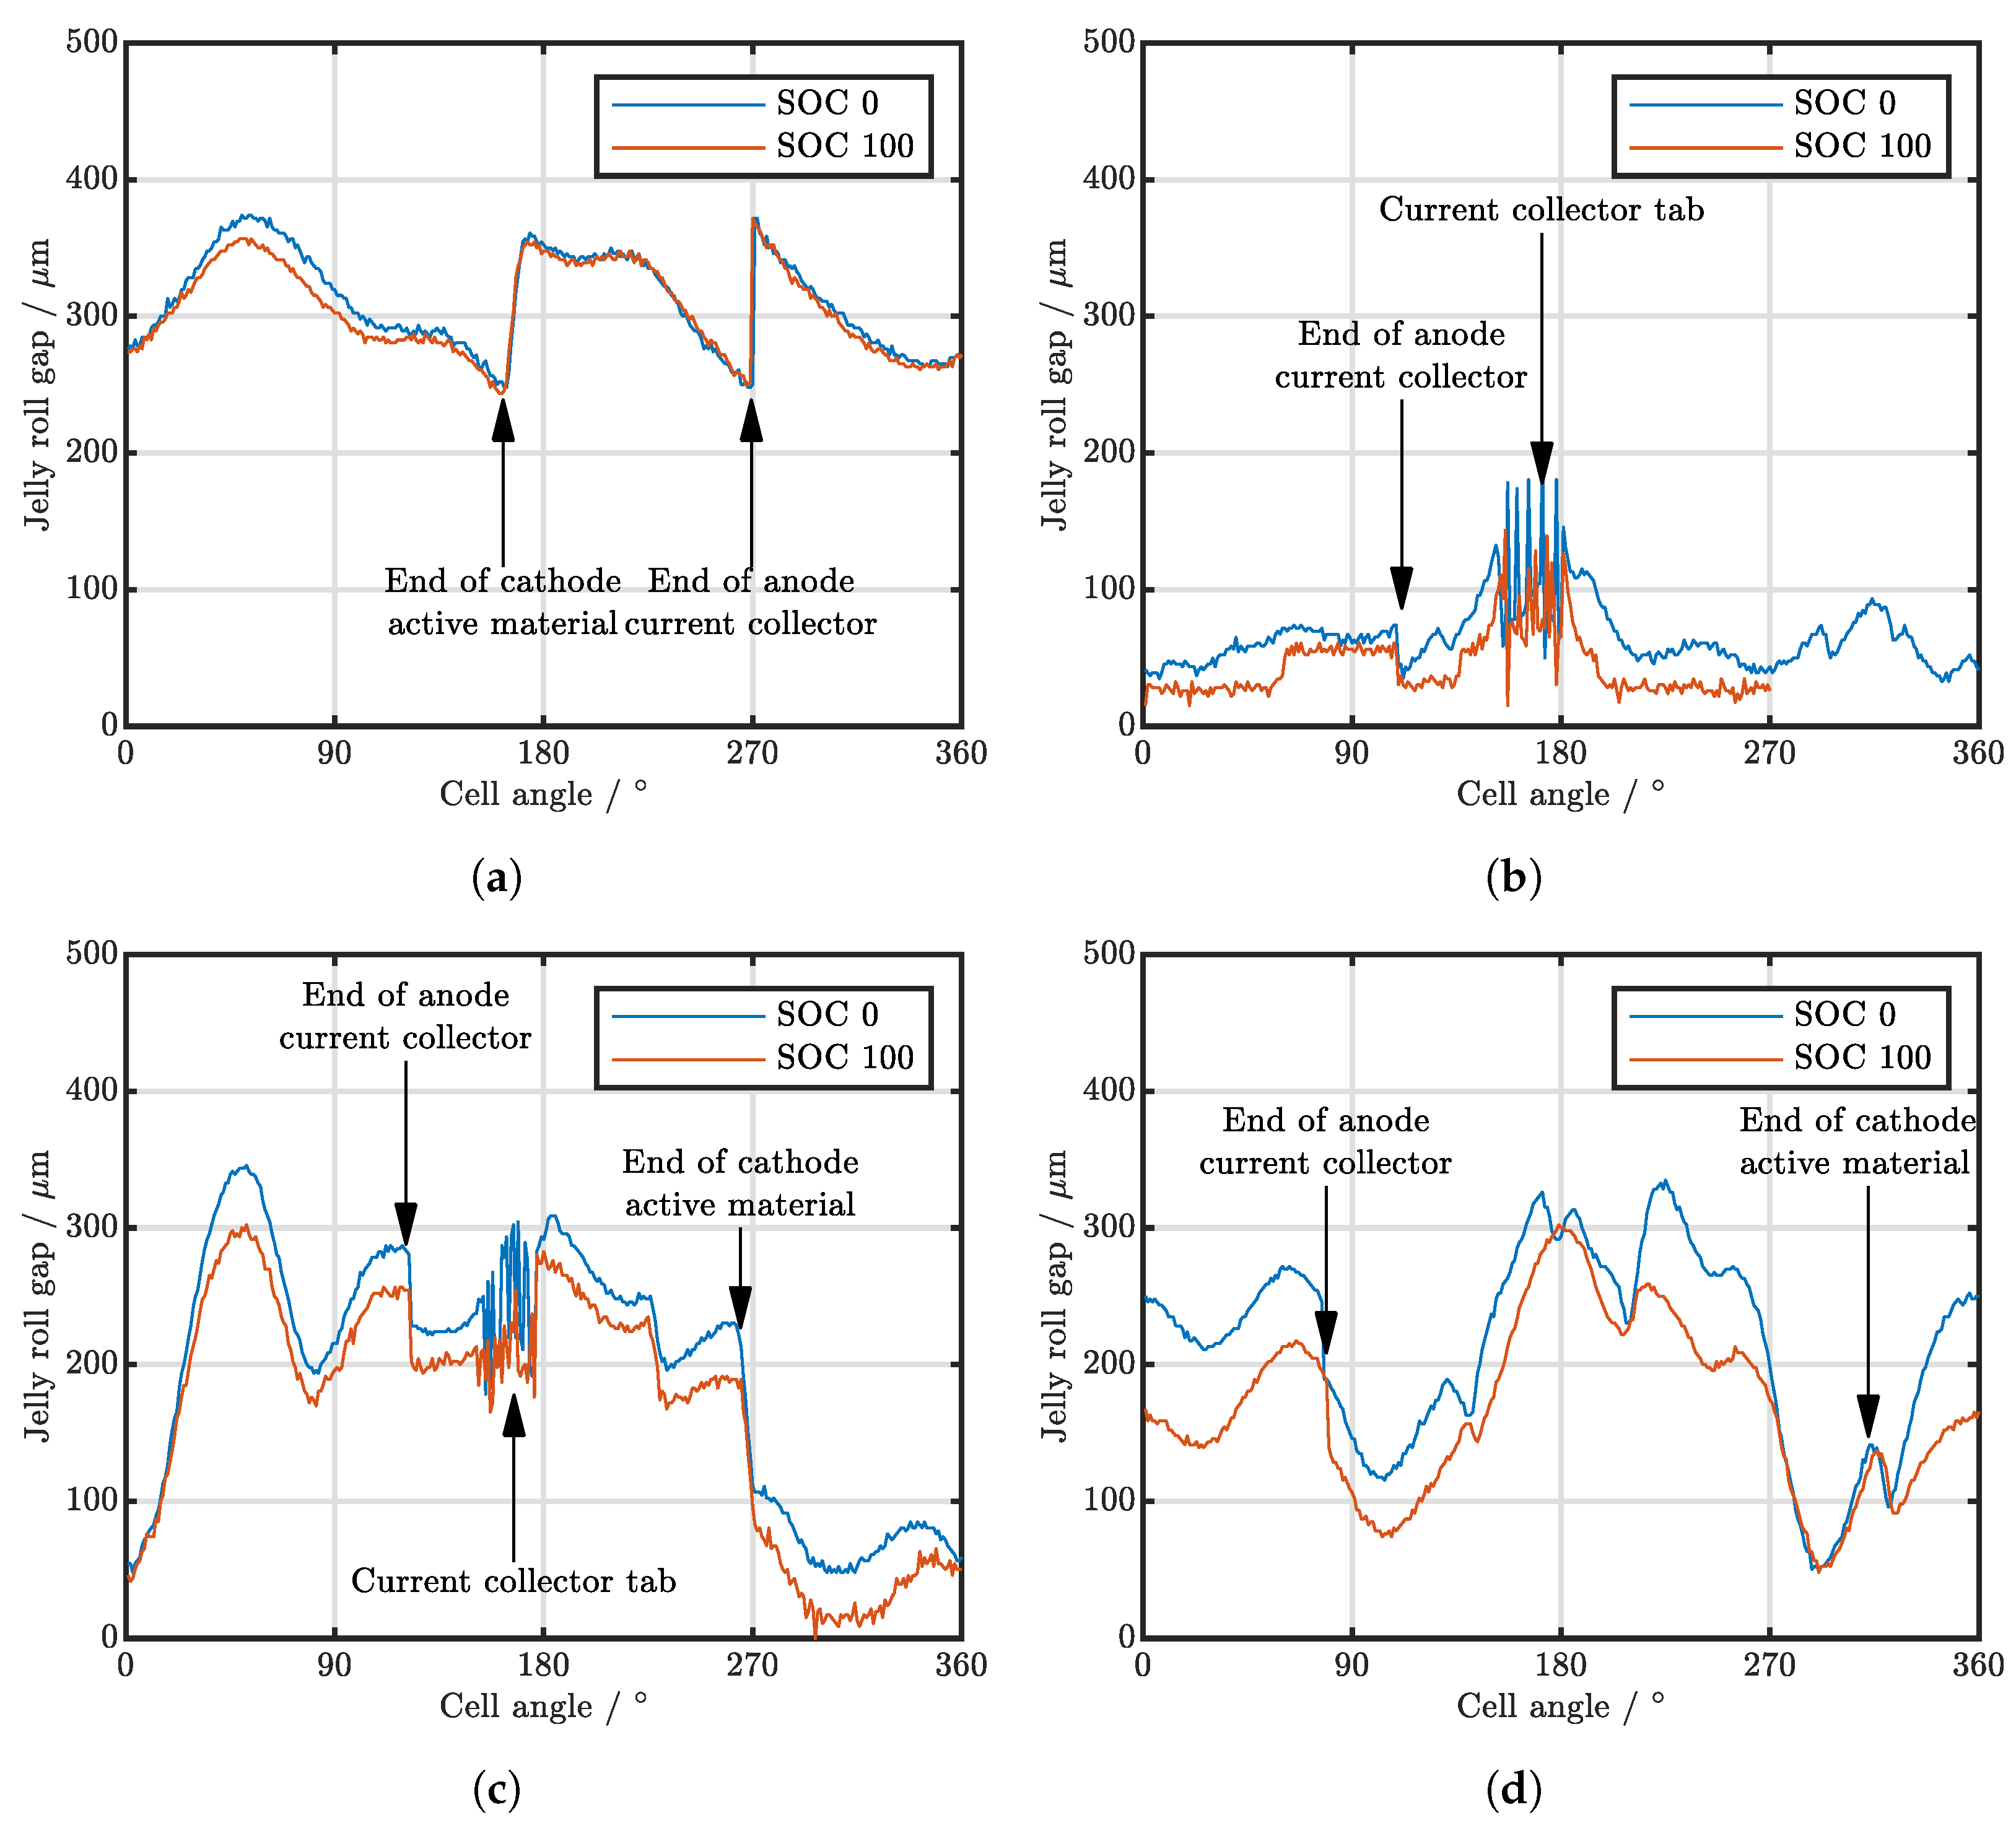
3.2. Analysis of Various Cell Types

An analysis of the jelly-roll gap width for various 18650 cell types is depicted in Figure 6. As the analysis of the cell-to-cell variations revealed substantial differences in jelly-roll gap sizes among cells, especially in the unconstrained regions, this analysis should merely give an overview of the range of magnitudes of jelly-roll gaps for different cell types and cannot be considered representative. Due to the high measurement time associated with the CT scans, it was not possible to characterize multiple cells for every cell type, so there is some risk that outliers may be shown. An overview over gap sizes for the investigated cells is given in Table 2.
The analysis of the LFP cell A123 APR18650M1B in Figure 6a reveals a large jelly-roll gap with a minimum distance of 240 μ m . Characteristic drops in gap size can be observed at around 170 , where the cathode active material ends, and around 270 , where the anode current collector ends. For this first cycle, the SOC only seems to have a limited impact on the jelly-gap size. The analysis of the LG INR18650MJ1 in Figure 6b revealed a tiny jelly-roll gap, which could not even be resolved for 100% SOC due to the small gap size of less than 50 μ m and scattering and reflection effects from the case. The anode current collector appears to be wrapped twice around the jelly roll. Characteristic drops occur at 120 , where the current collector ends. By contrast, the end of the anode active material causes no significant drop, which we assumed to be because it thins out at 0 (as does the cathode). For this cell, the current collector tab reaches up to the analyzed cross-section in the middle of the cell, which causes the observed fluctuations for the evaluation algorithm from 150 to 180 . The analysis of the SONY US18650VTC4 shown in Figure 6c revealed substantial differences in gap sizes from almost direct contact with the case up to more than 340 μ m because the case is substantially larger than the contained jelly roll. Reductions in the jelly-roll gap size can be observed at an angle of around 140 , where the anode current collector ends, as well as at 270 , where the cathode active material ends. Most probably, the drop at 230 can be attributed to the end of the anode active material. The current collector tab causes the fluctuations at around 150 to 180 and also mechanically constrains the jelly roll from this angle. Charging from 0 to 100% SOC decreased the jelly-roll gap sizes by up to 50 μ m . The Samsung INR18650-25RM is displayed again for comparison in Figure 6d.
For both the PAN NCR18650B and the PAN NCR18650PF, the jelly-roll gaps were so small that they could not be evaluated using the algorithm over a large section of the cell, which is why no results are presented here. Nevertheless, their images are also included in the digital appendix.
As can be seen in Figure 7, substantial differences in jelly-roll gap size can also be observed in 21700 cells. The analysis of the Molicell INR21700 in Figure 7a revealed substantial jelly-roll gaps of greater than 170 μ m . Reductions in jelly-roll gap size can be seen at an angle of around 80 , where the anode current collector ends, as well as around 260 , where the cathode active material ends. Presumably, the minor reduction at around 210 can be attributed to the end of the anode active material. The current collector tab causes the fluctuations at around 150 to 180 , and the tab also mechanically constrains the jelly roll from this angle. The differences between the charged and discharged states reach up to 40 μ m for the new cell. The analysis of the Samsung INR21700-40T in Figure 7b revealed moderate gap sizes of greater than 60 μ m . A reduction in the jelly-roll gap size can be seen at around 250 , where the cathode active material ends, as well as at 350 , where the anode current collector ends. It is likely that the drop at 200 can be attributed to the end of the anode active material. The differences in gap size between charged and discharged states are substantial for this cell in the new state, with a maximum of 110 μ m .

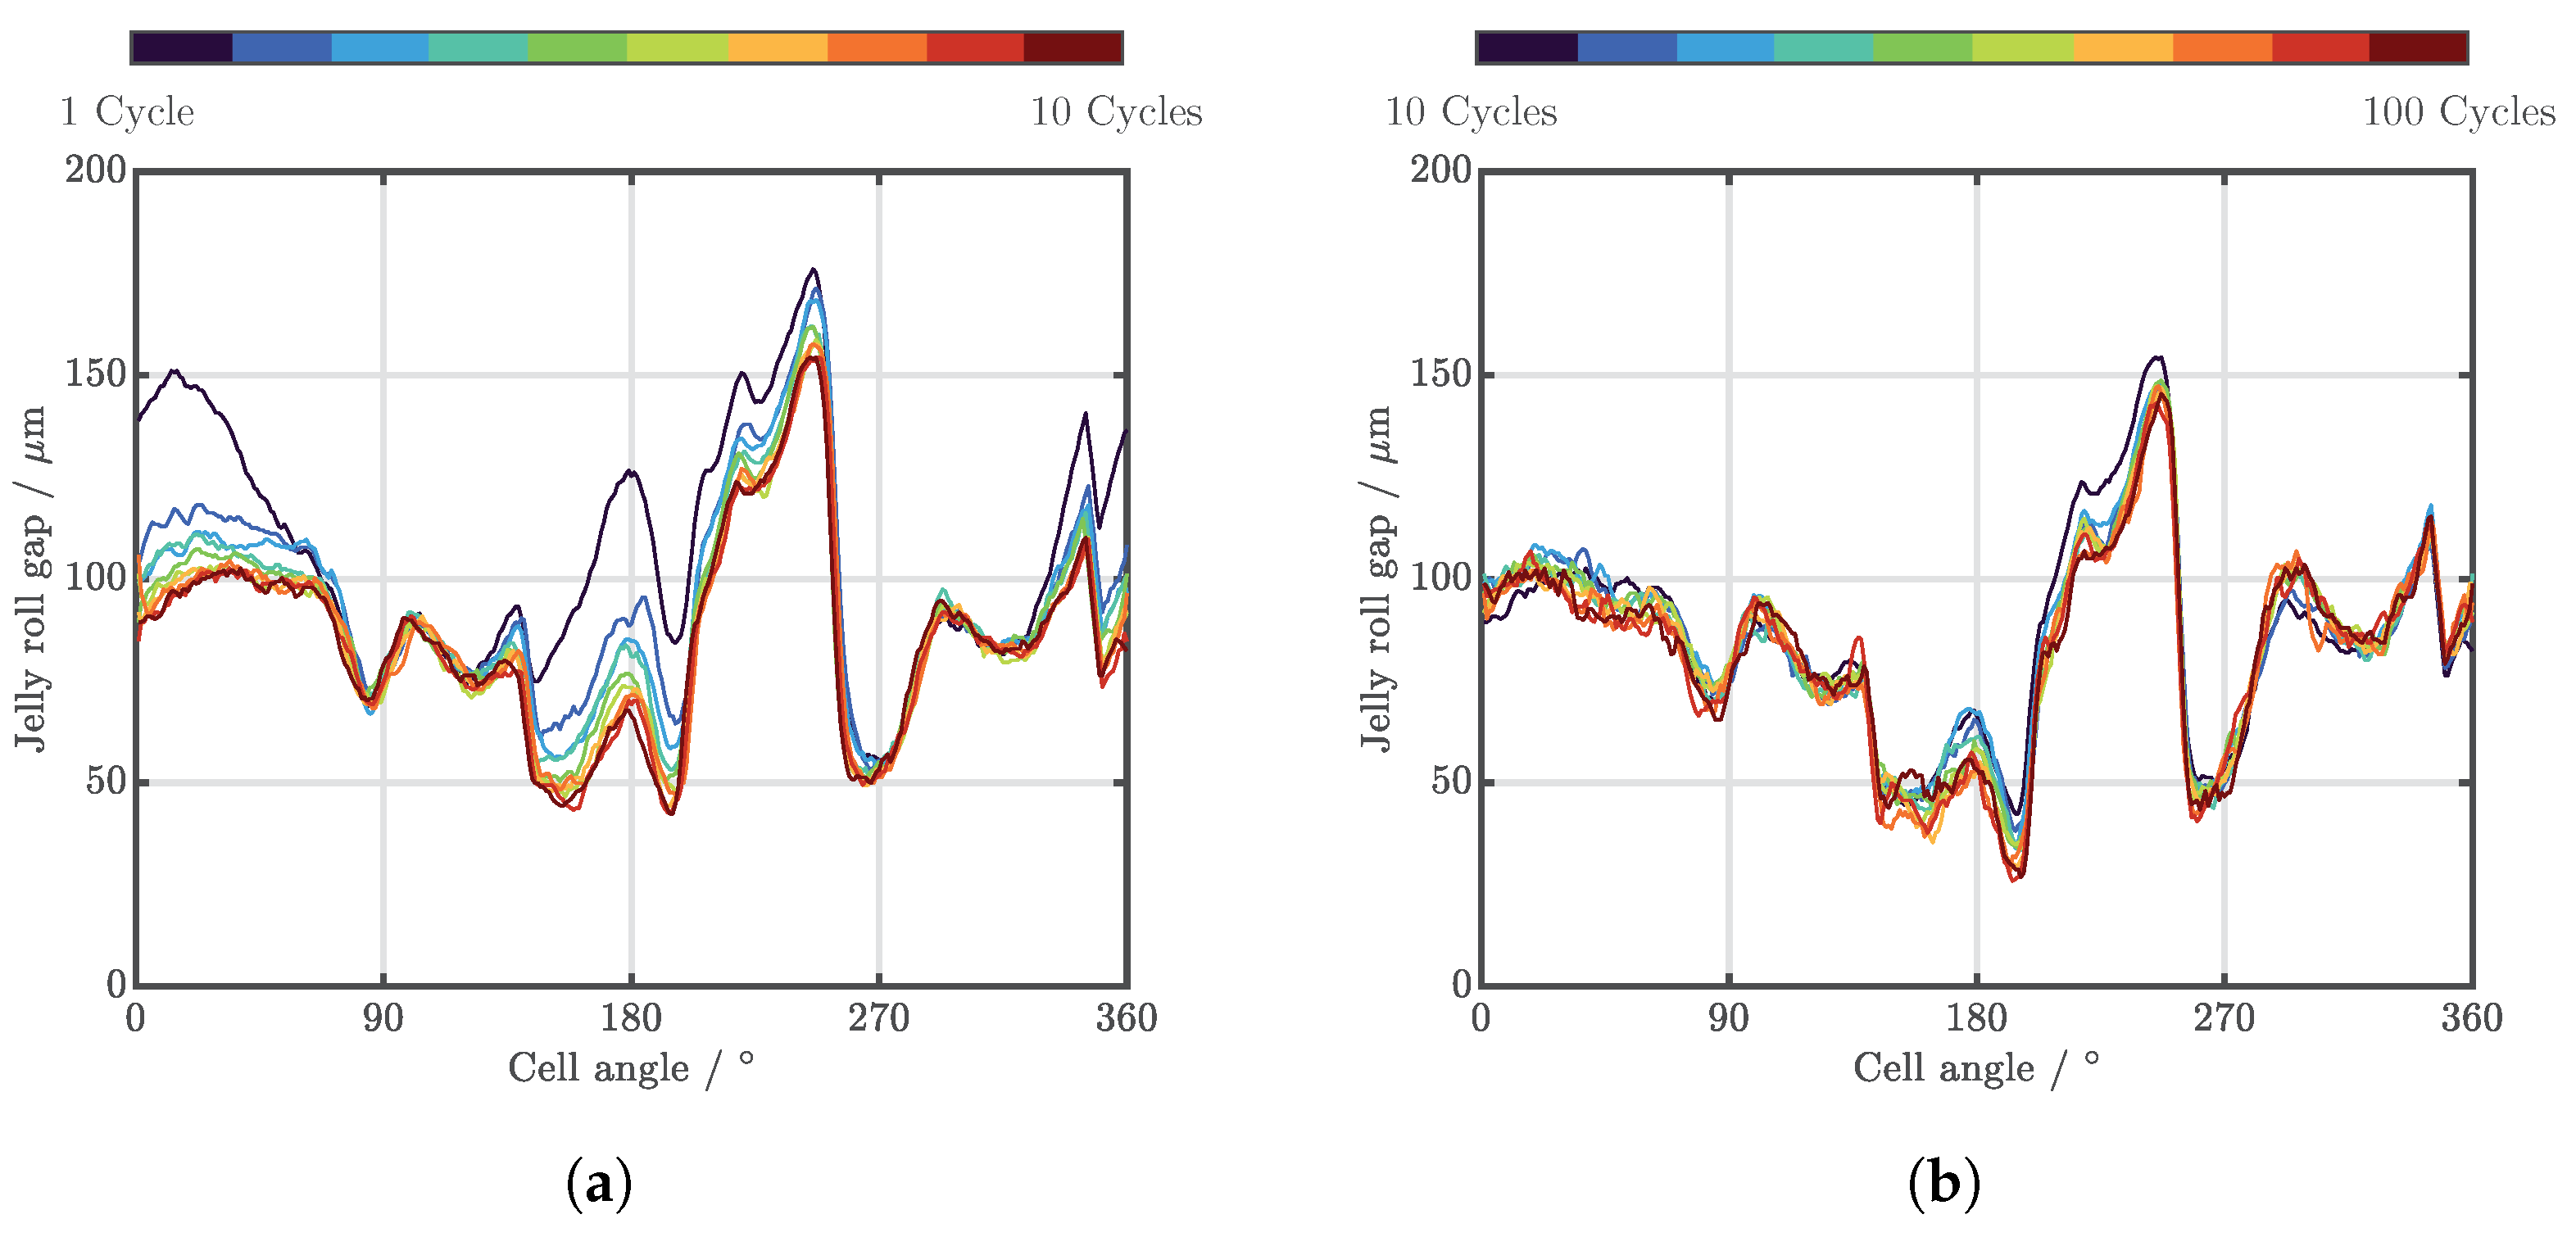
3.3. Analysis of the Influence of Cyclic Aging on the Jelly-Roll Gap

Analysis of the development of the jelly-roll gap at 100% SOC during the first 10 cycles (every cycle) and for the first 100 cycles (every 10 cycles) was conducted for the Samsung INR18650-25RM and Samsung INR21700-40T.
The analysis for the Samsung INR18650-25RM in Figure 8a shows that, while the gap at the local minima at around 90 and 280 remains constant, it is significantly reduced in other regions by up to 70 μ m after the 10th cycle. Further cycling with CT scans conducted every 10th cycle, as depicted in Figure 8b, shows further gap decreases of up to 100 μ m at some locations.
The analysis of the Samsung INR21700-40T in Figure 9a shows some stable local minima, while the gap size is reduced significantly in the range from 150 to 200 for the first 10 cycles. Further cycling, as depicted in Figure 9b, has a smaller impact on the jelly-roll gap than for the Samsung INR18650-25RM.
For both cells, it is noticeable that the jelly-roll gap reduction is the highest in the first and the immediately following cycles, while the gradients decrease with progressing aging. Causes for this could be solid electrolyte interphase (SEI) formation, other boundary layer formation processes from particle-to-electrode levels [14,51,52,53,54,55], and/or electrode and binder swelling [15,56], which occur during formation and the first cycles [57,58]. Other potential causes may be increased wettability of the electrodes and higher electrolyte absportion into the electrode pores [59] or outgassing and redistribution of entrapped gas from the electrolyte infiltration process [60,61].
Additionally, it is noticeable that some spots exhibit a significant reduction in the jelly-roll gap while it remains almost constant at other locations. A potential explanation could be that at some spots, the jelly roll is already mechanically constrained or in direct contact with the case, thus offering no space for swelling expansion, while in other spots, there are still substantial void spaces available to allow for swelling. The observation that the changes in jelly-roll gap sizes decrease with progressing aging could be an indicator that either the swelling processes slow down after the finalization of the formation processes or that cell internal gaps are closed, causing stress increases from that point on.

4. Conclusions

The investigations have revealed a significant influence of the SOC on the jelly-roll gap for most new cells, most probably caused by anode active material expansion. While cells of the same type exhibit similar patterns in gap size, there are significant cell-to-cell variations observable due to different shapes and dimensions of jelly rolls and cases. Current collector tabs and ends of jelly-roll windings can act as mechanical constraints for the jelly roll. Among different cell types, there are significant differences in gap sizes: from no resolvable distance up to more than 300 μ m . Cyclic aging tests have shown that gap size significantly decreases at certain spots during the first cycles, potentially due to ongoing SEI formation processes, while slowing down after further aging. Locations where the jelly roll is constrained naturally exhibited only small changes in the jelly-roll gap.
These observations are crucial for both thermal analysis and mechanical testing. For thermal analysis, a large jelly-roll gap increases the thermal resistance between the cell surface and core. Additionally, due to the size variations in the circumferential direction, the positioning of thermal sensors can influence thermal measurements. Therefore, initial cycling might be beneficial to close initial gaps for the thermal characterization of cylindrical cells. For mechanical abuse testing, the conformation of larger gaps for new cells and low SOCs indicates that, while the cells do not have a high hazardous potential in this state due to low energy content, they are more susceptible to mechanical damage, as larger gaps offer more space for relative movement. This could increase the risk if the cells remain in use. With an increasing proportion of silicon in the anode active material and increased expansion, adequate design of the jelly-roll gap size will become increasingly important. Additionally, the integration of compressible materials to allow for jelly-roll expansion while prohibiting delamination of the electrode layers and relative movement of the jelly-roll might become viable or even necessary.
Further investigations may include investigation of the swelling during the initial formation process, long-term cycling down to 70% SOH, and various stress factors such as cycling rates, SOC ranges, and different ambient temperature conditions in order to analyze the impact of these parameters on swelling. The gray-value analysis script could also be used in a similar way to analyze inhomogeneities of electrode thicknesses.

Author Contributions

Conceptualization, M.S. (Markus Spielbauer), M.S. (Marco Steinhardt), O.B. and A.J.; methodology, M.S. (Markus Spielbauer), M.S. (Marco Steinhardt), O.B. and A.J.; software, M.S. (Markus Spielbauer); formal analysis, M.S. (Markus Spielbauer), M.S. (Marco Steinhardt) and A.A.; investigation, M.S. (Markus Spielbauer) and M.S. (Marco Steinhardt); resources, M.S. (Markus Spielbauer), M.S. (Marco Steinhardt), J.S., O.B. and A.J.; data curation, M.S. (Markus Spielbauer); writing—original draft preparation, M.S. (Markus Spielbauer); writing—review and editing, M.S. (Markus Spielbauer), M.S. (Marco Steinhardt), J.S., A.A., O.B. and A.J.; visualization, M.S. (Markus Spielbauer); supervision, O.B. and A.J.; project administration, O.B. and A.J.; funding acquisition, O.B. and A.J. All authors have read and agreed to the published version of the manuscript.

Funding

Funding from The Bavarian Ministry for Science, Research and Culture for the project Safe-Mu-Mob is gratefully acknowledged. This work was financially supported by the Munich University of Applied Sciences HM and the German Research Foundation (DFG) through the “Open Access Publishing” program.

Data Availability Statement

The data presented in this study are openly available on Figshare at https://doi.org/10.6084/m9.figshare.21546162.

Acknowledgments

The authors also want to thank Gregor Feiertag for supporting this project by granting access to the CT.

Conflicts of Interest

The authors declare no conflict of interest.

Abbreviations

The following abbreviations are used in this manuscript:
CCConstant Current
CTComputed Tomography
CVConstant Voltage
LFPLithium Ferro–Phosphate
NNPNickel Oxide-Based New Platform
SEISolid Electrolyte Interphase
SOCState of Charge
SOHState of Health

References

  1. Sauerteig, D.; Ivanov, S.; Reinshagen, H.; Bund, A. Reversible and irreversible dilation of lithium-ion battery electrodes investigated by in-situ dilatometry. J. Power Sources 2017, 342, 939–946. [Google Scholar] [CrossRef]
  2. Sauerteig, D. Implementierung und Parametrierung Eines Physikalischen Simulationsmodells Einer Lithium-Ionen Zelle zur Analyse Elektrochemisch-Mechanischer Wechselwirkungen. Ph.D. Thesis, Technische Universität Ilmenau, Ilmenau, Germany, 2018. [Google Scholar]
  3. Park, J.; Kalnaus, S.; Han, S.; Lee, Y.K.; Less, G.B.; Dudney, N.J.; Daniel, C.; Sastry, A.M. In situ atomic force microscopy studies on lithium (de)intercalation-induced morphology changes in LixCoO2 micro-machined thin film electrodes. J. Power Sources 2013, 222, 417–425. [Google Scholar] [CrossRef]
  4. Lee, J.H.; Lee, H.M.; Ahn, S. Battery dimensional changes occurring during charge/discharge cycles—Thin rectangular lithium ion and polymer cells. J. Power Sources 2003, 119–121, 833–837. [Google Scholar] [CrossRef]
  5. Wang, X.; Song, Y.; Cui, H.; Liu, J.; Huo, H.; Wang, L.; Gao, Y.; He, X. Insight into the electrochemical behaviors of NCM811|SiO–Gr pouch battery through thickness variation. Energy Environ. Mater. 2022. Accepted. [Google Scholar] [CrossRef]
  6. Besenhard, J.O.; Fritz, H.P. The Electrochemistry of Black Carbons. Angew. Chem. Int. Ed. Eng. 1983, 22, 950–975. [Google Scholar] [CrossRef]
  7. Ohzuku, T.; Iwakoshi, Y.; Sawai, K. Formation of Lithium-Graphite Intercalation Compounds in Nonaqueous Electrolytes and Their Application as a Negative Electrode for a Lithium Ion (Shuttlecock) Cell. J. Electrochem. Soc. 1993, 140, 2490. [Google Scholar] [CrossRef]
  8. Billaud, D.; Henry, F.X.; Lelaurain, M.; Willmann, P. Revisited structures of dense and dilute stage II lithium-graphite intercalation compounds. J. Phys. Chem. Solids 1995, 57, 775–781. [Google Scholar] [CrossRef]
  9. Schweidler, S.; de Biasi, L.; Schiele, A.; Hartmann, P.; Brezesinski, T.; Janek, J. Volume Changes of Graphite Anodes Revisited: A Combined Operando X-ray Diffraction and In Situ Pressure Analysis Study. J. Phys. Chem. C 2018, 122, 8829–8835. [Google Scholar] [CrossRef]
  10. Vetter, J.; Novák, P.; Wagner, M.R.; Veit, C.; Möller, K.C.; Besenhard, J.O.; Winter, M.; Wohlfahrt-Mehrens, M.; Vogler, C.; Hammouche, A. Ageing mechanisms in lithium-ion batteries. J. Power Sources 2005, 147, 269–281. [Google Scholar] [CrossRef]
  11. Petzl, M.; Kasper, M.; Danzer, M.A. Lithium plating in a commercial lithium-ion battery—A low-temperature aging study. J. Power Sources 2015, 275, 799–807. [Google Scholar] [CrossRef]
  12. Luo, J.; Dai, C.Y.; Wang, Z.; Liu, K.; Mao, W.G.; Fang, D.N.; Chen, X. In-situ measurements of mechanical and volume change of LiCoO2 lithium-ion batteries during repeated charge–discharge cycling by using digital image correlation. Measurement 2016, 94, 759–770. [Google Scholar] [CrossRef] [Green Version]
  13. Oh, K.Y.; Siegel, J.B.; Secondo, L.; Kim, S.U.; Samad, N.A.; Qin, J.; Anderson, D.; Garikipati, K.; Knobloch, A.; Epureanu, B.I.; et al. Rate dependence of swelling in lithium-ion cells. J. Power Sources 2014, 267, 197–202. [Google Scholar] [CrossRef]
  14. Gor, G.Y.; Cannarella, J.; Leng, C.Z.; Vishnyakov, A.; Arnold, C.B. Swelling and softening of lithium-ion battery separators in electrolyte solvents. J. Power Sources 2015, 294, 167–172. [Google Scholar] [CrossRef]
  15. Qian, J.; Wiener, C.G.; Zhu, Y.; Vogt, B.D. Swelling and plasticization of polymeric binders by Li-containing carbonate electrolytes using quartz crystal microbalance with dissipation. Polymer 2018, 143, 237–244. [Google Scholar] [CrossRef] [Green Version]
  16. Zhao, Y.; Spingler, F.B.; Patel, Y.; Offer, G.J.; Jossen, A. Localized Swelling Inhomogeneity Detection in Lithium Ion Cells Using Multi-Dimensional Laser Scanning. J. Ofthe Electrochem. Soc. 2019, 166, A27–A34. [Google Scholar] [CrossRef]
  17. Willenberg, L.; Dechent, P.; Fuchs, G.; Teuber, M.; Eckert, M.; Graff, M.; Kürten, N.; Sauer, D.U.; Figgemeier, E. The Development of Jelly Roll Deformation in 18650 Lithium-Ion Batteries at Low State of Charge. J. Electrochem. Soc. 2020, 167, 120502. [Google Scholar] [CrossRef]
  18. Heenan, T.M.M.; Llewellyn, A.V.; Leach, A.S.; Kok, M.D.R.; Tan, C.; Jervis, R.; Brett, D.J.L.; Shearing, P.R. Resolving Li-Ion Battery Electrode Particles Using Rapid Lab-Based X-Ray Nano-Computed Tomography for High-Throughput Quantification. Adv. Sci. 2020, 7, 2000362. [Google Scholar] [CrossRef]
  19. Le Houx, J.; Kramer, D. X-ray tomography for lithium ion battery electrode characterisation—A review. Energy Rep. 2021, 7, 9–14. [Google Scholar] [CrossRef]
  20. Boyce, A.M.; Martínez-Pañeda, E.; Wade, A.; Zhang, Y.S.; Bailey, J.J.; Heenan, T.M.; Brett, D.J.; Shearing, P.R. Cracking predictions of lithium-ion battery electrodes by X-ray computed tomography and modelling. J. Power Sources 2022, 526, 231119. [Google Scholar] [CrossRef]
  21. Li, W.; Crompton, K.R.; Hacker, C.; Ostanek, J.K. Comparison of Current Interrupt Device and Vent Design for 18650 Format Lithium-ion Battery Caps. J. Energy Storage 2020, 32, 101890. [Google Scholar] [CrossRef]
  22. Berg, P.; Spielbauer, M.; Tillinger, M.; Merkel, M.; Schoenfuss, M.; Bohlen, O.; Jossen, A. Durability of lithium-ion 18650 cells under random vibration load with respect to the inner cell design. J. Energy Storage 2020, 31, 101499. [Google Scholar] [CrossRef]
  23. Chen, C.; Wei, Y.; Zhao, Z.; Zou, Y.; Luo, D. Investigation of the swelling failure of lithium-ion battery packs at low temperatures using 2D/3D X-ray computed tomography. Electrochim. Acta 2019, 305, 65–71. [Google Scholar] [CrossRef]
  24. Louli, A.J.; Eldesoky, A.; Weber, R.; Genovese, M.; Coon, M.; deGooyer, J.; Deng, Z.; White, R.T.; Lee, J.; Rodgers, T.; et al. Diagnosing and correcting anode-free cell failure via electrolyte and morphological analysis. Nat. Energy 2020, 5, 693–702. [Google Scholar] [CrossRef]
  25. Waldmann, T.; Gorse, S.; Samtleben, T.; Schneider, G.; Knoblauch, V.; Wohlfahrt-Mehrens, M. A Mechanical Aging Mechanism in Lithium-Ion Batteries. J. Electrochem. Soc. 2014, 161, A1742–A1747. [Google Scholar] [CrossRef]
  26. Pfrang, A.; Kersys, A.; Kriston, A.; Sauer, D.U.; Rahe, C.; Käbitz, S.; Figgemeier, E. Geometrical Inhomogeneities as Cause of Mechanical Failure in Commercial 18650 Lithium Ion Cells. J. Electrochem. Soc. 2019, 166, A3745–A3752. [Google Scholar] [CrossRef]
  27. Carter, R.; Klein, E.J.; Atkinson, R.W.; Love, C.T. Mechanical collapse as primary degradation mode in mandrel-free 18650 Li-ion cells operated at 0 °C. J. Power Sources 2019, 437, 226820. [Google Scholar] [CrossRef]
  28. Brand, M.J.; Schuster, S.F.; Bach, T.; Fleder, E.; Stelz, M.; Gläser, S.; Müller, J.; Sextl, G.; Jossen, A. Effects of vibrations and shocks on lithium-ion cells. J. Power Sources 2015, 288, 62–69. [Google Scholar] [CrossRef]
  29. Sahraei, E.; Kahn, M.; Meier, J.; Wierzbicki, T. Modelling of cracks developed in lithium-ion cells under mechanical loading. RSC Adv. 2015, 5, 80369–80380. [Google Scholar] [CrossRef]
  30. Zhu, J.; Li, W.; Wierzbicki, T.; Xia, Y.; Harding, J. Deformation and failure of lithium-ion batteries treated as a discrete layered structure. Int. J. Plast. 2019, 121, 293–311. [Google Scholar] [CrossRef]
  31. Finegan, D.P.; Scheel, M.; Robinson, J.B.; Tjaden, B.; Hunt, I.; Mason, T.J.; Millichamp, J.; Di Michiel, M.; Offer, G.J.; Hinds, G.; et al. In-operando high-speed tomography of lithium-ion batteries during thermal runaway. Nat. Commun. 2015, 6, 6924. [Google Scholar] [CrossRef] [Green Version]
  32. Finegan, D.P.; Darcy, E.; Keyser, M.; Tjaden, B.; Heenan, T.M.M.; Jervis, R.; Bailey, J.J.; Malik, R.; Vo, N.T.; Magdysyuk, O.V.; et al. Characterising thermal runaway within lithium-ion cells by inducing and monitoring internal short circuits. Energy Environ. Sci. 2017, 10, 1377–1388. [Google Scholar] [CrossRef] [Green Version]
  33. Pham, M.T.; Darst, J.J.; Walker, W.Q.; Heenan, T.M.; Patel, D.; Iacoviello, F.; Rack, A.; Olbinado, M.P.; Hinds, G.; Brett, D.J.; et al. Prevention of lithium-ion battery thermal runaway using polymer-substrate current collectors. Cell Rep. Phys. Sci. 2021, 2, 100360. [Google Scholar] [CrossRef]
  34. Waldmann, T.; Scurtu, R.G.; Richter, K.; Wohlfahrt-Mehrens, M. 18650 vs. 21700 Li-ion cells—A direct comparison of electrochemical, thermal, and geometrical properties. J. Power Sources 2020, 472, 228614. [Google Scholar] [CrossRef]
  35. Heenan, T.M.; Tan, C.; Hack, J.; Brett, D.J.; Shearing, P.R. Developments in X-ray tomography characterization for electrochemical devices. Mater. Today 2019, 31, 69–85. [Google Scholar] [CrossRef]
  36. Heenan, T.M.M.; Jnawali, A.; Kok, M.D.R.; Tranter, T.G.; Tan, C.; Dimitrijevic, A.; Jervis, R.; Brett, D.J.L.; Shearing, P.R. An Advanced Microstructural and Electrochemical Datasheet on 18650 Li-Ion Batteries with Nickel-Rich NMC811 Cathodes and Graphite-Silicon Anodes. J. Electrochem. Soc. 2020, 167, 140530. [Google Scholar] [CrossRef]
  37. Wu, Y.; Saxena, S.; Xing, Y.; Wang, Y.; Li, C.; Yung, W.; Pecht, M. Analysis of Manufacturing-Induced Defects and Structural Deformations in Lithium-Ion Batteries Using Computed Tomography. Energies 2018, 11, 925. [Google Scholar] [CrossRef] [Green Version]
  38. Kok, M.D.R.; Robinson, J.B.; Weaving, J.S.; Jnawali, A.; Pham, M.; Iacoviello, F.; Brett, D.J.L.; Shearing, P.R. Virtual unrolling of spirally-wound lithium-ion cells for correlative degradation studies and predictive fault detection. Sustain. Energy Fuels 2019, 3, 2972–2976. [Google Scholar] [CrossRef] [Green Version]
  39. Ziesche, R.F.; Arlt, T.; Finegan, D.P.; Heenan, T.M.M.; Tengattini, A.; Baum, D.; Kardjilov, N.; Markötter, H.; Manke, I.; Kockelmann, W.; et al. 4D imaging of lithium-batteries using correlative neutron and X-ray tomography with a virtual unrolling technique. Nat. Commun. 2020, 11, 777. [Google Scholar] [CrossRef] [Green Version]
  40. Blazek, P.; Westenberger, P.; Erker, S.; Brinek, A.; Zikmund, T.; Rettenwander, D.; Wagner, N.P.; Keckes, J.; Kaiser, J.; Kazda, T.; et al. Axially and radially inhomogeneous swelling in commercial 18650 Li-ion battery cells. J. Energy Storage 2022, 52, 104563. [Google Scholar] [CrossRef]
  41. Tranter, T.G.; Timms, R.; Heenan, T.M.M.; Marquis, S.G.; Sulzer, V.; Jnawali, A.; Kok, M.D.R.; Please, C.P.; Chapman, S.J.; Shearing, P.R.; et al. Probing Heterogeneity in Li-Ion Batteries with Coupled Multiscale Models of Electrochemistry and Thermal Transport using Tomographic Domains. J. Electrochem. Soc. 2020, 167, 110538. [Google Scholar] [CrossRef]
  42. Hemmerling, J.; Guhathakurta, J.; Dettinger, F.; Fill, A.; Birke, K.P. Non-Uniform Circumferential Expansion of Cylindrical Li-Ion Cells—The Potato Effect. Batteries 2021, 7, 61. [Google Scholar] [CrossRef]
  43. Gaitonde, A.; Nimmagadda, A.; Marconnet, A. Measurement of interfacial thermal conductance in Lithium ion batteries. J. Power Sources 2017, 343, 431–436. [Google Scholar] [CrossRef]
  44. Spielbauer, M.; Soellner, J.; Berg, P.; Koch, K.; Keil, P.; Rosenmüller, C.; Bohlen, O.; Jossen, A. Experimental investigation of the impact of mechanical deformation on aging, safety and electrical behavior of 18650 lithium-ion battery cells. J. Energy Storage 2022, 55, 105564. [Google Scholar] [CrossRef]
  45. Lithium Werks. APR18650M1B 18650 Data Sheet; Lithium Werks: Austin, TX, USA, 2019. [Google Scholar]
  46. Sturm, J.; Rheinfeld, A.; Zilberman, I.; Spingler, F.B.; Kosch, S.; Frie, F.; Jossen, A. Modeling and simulation of inhomogeneities in a 18650 nickel-rich, silicon-graphite lithium-ion cell during fast charging. J. Power Sources 2019, 412, 204–223. [Google Scholar] [CrossRef] [Green Version]
  47. Panasonic. NCR18650B Data Sheet; Panasonic: Tokyo, Japan, 2022. [Google Scholar]
  48. Zhang, L.; Mu, Z.; Gao, X. Coupling Analysis and Performance Study of Commercial 18650 Lithium-Ion Batteries under Conditions of Temperature and Vibration. Energies 2018, 11, 2856. [Google Scholar] [CrossRef] [Green Version]
  49. Samsung. INR18650-25R Data Sheet; Samsung: Seoul, Korea, 2013. [Google Scholar]
  50. E-One Moli Energy. Molicell INR21700-P42A Data Sheet; E-One Moli Energy: Taiwan, China, 2019. [Google Scholar]
  51. Wohlfahrt-Mehrens, M.; Vogler, C.; Garche, J. Aging mechanisms of lithium cathode materials. J. Power Sources 2004, 127, 58–64. [Google Scholar] [CrossRef]
  52. Uddin, K.; Perera, S.; Widanage, W.; Somerville, L.; Marco, J. Characterising Lithium-Ion Battery Degradation through the Identification and Tracking of Electrochemical Battery Model Parameters. Batteries 2016, 2, 13. [Google Scholar] [CrossRef]
  53. Fath, J.P.; Dragicevic, D.; Bittel, L.; Nuhic, A.; Sieg, J.; Hahn, S.; Alsheimer, L.; Spier, B.; Wetzel, T. Quantification of aging mechanisms and inhomogeneity in cycled lithium-ion cells by differential voltage analysis. J. Energy Storage 2019, 25, 100813. [Google Scholar] [CrossRef]
  54. Han, X.; Lu, L.; Zheng, Y.; Feng, X.; Li, Z.; Li, J.; Ouyang, M. A review on the key issues of the lithium ion battery degradation among the whole life cycle. eTransportation 2019, 1, 100005. [Google Scholar] [CrossRef]
  55. Lu, B.; Ning, C.; Shi, D.; Zhao, Y.; Zhang, J. Review on electrode-level fracture in lithium-ion batteries*. Chin. Phys. B 2020, 29, 026201. [Google Scholar] [CrossRef]
  56. Foster, J.M.; Huang, X.; Jiang, M.; Chapman, S.J.; Protas, B.; Richardson, G. Causes of binder damage in porous battery electrodes and strategies to prevent it. J. Power Sources 2017, 350, 140–151. [Google Scholar] [CrossRef] [Green Version]
  57. Liu, T.; Lin, L.; Bi, X.; Tian, L.; Yang, K.; Liu, J.; Li, M.; Chen, Z.; Lu, J.; Amine, K.; et al. In situ quantification of interphasial chemistry in Li-ion battery. Nat. Nanotechnol. 2019, 14, 50–56. [Google Scholar] [CrossRef] [PubMed]
  58. Pathan, T.S.; Rashid, M.; Walker, M.; Widanage, W.D.; Kendrick, E. Active formation of Li-ion batteries and its effect on cycle life. J. Phys. Energy 2019, 1, 044003. [Google Scholar] [CrossRef]
  59. Günter, F.J.; Burgstaller, C.; Konwitschny, F.; Reinhart, G. Influence of the Electrolyte Quantity on Lithium-Ion Cells. J. Electrochem. Soc. 2019, 166, A1709–A1714. [Google Scholar] [CrossRef]
  60. Weydanz, W.J.; Reisenweber, H.; Gottschalk, A.; Schulz, M.; Knoche, T.; Reinhart, G.; Masuch, M.; Franke, J.; Gilles, R. Visualization of electrolyte filling process and influence of vacuum during filling for hard case prismatic lithium ion cells by neutron imaging to optimize the production process. J. Power Sources 2018, 380, 126–134. [Google Scholar] [CrossRef]
  61. Lautenschlaeger, M.P.; Prifling, B.; Kellers, B.; Weinmiller, J.; Danner, T.; Schmidt, V.; Latz, A. Understanding Electrolyte Filling of Lithium–Ion Battery Electrodes on the Pore Scale Using the Lattice Boltzmann Method. Batter. Supercaps 2022, 5, e202200090. [Google Scholar] [CrossRef]
Figure 1. Failure of the cell case of a LG INR21700-M50 with fractured electrode after cycling with 0.5 C and 4.2 v to 2.5 v limits at 10 C . Excessive internal pressure caused electrode and case rupture. Separators remained intact and prevented a thermal event. (a) Battery cell with ruptured case. (b) CT scan showing filled inner space and fractured electrodes. (c) Post mortem analysis showing electrode rupture while separators remained intact.
Batteries 09 00006 g001
Figure 2. Gray-value analysis of a CT image of a Samsung INR18650-25R cell. Materials with high atomic numbers and density, such as the iron in the steel case and the copper of the anode current collector, have high radiation absorption and therefore exhibit higher gray-values in this evaluation. (a) CT image with 20 evaluated parallel lines marked in blue. As every line has a width of only one pixel, these 20 lines appear as a single line in this image. The rotation direction and angle of the image are also marked. (b) Gray-values and standard deviations for 20 evaluated lines along one angle in the case region. (c) Gray-values along the evaluated lines of the top half of the cell.
Batteries 09 00006 g002
Figure 3. Jelly-roll gaps for four new Samsung INR18650-25RM cells at 0% and 100% SOC in the middle of the cell.
Batteries 09 00006 g003
Figure 4. Jelly-roll gaps for a new Samsung INR18650-25RM cell in different cross-sections (Cell 1 in Figure 3). The bottom cross-sections exhibit artifacts at the position of the current collector tab, as the evaluation algorithm was not tuned to detect the tab.
Batteries 09 00006 g004
Figure 5. CT analysis of geometrical influences on the jelly-roll gap. (a) CT scan of the bottom cross-section of a Samsung INR18650-25RM cell (Cell 1) showing mechanical constraints on the jelly roll caused by contact with the case at the end of the jelly-roll winding and by the current collector tab. (b) Differences in the endings of the anode current collectors for Samsung INR18650-25RM Cells 1 and 2.
Batteries 09 00006 g005
Figure 6. Jelly-roll gaps for various new 18650 lithium-ion batteries at 0% and 100% SOC. (a) Jelly-roll gap for an A123 APR18650M1B cell. (b) Jelly-roll gap for an LG INR18650MJ1 cell. (c) Jelly-roll gap for a SONY US18650VTC4 cell. (d) Jelly-roll gap for a Samsung INR18650-25RM cell.
Batteries 09 00006 g006
Figure 7. Jelly-roll gaps for various new 21700 lithium-ion batteries at 0% and 100% SOC. (a) Jelly-roll gap for a Molicell INR21700 cell. (b) Jelly-roll gap for a Samsung INR21700-40T cell.
Batteries 09 00006 g007
Figure 8. Jelly-roll gaps for the Samsung INR18650-25RM at 100% SOC with smoothed data. (a) Jelly-roll gap each cycle for the first 10 cycles. (b) Jelly-roll gap each 10 cycles for the first 100 cycles.
Batteries 09 00006 g008
Figure 9. Jelly-roll gaps for the Samsung INR21700-40T at 100% SOC with smoothed data. (a) Jelly-roll gap each cycle for the first 10 cycles. (b) Jelly-roll gap each 10 cycles for the first 100 cycles.
Batteries 09 00006 g009
Table 1. Cell types used for jelly-roll gap analysis.
Cell TypeCapacityMax. Charge CurrentMax. Discharge CurrentChemistry
A123 APR18650M1B 1.1 Ah5 A 30 A LFP/C [45]
LG INR18650MJ1 3.5 Ah 3.5 A 10 A NMC811/SiC [36,46]
Murata/Sony US18650VTC4 2.1 Ah4 A 30 A -
PAN NCR18650B 3.4 Ah 1.625 A 6.5 A NNP [47]
PAN NCR18650PF 2.9 Ah2 A 9.0 A NCA/C [48]
Samsung INR18650-25RM 2.5 Ah4 A 20 A NCA/C [49]
Molicell INR21700-P42A 4.2 Ah6 A 30 A to 45 A - [50]
Samsung INR21700-40T 4.0 Ah6 A 35 A to 45 A -
Table 2. Overview of jelly-roll gap sizes at various SOCs for new cells.
Cell TypeMin SOC 0 in μ m Max SOC 0 in μ m Mean SOC 0 in μ m Min SOC 100 in μ m Max SOC 100 in μ m Mean SOC 100 in μ m
A123 APR18650M1B248374311243372306
LG INR18650MJ13320065
Muarata/Sony US18650VTC4483461969302167
Samsung INR18650-25RM cell 15033521448302168
Samsung INR18650-25RM cell 24328917147224126
Samsung INR18650-25RM cell 35627117659239130
Samsung INR18650-25RM cell 44333520350283157
Molicell INR21700-P42A204345263176305222
Samsung INR21700-40T7827817366193115
Disclaimer/Publisher’s Note: The statements, opinions and data contained in all publications are solely those of the individual author(s) and contributor(s) and not of MDPI and/or the editor(s). MDPI and/or the editor(s) disclaim responsibility for any injury to people or property resulting from any ideas, methods, instructions or products referred to in the content.

