Article

Strain Compensation Methods for Fiber Bragg Grating Temperature Sensors Suitable for Integration into Lithium-Ion Battery Electrolyte

1
Institute of Electrical Measurement and Sensor Systems, Graz University of Technology, Inffeldgasse 33/I, 8010 Graz, Austria
2
AIT Austrian Institute of Technology GmbH, Center for Low-Emission Transport, Giefinggasse 2, 1210 Vienna, Austria
*
Author to whom correspondence should be addressed.
Batteries 2023, 9(1), 34; https://doi.org/10.3390/batteries9010034
Submission received: 17 November 2022 / Revised: 25 December 2022 / Accepted: 28 December 2022 / Published: 3 January 2023

Abstract

:
Temperature is a crucial factor for the safe operation of lithium-ion batteries. During operation, the internal temperature rises above the external temperature due to poor inner thermal conductivity. Various sensors have been proposed to detect the internal temperature, including fiber Bragg grating sensors. However, to the authors’ knowledge, there is no detailed description of the encapsulation of the fiber Bragg grating sensor in the literature to shield it from strain. In this study, different encapsulation methods for strain compensation were compared to find the encapsulation material most compatible with the electrolyte. For this, we stored the proposed sensors with different encapsulation methods in ethylene carbonate:ethyl methyl carbonate (EC:EMC) 3:7 with LiPF6 (lithium hexafluorophosphate) electrolyte and applied temperature changes. After evaluating the sensor encapsulation methods in terms of handling, diameter, uncertainty, usability, and hysteresis behavior, the most suitable sensor encapsulation was found to be a fused silica capillary with polyimide coating.

1. Introduction

In our everyday life, lithium-ion batteries (LIB) have become indispensable. Portable devices, such as smartphones, tablets, etc., are powered by them. Moreover, the number of electric vehicles (EVs) and energy storage systems (ESS) has increased [1,2] due to the high specific energy, good cycle life, and low self-discharge rate of LIBs [3], as well as the desire to reduce fossil fuel consumption. With the increasing amount of LIBs in various applications, ensuring safety is a mandatory requirement. For this, the monitoring of certain parameters of the LIB is crucial; for example, the voltage, current, and temperature are the common parameters that a battery management system (BMS) measures and uses to estimate the state of charge (SOC) and state of health (SOH) [4,5,6].
From these parameters, the temperature of the LIB is critical [7]. The ideal operating temperature with the least aging effects is between 15 °C and 35 °C [8]. If the temperature is above this operating window, the solid electrolyte interphase (SEI) thickness increases [7,9,10]. If it is below this operating window, lithium plating occurs [7,9,10]. Both effects degrade the LIB and increase the probability of hazardous events, such as thermal runaway [9,10]. To prevent such an event in an early state, it is crucial to continuously monitor the temperature of the LIB [11,12]. It is known from the literature that the internal temperature is higher than the surface temperature of an operating LIB due to poor inner thermal conductivity [13,14,15]. However, in state-of-the-art battery thermal management systems (BTMS), the temperature is only monitored on the surface at a few points in a battery pack [16].
Fiber optic sensors are an emerging area for integrated LIB monitoring. Other temperature sensors have also been implanted, such as thermocouples [17], thermistors [18], and resistance temperature detectors [19]. However, fiber optic sensors are small, lightweight, and immune to electromagnetic interference [20]. They can withstand harsh environments, such as the inside of an LIB. A special sensor variant is the fiber Bragg grating (FBG). Multiple FBGs can be multiplexed on a single fiber and thus can be used as a quasi-distributed sensor. However, a major problem is that FBG sensors are cross-sensitive to strain. Therefore, a fiber with FBGs has to be shielded from any strain by an additional capillary to reduce this cross-sensitivity.
A group at the University of Warwick published three papers in which they encapsulated the FBGs in an aluminum tube and covered the tube with fluorinated ethylene propylene as protection against the electrolyte in cylindrical cells of the format of 18650 [21,22,23]. This sensor packaging has a diameter of 1.6   m m and is therefore not suitable for pouch cells. In contrast, Liu et al. [24] did not encapsulate the FBG in cylindrical cells of the format 18650 with the reason that there is no electrolyte in the inner hole and thus no strain. For pouch cells, Novais et al. [15] did not use an encapsulation because, in their opinion, no strain was applied to the fiber due to the small thickness of the pouch cell they used (about 1 mm). Raghavan et al. [25] used a “special tubing” with no further explanation. To our knowledge, there is no detailed work on strain compensation on FBG-based sensors used for LIB pouch cells.
In this work, we tested three different capillary materials and two mounting methods of the capillary and studied the compatibility with the electrolyte to show which capillary material works best. For this, the optical fibers were immersed in an electrolyte, and we applied temperature cycling to check the FBGs’ response during temperature changes. We compare the sensitivities of the FBGs in air and the electrolyte. With this study, we found a suitable capillary material that shows reduced hysteresis during heating and cooling.

2. Materials and Methods

2.1. Fiber Bragg Grating Principle

For an FBG, the core refractive index of an optical fiber becomes modulated and forms a grating in the fiber [20]. Light propagating through the fiber is reflected when a certain relationship is satisfied. The relationship between the Bragg wavelength λ B in nm, the effective refractive index n e f f , and the grating period Λ in nm is shown in Equation (1) [26].
λ B = 2 · n e f f · Λ
The measurement principle is based on the fact that external influences change the refractive index and the grating period; hence, a shift in the reflected Bragg wavelength is measured. This shift can be related to the change in temperature Δ T in K , for example. To obtain the temperature dependence, one has to differentiate Equation (1) with respect to the temperature and insert Equation (1) in the derivation to obtain Equation (2):
Δ λ B λ B = 1 Λ d Λ d T Δ T + 1 n e f f d n e f f d T Δ T = ( α + ζ ) Δ T
where α is the thermal expansion coefficient, and ζ is the thermo-optic coefficient.
Another influencing factor is external strain. The strain influence on the wavelength is as follows:
Δ λ B λ B = 1 Λ d Λ d L Δ L + 1 n e f f d n e f f d L Δ L = ( 1 P e ) ϵ
P e is the strain-optic coefficient, and ϵ is the strain. As can be seen from these equations, both the temperature and strain can shift the Bragg wavelength, and a decoupling method is necessary. In this work, we shield the FBG from external strain by encapsulating it in a capillary. The sensor design for temperature measurement is described in the next section.

2.2. Fiber Bragg Grating Sensors

Three FBGs are inscribed in four standard single-mode fibers (Corning SMF-28). The FBGs have a length of 5 m m and are 18 m m apart; the latter was measured from the center of the FBGs. To measure only the temperature, three different capillaries and two mounting methods were used for strain reduction. The used materials are a PEEK (polyether ether ketone) capillary from TECHLAB GmbH (Braunschweig, Germany), a fused silica tube with polyimide coating (Molex, Polymicro capillary tubing), and a fused silica tube on which the polyimide coating was removed to reduce the diameter of the encapsulation. To remove the polyimide coating, the fused silica tube was placed in an oven at 600 °C for 1 h, as stated by the manufacturer. The selected materials show high chemical resistance and have already been used in LIB research [27,28], which supports the assumption that these materials can withstand the chemically active environment in the LIB. All capillary materials are commercially available and drop significantly in price when bought in large quantities. The capillary materials, the mounting methods, and the outer diameter of each encapsulation method are listed in Table 1. We used Loctite EA 0151 adhesive from Henkel to attach the capillaries.
Two different mounting methods are used. For the mounting method called the single-point, one side of the capillary was sealed with the adhesive before inserting the optical fiber. The capillaries for the single-point mounting are 90 mm long. After proper curing of the adhesive on the capillary, the fiber was inserted and fixed with the adhesive on the other side. For the double-point mounting method, the fiber was loosely inserted in the capillary and fixed on both sides of the capillary. The capillary for the double-point mounting is 60 mm long. The four sensor designs are shown in Figure 1 and listed in Table 1. The single-point mounting has the advantage that the fiber can move freely in the capillary. In the double-point mounting method, however, the fiber becomes strained by the mounting points even though the fiber is inserted loosely into the capillary.
For reading the FBGs, an interrogator type si155 from Luna Inc. (Roanoke, VA, USA) was used. The sample rate was set to 100 Hz, and the python API is used for saving the data. The wavelength accuracy of the interrogator is 1 pm.

2.3. Calibration in Air

All fibers were calibrated back and forth in a climatic chamber (Weiss WKL 100) from 20 °C to 45 °C in 5 °C increments in air with 50% relative humidity [29]. Each temperature was kept for 3 h to ensure thermal equilibrium. We use an aluminum heat spreader for calibration. The aluminum heat spreader has two inlets for fibers and one for a reference temperature sensor. A high-precision thermometer from DOSTMANN electronic GmbH (Wertheim-Reicholzheim, Germany), the T4200 with a PT100 probe with a resolution of 1 mK and an uncertainty of 15 mK, was used as the reference temperature sensor.

2.4. Electrolyte Measurements

To investigate the interaction of the electrolyte with the capillary materials, the fibers were inserted into a glass tube (length: 300 mm, diameter: 7 mm) that was filled with the electrolyte from Solvionic (EC:EMC 3:7 with LiPF6) up to FBG1 and closed with a plug into which a small hole was drilled. All FBGs were covered with the electrolyte. The tubes were sealed with hot-melt adhesive to prevent electrolyte leakage. We inserted the fibers and the electrolyte into the tubes in a dry room under a fume hood. The tubes with the fibers were placed in a climatic chamber (Vötschtechnik VT3 4060) and cycled twice between 20 °C and 45 °C in 5 °C increments. Every temperature was kept for 2 h to ensure thermal equilibrium. The measurement setup can be seen in Figure 2. We recorded the temperature of the climatic chamber and the reflected wavelength of each FBG.

3. Results and Discussions

3.1. Calibration in Air

The calibration in air with 50% relative humidity in the climatic chamber shows a good agreement between the reference sensor and the FBG responses (Figure 3). SP2 and SP3 show the best behavior compared to the other mounting method/capillary material. SP1 shows a hysteresis between heating and cooling, and SP4 shows a drift to higher wavelengths induced by strain build-up in the fiber. Both effects complicate the temperature calculation. The response from SP4 looks different because the fiber was not inserted into the aluminum heat spreader for calibration. The reason for this is that it was not possible to insert the fiber into the heat spreader because the fiber was split during the electrolyte measurements (Figure A1). The fiber lay next to the calibration block freely in the climatic chamber and, hence, reacted faster to the temperature change than the embedded fibers.
Figure 4 shows the polynomial fitting for the mean wavelength (averaged over the last 30 min of every temperature step) for each temperature from Figure 3. The polynomial fitting reduces the calibration error [30,31]. All calibration coefficients are listed in Table A2. The mean wavelengths for heating and cooling are shown as red and blue points, respectively. For SP2 and SP3, the heating and cooling curves are almost identical, and the averaged wavelength can be used. For SP1 and SP4, the hysteresis leads to an error in the temperature calculation.
In Figure 5, each FBG response has been converted to temperature using the polynomial coefficients from Table A2. For SP2 and SP3, all FBGs follow the reference temperature without major deviations. FBG3 has the best agreement with the reference temperature sensor for all sensors, followed by FBG2 and FBG1. One possible explanation is that FBG1 is located closest to the mounting point and, therefore, becomes more strained by the adhesive and capillary than the other two FBGs.

3.2. Electrolyte Measurements

In the first twelve hours, the fibers undergo a settling phase, which is shown in Figure 6. During this first phase, the sensor interacts with the electrolyte. The fatty acids of the adhesive oxidize and show this by changing from transparent to amber-colored (Figure A1). After this phase, the sensors show reproducible behaviors compared to the temperature, marked as the settled phase in Figure 6. Our findings show that SP1 shows a hysteresis between heating and cooling. SP4 was damaged, and the data cannot be analyzed. SP2 and SP3 have minimal hysteresis. The sensitivities were evaluated without the first twelve hours. Polynomial calibration curves were obtained for each FBG with the averaged wavelength for each temperature [30,31]. The coefficients are listed in Table A3.
In Figure A1, one can see the splitting of the fiber that occurred at SP4. With this sensor, a mixture of the mechanical strain and temperature was measured (see Figure 6) (SP4). Therefore, no relevant evaluation is possible.
Figure 7 shows the polynomial fitting for the measurement conducted in the electrolyte shown in Figure 6. To calculate the necessary data points for the fitting, the temperature over the last 30 min of each temperature step was averaged. The resulting values for heating and cooling, and the mean value of these two, are depicted in Figure 7 as points. For SP2 and SP3, the heating and cooling curves are almost identical, and the fitting of the averaged wavelengths can be used. For SP1, the hysteresis leads again to an error in the temperature calculation. All calibration coefficients are listed in Table A3.
In Figure 8, each FBG response was converted to temperature using the polynomial coefficients from Table A3. Additionally, for the electrolyte measurement, all FBGs from SP2 and SP3 follow the reference temperature quite accurately. For all sensors, FBG3 best matches the reference temperature sensor. The deviation increases as the FBG becomes closer to the mounting point, and, therefore, FBG2 has a smaller deviation than FBG1, as was also the case for the measurement that was conducted in air.
SP3 has the smallest diameter of the tested capillaries, which would be very desirable; however, glass is not applicable for battery integration. The reason for this is that when the electrolyte degrades, it attacks the glass, as can be seen from the following reaction equations [9,32]:
LiPF 6 LiF + PF 5
PF 5 + H 2 O POF 3 + 2 HF
From this, the total reaction equation follows:
LiPF 6 + H 2 O LiF + POF 3 + 2 HF
The resulting HF (hydrogen fluoride) attacks the glass [33]:
SiO 2 + 4 HF SiF 4 + 2 H 2 O
The generation of HF is not so relevant for the use of batteries within the safety limits but must be considered for abuse conditions [32].

3.3. Comparison

For comparison with other works, the sensitivities of the FBGs obtained by linear fitting are presented in Table 2. Figure 9 shows the comparison between the sensitivities in air and the electrolyte. It can be seen that the sensitivity increases from air to the electrolyte with two outliers (SP1,FBG1; SP3,FBG1). A change in sensitivity is also observed by Nascimento et al. [34], who have shown that FBGs have higher sensitivities when embedded in an LIB.
During calibration, SP1 shows hysteresis between heating and cooling in both the air and electrolyte cases. SP2 and SP3, on the other hand, show no hysteresis in either case. SP4 shows no hysteresis in air and cannot be evaluated in the electrolyte. Table A1 lists the Bragg wavelengths at 20 °C for the measurements in the electrolyte and air. For SP1, the wavelength becomes higher. For SP2, the wavelength stays almost the same, and, for SP3, the wavelength becomes lower. SP4 cannot be evaluated.
Table 3 lists the sensor sample, capillary handling, diameter, and uncertainty. It indicates whether the capillary material is usable in the electrolyte and whether there is hysteresis for each sensor in the electrolyte. The colors green, yellow and red rank the different categories.
From Table 3, one can see that SP2 is the best option. SP2 is the leading encapsulation method in almost all categories.

4. Conclusions

We compared four different encapsulation methods for optical fibers with FBGs to be used in LIBs. To find the best capillary, all proposed encapsulation methods were inserted into the electrolyte. The PEEK material is characterized by easy handling and good protection of the fiber. However, the diameter is quite large, and a hysteresis effect is observable in all measurements. The fused silica tube with polyimide coating is also characterized by easy handling and good protection of the fiber. The diameter is smaller than the PEEK capillary, and hysteresis is canceled out. The two sensor designs with the bare fused silica capillary have the smallest diameter. The sensor with the double-point mounting method is not possible to analyze due to the splitting of the fiber. The sensor with the single-point mounting method shows no hysteresis as well. However, the handling is difficult due to the brittleness of the capillary, and bare fused silica is not applicable in LIBs because of the HF that can develop in an LIB. Another possible material that could be tested would be polytetrafluoroethylene (PTFE). It would be suitable due to its high chemical inertness [35]. In conclusion, the fused silica with the polyimide coating works best, and we will do further research with this sensor encapsulation inside an LIB pouch cell. This sensor can be used to monitor the internal temperature of an LIB pouch cell and provide the data to the BMS to improve the control, aging, and SOH estimation of an LIB.

Author Contributions

Conceptualization, J.U., R.K., and A.B.; methodology, J.U., R.K., and A.B.; software, J.U.; investigation, J.U., G.G., and M.K.; resources, G.G., M.K., and A.B.; writing—original draft preparation, J.U.; writing—review and editing, M.K., G.G., R.K., and A.B.; visualization, J.U.; supervision, A.B. All authors have read and agreed to the published version of the manuscript.

Funding

This research was funded by the Austrian Research Promotion Agency (FFG) grant number 879610.

Institutional Review Board Statement

Not applicable.

Informed Consent Statement

Not applicable.

Data Availability Statement

Data are available upon request from the corresponding author.

Acknowledgments

Open Access Funding by the Graz University of Technology. The authors would like to thank the Graz University of Technology and AIT Austrian Institute of Technology for their great cooperation.

Conflicts of Interest

The authors declare no conflict of interest.

Abbreviations

The following abbreviations are used in this manuscript:
BMS Battery management system
BTMS Battery thermal management system
EC Ethylene carbonate
EMC Ethyl methyl carbonate
ESS Energy storage system
EV Electric vehicle
FBG Fiber Bragg grating
HF Hydrogen fluoride
LIB Lithium-ion battery
LiF Lithium fluoride
LiPF6 Lithium hexafluorophosphate
PEEK Polyether ether ketone
PF5 Phosphorus pentafluoride
POF3 Phosphoryl fluoride
PTFE Polytetrafluoroethylene
SEI Solid electrolyte interphase
SOC State of charge
SOH State of health
SP Sensor sample

Appendix A. Split Fiber

Figure A1. Split fiber (SP4). Coating peeled off the fiber and the adhesive changed color after electrolyte contact (from transparent to amber-colored). Blue and red marks: FBG positions.
Batteries 09 00034 g0a1

Appendix B. Bragg Wavelength

Table A1. The mean Bragg wavelength at 20 °C and the standard deviation.
Sensor SampleBragg Wavelength (nm) at 20 °C in ElectrolyteBragg Wavelength (nm) at 20 °C in Air
SP1, FBG11470.634 ± 0.0101470.638 ± 0.010
SP1, FBG21478.005 ± 0.0071478.024 ± 0.005
SP1, FBG31492.593 ± 0.0031492.614 ± 0.003
SP2, FBG11499.991 ± 0.0021499.995 ± 0.001
SP2, FBG21514.663 ± 0.0021514.663 ± 0.001
SP2, FBG31521.883 ± 0.0021521.880 ± 0.001
SP3, FBG11551.127 ± 0.0021551.115 ± 0.003
SP3, FBG21558.478 ± 0.0011558.474 ± 0.001
SP3, FBG31565.780 ± 0.0011565.775 ± 0.001
SP4, FBG1-1529.240 ± 0.001
SP4, FBG2-1536.646 ± 0.001
SP4, FBG3-1543.933 ± 0.001

Appendix C. Calibration Coefficients

Table A2. Calibration coefficients in air from the polynomial fit (T = C 1 λ 3 + C 2 λ 2 + C 3 λ + C 4 ).
Sensor Sample C 1 C 2 C 3 C 4 R2
SP1, FBG129.11−128,427188,874,675−92,591,247,5620.999902
SP1, FBG2−21.67961,159−142,098,01770,026,001,3490.999876
SP1, FBG3−32.06143,604−214,391,696106,690,953,6360.999975
SP2, FBG147.91−215,608323,413,610−161,707,979,6280.999967
SP2, FBG252.85−240,143363,739,792−183,649,825,3360.999985
SP2, FBG365.30−298,130453,293,326−230,179,447,5540.999997
SP3, FBG1−47.77222,363−344,986,963178,411,117,6570.999997
SP3, FBG228.28−132,198206,010,176−107,011,535,4100.999994
SP3, FBG376.67−360,172563,970,495−294,361,797,7950.999993
SP4, FBG1−49.14225,450−344,791,531175,769,071,5040.9999996
SP4, FBG2−77.82358,787−551,380,651282,452,240,7990.99999998
SP4, FBG3−65.95305,503−471,681,266242,750,930,1980.9999999
Table A3. Calibration coefficients in electrolyte from the polynomial fit (T = C 1 λ 3 + C 2 λ 2 + C 3 λ + C 4 )).
Sensor Sample C 1 C 2 C 3 C 4 R2
SP1, FBG1−1.2325446−8,024,9733,941,651,0400.999995
SP1, FBG2−67.10297,534−439,800,651216,697,065,3290.999955
SP1, FBG3−66.16296,297−442,294,275220,076,616,0660.999992
SP2, FBG1−40.701,831,986−274,843,7611,374,455,125,1980.9999998
SP2, FBG2−32.41147,289−223,136,836112,681,114,6790.999999
SP2, FBG3−12.1455,449−84,411,47642,833,718,3760.999999
SP3, FBG1−0.94714441−6,939,2103,614,408,1110.999989
SP3, FBG28.661−40,46663,023,727−32,718,473,4250.999995
SP3, FBG322.61−106,206166,274,508−86,772,050,0310.999998
SP4, FBG1-----
SP4, FBG2-----
SP4, FBG3-----

References

  1. Edström, K. BATTERY 2030+ Roadmap. Technical Report. 2022. Available online: https://battery2030.eu/wp-content/uploads/2021/08/c_860904-l_1-k_roadmap-27-march.pdf (accessed on 29 September 2022).
  2. World Economic Forum. A Vision for a Sustainable Battery Value Chain in 2030 Unlocking the Full Potential to Power Sustainable Development and Climate Change. Technical Report. 2019. Available online: https://www3.weforum.org/docs/WEF_A_Vision_for_a_Sustainable_Battery_Value_Chain_in_2030_Report.pdf (accessed on 29 September 2022).
  3. Liang, Y.; Zhao, C.; Yuan, H.; Chen, Y.; Zhang, W.; Huang, J.; Yu, D.; Liu, Y.; Titirici, M.; Chueh, Y.; et al. A review of rechargeable batteries for portable electronic devices. InfoMat 2019, 1, 6–32. [Google Scholar] [CrossRef] [Green Version]
  4. Wang, Y.; Tian, J.; Sun, Z.; Wang, L.; Xu, R.; Li, M.; Chen, Z. A comprehensive review of battery modeling and state estimation approaches for advanced battery management systems. Renew. Sustain. Energy Rev. 2020, 131, 110015. [Google Scholar] [CrossRef]
  5. Pradhan, S.K.; Chakraborty, B. Battery management strategies: An essential review for battery state of health monitoring techniques. J. Energy Storage 2022, 51, 104427. [Google Scholar] [CrossRef]
  6. Liu, K.; Li, K.; Peng, Q.; Zhang, C. A brief review on key technologies in the battery management system of electric vehicles. Front. Mech. Eng. 2019, 14, 47–64. [Google Scholar] [CrossRef] [Green Version]
  7. Waldmann, T.; Wilka, M.; Kasper, M.; Fleischhammer, M.; Wohlfahrt-Mehrens, M. Temperature dependent ageing mechanisms in Lithium-ion batteries - A Post-Mortem study. J. Power Sources 2014, 262, 129–135. [Google Scholar] [CrossRef]
  8. Ma, S.; Jiang, M.; Tao, P.; Song, C.; Wu, J.; Wang, J.; Deng, T.; Shang, W. Temperature effect and thermal impact in lithium-ion batteries: A review. Prog. Nat. Sci. Mater. Int. 2018, 28, 653–666. [Google Scholar] [CrossRef]
  9. Edge, J.S.; O’Kane, S.; Prosser, R.; Kirkaldy, N.D.; Patel, A.N.; Hales, A.; Ghosh, A.; Ai, W.; Chen, J.; Yang, J.; et al. Lithium ion battery degradation: What you need to know. Phys. Chem. Chem. Phys. 2021, 23, 8200–8221. [Google Scholar] [CrossRef]
  10. Xiong, R.; Pan, Y.; Shen, W.; Li, H.; Sun, F. Lithium-ion battery aging mechanisms and diagnosis method for automotive applications: Recent advances and perspectives. Renew. Sustain. Energy Rev. 2020, 131, 110048. [Google Scholar] [CrossRef]
  11. Parhizi, M.; Ahmed, M.B.; Jain, A. Determination of the core temperature of a Li-ion cell during thermal runaway. J. Power Sources 2017, 370, 27–35. [Google Scholar] [CrossRef]
  12. Parekh, M.H.; Li, B.; Palanisamy, M.; Adams, T.E.; Tomar, V.; Pol, V.G. In Situ Thermal Runaway Detection in Lithium-Ion Batteries with an Integrated Internal Sensor. ACS Appl. Energy Mater. 2020, 3, 7997–8008. [Google Scholar] [CrossRef]
  13. Su, Y.D.; Preger, Y.; Burroughs, H.; Sun, C.; Ohodnicki, P. Fiber Optic Sensing Technologies for Battery Management Systems and Energy Storage Applications. Sensors 2021, 21, 1397. [Google Scholar] [CrossRef]
  14. Zhu, S.; Han, J.; Pan, T.S.; Wei, Y.M.; Song, W.L.; Chen, H.S.; Fang, D. A novel designed visualized Li-ion battery for in-situ measuring the variation of internal temperature. Extrem. Mech. Lett. 2020, 37, 100707. [Google Scholar] [CrossRef]
  15. Novais, S.; Nascimento, M.; Grande, L.; Domingues, M.; Antunes, P.; Alberto, N.; Leitão, C.; Oliveira, R.; Koch, S.; Kim, G.; et al. Internal and External Temperature Monitoring of a Li-Ion Battery with Fiber Bragg Grating Sensors. Sensors 2016, 16, 1394. [Google Scholar] [CrossRef] [Green Version]
  16. Srinivasan, R.; Demirev, P.A.; Carkhuff, B.G.; Santhanagopalan, S.; Jeevarajan, J.A.; Barrera, T.P. Review—Thermal Safety Management in Li-Ion Batteries: Current Issues and Perspectives. J. Electrochem. Soc. 2020, 167, 140516. [Google Scholar] [CrossRef]
  17. Huang, S.; Wu, X.; Cavalheiro, G.M.; Du, X.; Liu, B.; Du, Z.; Zhang, G. In Situ Measurement of Lithium-Ion Cell Internal Temperatures during Extreme Fast Charging. J. Electrochem. Soc. 2019, 166, A3254–A3259. [Google Scholar] [CrossRef]
  18. Fleming, J.; Amietszajew, T.; Charmet, J.; Roberts, A.J.; Greenwood, D.; Bhagat, R. The design and impact of in-situ and operando thermal sensing for smart energy storage. J. Energy Storage 2019, 22, 36–43. [Google Scholar] [CrossRef]
  19. Zhu, S.; Han, J.; An, H.Y.; Pan, T.S.; Wei, Y.M.; Song, W.L.; Chen, H.S.; Fang, D. A novel embedded method for in-situ measuring internal multi-point temperatures of lithium ion batteries. J. Power Sources 2020, 456, 227981. [Google Scholar] [CrossRef]
  20. Werneck, M.M.; Allil, R.C.S.B.; Ribeiro, B.A.; de Nazaré, F.V.B. A Guide to Fiber Bragg Grating Sensors. In Current Trends in Short- and Long-Period Fiber Gratings; IntechOpen: London, UK, 2013; pp. 1–24. [Google Scholar] [CrossRef] [Green Version]
  21. Amietszajew, T.; McTurk, E.; Fleming, J.; Bhagat, R. Understanding the limits of rapid charging using instrumented commercial 18650 high-energy Li-ion cells. Electrochim. Acta 2018, 263, 346–352. [Google Scholar] [CrossRef]
  22. McTurk, E.; Amietszajew, T.; Fleming, J.; Bhagat, R. Thermo-electrochemical instrumentation of cylindrical Li-ion cells. J. Power Sources 2018, 379, 309–316. [Google Scholar] [CrossRef]
  23. Fleming, J.; Amietszajew, T.; McTurk, E.; Greenwood, D.; Bhagat, R. Development and evaluation of in-situ instrumentation for cylindrical Li-ion cells using fibre optic sensors. HardwareX 2018, 3, 100–109. [Google Scholar] [CrossRef]
  24. Liu, Y.; Liu, Z.; Mei, W.; Han, X.; Liu, P.; Wang, C. Operando monitoring Lithium-ion battery temperature via implanted high-sensitive optical fiber sensors. Measurement 2022, 203, 111961. [Google Scholar] [CrossRef]
  25. Raghavan, A.; Kiesel, P.; Sommer, L.W.; Schwartz, J.; Lochbaum, A.; Hegyi, A.; Schuh, A.; Arakaki, K.; Saha, B.; Ganguli, A.; et al. Embedded fiber-optic sensing for accurate internal monitoring of cell state in advanced battery management systems part 1: Cell embedding method and performance. J. Power Sources 2017, 341, 466–473. [Google Scholar] [CrossRef] [Green Version]
  26. Sahota, J.K.; Gupta, N.; Dhawan, D. Fiber Bragg grating sensors for monitoring of physical parameters: A comprehensive review. Opt. Eng. 2020, 59, 1. [Google Scholar] [CrossRef]
  27. Luiso, S.; Fedkiw, P. Lithium-ion battery separators: Recent developments and state of art. Curr. Opin. Electrochem. 2020, 20, 99–107. [Google Scholar] [CrossRef]
  28. Li, D.; Shi, D.; Feng, K.; Li, X.; Zhang, H. Poly (ether ether ketone) (PEEK) porous membranes with super high thermal stability and high rate capability for lithium-ion batteries. J. Membr. Sci. 2017, 530, 125–131. [Google Scholar] [CrossRef]
  29. Giaccari, P.; Limberger, H.G.; Kronenberg, P. Influence of humidity and temperature on polyimide-coated fiber Bragg gratings. In Proceedings of the Bragg Gratings, Photosensitivity, and Poling in Glass Waveguides, Stresa, Italy, 4 July 2001; OSA: Washington, DC, USA, 2001; p. BFB2. [Google Scholar] [CrossRef]
  30. Micron Optics Inc. Grating Based Temperature Sensors—Temperature Calibration and Thermal Response. 2008. Available online: https://lunainc.com/sites/default/files/assets/files/resource-library/TemperatureCalibration-FBGSensors-r2.pdf (accessed on 20 October 2022).
  31. Zhang, J.; Li, Y. Calibration method for fiber bragg grating temperature sensor. In Proceedings of the 2009 9th International Conference on Electronic Measurement & Instruments, Beijing, China, 16–19 August 2009; pp. 2-822–2-825. [Google Scholar] [CrossRef]
  32. Larsson, F.; Andersson, P.; Blomqvist, P.; Mellander, B.E. Toxic fluoride gas emissions from lithium-ion battery fires. Sci. Rep. 2017, 7, 10018. [Google Scholar] [CrossRef] [Green Version]
  33. Park, H.; Kim, D.; Jung, J.; Pham, D.P.; Le, A.H.T.; Cho, J.; Hussain, S.Q.; Yi, J. HF etched glass substrates for improved thin-film solar cells. Heliyon 2018, 4, e00835. [Google Scholar] [CrossRef]
  34. Nascimento, M.; Novais, S.; Ding, M.S.; Ferreira, M.S.; Koch, S.; Passerini, S.; Pinto, J.L. Internal strain and temperature discrimination with optical fiber hybrid sensors in Li-ion batteries. J. Power Sources 2019, 410–411, 1–9. [Google Scholar] [CrossRef]
  35. Dai, X.; Zhang, X.; Wen, J.; Wang, C.; Ma, X.; Yang, Y.; Huang, G.; Ye, H.M.; Xu, S. Research progress on high-temperature resistant polymer separators for lithium-ion batteries. Energy Storage Mater. 2022, 51, 638–659. [Google Scholar] [CrossRef]
Figure 1. The investigated sensor samples (SP); SP1: optical fiber in PEEK capillary, single-point mounting; SP2: optical fiber in fused silica tube with polyimide coating, single-point mounting; SP3: optical fiber in fused silica tube, removed polyimide coating, single-point mounting; SP4: optical fiber in fused silica tube, removed polyimide coating, double-point mounting; vertical lines indicate the FBGs; gray circles indicate adhesive points; gray circles with an X indicate a connection between encapsulation and the fiber.
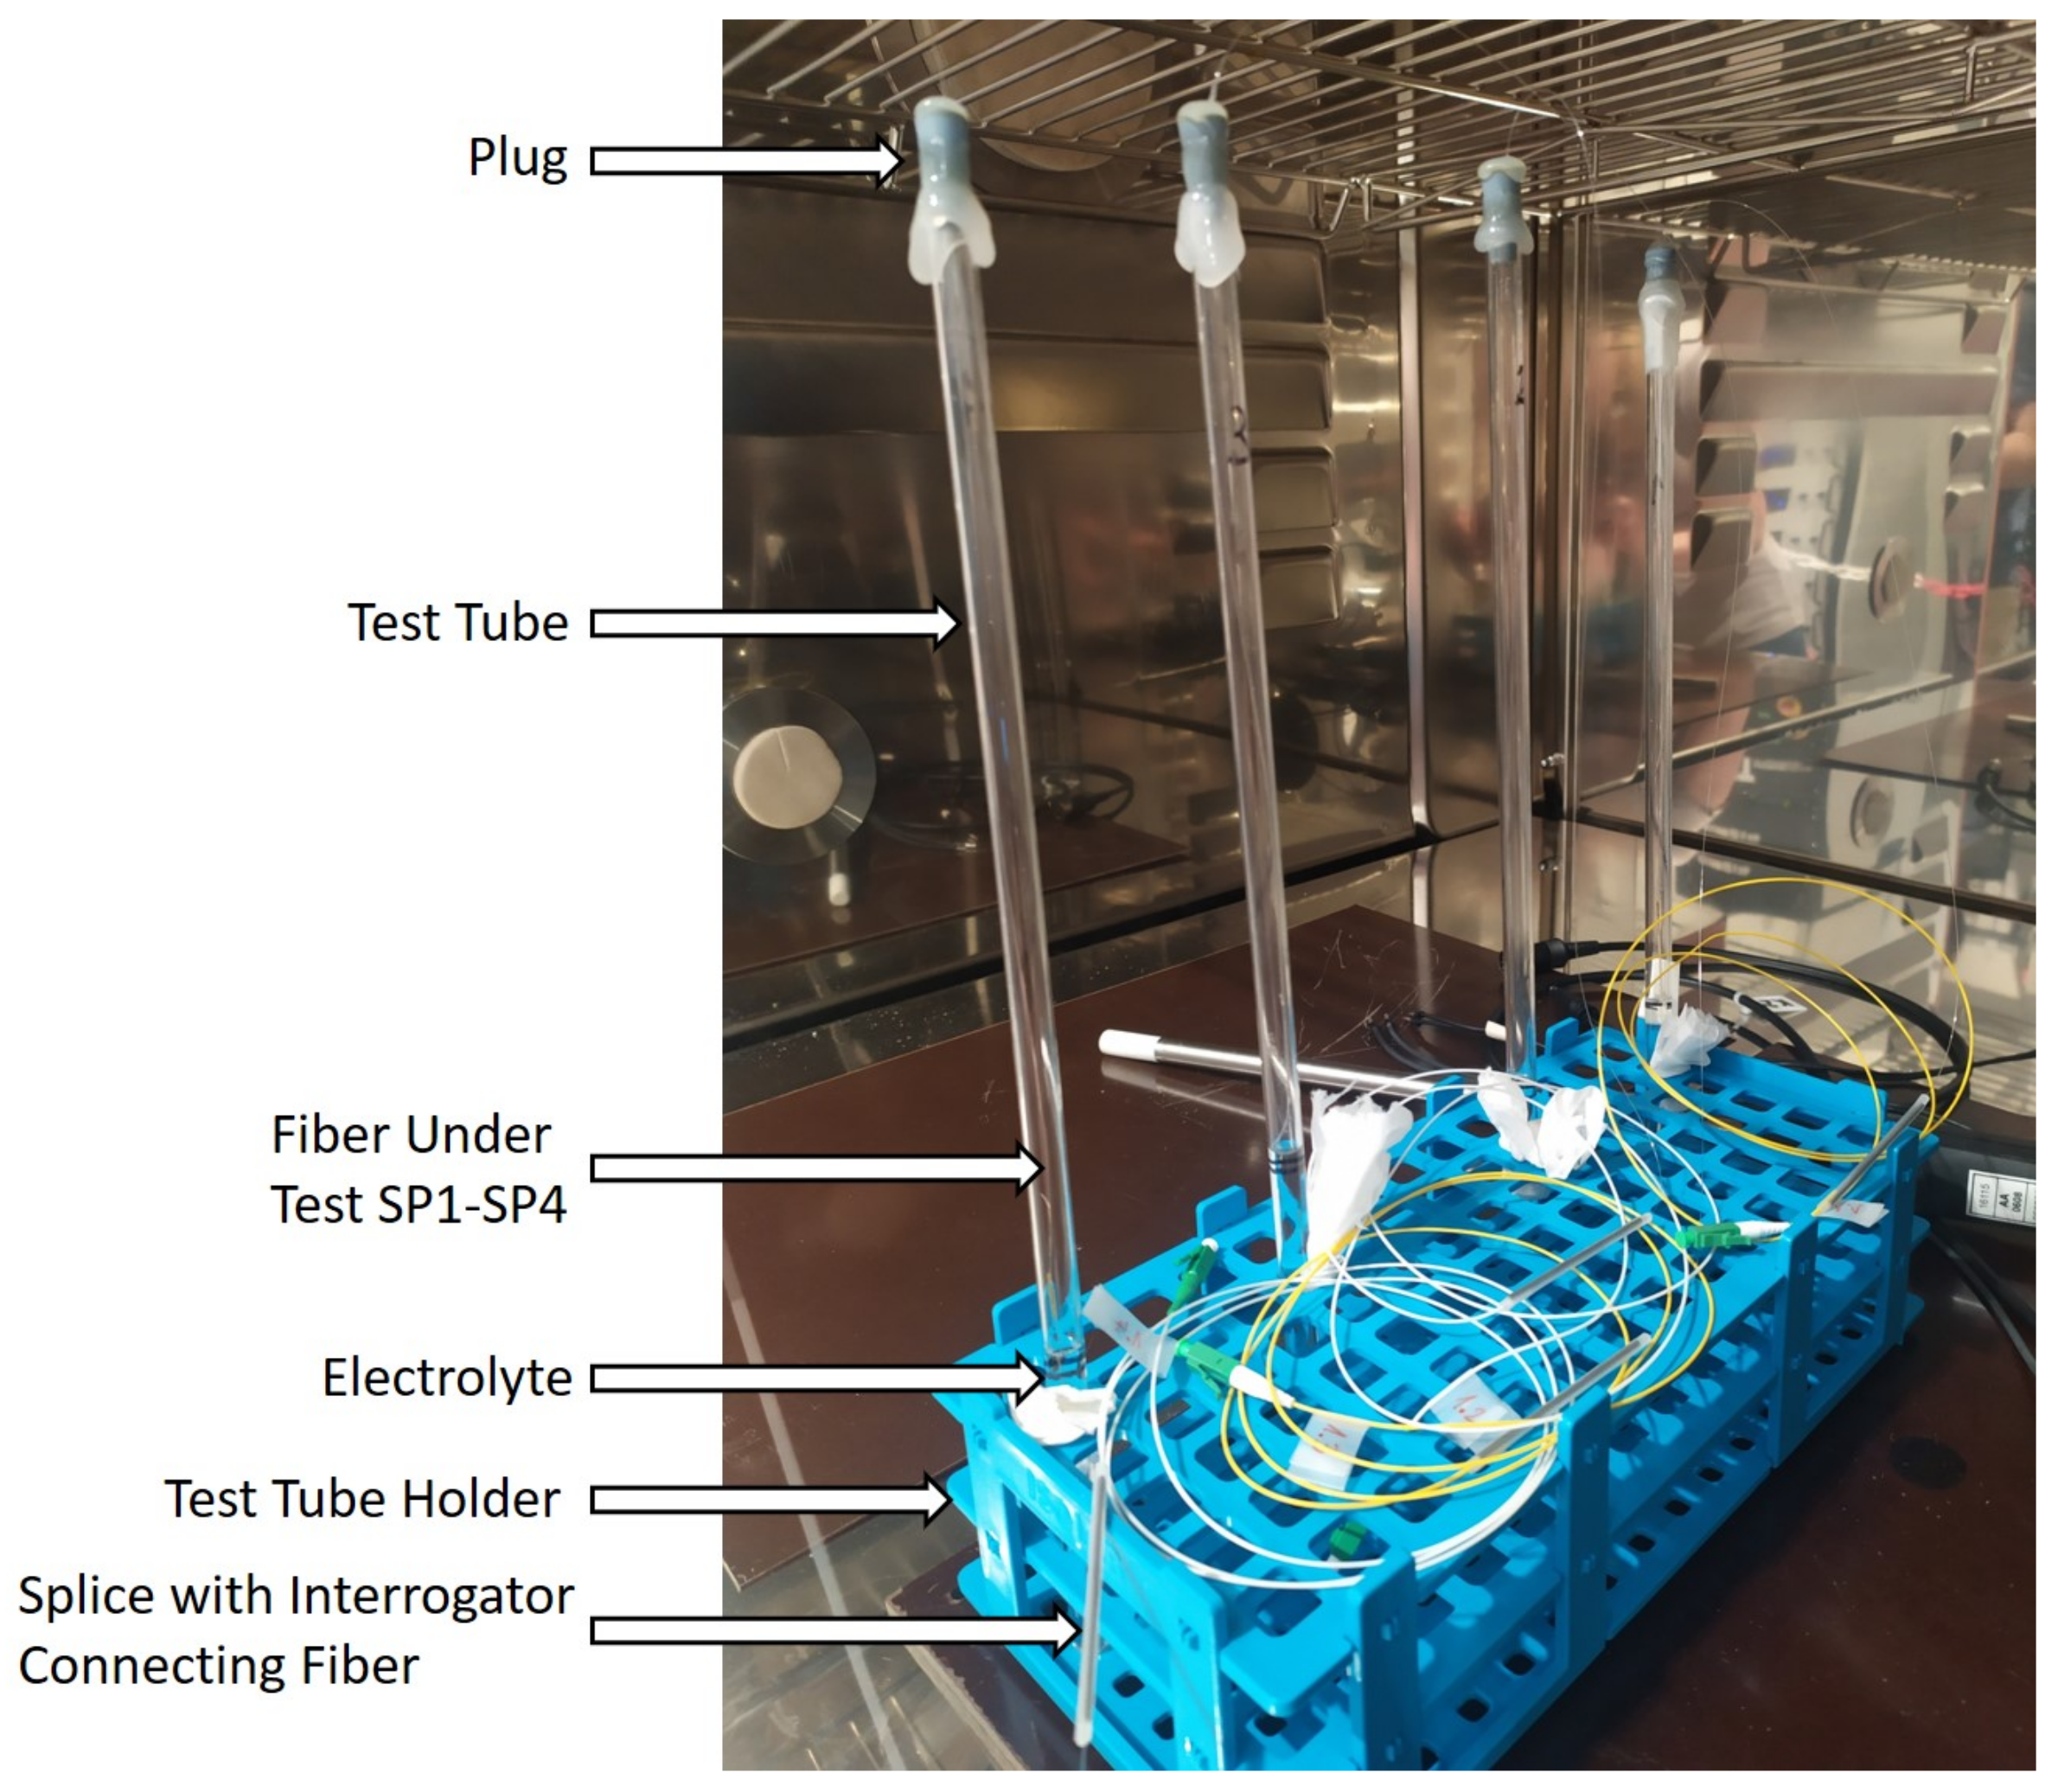
Batteries 09 00034 g001
Figure 2. Setup of the electrolyte measurement in the climatic chamber. Test tubes filled with the electrolyte and the inserted fibers in a test tube holder.
Batteries 09 00034 g002
Figure 3. Standard calibration in air; FBG3 from each sensor. SP1: optical fiber in PEEK capillary, single-point mounting; SP2: optical fiber in fused silica tube with polyimide coating, single-point mounting; SP3: optical fiber in fused silica tube, removed polyimide coating, single-point mounting; SP4: optical fiber in fused silica tube, removed polyimide coating, double-point mounting.
Batteries 09 00034 g003
Figure 4. Calibration curve in air for FBG3 from each sensor. SP1: optical fiber in PEEK capillary, single-point mounting; SP2: optical fiber in fused silica tube with polyimide coating, single-point mounting; SP3: optical fiber in fused silica tube, removed polyimide coating, single-point mounting; SP4: optical fiber in fused silica tube, removed polyimide coating, double-point mounting.
Batteries 09 00034 g004
Figure 5. Standard calibration in air, all sensors. Temperature calculation with the polynomial fit from Figure 4/ Table A2. SP1: optical fiber in PEEK capillary, single-point mounting; SP2: optical fiber in fused silica tube with polyimide coating, single-point mounting; SP3: optical fiber in fused silica tube, removed polyimide coating, single-point mounting; SP4: optical fiber in fused silica tube, removed polyimide coating, double-point mounting.
Batteries 09 00034 g005
Figure 6. Representative behaviors of the FBGs of each sensor’s encapsulation in the electrolyte. SP1: optical fiber in PEEK capillary, single-point mounting; SP2: optical fiber in fused silica tube with polyimide coating, single-point mounting; SP3: optical fiber in fused silica tube, removed polyimide coating, single-point mounting; SP4: optical fiber in fused silica tube, removed polyimide coating, double-point mounting.
Batteries 09 00034 g006
Figure 7. Calibration curve for the measurement in electrolyte for FBG3 for each sensor. Polynomial fit. SP1: optical fiber in PEEK capillary, single-point mounting; SP2: optical fiber in fused silica tube with polyimide coating, single-point mounting; SP3: optical fiber in fused silica tube, removed polyimide coating, single-point mounting; SP4: optical fiber in fused silica tube, removed polyimide coating, double-point mounting.
Batteries 09 00034 g007
Figure 8. Temperature calculation using the polynomial fit from Figure 7/Table A3 for each FBG of each sensor encapsulation in the electrolyte. SP1: optical fiber in PEEK capillary, single-point mounting; SP2: optical fiber in fused silica tube with polyimide coating, single-point mounting; SP3: optical fiber in fused silica tube, removed polyimide coating, single-point mounting; SP4: optical fiber in fused silica tube, removed polyimide coating, double-point mounting.
Batteries 09 00034 g008
Figure 9. Sensitivity comparison between the calibration in air and the electrolyte. SP1: optical fiber in PEEK capillary, single-point mounting; SP2: optical fiber in fused silica tube with polyimide coating, single-point mounting; SP3: optical fiber in fused silica tube, removed polyimide coating, single-point mounting; SP4: optical fiber in fused silica tube, removed polyimide coating, double-point mounting.
Batteries 09 00034 g009
Table 1. The sensor sample, the material, the mounting method, and the diameter of the encapsulation. Single-point: the capillary is glued to the fiber on one point only; the other side is sealed before mounting. Double-point: the capillary is glued to the fiber on both sides of the capillary.
Sensor SampleCapillary MaterialMounting MethodOuter Diameter [μm]
SP1polyether ether ketone (PEEK)single-point785
SP2fused silica with polyimidesingle-point360
SP3fused silica without polyimidesingle-point324
SP4fused silica without polyimidedouble-point324
Table 2. The sensitivities for each FBG in the electrolyte and air. SP1: optical fiber in PEEK capillary, single-point mounting; SP2: optical fiber in fused silica tube with polyimide coating, single-point mounting; SP3: optical fiber in fused silica tube, removed polyimide coating, single-point mounting; SP4: optical fiber in fused silica tube, removed polyimide coating, double-point mounting.
Sensor Sample, FBGSensitivity in Electrolyte (pm/°C) ± 0.2Sensitivity in Air (pm/°C) ± 0.2
SP1, FBG113.7914.11
SP1, FBG213.0612.65
SP1, FBG312.0811.26
SP2, FBG111.6010.87
SP2, FBG211.6711.08
SP2, FBG311.3710.95
SP3, FBG110.8010.83
SP3, FBG211.1811.05
SP3, FBG311.3111.24
SP4, FBG1-10.20
SP4, FBG2-10.39
SP4, FBG3-11.90
Table 3. Comparison of the different materials tested as capillaries in the electrolyte. SP1: optical fiber in PEEK capillary, single-point mounting; SP2: optical fiber in fused silica tube with polyimide coating, single-point mounting; SP3: optical fiber in fused silica tube, removed polyimide coating, single-point mounting; SP4: optical fiber in fused silica tube, removed polyimide coating, double-point mounting. The colors green, yellow and red rank the different categories.
Sensor SampleCapillary HandlingDiameter (μm)UncertaintyUsable in ElectrolyteHysteresis
SP1very easy, robust material785±1.7 °Cyesyes
SP2easy360±0.4 °Cyesno
SP3difficult, brittle material324±0.6 °Cnono
SP4difficult, brittle material324-no-
Disclaimer/Publisher’s Note: The statements, opinions and data contained in all publications are solely those of the individual author(s) and contributor(s) and not of MDPI and/or the editor(s). MDPI and/or the editor(s) disclaim responsibility for any injury to people or property resulting from any ideas, methods, instructions or products referred to in the content.

