Abstract
Meeting the increasing demand for energy storage based on lithium-ion batteries (LIB) is not only a question of resource availability but also an issue of resource conservation and efficient recycling management. In this respect, sustainable recycling concepts play a central role in mindful interactions with valuable materials. Based on this approach, a process interconnection of hydromechanical preparation, flotation, and pyrometallurgical treatment was investigated. The hydromechanical preparation showed promising results in achieving highly pure mixtures of LIB-active material. It was found that a pre-opening step could achieve an even better separation of impurities for downstream processes such as Cu and Al to avoid excessive particle size reduction. According to an optimized mixing stage during flotation, the C amount was reduced from 33 wt.% to 19.23 wt.%. A Li-free metal alloy was obtained through the subsequent pyrometallurgical treatment, and evidence for Li removal via the gas phase was provided. Furthermore, heating microscope trials confirmed the results of the process interconnection and showed that further optimization steps for the pre-treatment are necessary for favorable product quality. Therefore, a high-stratification plot was created, which allows a quick future statement about the suitability of the input material for use in the process.
1. Introduction
Alternative technologies in several sectors, including energy-intensive industries [1], electrical grids [2,3,4,5], and especially within mobility [6], have been emerging all around the globe in recent years. They all try to tackle the same goal to minimize environmental impacts, reduce dependency on conventional energy sources like gas and petroleum, and diversify energy sources for the transportation sector [7]. The harsh spike in technological development ratios is based on national and international efforts to reduce global greenhouse gas emissions, resulting in a tremendous economic potential for these technologies [8,9,10]. One of these endeavors to limit global CO2 emissions is the COP21, which led to the “Paris agreement” being adopted in December 2015 [11]. The aim of this agreement is to limit the rise in global temperatures to “well below” 2 °C above pre-industrial levels while striving for 1.5 °C by 2030 [12].
The electrification of these industries to replace fossil fuels with renewable electricity is essential for meeting these targets [13]. To store this energy, battery technologies are ubiquitous. With an estimated growth of 25% per year, a total capacity of up to 2.600 GWh in 2030 will be deployed [14]. With a share of 33.7% in 2018, Lithium-Ion Batteries (LIB) are among the technologies already taking the most significant share of the overall rechargeable and non-chargeable battery market. Furthermore, it is expected that by 2024, about 82% of market growth will come from LIBs [15]. In Figure 1a, an estimation of the main drivers of demand growth is given, showing that the electrification of the transport sector is the main reason for this growth, followed by the deployment of batteries in electricity grids [14]. Each of these industries has different requirements for batteries, which can be adjusted via the chemical composition of the cathode materials. Figure 1b shows an outlook on the development of different cathode chemistries [16].
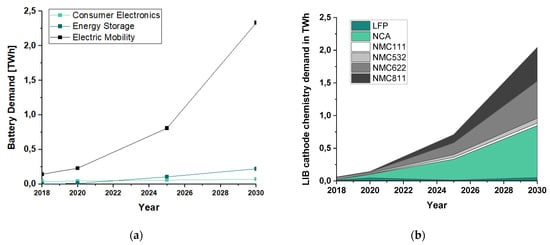
Figure 1.
Information about the current and future development of the battery market with a special focus on LIB: (a) global battery demand by application in TWh for the year 2030 (data in this figure are from WEF base case [14]); (b) outlook of different LIB cathode chemistries until 2030 in TWh (data in this figure are from [15,16]—the detailed calculation can be reviewed in Appendix A).
As seen in Figure 1, the forecasts for the LIB active materials show a wide variation. Hence, methods to sensitize recycling technologies towards fluctuating waste streams as well as political aspirations, and to mark batteries accordingly to their chemistry are needed. However, neither efficient recycling technologies nor legal frameworks for battery labeling are available or implemented in the primary markets [17]. The EU Commission’s proposal for a regulation is considered a promising advance in this direction [18], wherein recovery rates for cobalt, copper, and nickel of 95% and 70% for lithium must be achieved by 2030. Concerning these ambitious recovery rates, and to counteract unlicensed recycling and illegal trafficking, the battery recycling chain must be revised entirely, including implementing the introduction of innovative and efficient recycling technologies. Furthermore, a complete waste battery collection system should be established to promote extended producer responsibility (EPR) [19].
State-of-the-art recycling routes for LIBs still face several dark spots, where inefficiencies or economic circumstances lead to material losses and landfilling [20]. The first operational step within the recycling chain is the pre-treatment of complete battery packs, including sorting, disassembly, and discharging. Generally, pre-treatment process steps are required to separate individual components ssuch as cables, plastics, aluminum and steel elements, and electronic components of the cooling system, etc., and the valuable remaining fractions like Fe, Cu, and Al as part of the housing or conductor foils from the cathode and anode material, the so-called black matter or active material. The dismantled parts are processed within further recycling steps; however, this is not the subject of the present work [21]. The black matter, in turn, contains the most valuable compounds, including Li, Ni, Co, Mn, and P. Next to these valuable metals, the black matter also consists of high rates of graphite (30–40% of the fines), often due to economic reasons, yet are not recycled. However, to meet the EU’s target of an overall recovery rate of 70%, it will become crucial to recover graphite in order to attain the recycling targets [22].
Within the disassembly step, shock-wave-based recycling procedures have become popular in recent years, as this technique allows a material-selective separation of complex and/or difficult-to-break composites, such as galvanized plastics [23], spark plugs [23], printed circuit boards [24], or LIBs [25,26]. Particularly in the processing of batteries, selective disintegration produces several advantageous coarse-grained by-products such as Al, Cu, and plastic foils, as well as steel housing parts, which can usually be recycled individually after further simple physical separation stages [25,26]. Furthermore, these by-products constitute a significant advantage in this pre-treatment method, especially compared to established pyrometallurgical recycling processes without further separation of battery components [27], where some of the metals, especially Al and Li, pass into the slag and are difficult or impossible to recover. The hydromechanical process enables the recovery of most of the battery cell components. However, the electrolyte remains in the process water; Li and P can at least be recovered from the water. Two of the most common alternative options for pre-treatment are mechanical shredding or crushing, including magnetic and/or density separation with or without inert atmospheres [28], and pyrolysis, a method that thermally decomposes the organic binder between conductor foils and active material [20].
Commonly, the next step in the recycling chain to recover valuable metals from the black matter consists of a pyro- and/or hydro-metallurgical process. Both of these processing routes commonly have the same goal of precious metal recovery, however, they also have to consider their individual pros and cons in combination with economic and environmental factors [20]. In downstream hydrometallurgical processes, graphite is often damaged, resulting in the unsuitability of upcycling spent anode materials [29]. Furthermore, graphite adds volume to the feed material during leaching processes, resulting in a high reagent consumption and leading to challenges in the dewatering stage [22]. In pyrometallurgical processes, graphite can be used as a reduction agent for the lithium-metal-oxides (LMO), however, it often exceeds the stoichiometrically needed content, resulting in a reduced smelting ability [30].
To separate the anode graphite and the LMO before a downstream process, froth flotation, a separation method using differences in surface wettability, might be a potential solution. The graphite particles have a size typically less than 25 µm. To achieve satisfactory separation of the graphite, the feed to the flotation stage needs to be rather fine compared to typical ore flotation [31,32]. Although the differences in wettability are pronounced, the particle size renders it an instance of fine flotation with its inherent difficulties in terms of the concentrate grade and the recovery of the valuable phase. Several approaches to improve the flotation performance, including chemical dissolution with Fenton reagent [33], thermal treatment [34], and mechanical [35] or cryogenic grinding [36], have already been tested and have shown promising results. However, they often fail when it comes to scale-up processes. Only thermal treatment at temperatures between 400–600 °C (the temperature range at which the binder starts to dissolve), ideal conditions for the flotation process, reported high graphite recovery of up to 98% in the froth product, being at the same time efficient and easy to use on an industrial scale [36]. As soon as the desired separation accuracy between the LMO and graphite has been achieved, the LMO is processed using downstream pyro-, hydro-, or bio-hydrometallurgical processes to ensure the sufficient product quality of the metals for recycling into a circular economy [37].
In order to overcome the challenges of the recycling technologies for spent LIBs currently available on the market, the scope of this paper was to investigate a novel possible interconnection between pre-treatment and pyrometallurgy. Therefore, a hydromechanical pre-treatment step with an electro-hydraulic fragmentation unit, a subsequent depletion of the graphite via flotation, and finally an inductive pyrometallurgical plant, was chosen. The pyrometallurgical plant used, the so-called InduMelt, is an inductively heated packed bed reactor in batch operations. This technology has a significant advantage over state-of-the-art processes [27] since, in addition to the alloy, Li and P are not slagged and can be recovered via the gas phase. To explain the result from this process chain respectively and to optimize the quality of the obtained product in the future, results from further basic research on meltability and how interfering elements influence it are presented.
2. Materials and Methods
The source material for the recycling process were discharged NCA-cells (Panasonic NCR 18650A—LiNi0.8Co0.15Al0.05O2), which were obtained by manually dismantling a CUBE e-bike battery. NCA was selected as active material for this series of tests due to its expected high market share and likely its greatest impact on the fluctuating recycling stream’s overall black matter chemistry, as seen in Figure 1.
The experimental series can be divided into three substeps. In the beginning, the battery cells of the NCA type are prepared in a hydromechanical pre-treatment. The resulting fine black powder containing valuable metals, consisting primarily of an anode and cathode material, in short, active material or black matter, and an electrode conductor foil made of Al and Cu, are then further processed. From previous research activities [30], it is known that for the reduction reactions in the InduRed process described in 2.3, a maximum of the stoichiometric C requirement may be present in the material since an oversupply would impair the necessary melting ability. Accordingly, in the next step, the C content was reduced via flotation from 34.57 wt.% to around 20 wt.%, corresponding to the theoretically necessary reducing agent requirement. The flotation fines were finally treated in the InduMelt plant for further valuable metal recovery. Consequently, the individual steps and the used analytical methods are described in more detail in the following subsections. In addition, the methodology for determining meltability is also discussed.
2.1. Hydromechanical Preparation
The hydromechanical processing of the battery cells was conducted at ambient conditions involving an electro-hydraulic fragmentation device (EHF-400, ImpulsTec GmbH, Germany), which was applied to produce NCA black matter. During this treatment, 40 single-round cells per batch were treated in 20 L water at a voltage of 40 kV and a frequency of 1.5 Hz within a stainless steel reactor. This procedure was conducted until all the batteries were opened and successfully disintegrated. The applied process (schematically drawn in Figure 2) is based on shock waves generated by discharges between the electrodes through the water in the reactor and targeted to separate LIBs along their weakest points, typically phase and material boundaries. At this point, it must be mentioned that in individual cases, the discharge can pass through the material (electro-dynamic fragmentation), which occurs as an undesirable side effect only to a small degree. Due to the different mechanical properties of battery materials, a high fragmentation selectivity and higher purity can be achieved via electro-hydraulic fragmentation, especially compared to conventional mechanical shredding, which is advantageous for further recycling. For more in-depth information on this technology, refer to previous publications [28,29,30,31]. After shock wave treatment, the suspension from the reactor was screened through a 500 μm sieve to separate the coarse fractions from the much finer anode and cathode particles. Subsequently, the fine fraction was vacuum filtered to separate the black matter from the water. Finally, after drying at 80 °C for 72 h, the obtained black matter was homogenized for subsequent experiments and analytics using mortar and pestle.
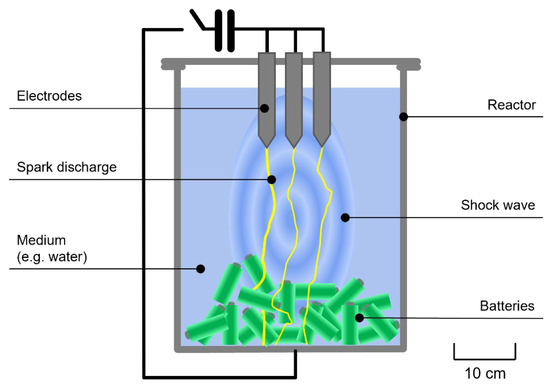
Figure 2.
Schematic functional principle of electrohydraulic fragmentation.
2.2. Flotation
The flotation tests were performed in two stages. As only about 100 g of NCA was available to complete any preliminary tests, a small custom-made flotation device with a 500 mL tank size was used at this point, which is well-suited for such basic tests (Figure 3a). This device has been used at the Chair of Mineral Processing for several decades and is well-suited for such basic tests. For detection of the C amount, parallel trial with a Leco CHN 628 has been conducted. Prior checks with test tubes had shown that dispersion of the sample in water is no challenge. Furthermore, the suitability of two commercial reagent blends was confirmed for this task: Ekofol (EF) 440 and EF 452, which are sold by EKOF for the flotation of coal and graphite. They contain aliphatic alcohols, esters, and ethers; the exact composition is not disclosed. EF 452 was chosen for the tests.
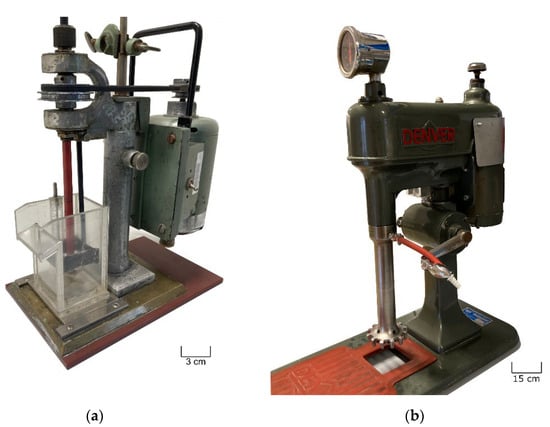
Figure 3.
The flotation devices used for graphite removal from NCA samples: (a) the custom-made cell used for the preliminary flotation test; (b) Denver laboratory machine D-1 used for the actual NCA sample.
To achieve good separation with the fine particle sizes present, the flotation test was performed in a rather conservative way: low solids concentration of about 5 %-vol; frother/collector EF 452 added in several increments of 200 ppm each; discharge of concentrate for as long as the froth carried particles; thick froth layer; skimming froth off only superficially; low airflow. The pulp was dispersed for 5 min at 1200 rpm prior to the first addition of EF 452 and conditioning.
When the actual NCA sample—close to 2000 g—was available, the flotation tests moved to the Denver laboratory machine D-1, with its larger working volume of either 1.2 or 2.3 L (Figure 3b). Four batches were basically treated with the same general attitude as in the preliminary test. The rotational speed of the impeller was 800 rpm. As the characteristics of the two impeller systems are different, a direct comparison with the speed of the preliminary test is not valid. In contrast to the initial examination, solids concentration was about 10%-vol for the four batches. Separation was no longer satisfactory; possible reasons will be discussed later.
The remaining six flotation tests for the Denver D-1 aimed at improving the separation result and settings varied within this series. The most important changes were a significantly more intense dispersing stage (15 min at 1200 rpm and solids concentration of up to 20 %-vol), higher reagent dosage, and a higher impeller speed (1000 rpm) during flotation.
2.3. Pyrometallurgical Treatment
The plant setup designed at the Chair of Thermal Processing Technology, the so-called InduMelt plant with its InduRed reactor concept, is shown schematically in Figure 4.
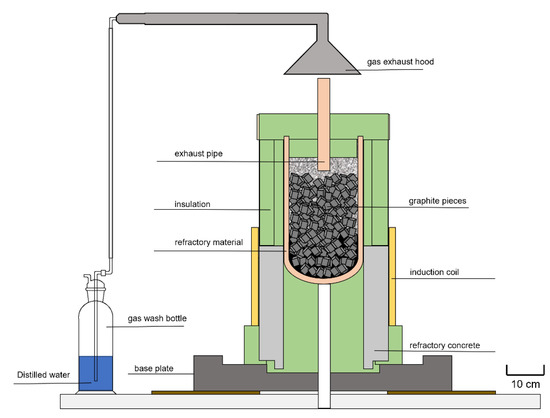
Figure 4.
Schematic illustration of the InduMelt plant [38].
The main advantages of this system compared to, for example, a shaft furnace, are the high contact area between the hot graphite cubes and the active material, the homogeneous radial and horizontal heat supply, and short diffusion paths for volatile elements such as phosphorus or lithium through the resulting melt film. As a result of the engineering-related advantages of the reactor principle compared to conventional pyrometallurgical reactor concepts, valuable components like lithium are not being transferred to a mineral phase, and are thus able to be recycled. Additionally, the reactor produces a very limited amount of mineral phase, resulting almost in a closed loop process. The graphite cubes serve purely as susceptor material for providing heat on its surfaces and do not participate in the reduction reactions.
For better comparability with previous experiments, the setup, experimental procedure, and sampling are carried out precisely according to the scheme from Holzer et al. [38]. In summary, the crucible with a height of 60 cm and width of 20 cm consists of high temperature-resistant MgO. The material to be reduced in this plant was pre-treated in the hydromechanical step. Subsequently, graphite was partially separated through flotation. The crucible is filled layer by layer with 400 g of the resulting active material and the graphite cubes. The latter have a side length of 2.5 cm, an electrical resistance of 4–8 µΩm, and a density of 1.55–1.75 gcm−1 [38].
It should be noted that the graphite from the battery anode materials acts as a reducing agent. This creates an atmosphere in the reactor during the experiment with a high CO/CO2 ratio and low O2 partial pressure.
To ensure appropriate temperature control, two type-K thermocouples are placed in the bulk and one type-S in the thermocouple, each at the bottom and on the reactor wall of the outside. After insulating the wall and floor area, as shown in green in Figure 4, a ceramic pipe is installed in the lid insulation for controlled exhaust gas discharge. Above this is the gas exhaust hood through which a water jet pump draws the gas stream over the fluid in the gas wash bottle. For this experiment, distilled water was used to avoid unwanted reactions between the fluid and the compounds in the gas stream.
For the protection of the refractory material, a maximum heating rate of 250 °C/h was selected over an experimental period of 7.5 h. Consequently, the target temperature of 1550 °C was maintained for half an hour before the completion of the experiment. After a cooling phase of at least 24 h at ambient temperature, the standardized sampling was carried out. The resulting fractions (metal, powder, mineral phase) were extracted and separated via magnetic separation and sieving and finally analyzed.
2.4. Analytical Methodology for Material Characterization
In general, samples, including the floated active material and the gained fractions obtained after carbo-thermal treatment, were subjected to an SEM analysis. Except for the metal fraction embedded in an epoxy resin as a ground-glass specimen, all other specimens were prepared on self-adhesive, graphite-filled pads. In addition, the metal and mineral fractions were sputtered with gold, whereby EDX software largely corrected the gold signal. This publication’s analyses were performed in the SEM of model Vega1 from Tescan (CZ) with an acceleration voltage of 0.5–30 kV from an electron source in the form of a tungsten filament. Additionally, with the aid of an energy dispersive X-ray analysis (EDX) model 5108 from Oxford Instruments type Si(Li), the elemental composition can be determined within a 10 mm2 area of the sample with a resolution at 5.9 kV of 137 eV. Therefore, with the present instrumental setup, elements starting from atomic number 4 (i.e., carbon) can thus be detected with SEM-EDX. Since this does not allow the determination of lithium, laser-induced breakdown spectroscopy (LIBS) model EA-300 from Keyence (optics 300x, laser–Nd: YAG 355 nm) was applied as supplementary to verify the SEM-EDX results by means of a line-point analysis. This pool of analytical methods enables the determination of elemental distribution based on mappings, point analyses of individual phases, and line spectra with SEM-EDX and LIBS.
Powder X-ray diffraction (PXRD) samples were analyzed for phase composition using an X-ray diffractometer (Empyrean, Malvern Panalytical, U.K.) within Bragg−Brentano geometry using cobalt radiation (λ = 1.789 Å) at 40 mA and 40 kV. Diffraction patterns were collected with a scan speed of 0.006°/s and a step size of 0.013° for the 2θ range from 10 to 75° and evaluated using HighScore Plus software (Malvern Panalytical, U.K.) using the inorganic crystal structure database (ICSD; FIZ Karlsruhe, Germany).
ICP-OES analyzed the chemical composition of several fractions during this investigation according to ÖNORM EN ISO 11885:200911.
2.5. Analyses Concerning High-Temperature Behavior and Influence of Impurities
For successively improving the product yield, the high-temperature behavior of the cathode material NCA was investigated under the influence of contaminants such as Cu, Al, and C. The aim was to determine the meltability of the cathode material by measuring the sample’s change in cross-sectional area (CSA) during heating. For this purpose, a series of tests were carried out using a Hesse Instruments EM 201 heating microscope with an HR18-1750/30 furnace with cathode material from battery production and varying amounts of Cu, Al, and C. To simulate the low CO/CO2 ratio of the InduMelt plant, the experiments in the heating microscope would have to be operated with a CO atmosphere. Since this is not possible for technical and safety reasons, the trials were performed with a 2.5 L/min argon purge to suppress undesired reoxidation reactions. Therefore, the C fraction for InduMelt has to be converted in order to simulate reactions from C to CO2 (occurring in the heating microscope) to reactions from C to CO (occurring in the InduMelt). The cylindrical pressed samples of about 0.1 g each were positioned on an Al2O3 plate and heated up following the standardized heating program from Table 1. The maximum furnace temperature of 1700 °C contained therein results in a sample temperature of approximately 1620 °C. After the holding time at 1700 °C, the furnace load was switched off and the sample was left in the furnace chamber under argon purging until room temperature was reached.

Table 1.
Standardized heating program in the heating microscope for investigations of the high-temperature behavior of NCA with different impurities.
Subsequently, a height stratification diagram was selected to simplify the presentation of the results. The evaluation and execution of the experiments followed a consistent scheme. Essentially, a total of 42 experiments were carried out in the heating microscope with different mixing ratios. Based on the preparation of an Al-C-NCA system, these investigated mixing ratios were extended in a selected range by adding 3 wt.%, 6 wt.%, and 9 wt.% Cu in each case [39]. The selected range described above resulted from the findings of Baldauf [40], who defined the meltable zone at a minimum carbon demand of 5 wt.%. It should be mentioned at this point that the stoichiometrically necessary reducing agent required for a complete reduction of the oxide for NCA is around 11 wt.% C. Since processing and preparation of more than 1500 data points per test is relatively costly, they were processed as in Holzer et al. [30]. In essence, this was achieved via smoothing over a polynomial, comparing the measurement points with the corresponding images, the linear correlation of the corrected values, and the arithmetic mean of data with the same temperature or logical continuation [30,40].
3. Results and Discussion
3.1. Hydromechanical Preparation
In the hydromechanical processing of NCA cells, about 6000 pulses were required to achieve complete disintegration of the battery cells and to separate the active materials from the anode and cathode foils. In each batch, 40 cells with a total weight of about 1750 g were processed to produce about 1100 g of black matter and about 650 g of the coarse fraction. Since this work focused on the recovery of the cathode metals, the coarse fraction, which consists mainly of aluminum, copper, plastic foils and steel housing parts, was not investigated further in this study.
Characterization of the black matter specimens (NCA_AM_start) via ICP-OES and Leco analysis (see Table 2) revealed carbon (34.57 wt.%), nickel (31.0 wt.%), and cobalt (5.02 wt.%) as the main elements. The relatively high carbon content is attributed to anode graphite, carbon black, and possibly small residues of polyvinylidenfluoride binders. At the same time, lithium, nickel, cobalt, and aluminum are associated with the NCA cathode material (approximately LiNi0.8Co0.15Al0.05O2). The element concentrations for Cu, Fe, and partially Al are caused by small impurities of metal particles that pass into the fine fraction during processing.

Table 2.
ICP-OES analysis of relevant elements in the sample after the hydromechanical preparation in wt.-%.
3.2. Flotation
The separation result of the preliminary test was quite good, even though only a rougher stage was performed. Three consecutive C concentrates, and the residue R were assayed for their C grade. The balance is given in Table 3.

Table 3.
Balance of the preliminary flotation test. C1 to C3: carbon concentrates; R: residue.
The residue yields 26% of the feed, while its C grade has been lowered from 33% in the feed to 6%. In this test, the 20% grade aimed for later on was already reached by removing the first graphite concentrate C1, while almost half of the feed mass remained available for the metallurgical tests. Terminating the separation after C2 would leave C3 and R as the combined residue with 38% of the feed mass at 13% C grade.
In comparison, when conducting the experiments on the Denver D-1, only one of the first four batches achieved some slight separation regarding C. The C grade of the remaining froth products and residues was virtually the same as that of the feed. There are two main reasons for inadequate separation in flotation: low degree of liberation, and entrainment.
The degree of liberation measures how much of a certain phase is present in pure particles. The rest of that phase is “intergrown” and is part of the compound particles. As the physical/mechanical separation methods of mineral processing can only separate particles from each other, good liberation is an essential prerequisite for any separation success. The only way to improve liberation is by making the particles smaller.
Entrainment occurs when non-hydrophobic particles report to the froth instead of the flotation residue. They may be trapped between hydrophobic particles and thus be forced into the wrong flotation product. Entrainment can be reduced by using the proper setting of the flotation parameters.
The SEM analysis (not shown) confirmed that in the present case the problem was the lack of liberation of graphite. Therefore, six more flotation tests were performed to address this problem. Adding a rather long and intense mixing stage (15 min at 1200 rpm; some tests even with about 15%-vol of solids) before flotation provided better liberation. Diluting the pulp again to the previous 5 %-vol of solids and using 1000 rpm (vs. 800 in the first four batches) during flotation, finally provided satisfactory separation results. Table 4 shows the C grades of graphite concentrates (C plus the number of trial and number of extracted sample) and the residues (R plus the number of trial) of those flotation tests where all products were assayed.

Table 4.
C grades of flotation concentrates and residues after improving liberation.
As some intermediate residues had to be reworked several times, the C balances of the separate tests are inconclusive. Six suitable froth products and residues were blended for a combined C grade of 19.23% and yielded 710 g (34% of the entire NCA sample) to be used for the InduMelt tests.
The difference in separation quality between the preliminary (see Table 3) and the actual NCA sample is striking and demonstrates one of the frequent challenges when processing secondary raw materials. Although samples may seem to be “the same”, assuming identical characteristics and compositions can be very misleading. For example, even the product line of one single producer of LIBs represents various states in its production history. The particle sizes of components, the type of binder, the electrolyte, the actual composition of NCA, etc., will all change, and such variations may impact mechanical separation processes.
The chemical composition of the NCA black matter, the NCA active material after flotation (NCA_AM), can be taken from Table 5. Compared to the material after the electrohydraulic fragmentation (EHF) treatment in Table 2, a depletion during the flotation process of mainly C and Al can be detected. The enrichment of Cu and Fe is particularly interesting in this context. One possible explanation is the larger size and higher weight of the Cu and Fe particles from the electrode conductor foil and battery assembly, compared to the C and NCA. As a result, these elements are less likely to be entrained in the froth during flotation and are concentrated in the residue. In contrast, the lighter Al from the electrode conductor foil tends to be more readily transferred into the foam product due to its low mass, the theory of which is consistent with depletion. The remaining elements are found in the NCA structure. The comparison of the ICP-OES analyses confirms the expected constant proportion of elements.

Table 5.
ICP-OES analysis of relevant elements in the sample after flotation for use in downstream InduMelt experiment in wt.-%.
Figure 5 shows an SEM-EDX mapping of the material obtained from flotation, which is subsequently further processed in the InduMelt plant. The different colors are characteristic of the respective element present in the material, referring to the image of the SEM.
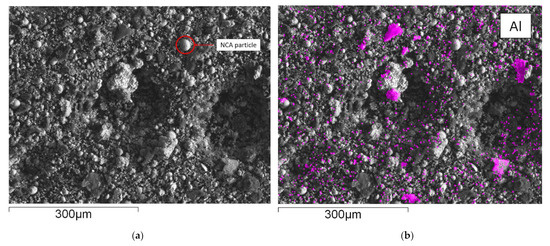
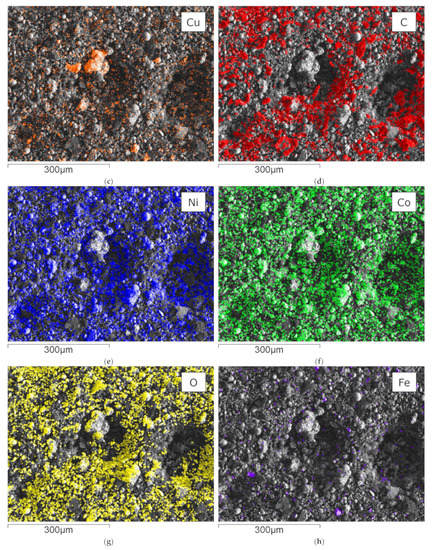
Figure 5.
SEM picture and overlay of the elemental distribution of characteristic elements; (a) SEM picture of NCA_AM, one of the characteristic NCA agglomerates is marked in red; EDX-Mapping of (b) aluminum; (c) copper; (d) carbon; (e) nickel; (f) cobalt; (g) oxygen; (h) iron.
These microscopic investigations confirm the presence of spherical NCA particles with a diameter of about 25 µm within a carbon-rich matrix. In particular, the spherical appearance and the size of the NCA cathode particles are typical features of these materials, so it can be concluded that the EHF treatment only separates these materials from the foils but does not destroy the original microstructure. Furthermore, these observations are consistent with previous work conducted by Öhl [30] and Horn [31]. Carbonaceous particles are seen predominantly in SEM-EDS mapping (Figure 5d) and are related to anode graphite and carbon black being used as conductivity enhancers. In addition to these overall findings, minor indications of Cu and Al are visible in the SEM-EDS mappings attributed to minor contaminants from anode and cathode conductor foils. Generally, Co and Ni (Figure 5e,f) show an overlapping pattern over the whole SEM picture. As expected, the sample is rich in oxygen, which can be attributed to the oxidic components in the NCA-active material. Moreover, finely dispersed iron content is determined in the mapping with Fe-overlay (Figure 5h), which corresponds to traces of housing parts.
As expected, the PXRD pattern (see Figure 6) showed a lithium-nickel-cobalt-alumina oxide phase (PDF 98-009-8451) with space group R-3m and a graphite phase (PDF 98-007-6767) as the main components within the black matter specimens. Both phases correspond to NCA-type lithium-ion batteries’ commonly used cathode and anode materials. In addition, small diffraction peaks of elemental copper (PDF 98-062-7113) were detected, corresponding to fine-anode foil particles, which pass during EHF processing into the fine fraction.
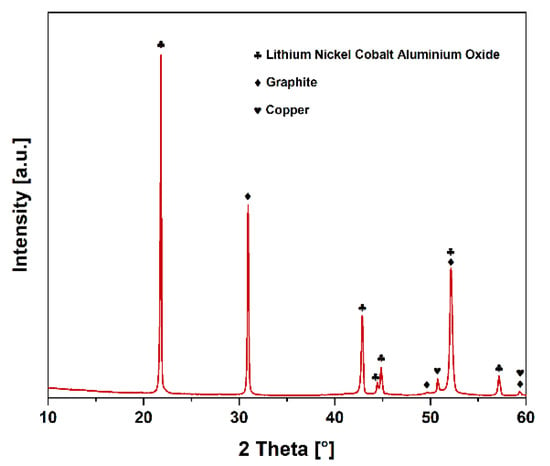
Figure 6.
PXRD pattern of NCA black matter after EHF processing and flotation.
3.3. Pyrometallurgical Treatment
To determine the quality of the products from the pyrometallurgical InduRed reactor concept, the floated black matter was used in the InduMelt plant. The fractions obtained can be subdivided as follows:
- Sparse magnetic powder
- Metal fraction, with a grain size larger than 1 mm
- Powder smaller than 1 mm with magnetic properties
- Product from the gas phase, which has been deposited in the washing water or the exhaust hood
At this point, it should be mentioned that the primary objective of this process step is to obtain a fully reduced, low-lithium metal alloy. At the same time, the formation of slag or powder is not desired. For the successive optimization of the process, in addition to the knowledge of the influence of interfering elements on the product quantity, detailed analyses of the obtained fractions are necessary. Special attention is paid hereafter to the economically interesting valuable metal.
Table 6 shows the weighted masses of the individual solid fractions. When looking at these results, on the one hand, the deficient proportion of sparse magnetic powder compared to metal and powder is striking. On the other hand, it can also be seen that 56.4% of the obtained materials’ mass was classified as powder and 42.4% as metal. If the results are compared with pure cathode material from battery production with the identical experimental procedure and apparatus from Holzer et al. [37], this value is about 20.1% powder and 78.8% metal. From this finding, it can be deduced in the first step that non-separated accompanying elements from the LIB, such as Cu and Al of the electrode conductor foil, harm the metal yield.

Table 6.
Amount of the input and output fractions of the InduMelt experiment in grams.
3.3.1. Analyses of the Powder Fractions
From the ICP-OES analysis of the sparse magnetic powder shown in Table 7, it can be seen that there is a significant amount of Li. Still, according to the small amount in the overall system (Table 6), this plays a minor role in the process. This fraction consists mainly of carbon, accompanied by particles in the mineral phase, both of which could be confirmed through SEM-EDX investigations.

Table 7.
ICP-OES analysis of relevant elements in the produced powder fraction after the InduMelt experiment in wt.-%.
If these findings are supplemented with PXRD analyses, the characteristic diffraction peaks of graphite and Li2CO3 in the monoclinic zabuyelite structure (PDF 98-001-6713) can be recognized, as seen in Figure 7a.
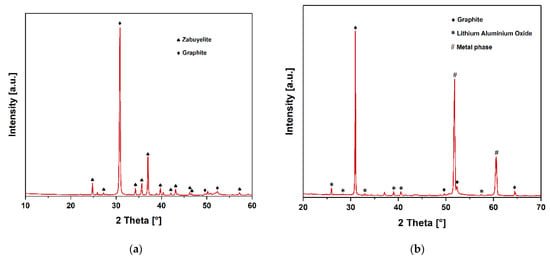
Figure 7.
PXRD pattern: (a) results of sparse magnetic powder; (b) results of powder.
The powder has an entirely different chemical composition compared to the less-magnetic powder. By comparing the ICP analyses of the initial NCA_AM material used from Table 5 and the powder from Table 7 and its magnetic property, it is reasonable to assume that this is partially reduced active material. The SEM and XRD show a significant amount of C, since the initial round 20 wt.% C in the NCA_AM represented the stoichiometrically necessary mass to reduce the lithium metal oxides. Its presence in the powder underscores the presumption of an incomplete reduction. The PXRD measurements could confirm these overall findings in Figure 7b, where the characteristic diffraction peaks of gamma-LiAlO2 with tetragonal symmetry could be detected in addition to the graphite. In addition, two intense diffraction peaks were detected at 51.8 and 60.0° 2 Theta, possibly corresponding to an unspecifiable cubic metal phase.
3.3.2. Analysis of the Metal Fraction
In addition to the elemental analysis using ICP-OES (Table 8), the combination with the SEM-EDX and LIBS provides comprehensive insights into the elemental assignment of existing phases. Figure 8 shows an SEM image of secondary electrons from a different ground-glass specimen compared to the metal fraction embedded in epoxy resin. The examined particles are interspersed with elongated graphite crystals (flake graphite), while shrinkage in varying degrees can also be determined. Moreover, as expected, the polished metal pieces are infiltrated with holes and show different structures, which can be attributed to the experimental setup of the non-continuous batch operation process of the InduMelt. However, according to the SEM-EDX analyses of various metal particles, the elemental composition of the metal alloy itself is consistent in a certain range.

Table 8.
ICP-OES analysis of relevant elements in the produced metal fraction after the InduMelt experiment in wt.-%.
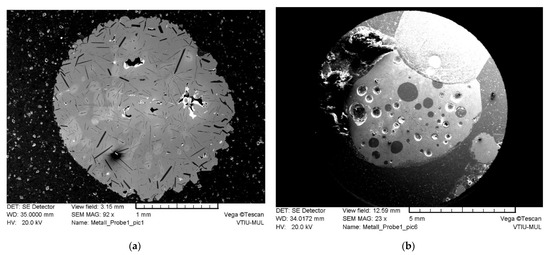
Figure 8.
SEM-secondary electron images of cut and polished specimens of the metal-fraction embedded in epoxy resin: (a) metal droplet with blowholes and elongated graphite crystallite; (b) metal droplet with holes and spherical inclusions.
Figure 9 shows the SEM-EDX mapping of the sample corresponding to the partial image in Figure 8b, with the metal particle mainly shown in this latter figure. Furthermore, a part of the conductor path (upper-right edge) and mineral caking can be seen at the upper-left edge. However, mineral caking represents only a small percentage of the total metal fraction mass. The metal droplet consists of a Ni-rich alloy intermixed with significant amounts of Co, Fe, and Cu. C is likely to be dissolved in the alloy, where larger accumulations in the holes come from the resin. While higher O and Al amounts in the caking indicate the primary presence of oxidic components, the remaining metal alloy is evenly distributed with both elements. It can be assumed that Al from the conductor foil has a high affinity for oxygen and is therefore bound with the remaining oxidic Al from the active material into the mineral phase.
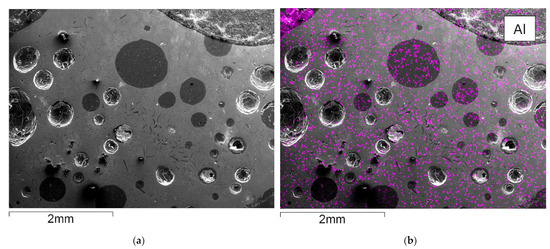
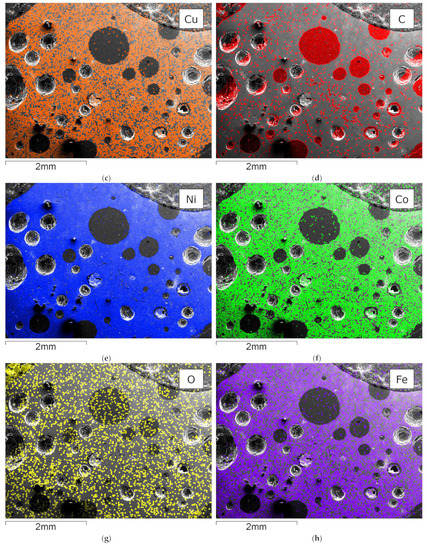
Figure 9.
SEM picture and overlay of the elemental distribution of characteristic elements; (a) SEM picture of the metal after InduMelt experiment; SEM-EDX mapping of (b) aluminum; (c) copper; (d) carbon; (e) nickel; (f) cobalt; (g) oxygen; (h) iron.
As previously described, numerous metal droplets show an adhesion of oxidic origin. For that reason, according to Figure 10, a line spectrum of a characteristic metallic piece with mineral caking is investigated with the SEM-EDX. Twenty measuring points assigning only a qualitative composition due to the low elemental retrieval rate are summarized in Figure 10b. The obtained results are in good accordance with the identified elements of the depicted mapping in Figure 9. In particular, two main phases could be determined: a Ni-rich metallic phase (points 1 and 9–18) with additional alloying elements such as Co, Fe, Cu, Al, and C of consistent composition; on the other hand, a mineral phase (points 2–8 and 19, 20) commonly consisting of O and Al with differing minor amounts of Mg and Ca. Moreover, points two and three are enriched with C. Comparing the results from Figure 10b with those from the chemical analysis using ICP-OES in Table 8, a good correlation can be observed.
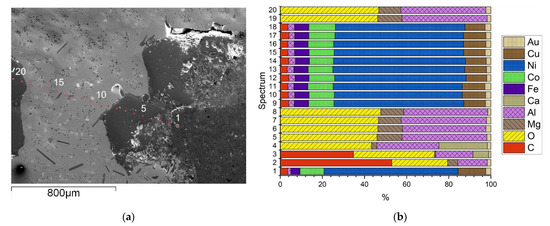
Figure 10.
Line spectrum through a metal piece with mineral caking; (a) SEM-picture of the particle with the associated analysis point position; (b) related composition of each analysis point from (a) using EDX analysis.
In Figure 11, a digital microscopic image with corresponding LIBS measurements of two neighboring grains in the metallic and mineral phase is shown, whereas along the grain boundaries, higher amounts of Li combined with O, Al, and C can be proven. In some phases of the mineral caking, Li in minor amounts is also detectable. It can be assumed that Li compounds neither preferentially dissolved in the gradually formed metal nor in the separated liquefied O- and Al-rich mineral bath during high-temperature treatment. Therefore, Li species accumulate preferably at the grain boundaries before forming gaseous Li. Nevertheless, further scientific investigations should be encouraged by the outcomes of the SEM-EDX and LIBS, especially to focus on the Li behavior during carbo-thermal reduction. Again, the LIBS can verify the elements identified from the ICP-OES and SEM-EDX in a reasonable composition in both phases mentioned.
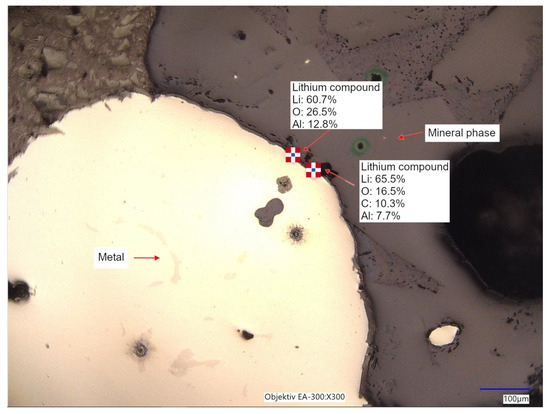
Figure 11.
Digital microscopic image of the interface between metal and mineral phase with corresponding LIBS measurements.
3.3.3. Analysis of the Gaseous Fraction
The PXRD analysis of the white powder precipitated within the water-filled gas wash bottle is shown in Figure 12. Only two intense diffraction peaks were detected in the measured 2 Theta range, which generally indicates a phase with high, probably cubic, symmetry. In addition to these structural data, the ICP-OES analysis (Table 9) revealed a high lithium content of 640 mg/L in the water, so a lithium phase could also be assumed for the precipitate. After comparison with the database, only a cubic griceite-like phase (LiF, PDF 98-005-2234) with space group Fm-3m could explain the observed diffraction peaks, which generally corresponds to the low solubility of the LiF in water (1.3 g/L at 25 °C). Slight residues of the PVDF binders in the black matter could be a likely source of the fluorine, decomposing at the high temperatures of the InduMelt process and forming the LiF together with the degassing Li.
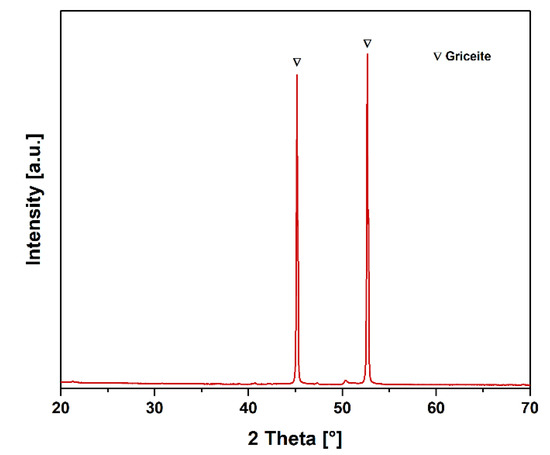
Figure 12.
PXRD pattern of the filtrate of the fluid in the gas washing bottle.

Table 9.
ICP-OES analysis of relevant elements in the produced gas stream after the InduMelt experiment in mg/L.
3.4. Optimization of the Metal Amount
As discussed in Section 3.3 concerning pyrometallurgical treatment, the metal yield is subject to optimization potential. From previous experiments by Holzer et al. [30], it was found that the main factors influencing the melting ability are Al and Cu from the electrode conductor foils, as well as the C from the anode material. The influence of other possible concomitant elements was not investigated further since, from the analyses of the initial sample, a negligible value was found compared to Cu and Al. The experiments generated in the heating microscope with varying Al, Cu, and C contents can be seen in Figure 13. In the figures, different melting-ability ranges are marked, which were determined by comparing the recordings from the heating microscope with the final optical appearance. The area for good melting-ability was observed within the light red continuous line. The dark red dashed line indicates where the results deviate from the optimum range but still provide tolerable performance. Outside this range, poor-to-no melting can be assumed.
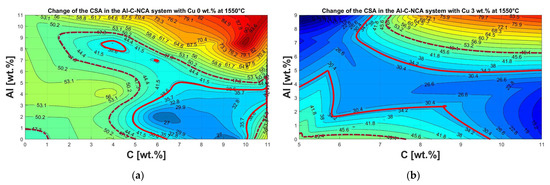

Figure 13.
Representation of the change in cross-sectional area from the heating microscope with changing composition of the Al-C-NCA system at 1550 °C in a height stratification plot: (a) without addition of Cu; (b) constant Cu content of 3 wt.%; (c) constant Cu content of 6 wt.%; (d) constant Cu content of 9 wt.%.
In Figure 13a, without adding Cu, it can be seen that the optimum range is close to the stoichiometrically necessary C content of 11 wt.% for the complete reduction of the oxides mentioned at the beginning. However, its absolute optimum is in the range of between 6 and 7 wt.% C. This can be attributed to the fact that aluminum from the electrode conductor foils, with its strong oxygen affinity [41], acts as a reducing agent [27], resulting in a C excess. This, but also generally an oversupply of reducing agents, has a negative effect on meltability.
The addition of Cu to the Al-C-NCA system is shown in increasing ratios from Figure 13b–d. It can be seen that the melting range gradually increases, and that the optimum range moves in the direction of the lower C content and higher Al content.
Applying these findings to the chemical composition of the NCA material hydromechanical processing and flotation, as shown in Table 5, results in the height stratification diagram with a Cu content of 6.36 wt.%, as presented in Figure 14.
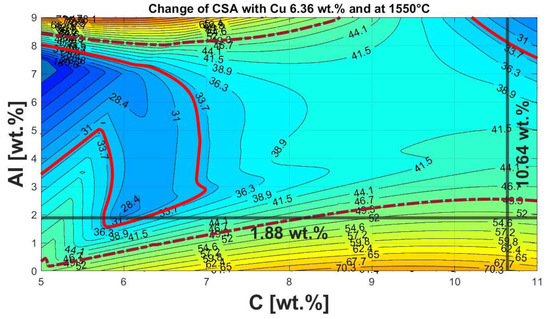
Figure 14.
Height stratification diagram of the Al-C-NCA system at constant Cu content of 6.36 wt.% at 1550 °C.
Considering the argon atmosphere in the heating microscope instead of the high CO/CO2 ratio in the InduMelt results in a comparative C content of 10.64 wt.%, instead of the 19.23 wt.% present in the material. For a more transparent representation, the 10.64 wt.% C and 1.88 wt.% Al were marked with a black line in the diagram. The intersection point consequently shows that the present mixture can be identified as not optimal for use in the InduMelt plant. This fact now coincides with the comparatively high powder content, as discussed in more detail in Section 3.3.1 concerning the analyses of the powder fractions. This is also reflected in the appearance of the metal fractions. In Figure 15, the optical difference between the metal fraction obtained from the identical experiments in Holzer et al. [37] with the material without a Cu and Al addition (Figure 15a) and that in the InduMelt series of experiments in the presented paper in Figure 15b can be seen. In Figure 15a, metal nuggets of several cm could be obtained. Figure 15b shows smaller metal spheres with various adhesions, which have already been discussed in detail in Chapter 3.3.2 concerning the nalysis of the metal fraction.
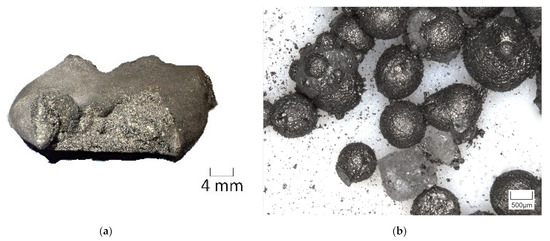
Figure 15.
Digital images of the metal fractions obtained from different InduMelt experiments for comparison: (a) trial with NCA without impurities such as Cu and Al [38]; (b) trial with NCA_AM.
Its C grade would have to be reduced considerably to provide a more favorable composition of the InduMelt feed. As demonstrated by the subsequent concentrates in the preliminary flotation test, this can be achieved via longer flotation times, provided that the graphite is sufficiently liberated. However, mineral processing always has a trade-off between the concentrate grade and the recovery. The achievable separation results are limited by the liberation and intergrowth of the relevant phases in the feed material, so reducing the feed’s C grade to InduMelt requires less feed during the metallurgical stage. If the losses of the metals are not acceptable, flotation must be assisted by some pre-treatment that improves liberation. One quite effective solution may be the removal of the binder, as indicated in the introduction.
4. Conclusions
In this work, a new combined process flow for LIB recycling has been reported, including hydromechanical pre-treatment, flotation of graphite from the anode material, and pyrometallurgical recovery of the valuable metals with the simultaneous separation of lithium via the gas phase. In addition, in-depth results from basic research were presented, which will serve future process optimization.
During these experimental investigations, it could be shown that the black matter obtained using the material-selective electro-hydraulic fragmentation after 6000 pulses fulfils the requirements for the InduRed reactor concept. Analyses confirmed that the shock wave treatment does not destroy the original microstructure and separates the NCA particles from the electrode foils, which is essential for further downstream steps. However, traces of copper and aluminum were found, which have been identified as unfavorable for the meltability. In order to improve the purity of the black matter and to reduce the number of pulses and thus the energy consumption, further studies on different pre-opening steps are currently planned to increase the overall efficiency
The flotation process needed to be modified compared to the standard procedure due to the lack of decomposition in the graphite/NCA agglomerations. This was addressed through the use of a more intense mixing phase of 15 min at 1200 rpm with approximately 15%-vol of solids in the pulp, followed by a dilution to 5%-vol, and the flotation phase being set to 1000 rpm. Consequently, a C depletion to 19.23 wt.% could be achieved, which corresponds to the approximate stoichiometrically necessary content for a complete reduction of the NCA amount within the sample.
Analytical results revealed a Li-free and Ni-Cu-Cu-rich alloy as a result of the pyrometallurgical treatment. In addition, Li and Li-compounds (e.g., Li2CO3 and LiF) were detected within the samples in the off-gas stream. Finally, a detected Li-rich phase (Li content up to 65.5%) at the grain boundaries between the metal and the mineral phase clearly implicates the segregation and degassing of Li at high temperatures. However, compared with preliminary tests with the pure cathode material, it was also found that much smaller amounts of metal could be recovered, and the ratio shifted toward undesirable powder, containing lithium aluminum oxide.
To improve the lithium yield via the gas phase, minimization of the powder content is fundamental, which in turn leads to an increase in Li-free alloy. For this purpose, a limit determination of the interfering elements Cu, Al, and C was carried out. The resulting height-stratification diagram enabled a quick and easy evaluation of the usability of the black matter in the reactor, indicating poor meltability in this work. So, it can be stated that further improvements in the metallurgical stage are possible by adjusting the composition of the feedstock so that the advantages of the InduRed reactor concept can be fully utilized.
In summary, a promising future for interconnection methods concerning individual process steps for spent LIBs could be possible with the findings mentioned above, which provide great potential for further developments of holistically efficient recycling processes.
Author Contributions
Conceptualization, A.H. and J.Z.; methodology, A.H.; validation, A.H. and H.R.; investigation, A.H., J.Z., T.N. and W.Ö.; resources, A.H., H.R., J.Z. and W.Ö.; writing—original draft preparation, A.H., J.Z., C.G., T.N., L.W. and W.Ö.; writing—review and editing, A.H., J.Z., C.G., T.N., L.W., W.Ö. and H.R.; visualization, A.H.; supervision, A.H. and H.R.; project administration, A.H.; funding acquisition, A.H., H.R. and J.Z. All authors have read and agreed to the published version of the manuscript.
Funding
This paper is supported by the Zukunftsfonds Steiermark with funds from the province of Styria, Austria, grant number GZ: ABT08-189002/2020 PN:1305 and by the Hessen State Ministry for Higher Education, Research and the Arts through the Center for Dismantling and Recycling for Electromobility ZDR-EMIL®.
Data Availability Statement
The data presented in this study are available upon request from the corresponding author.
Acknowledgments
Great thanks are owed to the Chair of Process Technology and Environmental Protection at the Montanuniversitaet Leoben (in particular Simon Moll, Elias Vigl and Jan Eisbacher-Lubensky) for supporting the publication with SEM-EDX and LIBS analyses and competent advice on the evaluation of the results, as well as to Daniel Schrittwieser from the Chair of Design of Steels for preparation of the SEM samples. The authors also thank Daniel Horn, Fabian Brückner and Axel Fabian (all Fraunhofer IWKS) for their support during manual dismantling and EHF processing of battery cells.
Conflicts of Interest
The authors declare no conflict of interest. The funders had no role in the design of the study; in the collection, analyses, or interpretation of data; in the writing of the manuscript, or in the decision to publish the results.
Appendix A
The following tables and calculations shall explain Figure 1 of the introduction. The World Economic Forum (WEF) published in 2019 a report called “A Vision for a Sustainable Battery Value Chain in 2030” with data regarding the global installed battery capacity until 2030. Figure 1a with corresponding data in Table A1 shows an adapted version of this data.

Table A1.
Global battery demand by application in GWh for the year 2030, WEF base case [15].
Table A1.
Global battery demand by application in GWh for the year 2030, WEF base case [15].
| Year | 2018 | 2020 | 2025 | 2030 |
|---|---|---|---|---|
| Electric mobility | 142 | 229 | 808 | 2.333 |
| Energy storage | 0 | 10 | 105 | 221 |
| Consumer electronics | 38 | 43 | 58 | 69 |
To draw Figure 1b based on data licensed under a Creative Commons Attribution 4.0 International License (https://creativecommons.org/licenses/by/4.0/, accessed on 21 December 2022), the following assumptions have been made: as described by Zhao et al. [15], 33.7% of the overall battery market in 2019 consited of LIBs; until 2024, the growth in the total battery sector caused by LIBs will be 81.77%; and assuming that in 2018 the share of the overall battery market was more or less the same as it was in the beginning of 2019, the following data, as seen in Table A2, have been calculated.

Table A2.
Global LIB battery demand by application in GWh for the year 2030, WEF base case [14], including forecasts by Zhao et al. [15].
Table A2.
Global LIB battery demand by application in GWh for the year 2030, WEF base case [14], including forecasts by Zhao et al. [15].
| Year | 2018 | 2020 | 2025 | 2030 |
|---|---|---|---|---|
| Electric mobility | 47.9 | 119.0 | 592.4 | 1839.4 |
| Energy storage | 0.0 | 8.2 | 85.9 | 180.7 |
| Consumer electronics | 12.8 | 16.9 | 29.2 | 28.2 |
| SUM | 60.7 | 144.1 | 707.5 | 2058.3 |
These so-calculated sums were then multiplied by the percentages of cathode chemistries published by Xu et al. [16]. In Table A3 the data for Figure 1b can be seen.

Table A3.
Global LIB battery demand by cathode chemistry in GWh for the year 2030, WEF base case [14], including forecasts by Zhao et al. [15] and data from XU et al. [16].
Table A3.
Global LIB battery demand by cathode chemistry in GWh for the year 2030, WEF base case [14], including forecasts by Zhao et al. [15] and data from XU et al. [16].
| Year | LFP | NCA | NMC111 | NMC532 | NMC622 | NMC811 |
|---|---|---|---|---|---|---|
| 2018 | 14.0 | 7.6 | 10.9 | 18.0 | 9.2 | 1.0 |
| 2020 | 46.6 | 54.4 | 5.9 | 15.4 | 17.6 | 4.2 |
| 2025 | 13.4 | 319.1 | 27.6 | 41.7 | 181.1 | 124.5 |
| 2030 | 51.5 | 794.5 | 39.1 | 74.1 | 568.1 | 514.6 |
References
- Nurdiawati, A.; Urban, F. Towards Deep Decarbonisation of Energy-Intensive Industries: A Review of Current Status, Technologies and Policies. Energies 2021, 14, 2408. [Google Scholar] [CrossRef]
- Lamnatou, C.; Chemisana, D.; Cristofari, C. Smart grids and smart technologies in relation to photovoltaics, storage systems, buildings and the environment. Renew. Energy 2022, 185, 1376–1391. [Google Scholar] [CrossRef]
- Borenius, S.; Hämmäinen, H.; Lehtonen, M.; Ahokangas, P. Smart grid evolution and mobile communica-tions—Scenarios on the Finnish power grid. Electr. Power Syst. Res. 2021, 199, 107367. [Google Scholar] [CrossRef]
- Choi, D.; Shamim, N.; Crawford, A.; Huang, Q.; Vartanian, C.K.; Viswanathan, V.V.; Paiss, M.D.; Alam, M.J.E.; Reed, D.M.; Sprenkle, V.L. Li-ion battery technology for grid application. J. Power Sources 2021, 511, 230419. [Google Scholar] [CrossRef]
- Ma, S.; Lin, M.; Lin, T.E.; Lan, T.; Liao, X.; Maréchal, F.; Yang, Y.; Dong, C.; Wang, L. Fuel cell-battery hybrid systems for mobility and off-grid applications: A review. Renew. Sustain. Energy Rev. 2021, 135, 110119. [Google Scholar] [CrossRef]
- Nguyen, T.-V.; Schnidrig, J.; Maréchal, F. An analysis of the impacts of green mobility strategies and technologies on different European energy system. In Proceedings of the ECOS 2021, Taormina, Sicily, Italy, 28 June–2 July 2021. [Google Scholar]
- Onat, N.C.; Kucukvar, M. A systematic review on sustainability assessment of electric vehicles: Knowledge gaps and future perspectives. Environ. Impact Assess. Rev. 2022, 97, 106867. [Google Scholar] [CrossRef]
- Jacobson, M.Z. Review of solutions to global warming, air pollution, and energy security. Energy Environ. Sci. 2009, 2, 148–173. [Google Scholar] [CrossRef]
- Khan, S.A.R.; Ponce, P.; Yu, Z. Technological innovation and environmental taxes toward a carbon-free eco-nomy: An empirical study in the context of COP-21. J. Environ. Manag. 2021, 298, 113418. [Google Scholar] [CrossRef]
- Su, C.-W.; Naqvi, B.; Shao, X.-F.; Li, J.-P.; Jiao, Z. Trade and technological innovation: The catalysts for climate change and way forward for COP21. J. Environ. Manag. 2020, 269, 110774. [Google Scholar] [CrossRef]
- Rhodes, C.J. The 2015 Paris Climate Change Conference: COP21. Sci. Prog. 2016, 99, 97–104. [Google Scholar] [CrossRef]
- Teske, Achieving the Paris Climate Agreement Goals; Springer International Publishing: Cham, Switzerland, 2019.
- Teske, S.; Pregger, T.; Simon, S.; Naegler, T.; Pagenkopf, J.; Deniz, Ö.; van den Adel, B.; Dooley, K.; Meinshausen, M. It Is Still Possible to Achieve the Paris Climate Agreement: Regional, Sectoral, and Land-Use Pathways. Energies 2021, 14, 2103. [Google Scholar] [CrossRef]
- World Economic Forum and The Global Battery Alliance (Ed.) A Vision for a Sustainable Battery Value Chain in 2030: Unlocking the Full Potential to Power Sustainable Development and Climate Change Mitigation; WeForum: Cologny, Switzerland, 2019; p. 52. [Google Scholar]
- Zhao, Y.; Pohl, O.; Bhatt, A.I.; Collis, G.E.; Mahon, P.J.; Rüther, T.; Hollenkamp, A.F. A Review on Battery Market Trends, Second-Life Reuse, and Recycling. Sustain. Chem. 2021, 2, 167–205. [Google Scholar] [CrossRef]
- Xu, C.; Dai, Q.; Gaines, L.; Hu, M.; Tukker, A.; Steubing, B. Future material demand for automotive lithi-um-based batteries. Commun. Mater. 2020, 1, 99. [Google Scholar] [CrossRef]
- Wang, Y.; Goikolea, E.; de Larramendi, I.R.; Lanceros-Méndez, S.; Zhang, Q. Recycling methods for different cathode chemistries–A critical review. J. Energy Storage 2022, 56, 106053. [Google Scholar] [CrossRef]
- European Commission. Proposal for a Regulation of the European Parliament and of the Council concerning Batteries and Waste Batteries, Repealing Directive 2006/66/EC and Amending Regulation (EU) 2019/1020: SWD(2020) 334 Final. Available online: https://www.parlament.gv.at/PAKT/EU/XXVII/EU/04/37/EU_43776/imfname_11029480.pdf (accessed on 21 December 2020).
- Zhang, W.; Xu, C.; He, W.; Li, G.; Huang, J. A review on management of spent lithium ion batteries and stra-tegy for resource recycling of all components from them, Waste management & research: The journal of the In-ternational Solid Wastes and Public Cleansing Association. ISWA 2018, 36, 99–112. [Google Scholar] [CrossRef]
- Windisch-Kern, S.; Gerold, E.; Nigl, T.; Jandric, A.; Altendorfer, M.; Rutrecht, B.; Scherhaufer, S.; Raupenstrauch, H.; Pomberger, R.; Antrekowitsch, H.; et al. Recycling chains for lithi-um-ion batteries: A critical examination of current challenges, opportunities and process dependencies. Waste Manag. 2022, 138, 125–139. [Google Scholar] [CrossRef]
- Arnberger, A.; Coskun, E.; Rutrecht, B. Recycling von Lithium-Ionen-Batterien. In Recycling und Rohstoffe; Thiel, S., Thomé-Kozmiensky, E., Goldmann, D., Eds.; Thomé-Kozmiensky Verlag GmbH: Neuruppin, Germany, 2018; Band 11. [Google Scholar]
- Vanderbruggen, A.; Salces, A.; Ferreira, A.; Rudolph, M.; Serna-Guerrero, R. Improving Separation Efficiency in End-of-Life Lithium-Ion Batteries Flotation Using Attrition Pre-Treatment. Minerals 2022, 12, 72. [Google Scholar] [CrossRef]
- Herdegen, J.; Benner, W.; Bokelmann, K.; Hartfeil, T.; Gellermann, C. Separationsverfahren zur Aufarbeitung von metallhaltigen Verbundwerkstoffen. In Recycling und Rohstoffe; Thomé-Kozmiensky, K.J., Goldmann, D., Eds.; TK Verlag Karl Thomé-Kozmiensky: Neuruppin, Germany, 2016; Band 9; pp. 601–608. [Google Scholar]
- Bokelmann, K.; Grieger, S.; Schlummer, M.; Benner, W.; Vogelgesang, M. DISPLAY Upscaling of Material Recovery from Display Applications and Printed Circuit Boards. In Olaf Holm; Thomé-Kozmiensky, E., Goldmann, D., Bernd Friedrich, B., Eds.; Recycling und Rohstoffe; Thomé-Kozmiensky Verlag GmbH: Neuruppin, Germany, 2020; pp. 380–392. [Google Scholar]
- Öhl, J.; Horn, D.; Zimmermann, J.; Stauber, R.; Gutfleisch, O. Efficient Process for Li-Ion Battery Recycling via Electrohydraulic Fragmentation. MSF 2019, 959, 74–78. [Google Scholar] [CrossRef]
- Horn, D.; Zimmermann, J.; Gassmann, A.; Stauber, R.; Gutfleisch, O. Battery Recycling: Focus on Li-ion Batteries. In Modern Battery Engineering. A Comprehensive Introduction; Birke, P., Ed.; World Scientific: Hackensack, NJ, USA; London, UK; Singapore; Beijing, China; Shanghai, China; Hong Kong, China; Taipei, China; Chennai, India; Tokyo, Japan, 2019; 223p. [Google Scholar]
- Makuza, B.; Tian, Q.; Guo, X.; Chattopadhyay, K.; Yu, D. Pyrometallurgical options for recycling spent li-thium-ion batteries: A comprehensive review. J. Power Sources 2021, 491, 229622. [Google Scholar] [CrossRef]
- Velázquez-Martínez, O.; Valio, J.; Santasalo-Aarnio, A.; Reuter, M.; Serna-Guerrero, R. A Critical Review of Lithium-Ion Bat-tery Recycling Processes from a Circular Economy Perspective. Batteries 2019, 5, 68. [Google Scholar] [CrossRef]
- Porvali, A.; Aaltonen, M.; Ojanen, S.; Velazquez-Martinez, O.; Eronen, E.; Liu, F.; Wilson, B.P.; Serna-Guerrero, R.; Lundström, M. Mechanical and hydrome-tallurgical processes in HCl media for the recycling of valuable metals from Li-ion battery waste. Resour. Conserv. Recycl. 2019, 142, 257–266. [Google Scholar] [CrossRef]
- Holzer, A.; Baldauf, M.; Wiszniewski, L.; Windisch-Kern, S.; Raupenstrauch, H. Influence of Impurities on the High-Temperature Behavior of the Lithium-Ion Battery Cathode Material NMC Under Reducing Conditions for Use in the InduRed Reactor Concept. Detritus 2022, in press. [Google Scholar] [CrossRef]
- Feng, D.; Aldrich, C. Effect of particle size on flotation performance of complex sulphide ores. Miner. Eng. 1999, 12, 721–731. [Google Scholar] [CrossRef]
- Derhy, M.; Taha, Y.; Hakkou, R.; Benzaazoua, M. Review of the Main Factors Affecting the Flotation of Phosphate Ores. Minerals 2020, 10, 1109. [Google Scholar] [CrossRef]
- Zhan, R.; Yang, Z.; Bloom, I.; Pan, L. Significance of a Solid Electrolyte Interphase on Separation of Anode and Cathode Materials from Spent Li-Ion Batteries by Froth Flotation. ACS Sustain. Chem. Eng. 2021, 9, 531–540. [Google Scholar] [CrossRef]
- Zhang, G.; He, Y.; Wang, H.; Feng, Y.; Xie, W.; Zhu, X. Application of mechanical crushing combined with pyrolysis-enhanced flotation technology to recover graphite and LiCoO2 from spent lithium-ion batteries. J. Clean. Prod. 2019, 231, 1418–1427. [Google Scholar] [CrossRef]
- Yu, J.; He, Y.; Ge, Z.; Li, H.; Xie, W.; Wang, S. A promising physical method for recovery of LiCoO 2 and graphite from spent lithium-ion batteries: Grinding flotation. Sep. Purif. Technol. 2018, 190, 45–52. [Google Scholar] [CrossRef]
- Liu, J.; Wang, H.; Hu, T.; Bai, X.; Wang, S.; Xie, W.; Hao, J.; He, Y. Recovery of LiCoO2 and graphite from spent lithium-ion batteries by cryogenic grinding and froth flotation. Minerals Engineering 2020, 148, 106223. [Google Scholar] [CrossRef]
- Gaines, L. Lithium-ion battery recycling processes: Research towards a sustainable course. Sustain. Mater. Technol. 2018, 17, e00068. [Google Scholar] [CrossRef]
- Holzer, A.; Wiszniewski, L.; Windisch-Kern, S.; Raupenstrauch, H. Optimization of a Pyrometallurgical Pro-cess to Efficiently Recover Valuable Metals from Commercially Used Lithium-Ion Battery Cathode Materials LCO, NCA, NMC622, and LFP. Metals 2022, 12, 1642. [Google Scholar] [CrossRef]
- Fercher, A. Grenzwertbestimmung und Analyse von Kupfer-, Aluminium-und Kohlenstoffzuschlägen zu dem Kathodenmaterial NCA aus Lithium-Ionen-Batterien. Bachelor’s Thesis, Montanuniversitaet Leoben, Leoben, Austria, 2022. [Google Scholar]
- Baldauf, M. Grenzwertbestimmung und Analyse von Aluminium-und Kohlenstoffzuschlägen zu Kathodenma-terialien aus Lithium-Ionen Batterien für die Wertmetallrückgewinnung im pyrometallurgischen Reaktorkonzept InduRed. Master’s Thesis, Montanuniversitaet Leoben, Leoben, Austria, 2022. [Google Scholar]
- Biswas, Principles of Blast Furnace Ironmaking; Cootha Publishing House: Brisbane, Australia, 1981.
Disclaimer/Publisher’s Note: The statements, opinions and data contained in all publications are solely those of the individual author(s) and contributor(s) and not of MDPI and/or the editor(s). MDPI and/or the editor(s) disclaim responsibility for any injury to people or property resulting from any ideas, methods, instructions or products referred to in the content. |
© 2022 by the authors. Licensee MDPI, Basel, Switzerland. This article is an open access article distributed under the terms and conditions of the Creative Commons Attribution (CC BY) license (https://creativecommons.org/licenses/by/4.0/).