Abstract
Finding effective cathode materials is currently one of the key barriers to the development of magnesium batteries, which offer enticing prospects of larger capacities alongside improved safety relative to Li-ion batteries. Here, we report the hydrothermal synthesis of several types of WS2 nanostructures and their performance as magnesium battery cathodes. The morphology of WS2 materials was controlled through the use of sodium oxalate as a complexing agent and different templating agents, including polyethylene glycol (PEG), polyvinylpyrrolidone (PVP), and hexadecyltrimethyl ammonium bromide (CTAB). A high capacity of 142.7 mAh/g was achieved after 100 cycles at a high current density of 500 mA/g for cathodes based on a nanostructured flower-like WS2. A solution consisting of magnesium (II) bis(trifluoromethanesulfonyl)imide (MgTFSI2) and magnesium (II) chloride (MgCl2) in dimethoxyethane (DME) was used as an effective electrolyte, which contributes to favorable Mg2+ mobility. Weaker ionic bonds and van der Waals forces of WS2 compared with other transition metal oxides/sulfides lay the foundation for fast discharge/charge rate. The enhanced surface area of the nanostructured materials plays a key role in enhancing both the capacity and discharge/charge rate.
1. Introduction
Lithium-ion batteries have emerged as the most prominent electrochemical energy storage systems over the past two decades, and much progress has been achieved in the design of lithium-ion battery materials and systems [1,2,3,4]. In recent years, magnesium–ion batteries have been the subject of intensive research towards so-called post lithium batteries, particularly for applications in electric vehicles [5]. In contrast to lithium, which sources are of limited geological availability, magnesium has a high abundance in Earth’s crust (approximately 1.5 wt%). When compared with lithium-ion batteries, magnesium-ion systems possess numerous advantages, including a high theoretical volumetric energy density of 3833 mAh/mL (vs. 2046 mAh/mL for Li-metal anode) and a high gravimetric capacity of 2205 mAh/g, alongside a lower tendency for anodic dendrite formation, which alleviates one of the key safety concerns associated with Li-ion batteries [6]. Additionally, compared with other anode candidates, metallic magnesium has a strongly negative reduction potential of −2.3 V versus a standard hydrogen electrode [7]. Despite these advantages, there remain significant obstacles to the future implementation of magnesium-based batteries [8]. The first challenge is that the solvent of traditional electrolytes used in lithium-ion batteries tends to react with magnesium anodes to form a dense passivating layer, blocking both electron and cation transport, thus limiting potential cathode/electrolyte material combinations. Further hurdles lie in low ion mobility and poor performance of existing cathode candidates. Metal oxides, including V2O5 and TiO2, have commonly been adopted as experimental cathodes in magnesium batteries as these materials are expected to exhibit high energy capacity and stability [9]. However, divalent magnesium ions experience significant electrostatic barriers at interfaces in such metal oxide cathodes, leading to sluggish solid-state diffusion of magnesium ions and slow interfacial charge transfer [10]. Ion mobility is further impeded in some commonly used electrolytes such as tetrahydrofuran (THF) solution of organomagnesium chloroaluminate complex Mg(AlCl2BuEt)2, where Bu and Et are butyl and ethyl groups, respectively, (denoted as DCC) and THF/phenylmagnesiumchloride (PhMgCl)/AlCl3 (all phenyl complex electrolyte, denoted as APC) that consist of large molecules [5,11]. In order to increase electrochemical performance in battery tests, various alternative cathode materials have been investigated in the past several years, notably metal sulfides. Chevrel phase Mo6S8 was the first identified cathode material for magnesium batteries that exhibited relatively good reversibility, charging kinetics, and life-span [12]. However, this cathode material and its analogs bring about rather low operating voltages and energy densities [13]. Relative to oxides, transition metal (TM) chalcogenides, such as TiS2, MoS2, and TiSe2, offer the scope for improved cathode performance due to their electrostatic interactions with Mg2+ ions [8,9,10]. For TM chalcogenides, metals and sulfur atoms firstly bond covalently to form the two-dimensional S-TM-S tri-layers, which leads to a sandwich structure through weak van der Waals forces between layers. This structure allows the production of nanostructured materials such as nanosheets, nanotubes, and fullerene-like nanoparticles, which provide space for ion intercalation, thus enabling faster kinetics and better cycling and rate performance. Recently, promising results have been reported for cathodes based on TM chalcogenides [14,15,16,17,18,19,20,21,22]. Compared with transition metal oxides, they exhibit relatively good compatibility with electrolytes and have shown higher operating voltage, energy density, and stability compared with Chevrel phases [5,10]. In the presently reported study, novel nano WS2 cathodes with different morphologies are investigated as cathodes in Mg-ion batteries [23]. Tungsten disulfide was chosen for this work because both ionic bonds and van der Waals forces in WS2 are weaker in comparison with other TM chalcogenides, which should enhance ion mobility, with implications for performance as magnesium battery cathodes [24]. Moreover, due to weaker bonding forces, WS2 can readily be produced with various nanostructured morphologies [25]. WS2 is considered a desirable intercalation host material for magnesium batteries as guest ions are expected to intercalate in the lattice host reversibly and diffuse quickly through its looser stacked layers [26]. Here, we target the fabrication of magnesium batteries based on WS2 cathodes with high ion mobility and good capacity/reversibility. Sodium oxalate, Na2C2O4, is used as a complexing agent, and different organic templates are added to modify the morphology of the obtained WS2 nanostructures. We further compared two electrolyte candidates based on dimethoxyethane (DME)/magnesium (II) bis(trifluoromethanesulfonyl)imide (MgTFSI2)/magnesium (II) chloride (MgCl2) (referred to here as DMM) and APC electrolyte for use with the investigated cathode materials. APC electrolyte is a commonly used magnesium battery electrolyte, while DME is a better ethereal solvent than the THF used in APC owing to faster ion mobility and reduced toxicity [5,11]. MgCl2 was used to stabilize the DMM electrolyte and dissolve the passivation film formed during battery cycling [11]. Compared with more commonly used Mg battery electrolytes, such as APC, this electrolyte provides a broader electrochemical window, reduced corrosion of current collectors due to a lower MgCl2 content, higher Mg ion mobility, and better reversibility and cycling performance [5].
We report here an experimental study conducted to examine whether WS2 serves to impart favorable battery performance in terms of ion mobility and examine the role of different cathode morphology and electrolyte compositions (APC and DMM) on overall electrochemical performance. We produced nanostructured WS2 with different morphologies by means of a hydrothermal method and applied these materials as cathodes in magnesium-ion batteries. The morphologies were formed by adding Na2C2O4 as a complexing agent and polyethylene glycol (PEG), polyvinylpyrrolidone (PVP), or hexadecyltrimethyl ammonium bromide (CTAB) as templates. APC and DMM electrolytes were adopted as electrolytes in this research. WS2 samples were named as follows: WS2-bulk (without the use of additives), WS2-OX (with sodium oxalate complexing agent), WS2-OX-PEG (sodium oxalate and PEG), WS2-OX-PVP (sodium oxalate and PVP), and WS2-OX-CTAB (sodium oxalate and CTAB), respectively.
2. Materials and Methods
Reagents and materials: All reagents were purchased from Sigma-Aldrich with a purity of >99.9%. Nickel (99.9%) and magnesium (99.9%) foil were acquired from Goodfellow. MgTFSI2, MgCl2, and AlCl3 were dried under vacuum at 120 °C prior to synthesis.
Hydrothermal synthesis of WS2 powders: In a typical synthesis, 1.50 g sodium tungstate dihydrate, Na2WO4∙2H2O, 1.50 g thioacetamide. C2H5NS and 2.00 g of sodium oxalate, Na2C2O4 were dissolved in 25 mL deionized water by vigorous stirring for 5 min. Subsequently, 0.50 g quantities of PEG, PVP, and CTAB were added as organic templating surfactants to the solution under vigorous stirring with continued ultrasonication for 10 min. The obtained clear solution was adjusted to pH 1 by HCl, sealed in a 50 mL stainless steel autoclave (Teflon-lined), and kept heating at 220 °C for 20 h. The autoclave was opened after cooling to room temperature, and the dark grey precipitate was collected and purified by repeated centrifugation with ethanol and water. The product was vacuum dried at 80 °C overnight and annealed at 950 °C in an argon atmosphere overnight.
Preparation of electrolyte: The APC electrolyte solution was synthesized in a glove box under argon following the procedure described in reference [11]. First, 1.34 g AlCl3 was added slowly to 15 mL THF solvent under vigorous stirring to obtain the targeted concentration. Subsequently, the acquired solution was dropwise added to a 10 mL PhMgCl/THF solution (2 M PhMgCl), followed by stirring for 16 h at room temperature. The process of electrolyte preparation is exothermic.
MgTFSI2 is the only ether-soluble magnesium salt and was therefore selected for this work. The practicality of MgTFSI2 solution as a viable electrolyte for Mg batteries is hindered by the poor electrochemical performance of Mg anodes in MgTFSI2 solutions. MgTFSI2/DME solutions, on the other hand, have been shown to dissolve a large amount of MgCl2 and produce electrolyte solutions with good performance. The DMM electrolyte was prepared in a glove box following the process detailed in reference [27]. In this synthesis, 1.46 g MgTFSI2 and 0.12 g anhydrous MgCl2 were added to 10 mL DME followed by stirring for 6 h at 70 °C and filtering.
Before battery testing, the electrolyte was processed by galvanostatic conditioning (CHI600E Potentiostat, CH Instruments Inc., Shanghai, China), involving a repeated passage of constant current while following the over-potential of the cathodic process (Mg deposition). In the initial stage, a high over-potential for deposition of 0.8 V for the first few cycles was exhibited in fresh MgTFSI2/MgCl2 solution. During cycling, the over-potential of Mg deposition stabilized at a low value of less than 0.2 V after decreasing from cycle to cycle, indicating an optimal composition was reached for the solution. The behavior of the DME/MgTSFI2/MgCl2 solutions used as the DMM electrolyte is reflected by cyclic voltammetry (CV) data, which reveals a wide electrochemical window of >3.1 V, over 99% Mg deposition/dissolution efficiency, and a low Mg deposition over-potential of less than 0.2 V.
Characterization: X-ray diffraction (XRD) patterns were collected from specimen powders in a Bruker AXS D8 ADVANCE X-ray diffractometer (Bruker, Billerica, MA, USA) with Co Kα radiation (λ = 0.1789 nm). The measurements were conducted between 10° and 90° 2θ value (step size-0.02; 8 s per step).
A scanning electron microscopy (SEM, LEO 1530, Zeiss, Jena, Germany) was used to analyze the microstructure of synthesized powders. The samples were prepared by putting a small amount of powder on the adhesive carbon tape. An accelerating voltage of 5 kV was used for collecting images.
X-ray photoelectron spectroscopy (XPS) measurements were conducted on an ESCALAB 250Xi instrument (Thermo Fisher Scientific, Waltham, MA, USA). The X-ray spot size was 100 μm. Powders were sprinkled on the carbon conductive tape in the glove box for the preparation of samples. The C 1s core line with a binding energy of 284.8 eV was used for calibration of all XPS spectra. The data were processed by using XPS Peak41 software. The Lorentzian–Gaussian ratios in peak fitting have been constrained between 20 and 30. Shirley backgrounds were used in all fittings.
A QuadraSorb Station 4 instrument (Quantachrome, Boynton Beach, FL, USA) was used for the nitrogen sorption tests in this research. After degassing under a vacuum at 150 °C for 12 h, we recorded isotherms at 77 K before the measurement. Brunauer–Emmett–Teller (BET) calculations were used for the calculation of the surface area. The Quantachrome/QuadraWin software version 5.05 was used to analyze all nitrogen sorption data.
Preparation of coin cells: All the following procedures were conducted in a glove box under an inert atmosphere with H2O and O2 less than 0.1 ppm. Coin cell cases (CR2032 type), spacers, springs, and o-rings produced by Mitsubishi® were used. A slurry of 75 wt.% active material, 10 wt.% Super-P carbon back and 15 wt.% polyvinylidene fluoride dispersed in N-methyl-2-pyrrolidone (NMP) were prepared by wet grinding for 1 h. For the working electrode (cathode) fabrication, this slurry was then tape-cast on nickel foil and dried, first in the air at 50 °C and then under vacuum at 100 °C. The resulting mass loading of the active cathode material was 1.2 mg/cm2. The coated working electrodes were then pressed at a pressure of 80–120 kg/cm2 and were cut into circular forms of 16 mm in diameter. Magnesium foil, having the same diameter with a thickness of 0.25 mm, was adopted as the anode material. Whatman® glass fiber filter paper (GF/A) was adopted as a separator.
Coin cell testing: Battery testing was conducted using a CT2001A battery tester system (Wuhan LAND, Wuhan, China). Galvanostatic discharge–charge measurements were conducted in the potential range of 0.05–2 V versus Mg2+/Mg at 500 mA/g. Data points were collected every 3 s. Cyclic voltammetry (CV) was carried out on a CHI660B electrochemical workstation with a 1 mV/s scanning rate in the potential window of 0–2 V. WS2-OX-PVP and DMM are used as cathode and electrolyte in the CV measurement. Pulsed discharge/charge tests and electrochemical impedance spectroscopy (EIS) measurements were conducted on coin cells with the selected WS2-bulk and WS2-OX-PVP electrodes with DMM electrolyte and WS2-OX-PVP electrodes with APC electrolyte. A Zahner Im6ex workstation (Zahner, Kronach, Germany) was used for the measurement conduction in potentiostatic mode with 5 mV amplitude between 50 mHz and 1 MHz. The tested cell was firstly discharged to 5 mV and then charged to 2.0 V at 75 mA/g. The tested cells were discharged and charged with pausing intervals at certain cell potentials (0.3, 0.6, 1.0, and 2.0 V) and were rested for two hours prior to EIS measurement.
3. Results and Discussion
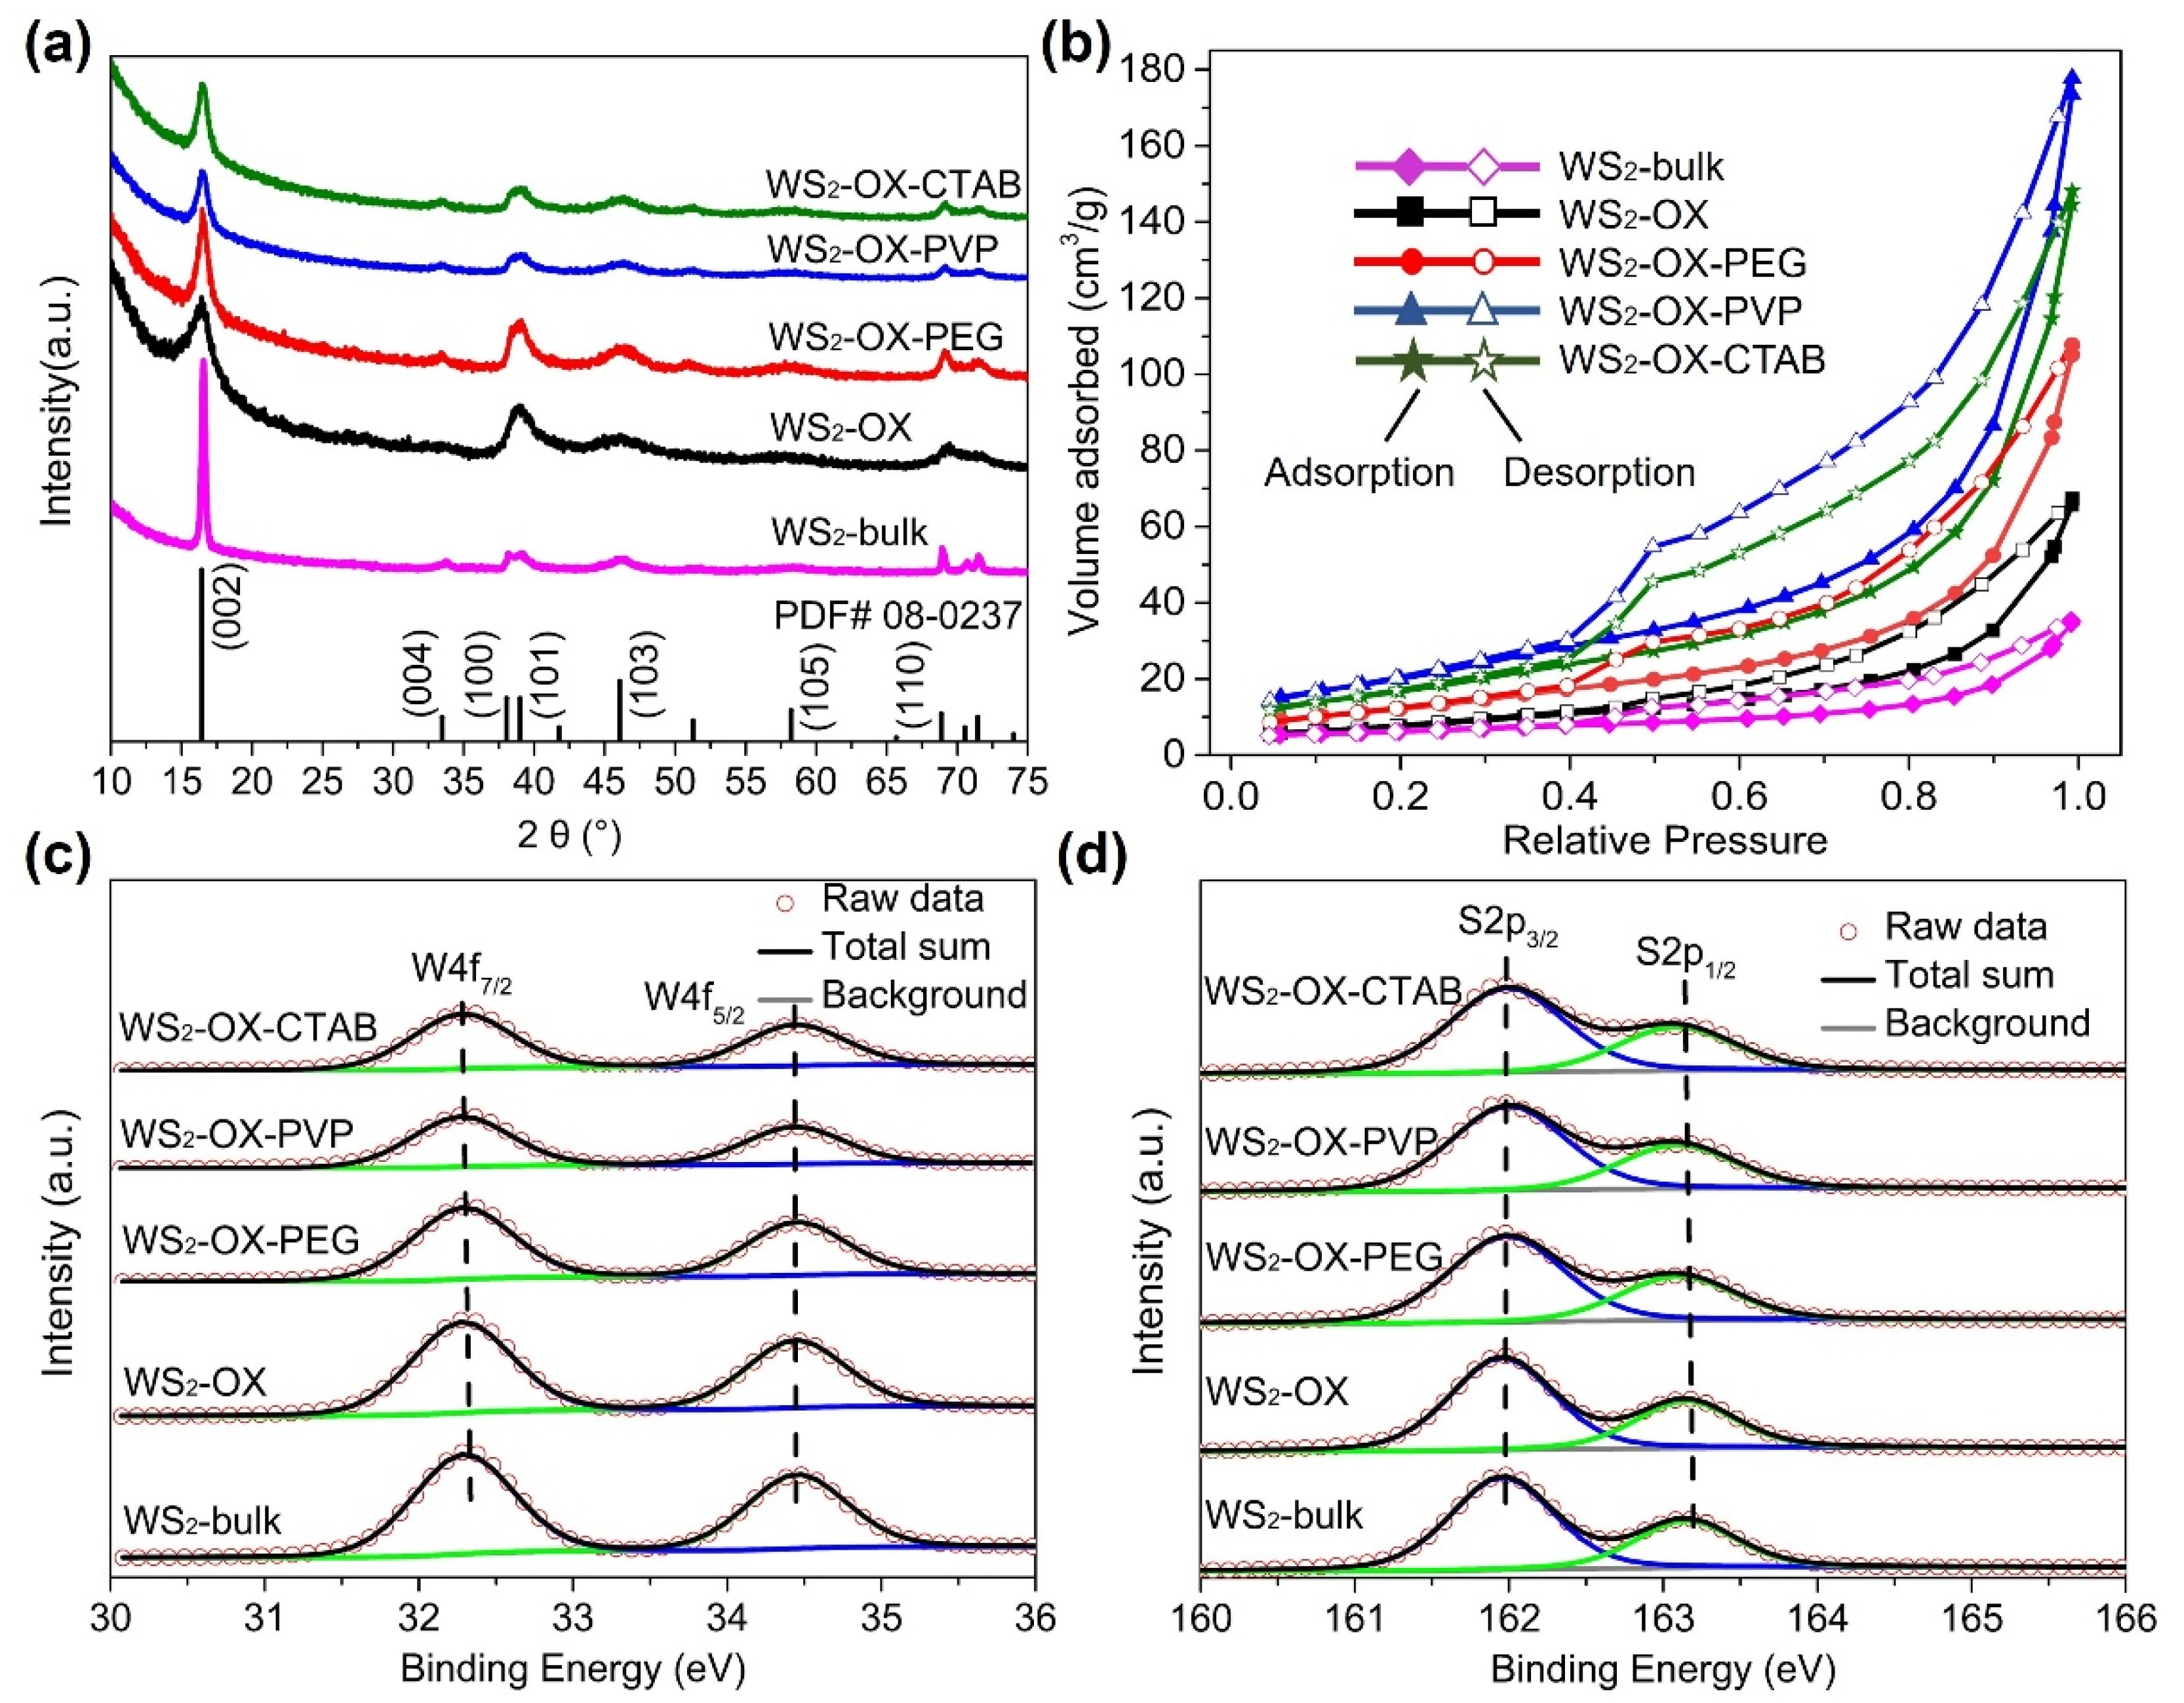
XRD patterns of synthesized WS2 materials (Figure 1a) are well matched with the calculated reference pattern of the reported structure of WS2 (JCPDS No. 08-0237) [28,29,30,31], indicating that the obtained products crystallize in a hexagonal crystal structure with space group P63/mmc (No. 194). No diffraction peaks of any impurity phases were observed in the XRD patterns, and all peaks are well defined, indicative of a well-crystallized single phase after heat treatment. Anisotropic broadening in XRD reflections was observed to varying extents in XRD patterns of all samples, suggesting an anisotropic crystallite size in the synthesized WS2 phase. This anisotropic crystal growth is consistent with the formation of 2D-like structures of WS2, in which the (002) reflection indicates the number of stacked WS2 layers along the c-axis. Similar to graphite, the average number Nc of WS2 stacking layers can be estimated from interplanar spacing d002 and crystallite size along the c-axis (Lc) [32,33]. To gain further insights into lattice parameters, crystallite size, and width of stacking layer in the samples, a Le Bail whole-profile fitting method [34] was applied to diffraction patterns using FULLPROF software [35] with the profile function 7 (Thompson–Cox–Hastings pseudo-Voigt convoluted with axial divergence asymmetry function) [36]. The resolution function of the diffractometers was obtained from the structure refinement of a LaB6 standard. Figure 1a and Figure S1 show the observed, calculated, and difference for the final cycle of the profile fitting of the whole XRD pattern for WS2-bulk. As shown in Figure S1, the XRD pattern fitting using a sphere model with isotropic peak broadening for all XRD reflections in initial refinement attempts yielded poor fitting (convergence factors Rwp = 18.5% and X2 = 9.3). In contrast, the use of an anisotropic broadening model (IsizeModel = 6, in which the broadening is considered only for reflections of the form: (h0l)) for crystallite size resulted in better fitting with good convergence factors Rwp = 9.3% and X2 = 2.1 (Figure S1). Similarly, the XRD patterns of other samples are better fitted with the anisotropic size broadening model rather than the isotropic model. These results confirm the formation of 2D WS2 materials in all samples. The lattice parameter, unit cell volume, interplanar spacing d002, crystallite size, and the average number Nc of WS2 stacking layers determined from XRD analysis are listed in Table S1. As shown in Table S1, all samples show very close values of lattice parameters, which are in good agreement with previously reported values [28,29,30,31]. These results confirm the formation of stoichiometric pristine WS2 containing tetravalent W4+ cations under the present experimental conditions. The XRD pattern of WS2-bulk shows the sharpest (002) reflections because it has the largest crystallite size and the highest number of stacking layers along the c direction. In contrast, the WS2-OX sample has the smallest Lc and lowest Nc; thus, it exhibits the broadest (002) reflections.
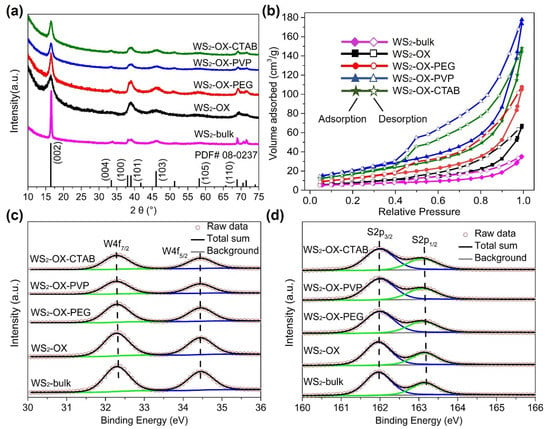
Figure 1.
(a) XRD patterns of WS2-bulk, WS2-OX, WS2-OX-PEG, WS2-OX-PVP, and WS2-OX-CTAB. The calculated pattern of WS2 reference (JCPDS No. 08-0237) is shown at the bottom. (b) Nitrogen sorption isotherms BET of WS2-bulk, WS2-OX, WS2-OX-PEG, WS2-OX-PVP, and WS2-OX-CTAB. (c,d) High-resolution X-ray photoelectron spectra of W4f and S2p for WS2-bulk, WS2-OX, WS2-OX-PEG, WS2-OX-PVP, and WS2-OX-CTAB.
In Figure 1b, BET analysis of the different WS2 materials reveals curves exhibiting reversible type IV isotherms, which is one of the main characteristics of mesoporous materials. Based on the measured absorbed volume of each sample, WS2 materials with ordered nanostructures (WS2-OX-PEG, WS2-OX-PVP, and WS2-OX-CTAB) have larger specific surface areas than that with disordered structure. WS2 with nanoflower-sphere-morphologies (WS2-OX-PVP and WS2-OX-CTAB) show the largest specific surface area of 80 and 70 m2/g, respectively, while randomly stacked WS2 nanosheets in the WS2-OX sample present a lower specific surface area of 28 m2/g and the WS2-bulk sample possesses the lowest specific surface area of 10 m2/g. WS2 with nanorods morphology (WS2-OX-PEG) also shows an average surface of 57 m2/g. Usually, cathode materials with a high surface area are expected to provide more magnesium ion intercalation spots, in particular when the exposed plane and the kinetically probable diffusion axes are matching [9,11].
Figure 1c,d displays XPS of WS2 materials. The W 4f spectra of all samples are composed of a doublet peak at around 32.3 and 34.4 eV, corresponding to 4f7/2 and 4f5/2 transitions, respectively, implying the presence of W4+ ions in all samples. Similarly, the S2p spectra can be deconvoluted into a doublet at 163.2 and 161.9 eV, corresponding to the 2p1/2 and 2p3/2 transition. These values are in good agreement with previous reports for 2H-WS2 [37] that report 32.3/34.4 eV for W4f7/2 and W4f5/2 and 161.9/163.2 eV for S2p1/2 and S2p3/2, respectively. No shift in the binding energy is observed for any samples. In addition, the fitting of the W and S spectra revealed that the surface elemental composition was found to be 65.9 at% to 33.6 at% of W and S, respectively, in all samples, confirming the formation of stoichiometric WS2 containing tetravalent W4+ cations in all samples [38]. The XPS fitting results and parameters are summarized in Table S2.
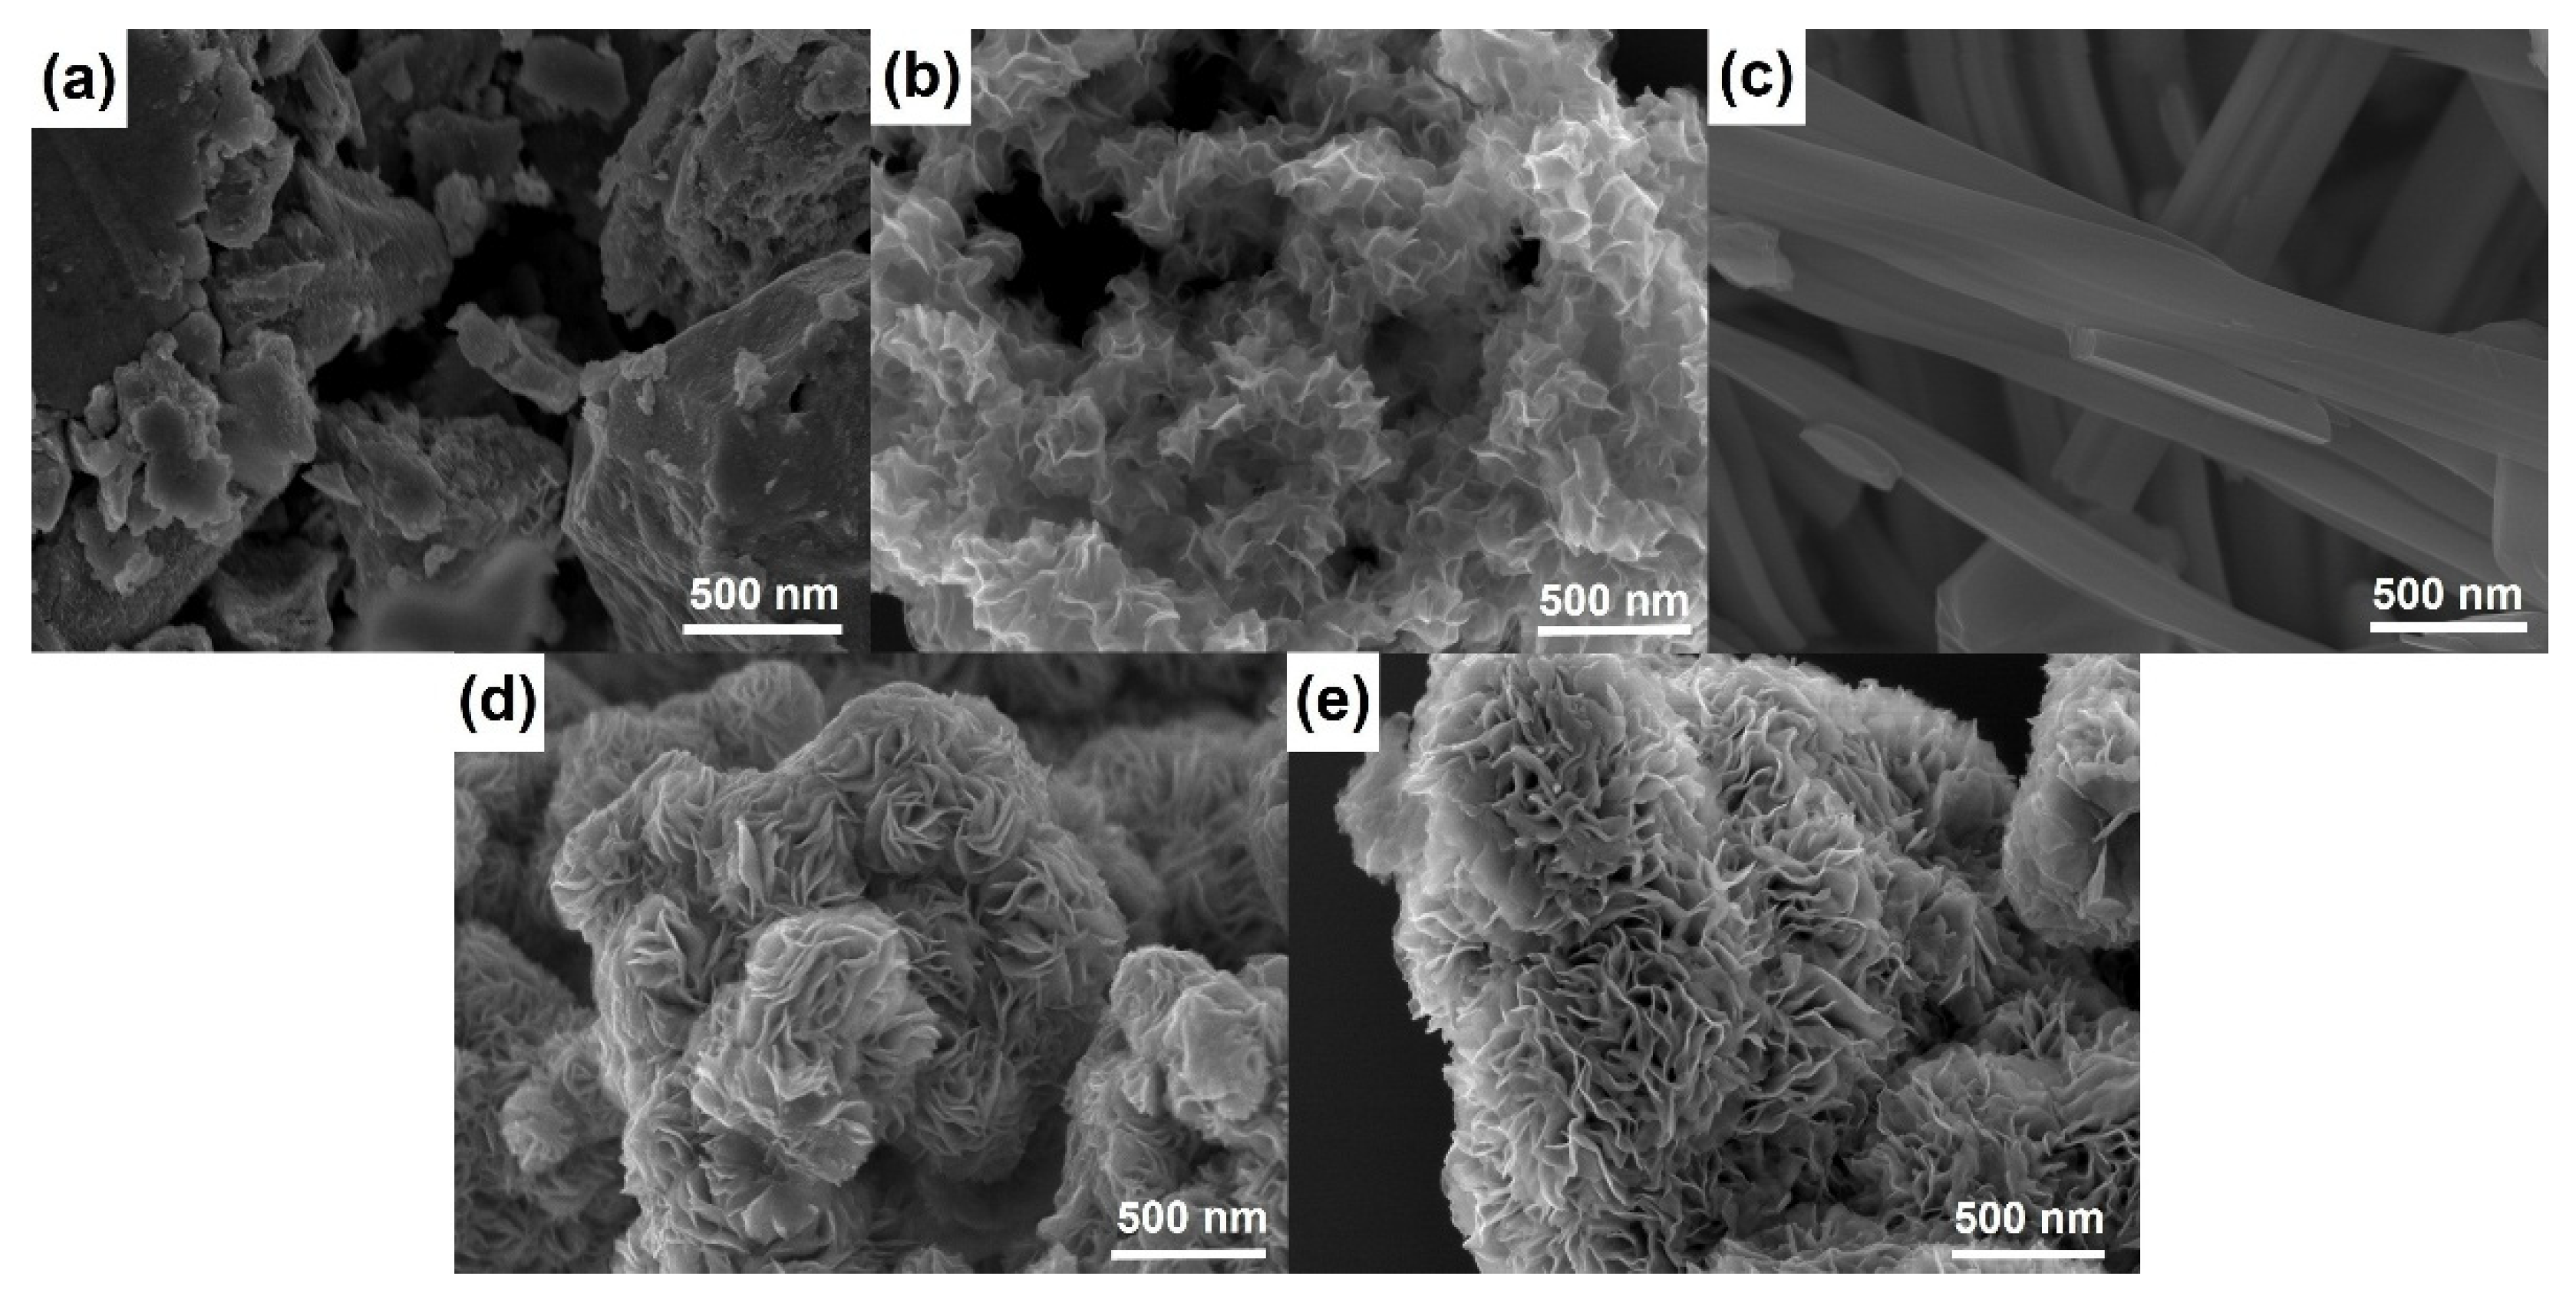
Figure 2 shows SEM micrographs of materials prepared using different templating agents. WS2-bulk clearly presents a well-ordered stacked microstructure, while the SEM image of WS2-OX reveals a disordered morphology of randomly stacked nanosheets. The comparison of the two figures (Figure 2a,b) can serve to interpret the difference shown by XRD patterns of WS2-bulk and WS2-OX (Figure 1a and Figure S1). Figure 2c–e present SEM images of WS2-OX-PEG, WS2-OX-PVP, and WS2-OX-CTAB, respectively. It can be seen that WS2-OX-PEG, WS2-OX-PVP, and WS2-OX-CTAB, respectively, present morphologies of nanorods, nanoflower-spheres, and nanoflower-aggregates. For WS2-OX-PEG, the diameter of nanorods ranges from 100 nm to 200 nm, and the length is several micrometers. WS2-OX-PVP and WS2-OX-CTAB both exhibit flower-like forms consisting of numerous nanosheets with a thickness of several nanometers. The morphologies of WS2-OX-PVP and WS2-OX-CTAB differ in that the nanoflowers of WS2-OX-PVP are present in the form of numerous submicron spheres while those of WS2-OX-CTAB combine to form larger continuous nanoflower-aggregates. Additionally, the nanosheets formed in WS2-OX-PVP are thinner and more uniform than those of WS2-OX-CTAB. The morphology comparison results of WS2-OX, WS2-OX-PEG, WS2-OX-PVP, and WS2-OX-CTAB are consistent with the XRD analysis results above.
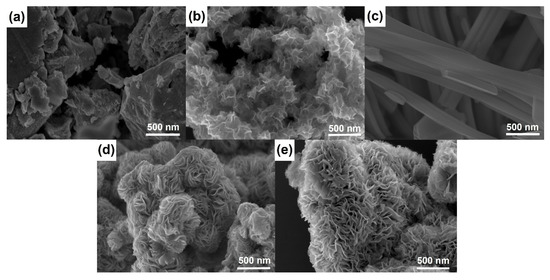
Figure 2.
SEM images of WS2-bulk (a), WS2-OX (b), WS2-OX-PEG (c), WS2-OX-PVP (d), and WS2-OX-CTAB (e) showing the different morphologies of WS2 in the samples after heat treatment.
The morphology of the electrode materials can influence the specific surface area and the available void space between the neighboring nanosheets, which is beneficial to the great improvement of electrochemical performance. To examine this conjecture, electrochemical tests were conducted.
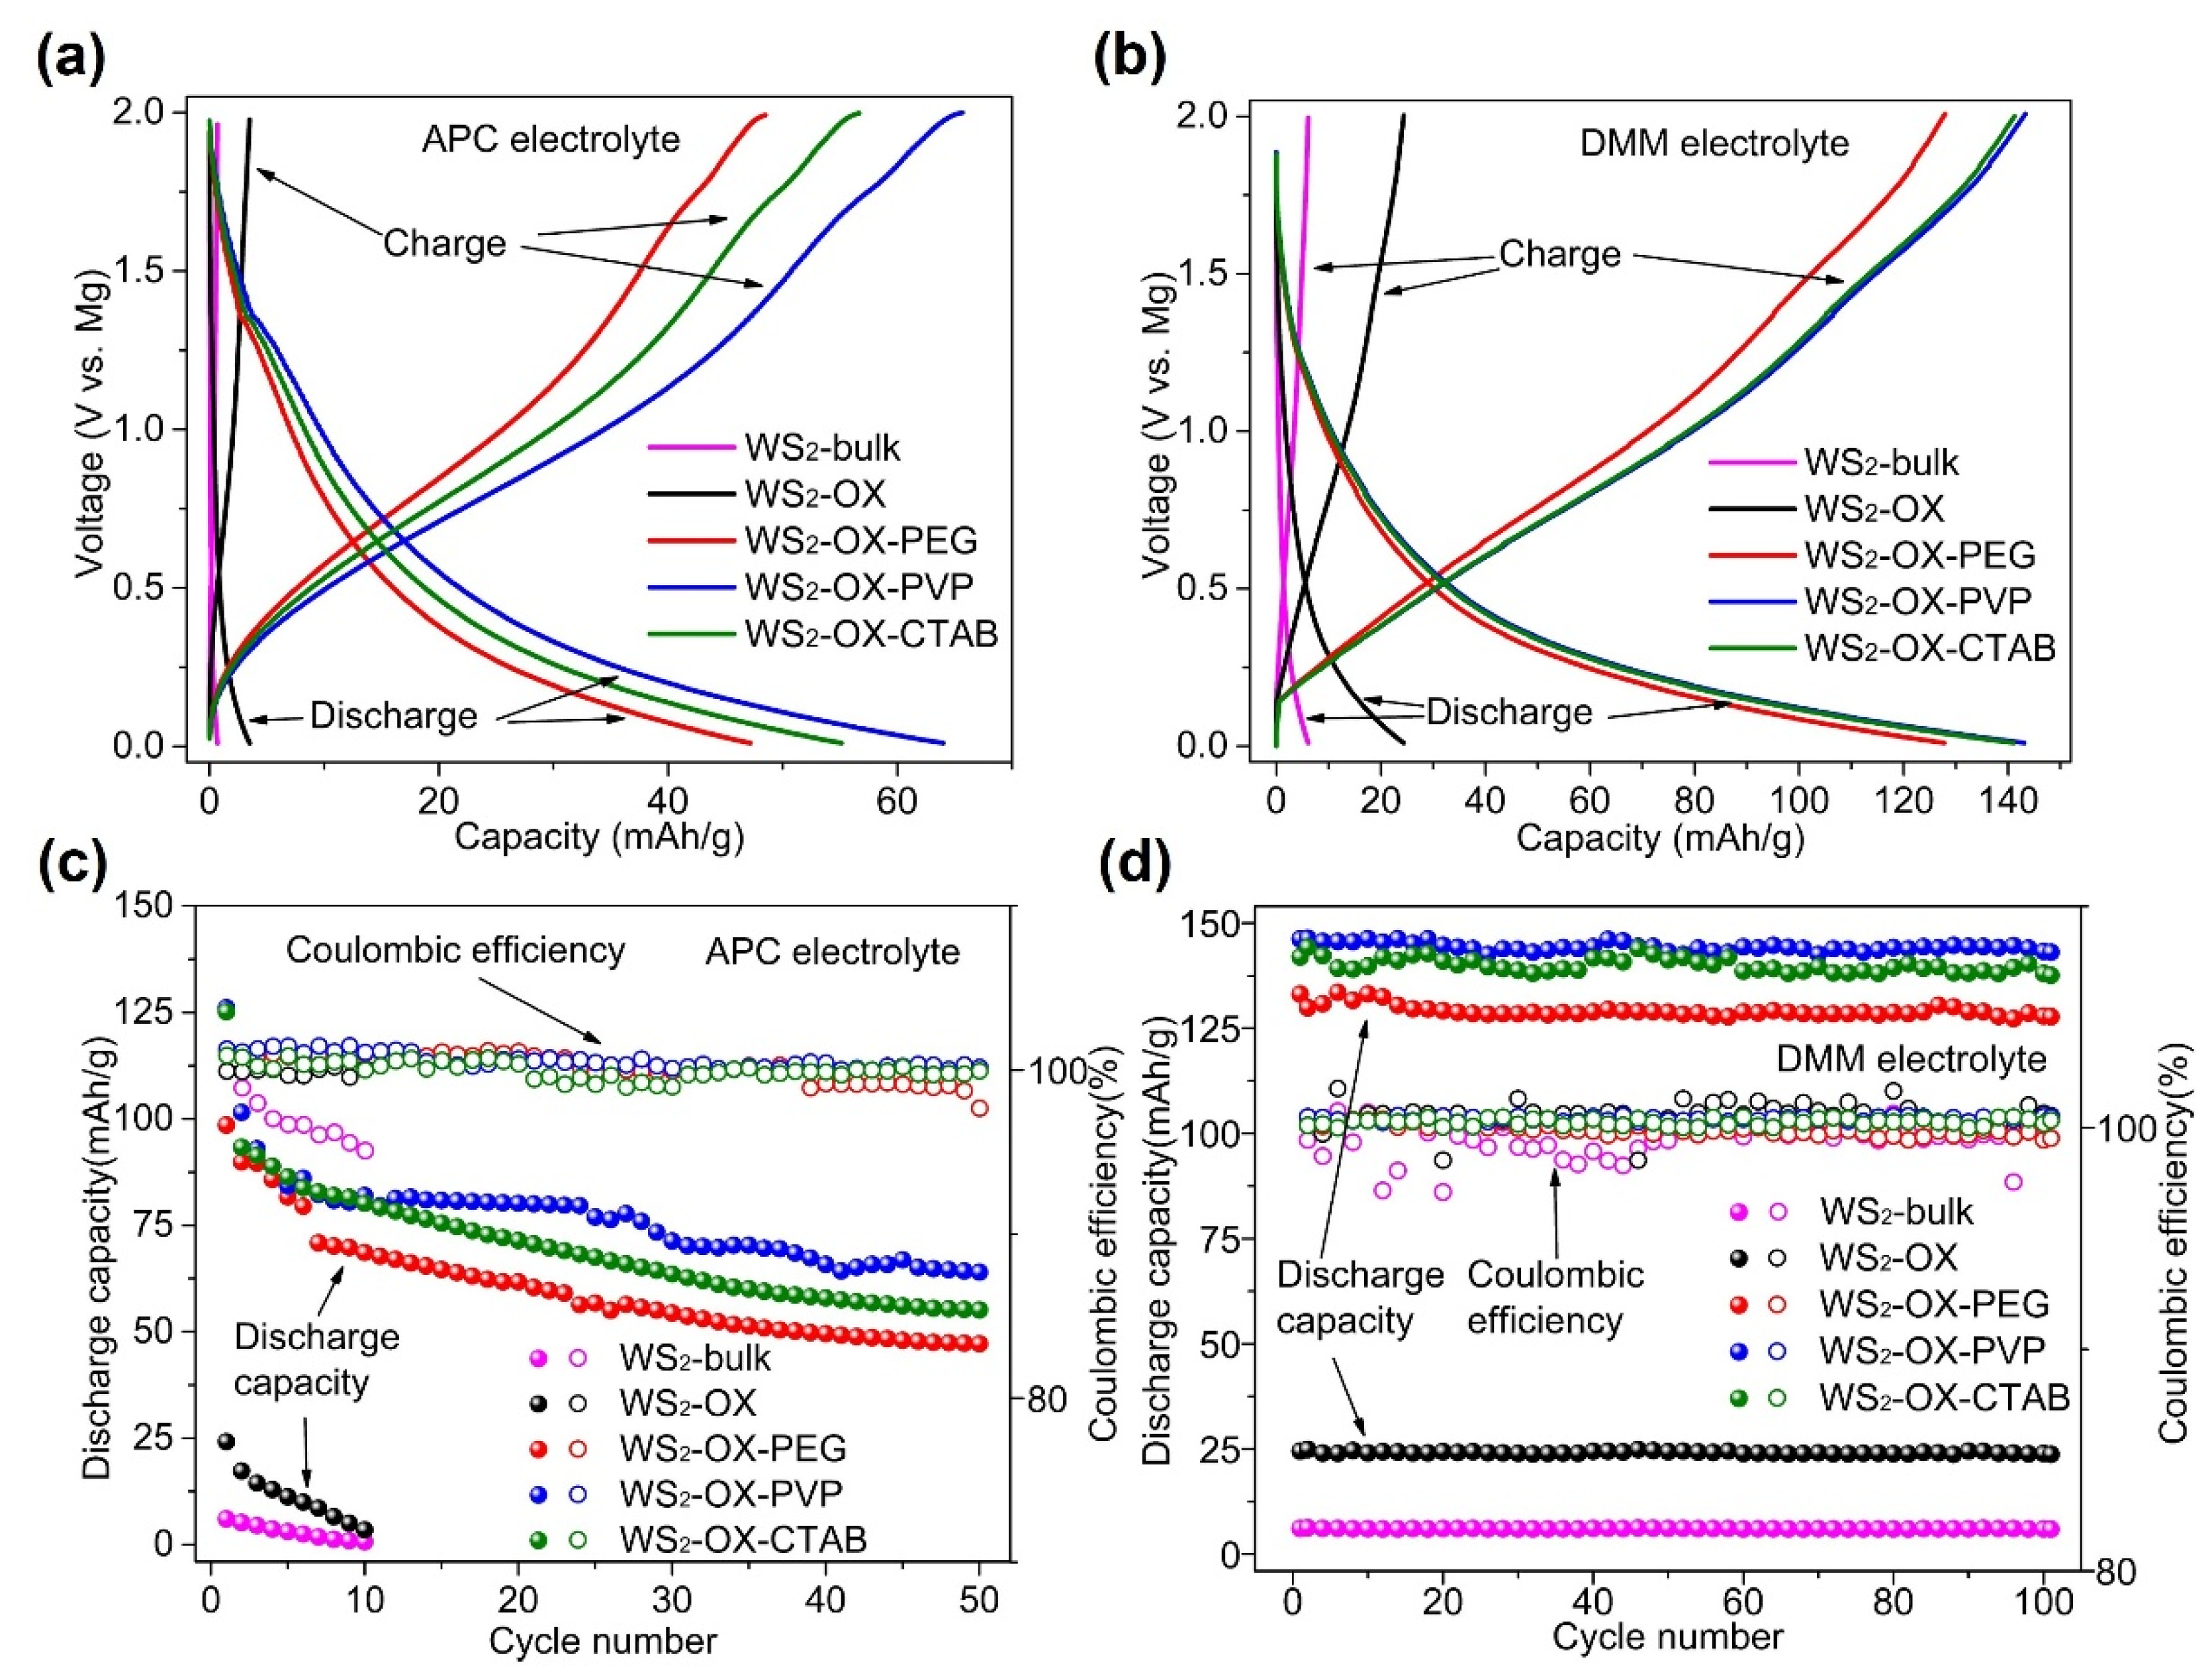
Figure 3 shows the performance of WS2 as cathodes in magnesium batteries at 500 mA/g in different electrolytes. In cells using an APC electrolyte, discharging capacities for all cathode types (WS2-bulk, WS2-OX, WS2-OX-PEG, WS2-OX-PVP, and WS2-OX-CTAB) declined sharply with the cycle number. Capacities achieved in the first full cycle are 10.4, 24.3, 98.5, 126.1, and 125.2 mAh/g, respectively (Table S3). For the final cycle, the capacities are 0.7, 3.5, 47.2, 64, and 55.1 mAh/g, respectively. In cells using DMM electrolytes, the discharge capacities showed a little decline over cycles. The trend indicates that coulombic efficiencies reached almost 100% showing very good reversibility. The highest capacities achieved for WS2-bulk, WS2-OX, WS2-OX-PEG, WS2-OX-PVP, and WS2-OX-CTAB are 6.4, 24.9, 133.5, 146.4, and 144.3 mAh/g, respectively (Table S3). These capacities remained stable over the first 100 cycles at a very high current density of 500 mA/g. For the final cycle, the capacities are 5.9, 23.7, 127.8, 142.7, and 137.6 mAh/g, respectively. It was observed that the battery performance was improved by using DMM instead of APC as the electrolyte. The retained charge capacities in cells using DMM electrolyte after 100 cycles are notably higher than those in APC cells after a few initial cycles. Moreover, the WS2-bulk and WS2-OX samples show very low specific capacity, indicating the electrochemical inactivity of these samples. These results might be explained by the small specific surface area of the WS2-bulk (10 m2/g) and WS2-OX (28 m2/g) samples. In contrast, the nanoflower morphology of WS2-OX-PVP and WS2-OX-CTAB samples resulted in a high specific area with 80 m2/g and 70 m2/g, respectively; thus, they show the best electrochemical performance. Although the WS2-OX-PEG sample shows a different morphology (i.e., nanorods), it still exhibits an average surface area of 57 m2/g and a reasonably good electrochemical performance. Although the WS2-OX sample exhibit similar morphology to that of WS2-OX-PVP and WS2-OX-CTAB, it shows a much lower electrochemical capacity than the latter two samples due to its low specific surface area (28 m2/g). Similar electrochemical inactivity was reported for MoS2/C cathodes due to the reduction in the specific surface area [19,23]. It is well known that a higher surface area of electrode materials in batteries could increase the contact area with the electrolyte, accessibility to the active sites, and utilization of the electrode capacity, often resulting in a higher specific capacity [39].
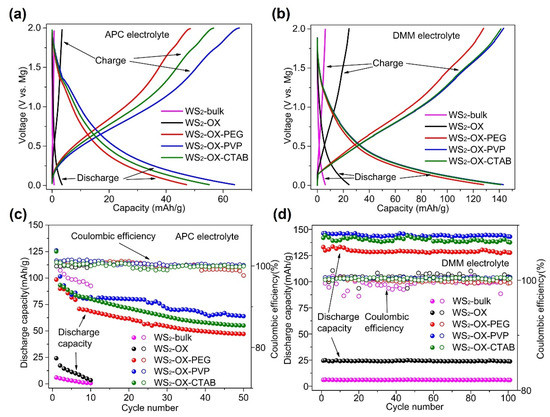
Figure 3.
The discharge–charge profiles of different morphologies of WS2 as magnesium battery cathodes in (a) APC and (b) DMM electrolyte at 500 mA/g after 100th cycle. (c,d) The cycling performance of different morphologies of WS2 as magnesium battery cathodes in (c) APC and (d) DMM at 500 mA/g.
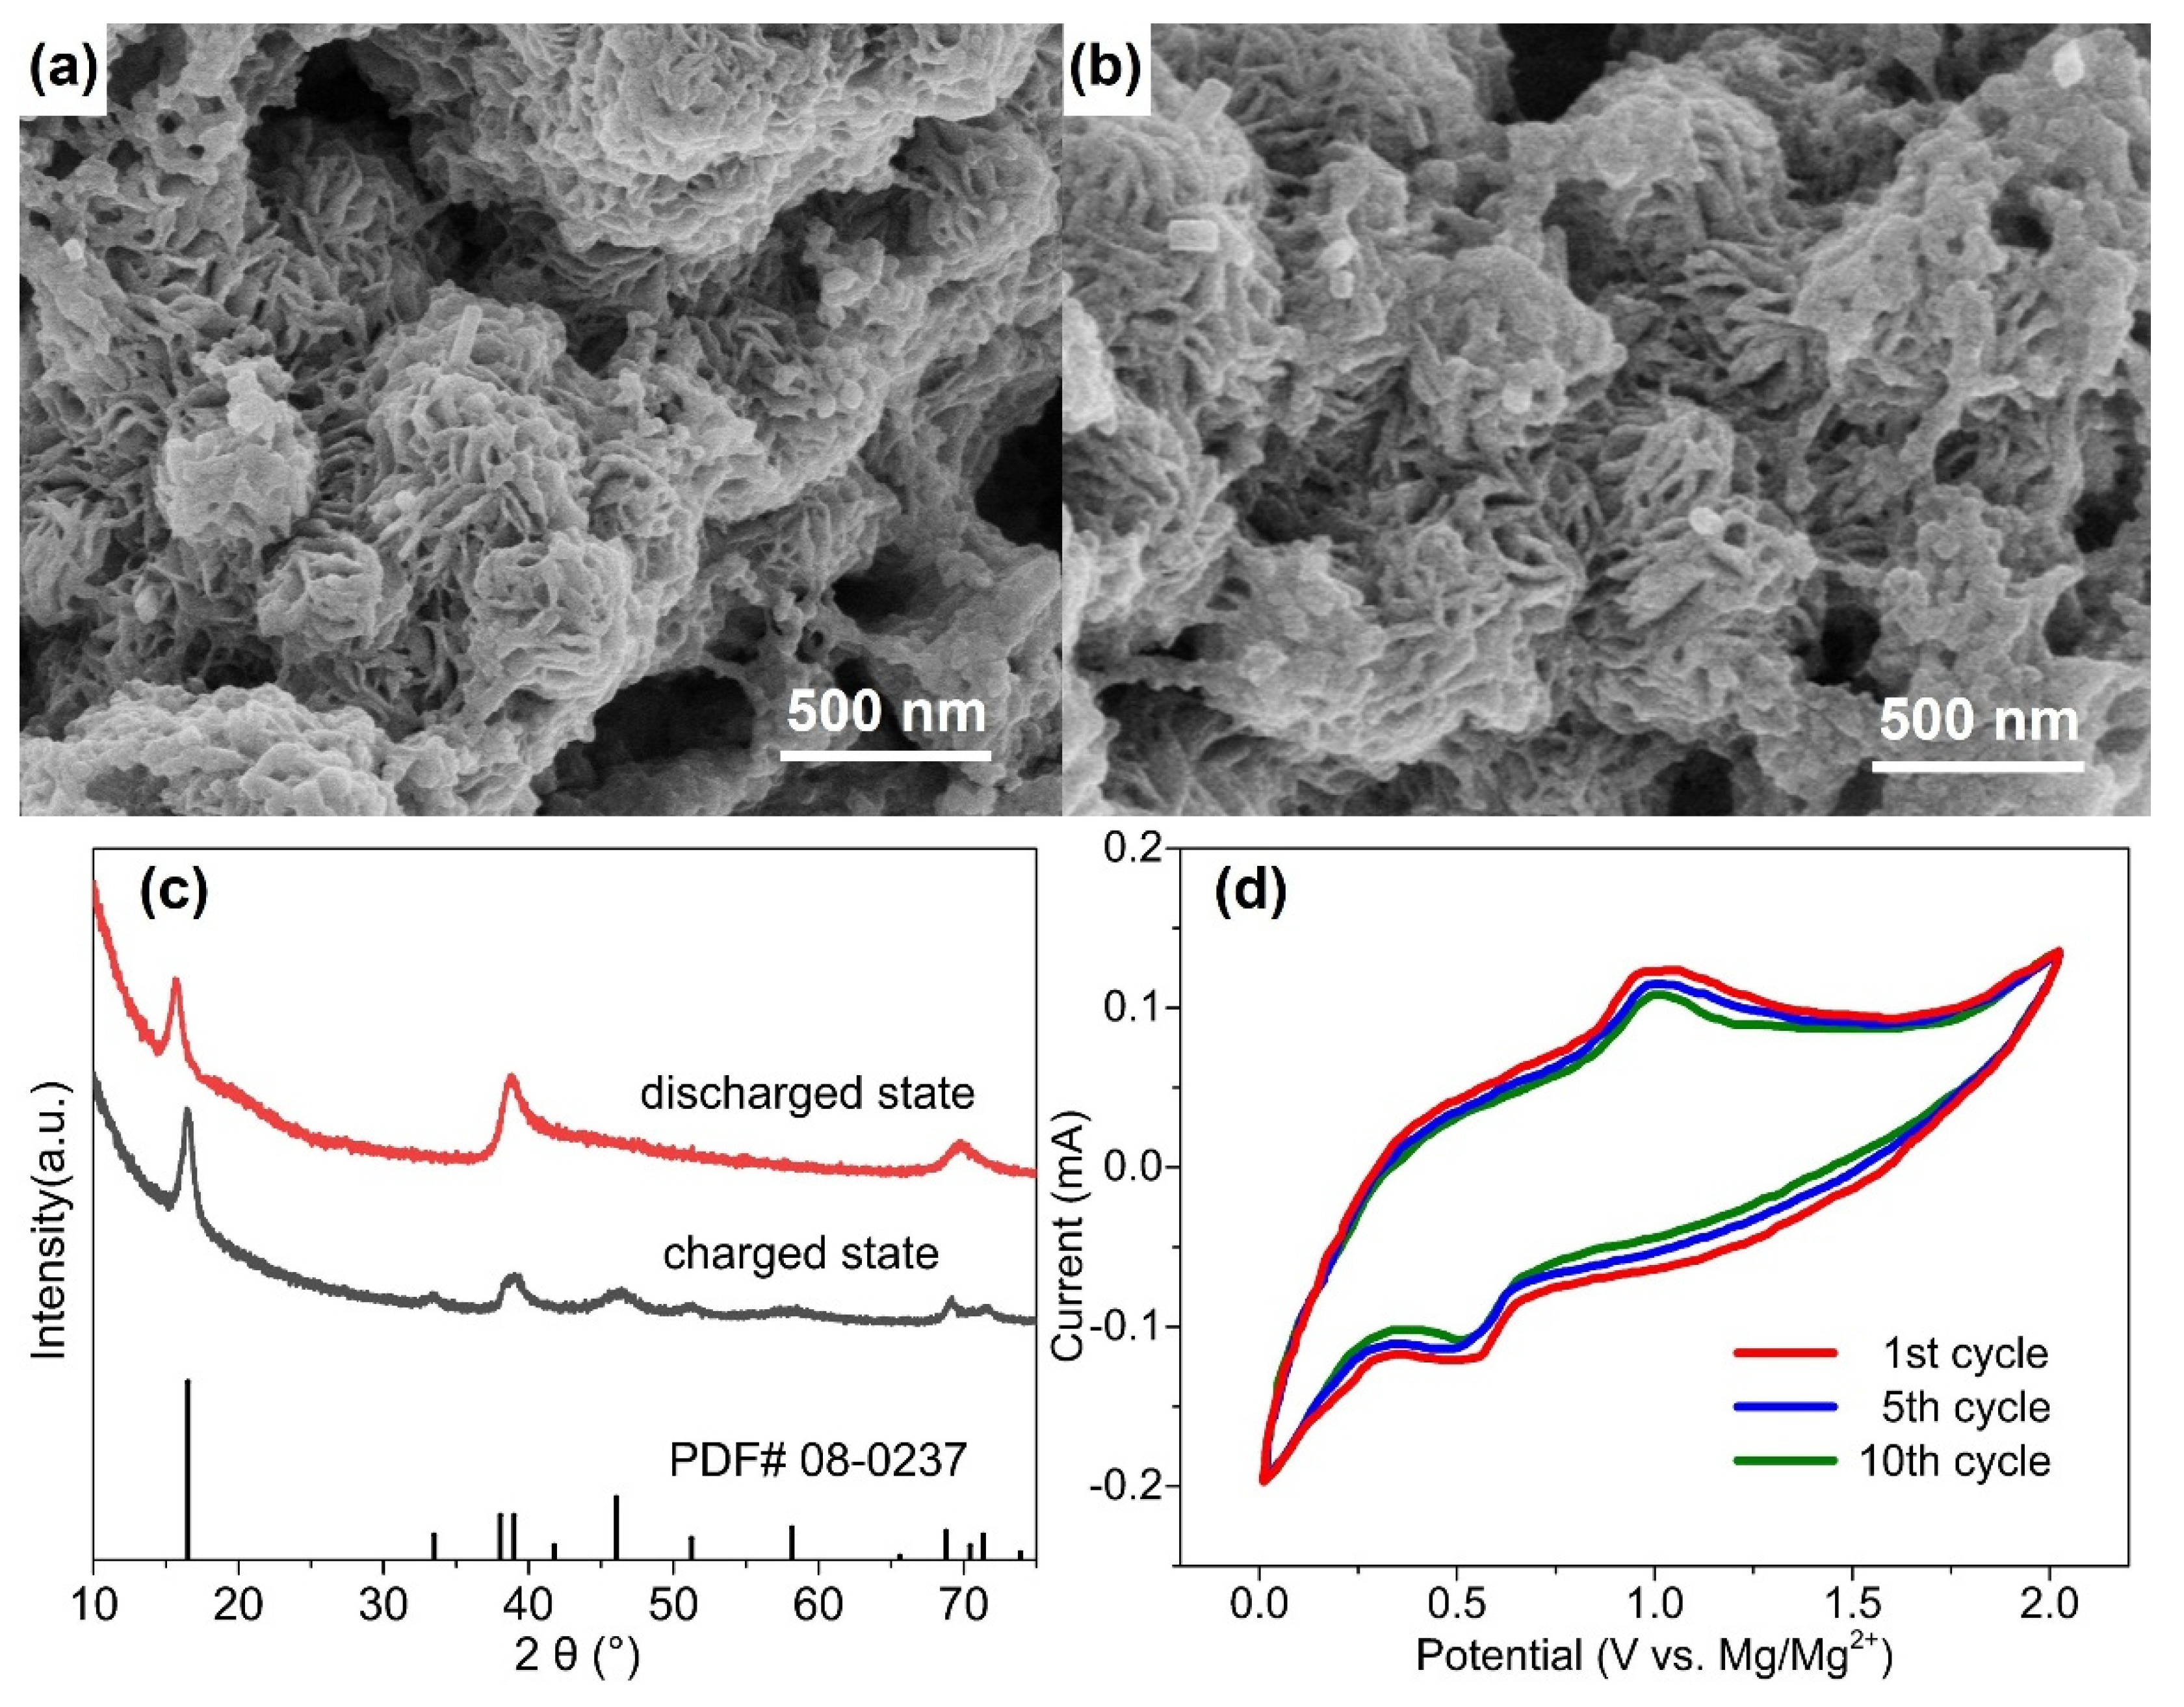
In order to understand the storage mechanism of Mg2+ in the cathode materials and to estimate their theoretical capacities, cathodes were studied by XRD and SEM following discharge. Figure 4a,b show micrographs of the WS2-OX-PVP-based electrode in DMM electrolyte in charged and discharged states. No clear change in morphology is evident as a result of the discharging process. Similarly, Figure 4c, showing the XRD patterns for these samples, reveals that all the main XRD reflections remain after discharging, confirming the retention of the hexagonal structure of WS2. However, it is seen that the (002) reflection is shifted to notably lower 2θ angles after full discharge. The single fitting of this reflection reveals that it shifted from 2θ = 16.64°, corresponding to an interplanar d-spacing of 0.618 nm, before discharging to 2θ = 15.71°, corresponding to an interplanar d-spacing of 0.655 nm. In contrast, no remarkable shift is observed for the other reflections (e.g., (110) and (100)) after discharge. These results are consistent with the electrochemical intercalation of Mg2+ ions between the WS2 layers during the discharging process, leading to an increase in the interlayer distance d002 of the cathode host lattice. This implies that except for intercalation, no chemical modification occurs during the discharging process. Unlike several proposed Mg-S batteries [40], no new sulfide phases are formed here, nor do any exchange reactions take place during discharge, as is the case in conversion-type electrodes [41]. Figure S2 presents the schematic diagram of the magnesium intercalation process. The Mg2+ intercalation/deintercalation process during discharging/charging could be substantiated by the cyclic voltammetry, which is shown in Figure 4d. As Figure 4d shows, the battery undergoes reversible Mg2+ intercalation and deintercalation reactions, which correspond to the reduction peak (around 0.5 V) and the oxidation peak (around 1.0 V). From Figure 3d, during the discharging–charging process, the discharging plateau appeared at around 0.5 V, and the charging plateau appeared at around 1.0 V. Therefore, the CV results are consistent with the discharging–charging profile shown in Figure 3d. The reduction peak at 0.5 V is related to the intercalation process (magnesiation), and the oxidation peak at 1.0 V is related to the deintercalation process (demagnesiation). Similar discharging–charging plateaus and the reduction–oxidation (intercalation–deintercalation) peaks could be found in the previous work with WS2 as a working electrode [42,43,44], which substantiates the results in this research.
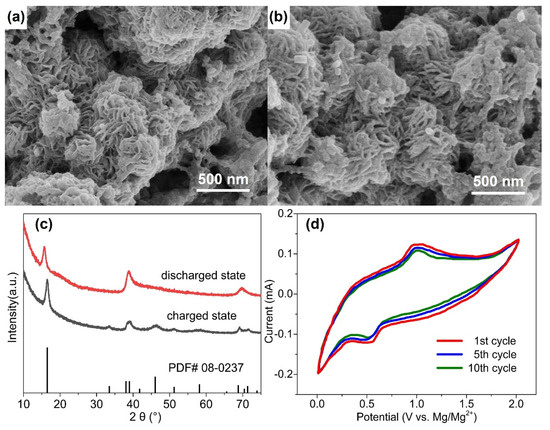
Figure 4.
SEM micrographs of WS2 electrode (WS2-OX-PVP) in DMM electrolyte before the 1st cycle at charged state (a) and after the 100 cycle at discharged state (b); the corresponding XRD patterns are shown in (c); cyclic voltammetry of WS2-OX-PVP at a scan rate of 1 mV/s in DMM electrolyte in the potential window of 0–2 V is shown in (d).
The capacity of WS2 to host Mg2+ ions during discharging is given by x in Equation (1) and is associated with the release of two electrons, as shown by Equation (2).
The theoretical capacity Ctheor is calculated according to Equation (3).
Theoretical first principles studies into magnesium intercalation using density functional theory have indicated that values as high as x = 2 might be achievable. However, the ability of density-functional-theory (DFT) methods to accurately quantify battery material performance is questionable, and such high levels of intercalation have not yet been experimentally observed [45]. Experimental results for cathodes based on WS2 have generally achieved lower specific capacities compared to the performance we have observed for the nanostructures reported here, as discussed below. An intercalation capacity at a level of x = 0.28 was reportedly achieved in WS2 in an earlier study [23]; however, no conclusive limiting intercalation capacity has been determined for this cathode material.
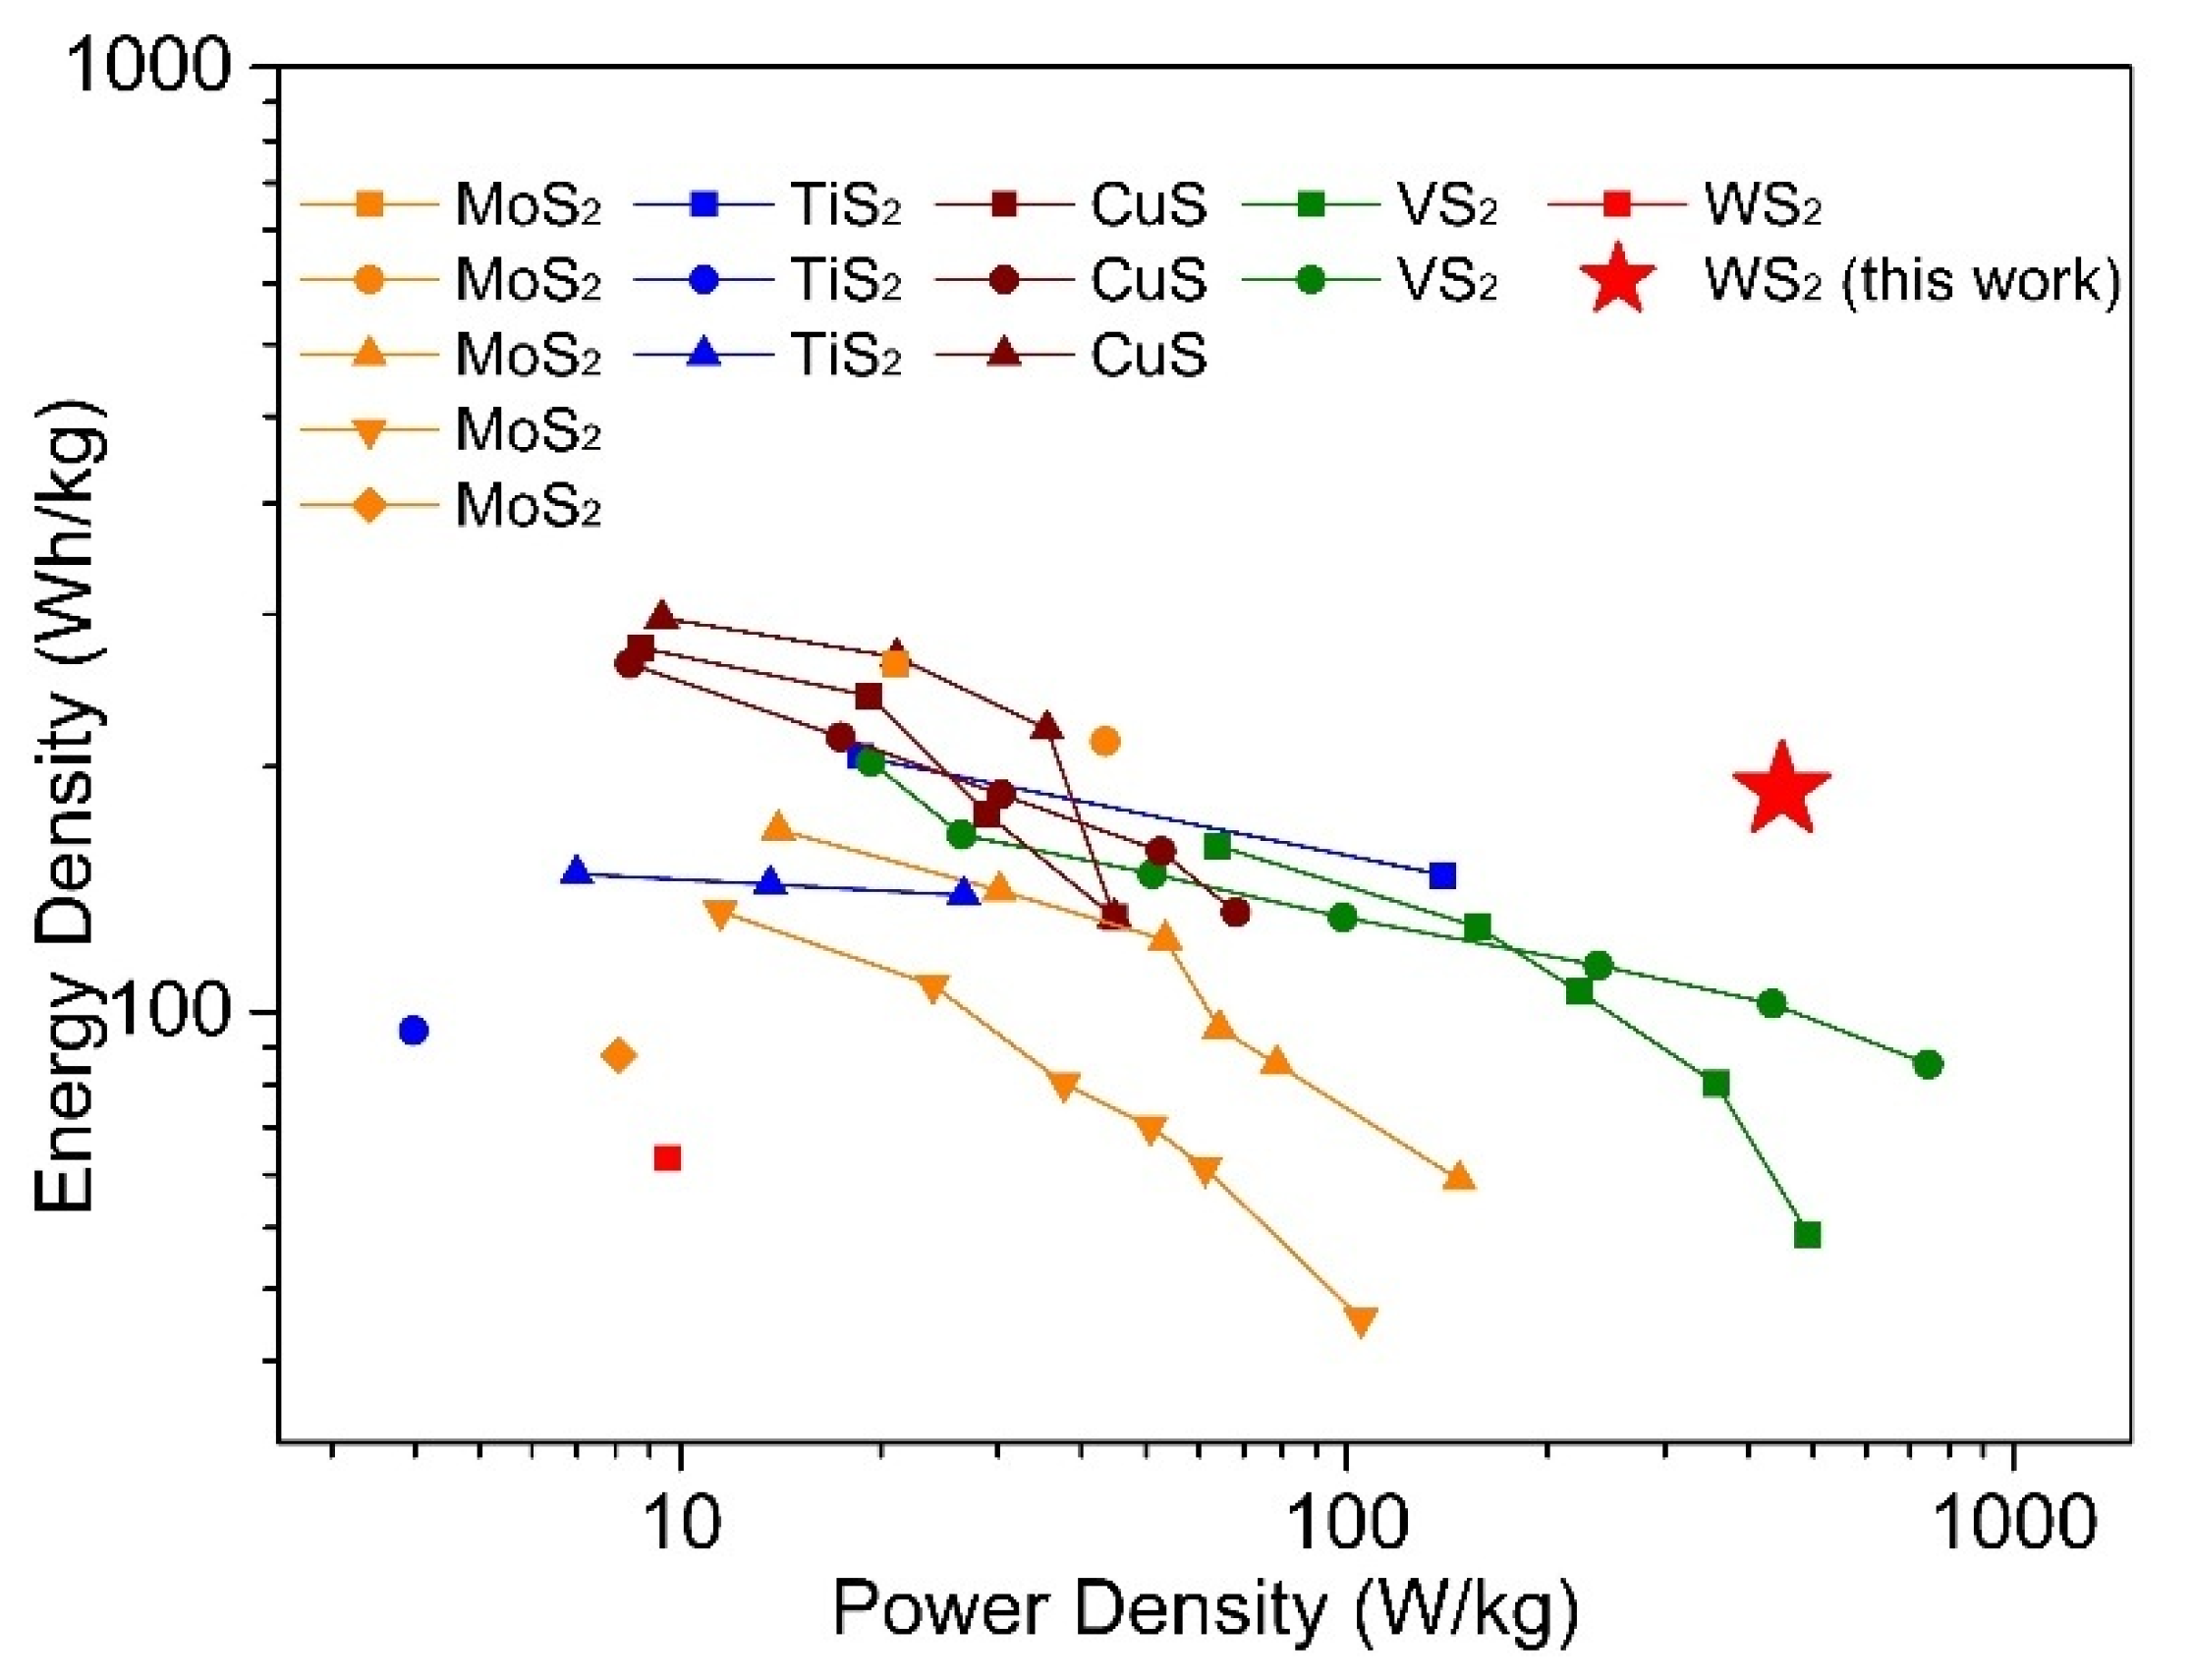
For the cathode materials examined here, the highest discharge capacities we achieved using a DMM electrolyte are 146.4 mAh/g and 144.3 mAh/g for WS2-OX-PVP and WS2-OX-CTAB cathodes, respectively. In APC, solution capacities for these materials were lower, 126.1 mAh/g (WS2-OX-PVP) and 125.2 mAh/g (WS2-OX-CTAB), illustrating the role of electrolyte/cathode compatibility. The highest discharge capacities of WS2-OX-PVP and WS2-OX-CTAB in DMM correspond to a minimal level of intercalation of approximately 0.68 mol Mg2+ per mol WS2 producing Mg~0.68WS2. Table S3 presents a summary of reported performance data from previous studies into WS2 and other metal sulfide cathode materials in magnesium batteries [17,18,19,20,23,46,47,48,49,50,51,52,53,54]. Figure 5 is drawn to compare this work with the publications mentioned above in the dimension of power density and energy density. From Table S3, the performance we observed in this study for WS2 in terms of the highest achieved capacity lies inside the range of capacities observed for other sulfide materials. However, compared with other materials, this work shows better stable cycling performance and less capacity loss during cycling even under higher current density (Table S3). Furthermore, in consideration of power density and energy density, this work shows the best performance among others (Figure 5), implying possible applications in the field of electric vehicles. Cathodes based on CuS and TiS2 often rely on conversion reactions between Mg and Cu/Ti and, therefore, generally do not show the kind of stable cycling performance shown here. The capacities of WS2 cathodes fabricated here were significantly higher than those reported in earlier studies into exfoliated WS2 and WS2–graphene composites as Mg battery cathodes [23]. This demonstrates the efficacy of templating and nanostructuring in conjunction with optimized electrolyte selection. The nanostructured WS2 cathodes used here with DMM electrolyte present very good reversibility/cyclability and rapid kinetics, showing little capacity decline between 1st and 100th cycles even under a high current density of 500 mA/g. When one considers the cycling stability and initial/final capacities, the materials we studied here compare quite favorably with prior reported studies into analogous sulfide materials. The outstanding performance of our WS2 cathodes can be related to the unique morphology and microstructure, high specific surface area of WS2, good electrochemical properties of electrolytes, fast electron transfer, and insertion/extraction of Mg2+ ions, as discussed extensively below.
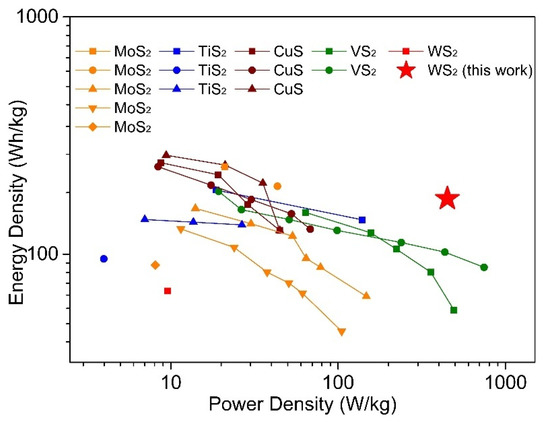
Figure 5.
Ragone plots for magnesium batteries with different cathodes (by cathode mass). The data about WS2 and other metal sulfide cathode materials for magnesium batteries are taken from previous studies reported in the references [17,18,19,20,23,46,47,48,49,50,51,52,53,54].
Cathode performance with DMM electrolyte was markedly improved relative to APC electrolyte. The significant diminishment of discharge capacities in cells using APC electrolytes is likely to be attributed to the corrosion of battery components, including current collectors by the halogen in APC. In the APC electrolyte, PhMgCl is the only magnesium salt in the electrolyte, and the halogen comes from both PhMgCl and AlCl3. The amount of halogen (Cl) from PhMgCl and AlCl3 in APC (2 mol/L) is much higher than that in DMM (0.25 mol/L), in which MgTFSI2 is the major magnesium salt, and MgCl2 only exists in a small amount. The improved battery performance achieved using DMM as the electrolyte can be attributed to the following facts. In the DMM solution, MgTFSI2 is not corrosive and is the only magnesium salt soluble in ether leading to good fluidity inside the battery [5]. Further, the small amount of MgCl2 not only provides an Mg2+ source but also scavenges residual water under the appropriate voltage range [11].
Clearly, the electrochemical performance of cathodes in this research is affected by the nanostructure morphology that influences the specific surface area and the available void space between the neighboring nanosheets. Morphologies were controlled by means of sodium oxalate and templating agents, which resulted in profound changes to the formation and structure of tungsten sulfide materials. A closer examination of the formation and templating mechanisms that take place in the processes applied here is presented in the supplementary information. Templating agents, which contain hydrophobic and hydrophilic components, alter the surface energy of solid reactants and products and thus modify the habit of crystal growth in materials. Upon examining the performance of the different cathodes, it is evident that the templated nanostructured WS2 materials exhibited notably higher performance in terms of capacity and discharge voltage relative to non-templated nanostructured WS2 and bulk WS2. From inspection of the data in Figure 3 and Table S3, the capacity of templated nano WS2 is much better than that of non-templated WS2, with nanoflower WS2 (WS2-OX-PVP and WS2-OX-CTAB) showing a clearly higher storage capacity than that of nanorod WS2 (WS2-OX-PEG). The higher surface areas of nanoflower spheres, as confirmed by BET analysis, result in greater levels of surface localized magnesium intercalation and thus correspond as postulated to higher levels of reversible capacity for these materials, as shown in Figure 3 and Table S3. The strength of W–S bonds and interlayer Van der Waals forces affect Mg2+ mobility and intercalation, which are important in governing the performance of magnesium ion batteries [25,26]. According to the XPS and BET results, both W–S bonds and Van der Waals forces of nanostructured materials are weaker than those of bulk WS2, which indicates the layered nanostructure impacts the electrostatic forces between Mg2+ and cathode hosts and increases the ion mobility and intercalation capacity. Additionally, the templated nanostructured WS2 shows a higher surface and more defect sites. The difference in results between nanoflower WS2 and nanorod WS2 can be attributed to the substantial difference in the specific area and binding energy. The small results difference between forms of nanoflower WS2 could be attributed to the more uniform surface morphology of nanoflower-sphere WS2 in the WS2-OX-PVP sample.
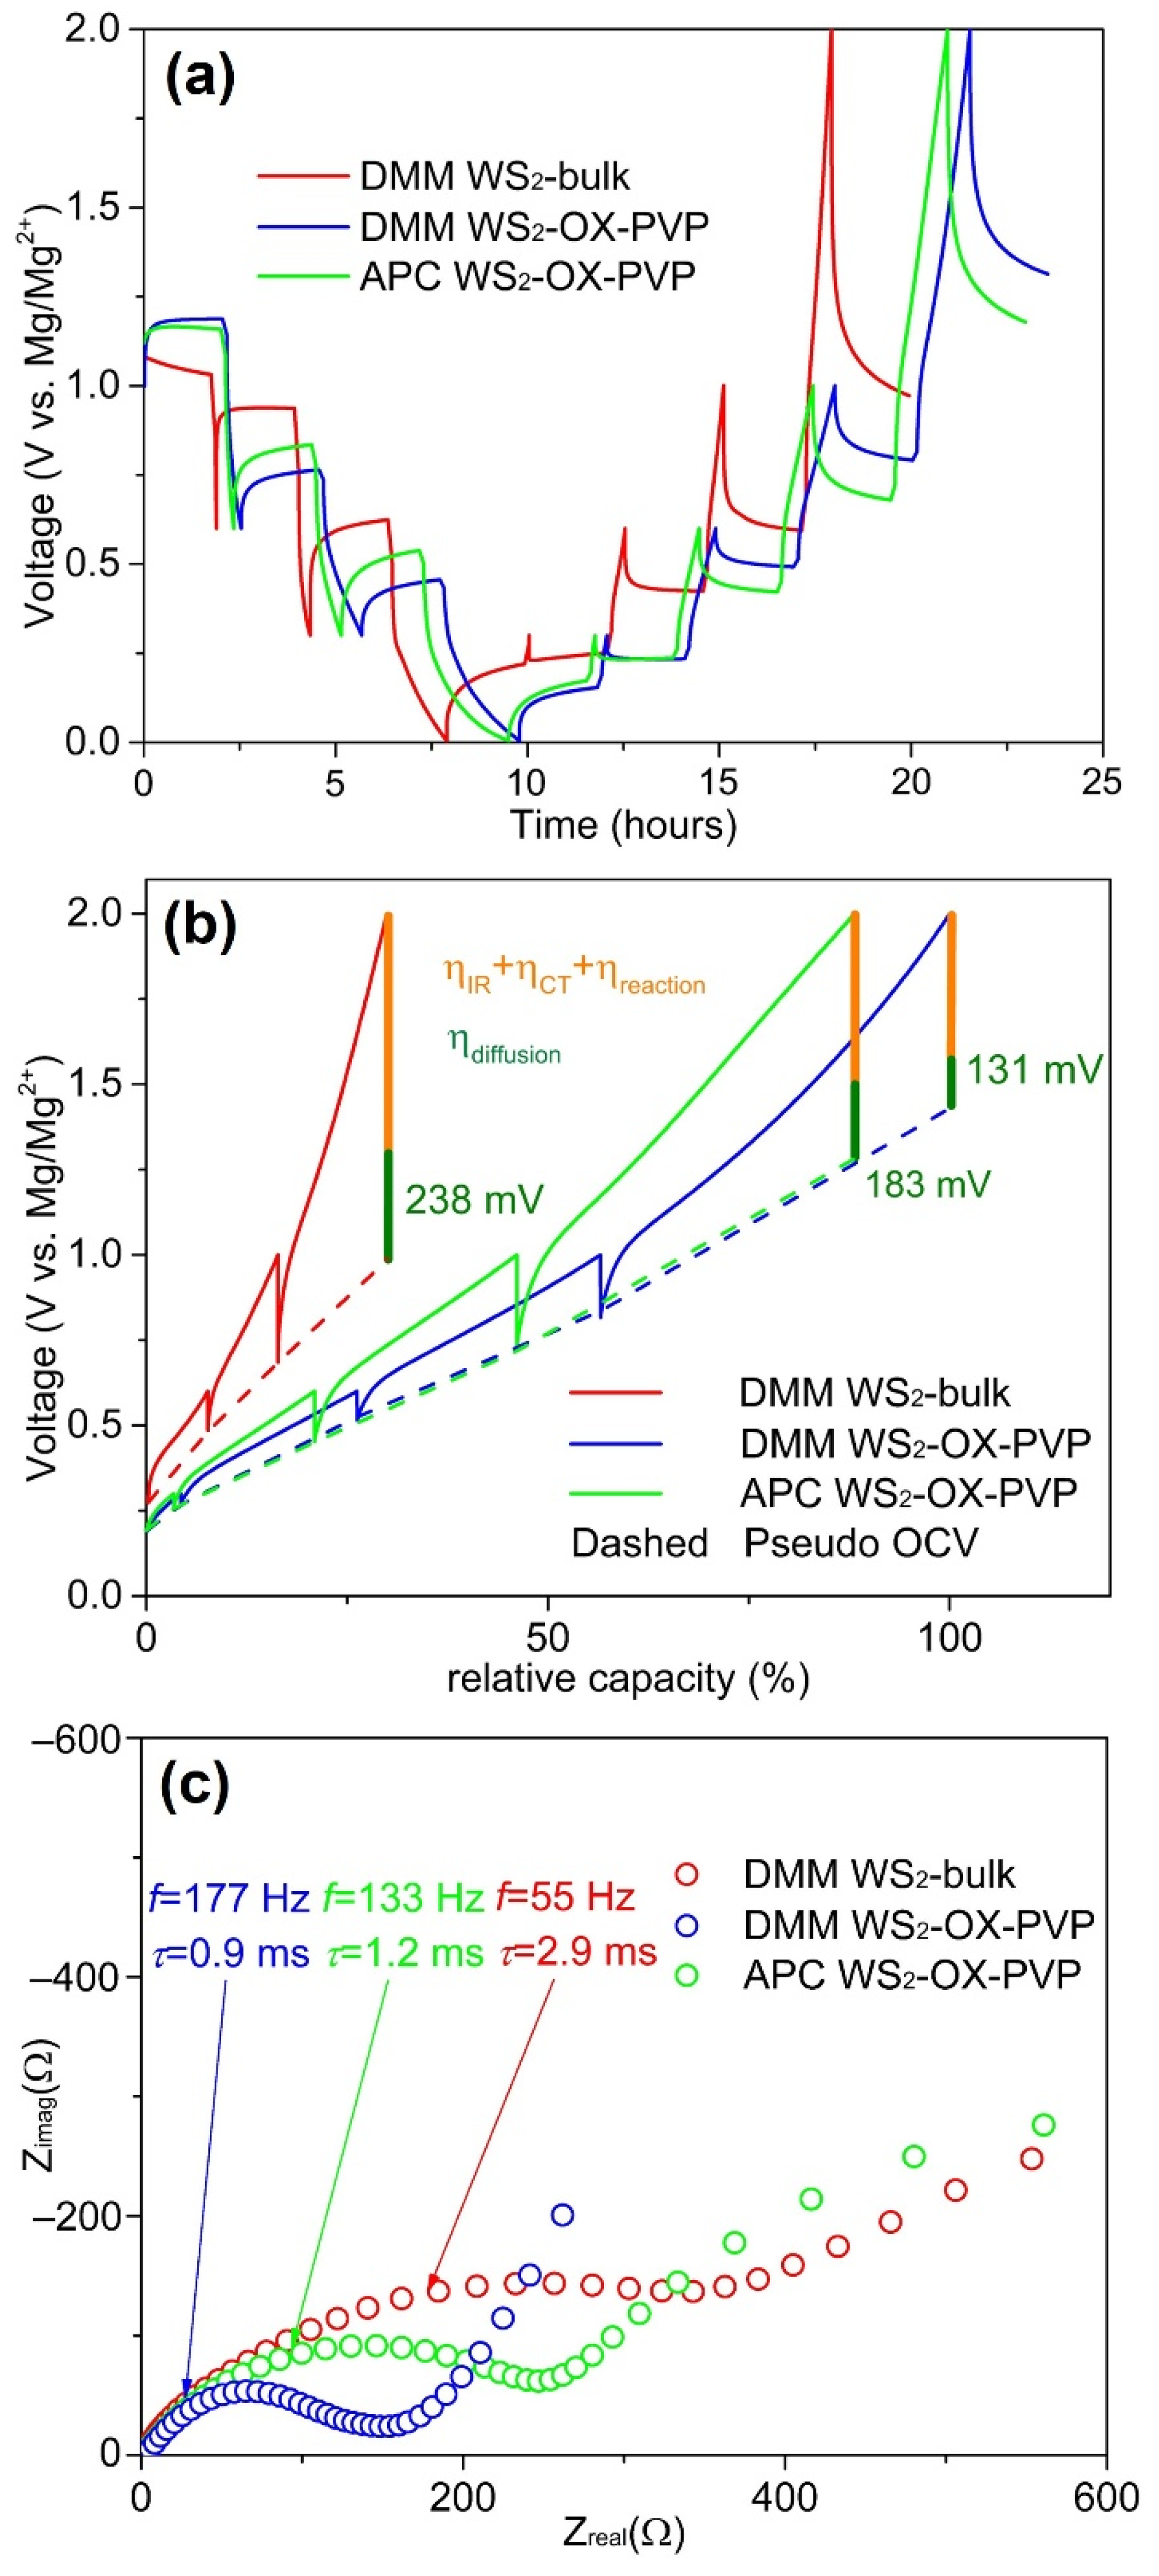
As the XRD measurement revealed a homogenous WS2 phase for all samples, a uniform intercalation capability is expected in all materials, and so, neglecting microstructure, the theoretical capacity may be assumed to be constant for all samples. In order to elucidate the morphological origin of the different measured capacities for the materials studied in this work, further electrochemical tests on the cells were conducted (Figure 6). Cells were discharged and then charged in a stepwise manner with pausing intervals of 2 h each used to relax the cell and allow approximation of open circuit voltages (OCV). Following relaxation, EIS measurements were recorded (circles in Figure 6a). Although the relaxation process is not able to reach full equilibrium in only two hours, in the following, the measured potential after the 2 h pause interval is considered as a “pseudo OCV”. The overpotential of a cell is an important indicator of the efficacy of kinetic processes in the cell. We expect higher overpotential values to arise in cases where diffusion pathways are longer and interfacial polarization barriers pose a bottleneck for ion intercalation and release. In Figure 6, the overpotential can be seen as the difference between the half-cell potential prior to and following relaxation. The high overpotential of WS2-bulk is expected based on microstructure and cell performance data and is indicative of the longer diffusion pathways and lower levels of the surface area resulting in high interface polarization and more sluggish reactions at interfaces.
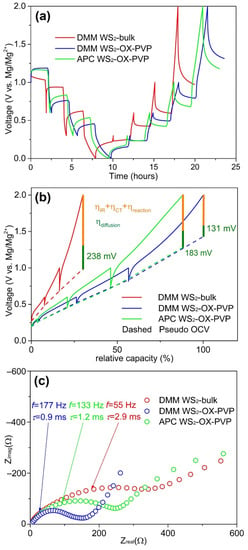
Figure 6.
(a) Pulsed discharge–charge cycle with 2 h of relaxation at several cell potentials. The circles mark conducted impedance measurements, red circles: measurements discussed here. (b) The same cyle plotted vs. specific capacity. The connected end potentials of the relaxation steps approximate the pseudo OCV curves (dashed lines). (c) Impedance spectra of WS2-bulk DMM (red), WS2-OX-PVP DMM (blue), and WS2-OX-PVP APC (green) after pausing discharge at 0.3 V for 2 h.
Plotting the potential vs. the specific capacity (Figure 6b) reveals relationships between specific capacities and the overpotentials and the pseudo OCVs (dash/dot line in Figure 6b). WS2-bulk shows a lower specific capacity and a higher overpotential during relaxation compared to WS2-OX-PVP. The pseudo OCV curves from the two WS2-OX-PVP samples are rather similar. The higher overpotential of WS2-OX-PVP APC leads to a lower specific capacity. The WS2-bulk sample shows higher OCV during charging and a lower one while discharging. Whether this behavior is driven by structural factors in the cathode material or by altered relaxation kinetics in the overall system requires further analysis. However, the decreased capacities seen for WS2-bulk DMM and WS2-OX-PVP APC can be attributed to the higher overpotentials in these samples, which results in the cutoff voltage of 2 V being reached at an earlier stage with a lower capacity.
From impedance spectra, we can distinguish the individual –contributions of the electrolyte resistance Ri and the charge transfer resistance RCT. In Figure 6c, selected EIS spectra are plotted. In Table 1, we list the Ri, RCT, and R(f = 50mHz) (at the measured frequency of 50 mHz) and the relaxation time constant of the charge transfer process τCT = 1/(2πfmax) from these EIS spectra. Ri is constant at approx. 2 Ω for all samples and all EIS measurements, indicating a consistent electrolyte conductivity, regardless of whether DMM or APC was used. However, these values are very low compared to the RCT and R(f = 50mHz) values. RCT is lowest for WS2-OX-PVP DMM and highest for WS2-bulk DMM. The same trend is observable for R(f = 50mHz). RCT and τCT can be linked to the high surface area of the WS2-OX-PVP sample (as described earlier), reducing the charge transfer resistance and facilitating the reaction indicated by the lower τCT. The APC electrolyte in the WS2-OX-PVP APC sample shows higher resistance values compared to WS2-OX-PVP DMM. Furthermore, from the EIS spectrum, a second distinct process becomes obvious at lower frequencies of ca. 0.2 Hz. Since it is not visible for WS2-OX-PVP DMM and WS2-bulk DMM, it can also be attributed to the APC electrolyte, deteriorating the performance as shown in the cycling tests above. R(f = 50mHz) arises due through diffusion processes. From these EIS measurements in the frequency domain down to 50 mHz the validity of diffusion processes with their high constants of relaxation times is limited. A better insight into this issue can be derived from the potential drop during relaxation in the time domain. Here the influence of the diffusion process manifested by its overpotential can be investigated. The total voltage drop contains, besides the diffusion overpotential ηdiffusion, the IRi drop and charge transfer reaction overpotential ηCT and ηreaction, respectively, but they relax immediately and after a few milliseconds (see τCT in Table 1) after setting the charge current to zero. The estimated diffusion overpotentials (Table 1) reveal the same trend as the EIS results, with the lowest values for WS2-OX-PVP with DMM electrolyte and the highest for WS2-bulk with DMM electrolyte.

Table 1.
Characteristic parameters from impedance spectra from EIS measurement and the relaxation voltage preceding EIS measurement.
4. Conclusions
We produced nanostructured WS2 with different morphologies by means of a hydrothermal method and applied these materials as cathodes in magnesium-ion batteries. The morphologies of nanorods, nanoflower-spheres, and nanoflower-aggregates were acquired by adding Na2C2O4 as a complexing agent and adding PEG, PVP, and CTAB as templates. APC and DMM electrolytes were both examined for comparison. Results show that a high capacity of 142.7 mAh/g, which corresponds to 0.68 mol of intercalated Mg2+ ions per mol of WS2, was achieved after 100 cycles at a high current density of 500 mA/g with the flower-like nanostructured WS2 cathode in DMM electrolyte. The fast Mg2+ transmission kinetics could be attributed to the smaller molecule size of MgTFSI2/MgCl2 compared with that of PhMgCl/AlCl3, weaker ionic bonds, and van der Waals forces of WS2 compared with other transition metal oxides/sulfides and increased surface area after nanostructurization.
Supplementary Materials
The following supporting information can be downloaded at https://www.mdpi.com/article/10.3390/batteries8090116/s1, Figure S1: Le Bail fit of XRD patterns of WS2-bulk sample using a model for (a) isotropic size and (b) anisotropic size broadening; Figure S2: Schematic description of magnesium ion intercalation in WS2 cathode; Table S1: A summary of structural parameters extracted by Le Bail fitting of powder XRD patterns of samples WS2-bulk, WS2-OX, WS2-OX-PEG, WS2-OX-PVP and WS2-OX-CTAB; Table S2. Peak energy, peak width, peak area and Lorentzian/Gaussian (L/G) ratios of different WS2 samples; Table S3: Summary of reported cycling stability for metal sulfides as cathodes in magnesium batteries.
Author Contributions
W.G.: Conceptualization, Methodology, Investigation, Data Curation, Writing—Original Draft. D.A.H.H.: Conceptualization, Writing—Review and Editing, Supervision, Project administration. D.K.: Methodology, Investigation, Data Curation, Writing—Review and Editing. J.W.: Investigation, Data Curation, M.F.B.: Conceptualization, Investigation, Data Curation, Writing—Review and Editing, Supervision, Project administration, A.G.: Conceptualization, Supervision, Writing—Review and Editing, Resources. All authors have read and agreed to the published version of the manuscript.
Funding
This research was funded by China Scholarship Council (201606280048).
Institutional Review Board Statement
Not applicable.
Informed Consent Statement
Not applicable.
Data Availability Statement
The data that support the findings of this study are available from the corresponding author upon reasonable request.
Acknowledgments
Wuqi Guo acknowledges the financial support from the China Scholarship Council. The authors acknowledge support from the German Research Foundation and the Open Access Publication Fund of TU Berlin.
Conflicts of Interest
The authors declare no conflict of interest.
References
- Shao, G.; Hanaor, D.A.H.; Wang, J.; Kober, D.; Li, S.; Wang, X.; Shen, X.; Bekheet, M.F.; Gurlo, A. Polymer-Derived SiOC Integrated with a Graphene Aerogel As a Highly Stable Li-Ion Battery Anode. ACS Appl. Mater. Inter. 2020, 12, 46045–46056. [Google Scholar] [CrossRef] [PubMed]
- Wang, J.; Kober, D.; Shao, G.; Epping, J.D.; Görke, O.; Li, S.; Gurlo, A.; Bekheet, M.F. Stable anodes for lithium-ion batteries based on tin-containing silicon oxycarbonitride ceramic nanocomposites. Mater. Today Energy 2022, 26, 100989. [Google Scholar] [CrossRef]
- Su, Y.-S.; Hsiao, K.-C.; Sireesha, P.; Huang, J.-Y. Lithium Silicates in Anode Materials for Li-Ion and Li Metal Batteries. Batteries 2022, 8, 2. [Google Scholar] [CrossRef]
- Houache, M.S.E.; Yim, C.-H.; Karkar, Z.; Abu-Lebdeh, Y. On the Current and Future Outlook of Battery Chemistries for Electric Vehicles Mini Review. Batteries 2022, 8, 70. [Google Scholar] [CrossRef]
- Muldoon, J.; Bucur, C.B.; Gregory, T. Fervent Hype behind Magnesium Batteries: An Open Call to Synthetic Chemists-Electrolytes and Cathodes Needed. Angew. Chem. -Int. Ed. 2017, 56, 12064–12084. [Google Scholar] [CrossRef]
- Ponrouch, A.; Bitenc, J.; Dominko, R.; Lindahl, N.; Johansson, P.; Palacin, M.R. Multivalent rechargeable batteries. Energy Storage Mater. 2019, 20, 253–262. [Google Scholar] [CrossRef]
- Bucur, C.B.; Gregory, T.; Oliver, A.G.; Muldoon, J. Confession of a Magnesium Battery. J. Phys. Chem. Lett. 2015, 6, 3578–3591. [Google Scholar] [CrossRef]
- Gautam, G.S.; Hannah, D.C.; Malik, R.; Liu, M.; Canepa, P.; Sai Gautam, G.; Gallagher, K.G.; Persson, K.A.; Ceder, G. Odyssey of Multivalent Cathode Materials: Open Questions and Future Challenges. Chem. Rev. 2017, 117, 4287–4341. [Google Scholar] [CrossRef]
- Aurbach, D.; Choi, J.W. Promise and reality of post-lithium-ion batteries with high energy densities. Nat. Rev. Mater. 2016, 1, 16013. [Google Scholar] [CrossRef]
- Zeng, W.; Li, Y.; Kuang, C. A Review of Electrode for Rechargeable Magnesium Ion Batteries. J. Nanosci. Nanotechnol. 2019, 19, 12–25. [Google Scholar] [CrossRef]
- Bucur, C.B.; Gregory, T.; Muldoon, J. Quest for Nonaqueous Multivalent Secondary Batteries: Magnesium and Beyond. Chem. Rev. 2014, 114, 11683–11720. [Google Scholar] [CrossRef]
- Lu, Z.; Schechter, A.; Gofer, Y.; Gizbar, H.; Aurbach, D.; Turgeman, R.; Cohen, Y.; Moshkovich, M.; Levi, E. Prototype systems for rechargeable magnesium batteries. Nature 2000, 407, 724–727. [Google Scholar] [CrossRef]
- Xu, J.; Wei, Z.; Liu, H.; Li, Y.; Mei, L.; Ma, J.; Dou, S. Chevrel Phase Mo6T8(T=S, Se) as Electrodes for Advanced Energy Storage. Small 2017, 13, 1701441. [Google Scholar] [CrossRef]
- Bonnick, P.; Nazar, L.F.; Sun, X. Layered TiS2 Positive Electrode for Mg Batteries. Acs Energy Lett. 2016, 1, 297–301. [Google Scholar] [CrossRef]
- Chou, C.-Y.; Yang, C.-H.; Lee, T.-C.; Chang, J.-K.; Hsu, C.-J. MoS2/graphene cathodes for reversibly storing Mg2+ and Mg2+/Li+ in rechargeable magnesium-anode batteries. Chem. Commun. 2016, 52, 1701–1704. [Google Scholar] [CrossRef]
- Devaraju, M.K.; Nakayasu, Y.; Tamura, N.; Sasaki, Y.; Truong, Q.D.; Kempaiah Devaraju, M.; Tomai, T.; Honma, I. Exfoliated MoS2 and MoSe2 Nanosheets by a Supercritical Fluid Process for a Hybrid Mg–Li-Ion Battery. Acs Omega 2017, 2, 2360–2367. [Google Scholar] [CrossRef]
- Fan, L.-Z.; Jiao, L.; Liu, Y. Graphene intercalated in graphene-like MoS2: A promising cathode for rechargeable Mg batteries. J. Power Source 2017, 340, 104–110. [Google Scholar] [CrossRef]
- Liang, Y.; Feng, R.; Yang, S.; Ma, H.; Liang, J.; Chen, J. Rechargeable Mg Batteries with Graphene-like MoS2 Cathode and Ultrasmall Mg Nanoparticle Anode. Adv. Mater. 2011, 23, 640–643. [Google Scholar] [CrossRef]
- Jiao, L.; Wu, Q.; Du, J.; Zhao, Y.; Liu, Y.; Si, Y.; Wang, Y.; Yuan, H. Sandwich-structured graphene-like MoS2/C microspheres for rechargeable Mg batteries. J. Mater. Chem. A 2013, 1, 5822–5826. [Google Scholar] [CrossRef]
- Liang, Y.; Dong, H.; Lin, J.; Wang, H.; Yoo, H.D.; Liu, Y.; Ma, L.; Wu, T.; Li, Y.; Ru, Q.; et al. Fast kinetics of magnesium monochloride cations in interlayer-expanded titanium disulfide for magnesium rechargeable batteries. Nat. Commun. 2017, 8, 339. [Google Scholar] [CrossRef] [Green Version]
- Shi, L.; Zhang, Y.; Liu, Z.; Chen, K. Scalable chemical-vapour-deposition growth of three-dimensional graphene materials towards energy-related applications. Chem. Soc. Rev. 2018, 47, 3018–3036. [Google Scholar] [CrossRef]
- Zhou, F.; Huang, Z.-H.; Yao, W.-T.; Zhang, T.-W.; Tan, Y.-H.; Yao, H.-B.; Lu, L.-L.; Yu, S.-H. MoS2-Nanosheet-Decorated Carbon Nanofiber Composites Enable High-Performance Cathode Materials for Mg Batteries. Chemelectrochem 2018, 5, 996–1001. [Google Scholar] [CrossRef]
- Biswas, S.; Rani, J.V.; Latha, M. Application of WS2-G composite as cathode for rechargeable magnesium batteries. Ionics 2020, 26, 3395–3404. [Google Scholar] [CrossRef]
- Regulacio, M.D.; Nguyen, D.T.; Horia, R.; Seh, Z.W. Designing Nanostructured Metal Chalcogenides as Cathode Materials for Rechargeable Magnesium Batteries. Small 2021, 17, 2007683. [Google Scholar] [CrossRef]
- Wei, Z.; Liao, J.; Ni, W.; Wang, C.; Huang, J.; Ma, J. Molybdenum and tungsten chalcogenides for lithium/sodium-ion batteries: Beyond MoS2. J. Energy Chem. 2019, 33, 100–124. [Google Scholar] [CrossRef]
- Yu, X.; Zhang, L.; Zhou, F.; Liang, Y.; Zhang, X.; Wang, R. Molybdenum Phosphide/Carbon Nanotube Hybrids as pH-Universal Electrocatalysts for Hydrogen Evolution Reaction. Adv. Funct. Mater. 2018, 28, 1706523. [Google Scholar] [CrossRef]
- Salama, M.; Yoo, H.D.; Gofer, Y.; Park, J.-B.; Shterenberg, I.; Sun, Y.-K.; Aurbach, D. Evaluation of (CF3SO2)2N− (TFSI) Based Electrolyte Solutions for Mg Batteries. J. Electrochem. Soc. 2015, 162, A7118–A7128. [Google Scholar] [CrossRef]
- Chen, W.; Huang, J.; Yan, C.; Sun, H.; Lei, T.; Wang, C.; Zhang, W.; Li, Y.; Xiong, J. Multi-Functional Layered WS2 Nanosheets for Enhancing the Performance of Lithium-Sulfur Batteries. Adv. Energy Mater. 2017, 7, 1601843. [Google Scholar] [CrossRef]
- David, L.; Singh, G.; Bhandavat, R. Synthesis of Surface-Functionalized WS2 Nanosheets and Performance as Li-Ion Battery Anodes. J. Phys. Chem Lett. 2012, 3, 1523–1530. [Google Scholar] [CrossRef]
- Dou, S.; Wang, G.; Su, D. WS2@graphene nanocomposites as anode materials for Na-ion batteries with enhanced electrochemical performances. Chem. Commun. 2014, 50, 4192–4195. [Google Scholar] [CrossRef]
- Liao, J.; Chen, C.; Yang, J.; Chen, J.; Song, Y.; Gong, F.; Wang, S.; Xu, Z.; Wu, M. Controllable morphologies and electrochemical performances of self-assembled nano-honeycomb WS2 anodes modified by graphene doping for lithium and sodium ion batteries. Carbon 2019, 142, 697–706. [Google Scholar] [CrossRef]
- Padya, B.; Venkatesh, L.; Chakravadhanula, V.S.K.; Pandey, A.K.; Adigilli, H.K.; Joardar, J. Oxidation of 2D-WS2 nanosheets for generation of 2D-WS2/WO3 heterostructure and 2D and nanospherical WO3. Phys. Chem. Chem. Phys. 2019, 21, 25139–25147. [Google Scholar] [CrossRef]
- Kyotani, T.; Tomita, A.; Sharma, A.; Kyotani, T.; Tomita, A. Comparison of structural parameters of PF carbon from XRD and HRTEM techniques. Carbon 2000, 38, 1977–1984. [Google Scholar] [CrossRef]
- Le Bail, A. Whole powder pattern decomposition methods and applications: A retrospection. Powder Diffr. 2005, 20, 316–326. [Google Scholar] [CrossRef]
- Rodriguez-Carvajal, J. Recent developments of the program FULLPROF, commission on powder diffraction. IUCr Newsl. 2001, 26, 12–19. [Google Scholar]
- Finger, L.W.; Cox, D.E.; Jephcoat, A.P. A correction for powder diffraction peak asymmetry due to axial divergence. J. Appl. Crystallogr. 1994, 27, 892–900. [Google Scholar] [CrossRef]
- Diesner, K.; Fiechter, S.; Moser, J.H.; Levy, F.; Ennaoui, A.; Lévy, F. Structural analysis of 2H–WS2 thin films by X-ray and TEM investigation. Thin Solid Films 1997, 311, 146–150. [Google Scholar] [CrossRef]
- Jha, R.; Guha, P. An effective liquid-phase exfoliation approach to fabricate tungsten disulfide into ultrathin two-dimensional semiconducting nanosheets. J. Mater. Sci. 2017, 52, 7256–7268. [Google Scholar] [CrossRef]
- Wang, Y.; Roller, J.; Maric, R. Morphology-Controlled One-Step Synthesis of Nanostructured LiNi1/3Mn1/3Co1/3O2 Electrodes for Li-Ion Batteries. ACS Omega 2018, 3, 3966–3973. [Google Scholar] [CrossRef]
- Attias, R.; Hirsch, B.; Yemini, R.; Gofer, Y.; Salama, M.; Noked, M.; Aurbach, D. On the Feasibility of Practical Mg–S Batteries: Practical Limitations Associated with Metallic Magnesium Anodes. ACS Appl. Mater. Interfaces 2018, 10, 36910–36917. [Google Scholar] [CrossRef]
- Dong, S.; Cui, Z.; Du, A.; Li, G.; Zhang, Z.; Cui, G. Rechargeable Magnesium Batteries using Conversion-Type Cathodes: A Perspective and Minireview. Small Methods 2018, 2, 1800020. [Google Scholar] [CrossRef]
- Choi, S.H.; Boo, S.J.; Lee, J.-H.; Kang, Y.C. Electrochemical properties of tungsten sulfide–carbon composite microspheres prepared by spray pyrolysis. Sci. Rep. 2014, 4, 5755. [Google Scholar] [CrossRef] [PubMed]
- Zhang, R.; Bao, J.; Pan, Y.; Sun, C.-F. Highly reversible potassium-ion intercalation in tungsten disulfide. Chem. Sci. 2019, 10, 2604–2612. [Google Scholar] [CrossRef]
- Wu, Y.; Xu, Y.; Li, Y.; Lyu, P.; Wen, J.; Zhang, C.; Zhou, M.; Fang, Y.; Zhao, H.; Kaiser, U.; et al. Unexpected intercalation-dominated potassium storage in WS2 as a potassium-ion battery anode. Nano Res. 2019, 12, 2997–3002. [Google Scholar] [CrossRef]
- Gujarathi, A.M.; Al Rawahi, N.; Mohammadi, M.; Vakili-Nezhaad, G.R. Performance of WS2 monolayers as a new family of anode materials for metal-ion (Mg, Al and Ca) batteries. Mater. Chem. Phys. 2019, 230, 114–121. [Google Scholar] [CrossRef]
- Wang, D.; Di, Y.; Wei, L.; Liu, B.; Zhao, Y.; Wang, X.; Chen, G.; Wei, Y. Superior Mg2+ storage properties of VS2 nanosheets by using an APC-PP14Cl/THF electrolyte. Energy Storage Mater. 2019, 23, 749–756. [Google Scholar] [CrossRef]
- Chen, R.; Yan, C.; Zhao, P.; Hu, Y.; Xue, X.; Kong, W.; Lin, H.; Wang, L.; Jin, Z. One-Step Synthesis of 2-Ethylhexylamine Pillared Vanadium Disulfide Nanoflowers with Ultralarge Interlayer Spacing for High-Performance Magnesium Storage. Adv. Energy Mater. 2019, 9, 1900145. [Google Scholar] [CrossRef]
- Du, C.L.; Zhu, Y.Q.; Wang, Z.T.; Wang, L.Q.; Younas, W.; Ma, X.L.; Cao, C.B. Cuprous Self-Doping Regulated Mesoporous CuS Nanotube Cathode Materials for Rechargeable Magnesium Batteries. Acs Appl. Mater. Interfaces 2020, 12, 35035–35042. [Google Scholar] [CrossRef]
- Wang, Z.; Zhu, Y.; Peng, H.; Du, C.; Ma, X.; Cao, C. Microwave-induced phase engineering of copper sulfide nanosheets for rechargeable magnesium batteries. Electrochim. Acta 2021, 374, 137965. [Google Scholar] [CrossRef]
- Huang, J.; Zhu, Y.; Du, C.; Han, Z.; Yao, X.; Yang, X.; Cao, Y.; Zhang, Y.; Ma, X.; Cao, C. Hierarchical nanosheet-assembled copper sulfide microspheres as the cathode materials for rechargeable magnesium batteries. Electrochim. Acta 2021, 388, 138619. [Google Scholar] [CrossRef]
- Bonnick, P.; Duffort, V.; Liu, M.; Rong, Z.; Sun, X.; Persson, K.A.; Ceder, G.; Nazar, L.F. A high capacity thiospinel cathode for Mg batteries. Energy Environ. Sci. 2016, 9, 2273–2277. [Google Scholar] [CrossRef]
- Guan, X.; Lv, R.; Wang, D.; Liu, P.; Zhang, J.; Luo, J. Rechargeable Mg metal batteries enabled by a protection layer formed in vivo. Energy Storage Mater. 2020, 26, 408–413. [Google Scholar] [CrossRef]
- Wu, C.; Zhao, G.; Yu, X.; Liu, C.; Lyu, P.; Maurin, G.; Le, S.; Sun, K.; Zhang, N. MoS2/graphene heterostructure with facilitated Mg-diffusion kinetics for high-performance rechargeable magnesium batteries. Chem. Eng. J. 2021, 412, 128736. [Google Scholar] [CrossRef]
- Wu, C.L.; Zhang, L.; Zhao, G.Y.; Yu, X.B.; Liu, C.; He, J.J.; Sun, K.N.; Zhang, N.Q. Interlayer-Expanded MoS2 Containing Structural Water with Enhanced Magnesium Diffusion Kinetics and Durability. Chemelectrochem 2021, 8, 4559–4563. [Google Scholar] [CrossRef]
Publisher’s Note: MDPI stays neutral with regard to jurisdictional claims in published maps and institutional affiliations. |
© 2022 by the authors. Licensee MDPI, Basel, Switzerland. This article is an open access article distributed under the terms and conditions of the Creative Commons Attribution (CC BY) license (https://creativecommons.org/licenses/by/4.0/).

