Article

Temperature Dependence of Hard Carbon Performance in Sodium Half-Cells with 1 M NaClO4 in EC/DEC Electrolyte

1
School of Chemistry, University of Southampton, Southampton SO17 1BJ, UK
2
School of Engineering, University of Southampton, Southampton SO17 1BJ, UK
*
Author to whom correspondence should be addressed.
Batteries 2022, 8(9), 108; https://doi.org/10.3390/batteries8090108
Submission received: 9 August 2022 / Revised: 17 August 2022 / Accepted: 22 August 2022 / Published: 1 September 2022

Abstract

:
In recent years, sodium-ion batteries (SIBs) have attracted much attention as an alternative to lithium-ion batteries. Hard carbon (HC) is a well-studied anode material for SIBs; however, the performance as a function of temperature is less established. To investigate temperature dependence of the performance of HC, sodium half-cells with a common NaClO4-based electrolyte were tested at temperatures from 10 to 80 °C. Capacity after 20 cycles at 100 mA g−1 current varied from 90 mA h g−1 at 10 °C to 270 mA h g−1 at 60 °C. Increased temperature significantly improves the HC rate capability, with 120 mA h g−1 capacity found at 60 °C with 500 mA g−1 current. Stability was high at moderate temperature with 220 mA h g−1 capacity remaining after 200 cycles at 40 °C with a current of 100 mA g−1.

1. Introduction

Sodium-ion batteries (SIBs) are attracting attention as an alternative to lithium-ion batteries (LIBs) due to the high natural abundance of sodium, their lower cost and their competitive capacity [1]. A significant challenge for SIBs is to develop a high-performance anode material which has low overpotential, large energy density and high stability [2]. Graphite is the most important LIB anode material with a high theoretical capacity of 372 mA h g−1 and low lithium insertion/extraction potential (versus Li/Li+) [3,4]. As Na+ ions have a larger radius than Li+ ions (0.95 Å vs. 0.65 Å, respectively), Na+ intercalation into graphite layers is limited to C64Na and hence the theoretical capacity is low [4,5,6]. Hard carbon (HC), obtained by high temperature carbonisation of precursors including polymers, biomaterials and sugars [7], is a well-studied anode material for SIBs. HC has larger inter-layer distances than graphite and nanopores in its structure that facilitate sodium ion insertion. HCs have maintained over 300 mA h g−1 capacity after 100 cycles [8,9,10], and many papers report HC has high capacity, conductivity and stability at room temperature [11,12,13,14].
Thermal dependence of the behaviour of SIBs might be expected to be similar to that of LIBs due to the similarities in their structures and compositions, and LIBs have been well researched from this perspective in recent decades [15]. In LIBs, the effects of temperature on behaviour are multiple, including the rate of chemical reactions, Li+ diffusion [16], self-discharge [15], thermal runaway [17,18], ionic conductivity of electrolyte [19] and charge-transfer resistance [20]. There are still challenges associated with commercialisation of SIBs, and one of these is to understand the battery performance variation with temperature [21,22,23]. Eshetu et al. studied thermal reactivity of Na-based and Li-based electrolytes by differential scanning calorimetry and showed there is a limited working temperature range for common non-aqueous systems [24]. N-doped HC with 1 mol dm−3 NaClO4 in 3:1 propylene carbonate (PC)/diethylene carbonate (DEC) electrolyte showed good stability at 50 °C, with over 150 mA h g−1 capacity persisting at 15 A g−1 current after 10,000 cycles [25]. Ponrouch et al. [26] tested HC with 1 mol dm−3 NaPF6 in 1:1 EC (ethylene carbonate)/PC mix, finding a reversible capacity of 450 mA h g−1 at 0.1C current and 75 °C. Lin et al. [22] showed that a full SIB cell with HC anode, Na3.5V2(PO4)2F3 cathode and 1 mol dm−3 NaClO4 in 1:1 EC/PC electrolyte had only 25% of the room temperature capacity at −20 °C. Ding et al. [21] reported a HC capacity of just 50 mA h g−1 with 20 mA g−1 current at 0 °C with an ionic liquid (sodium N-methyl-N-propylpyrrolidinium bis(fluorosulfonyl)amide) electrolyte. However, Hou et al. [27] showed that low temperature performance can be achieved through electrolyte choice, with over 215 mA h g−1 capacity at −15 °C and 500 mA g−1 after 1000 cycles, using NaCF3SO3 in diglyme as the electrolyte.
Despite the interest in HC as an electrode material, there has been limited research on the temperature dependence of its performance in SIBs. There is no reported data for one of the most common electrolytes: 1 mol dm−3 NaClO4 in 1:1 EC/DEC mix. In this paper, HC was prepared from cotton wool and sodium half-cells using electrolytes that were tested at temperatures between 10 and 80 °C. A significant reduction in performance was found below room temperature, and improvements above 25 °C. Reaction kinetics of HC and electrolyte performance are discussed at high and low temperature.

2. Experimental

2.1. Synthesis of Hard Carbon

The preparation method for HC has been reported previously, and the material provides high performance in sodium half-cells [28]. Briefly, 5 g cotton wool (Fisher Scientific Azpack™, Loughborough, UK, British Pharmacopoeia quality) was wetted with deionised water, placed in an Al2O3 crucible and dried over night at 120 °C. Carbonisation was carried out by heating at 4 °C min−1 to 1400 °C and then maintaining that temperature for 2 h under a 0.5 L min−1 Ar flow in a tube furnace. After carbonisation, the HC foam that was shaped to the crucible was ground to a powder by hand.

2.2. Material Characterisation

HC was characterised by X-ray diffraction (XRD) with a Cu-Kα source (Rigaku SmartLab, Tokyo, Japan, in capillary transmission mode). Scanning electron microscopy (SEM) used a Philips XL30 SEM at 10 kV. The Raman spectra were collected with a Renishaw inVia Raman microscope with a laser wavelength of 785 nm and an energy of 7.08 mW. The surface area was obtained and analysed with a Micromeritics TriStar II and ASAP 2460 software.

2.3. Electrochemistry Evaluation

HC inks contained 95% HC and 5% polyvinylidene difluoride (PVDF, Solef® 5130) binder. Firstly, 0.0263 g 10% PVDF in N-methyl-2-pyrrolidone (NMP, Sigma-Aldrich, USA, 99.5%) solution was diluted in 100 μL NMP and stirred for 1 h. Next, 0.0500 g HC along with a further 50 μL NMP was added, and stirring was continued for a further 2 h. A high-speed homogeniser (IKA, Germany, T25 digital ULTRA-TURRAX®) was then utilised to homogenise the ink at 10 k RPM for 5 min, 15 k RPM for 3 min and 20 k RPM for 2 min. The ink was then evenly coated onto 18 μm-thick carbon-coated Al foil (MTI) with a 50 μm K-bar and dried overnight at room temperature. Finally, 11 mm diameter electrodes were cut with a precision punch (EL-CELL, EL-Cut), and these were pressed at 5 tons. The loading mass of each dry electrode was around 1.1 mg (1.16 mg cm−2).
Sodium half-cells were assembled in Swagelok fittings in a Belle glove box under Ar atmosphere. A thin slice of Na metal (Sigma-Aldrich, France, 99.9%) was used as the counter and pseudo-reference electrode, and the inked active material as the working electrode. The electrolyte was 180 μL of 1 mol dm−3 NaClO4 (Alfa Aesar, Heysham, UK, 98%) in 1:1 EC (Sigma-Aldrich, Germany, 99+%) and DEC (Sigma-Aldrich, Hungary, 99%). Two sheets of Whatman™ GF/A glass microfibre filters (GE Healthcare Life Sciences, China) cut into 12 mm disks were used as separators. All materials mentioned above except DEC were dried in vacuo at least overnight in a Schlenk bottle before transfer into the glove box. New DEC solvent was put in the glovebox directly.
The basic electrochemical performance of the sodium half-cells was measured by cyclic voltammetry (CV), galvanostatic discharge–charge processes and electrochemical impedance spectroscopy. The cells were placed in an environmental chamber (Memmert, Germany, IPP 55 Plus) for work ≤25 °C or an oven (Agar Scientific, UK, MINO/6) for work >25 °C. Electrochemical measurements used Biologics BCS-805 or SP-150 potentiostats and data were recorded with the BT-Lab and EC-Lab software, respectively. CV measurements were typically scanned from 3 to 0.01 V vs. Na+/Na, then the reverse scan from 0.01 to 3 V vs. Na+/Na with 1 mV s−1 scan rate. In galvanostatic cycling, HC was reduced to a 0.001 V vs. Na/Na+ potential limit (sodium insertion) and then oxidised to a 2 V potential limit (sodium extraction). All materials were cycled at least 20 times at 100 mA g−1 specific current, and other currents are as described. Half-cell impedance measurements were carried out between 100 kHz and 0.1 Hz with a potential of 2 V and a 10 mV amplitude. Electrolyte resistances were tested with a Thermo Scientific, Orion™ DuraProbe™, with temperature controlled by a Julabo, F25 controller. The error bars are obtained by considering the maximum and minimum values of each parameter.

3. Results and Discussion

The microstructure of the ground HC derived from cotton wool is presented in Figure 1a. The majority of the HC was observed to be broken into short lengths of 5 μm width microfibres after carbonisation and grinding. The length of the fibres is mainly between 10 and 100 μm. The XRD pattern of HC is displayed in Figure 1b. There are two broad peaks centred at 22.39° and 43.63°, which correspond to the 002 and 100 reflections of the disordered HC structure. The interlayer distance is calculated with the Bragg equation from the d002 to be 0.390 nm, which shows HC has the expected larger inter layer distance compared with graphite (0.334 nm) [9,25,29]. The Raman spectra of the HC (Figure 1c) contained two broad peaks around 1305 and 1595 cm−1, corresponding to disordered (D-band) and ordered graphics (G-band), respectively. The intensity ratio of ID/IG is 1.79, confirming the highly disordered structure of the HC [10,30]. To evaluate the HC porosity and surface area, the N2 adsorption–desorption isotherm of HC is shown in Figure 1d. It possesses a typical type IV hysteresis loop consistent with the expected mesoporous structure of HC. HC has 7.50 m2 g−1 specific surface area and 0.0035 m3 g−1 pore volume. The pore width distribution shows most of the pores are between 2 and 50 nm, in the mesoporous range, with further porosity in the larger macroporous range (Figure 1e).
The conductivities of the electrolyte (1 mol dm−3 NaClO4 in 1:1 EC/DEC) are calculated by [31]:
κ = L / R A
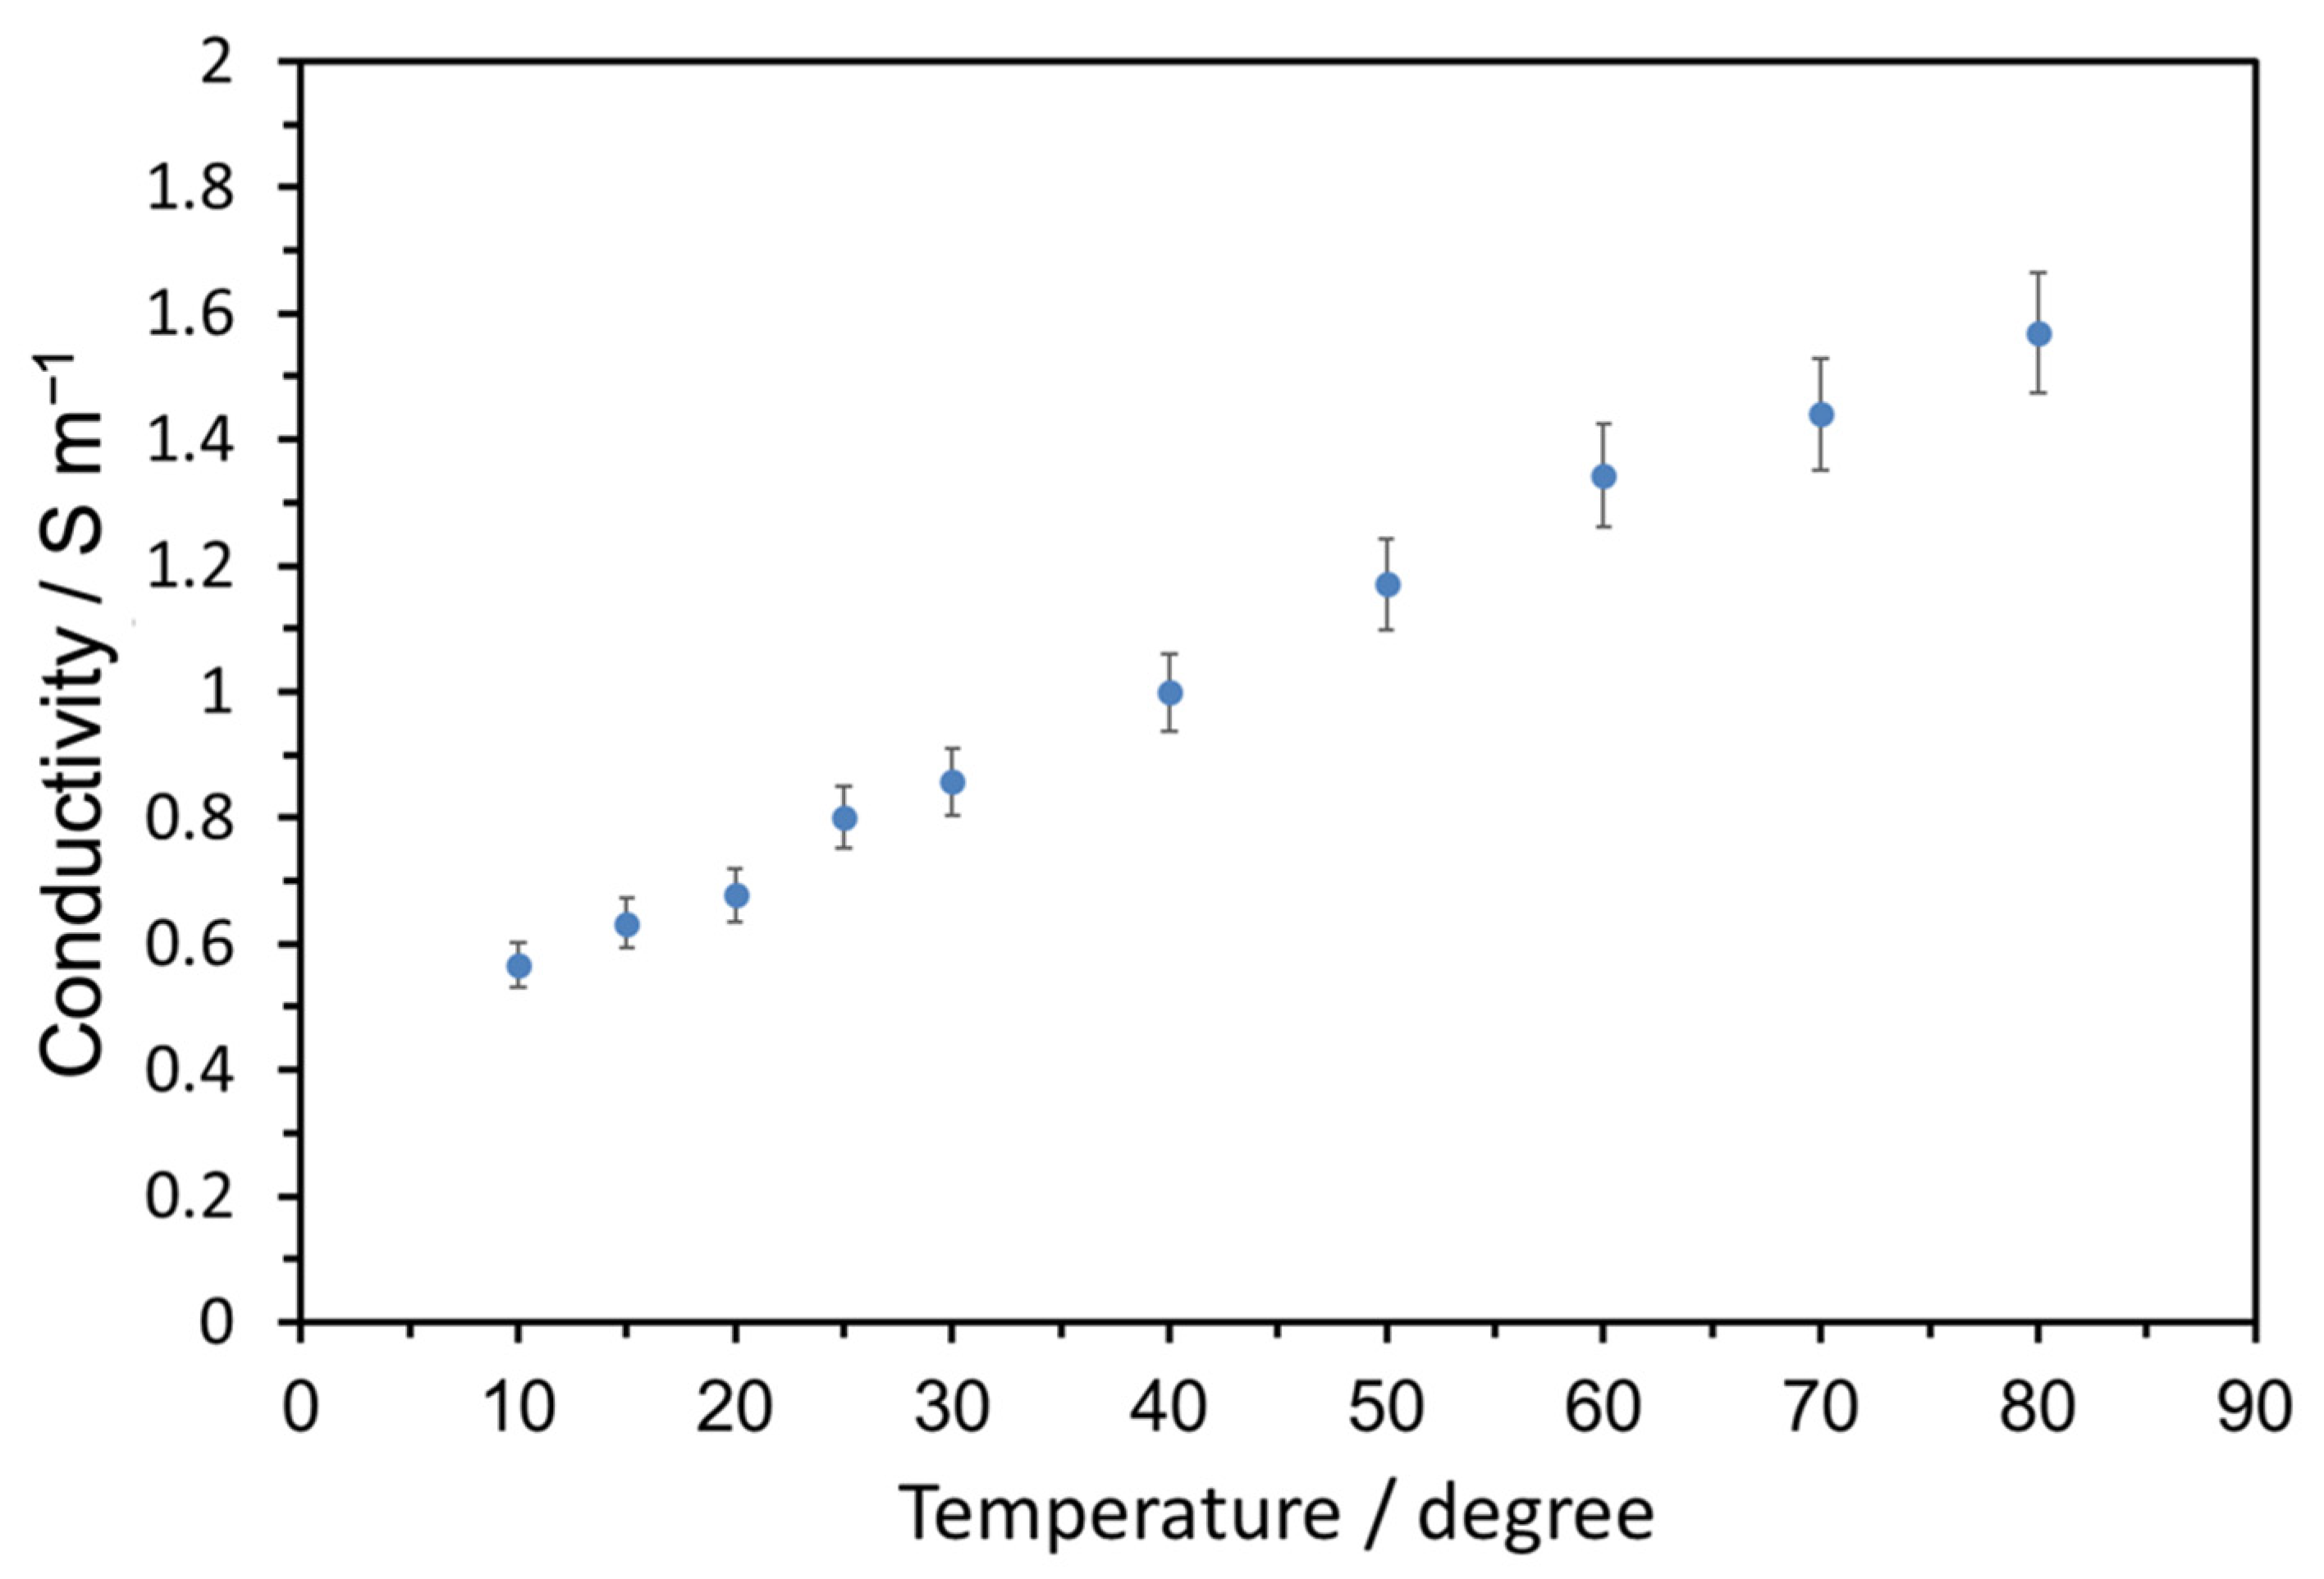
where κ is conductivity, L is distance between electrodes, A is electrode area and R is resistance. As the working and counter electrodes are in a fixed position, L/A is constant and can be obtained by testing standard KCl solutions (Figure S1). For this experimental setup, L/A was calculated to be 317 m−1. The measured electrolyte conductivities are displayed in Figure 2 and increase with temperature as expected [32]. The conductivity at 80 °C is approximately three times that at 10 °C (Table S1) linked to increasing Na+/ClO4 dissociation and decreasing electrolyte viscosity [33]. Holding electrolytes around 20 °C overnight results in some colourless crystals being precipitated, possibly due to EC precipitation (Figure S2). That could result in lower electrolyte conductivity at a lower temperature than that shown in Figure 2.
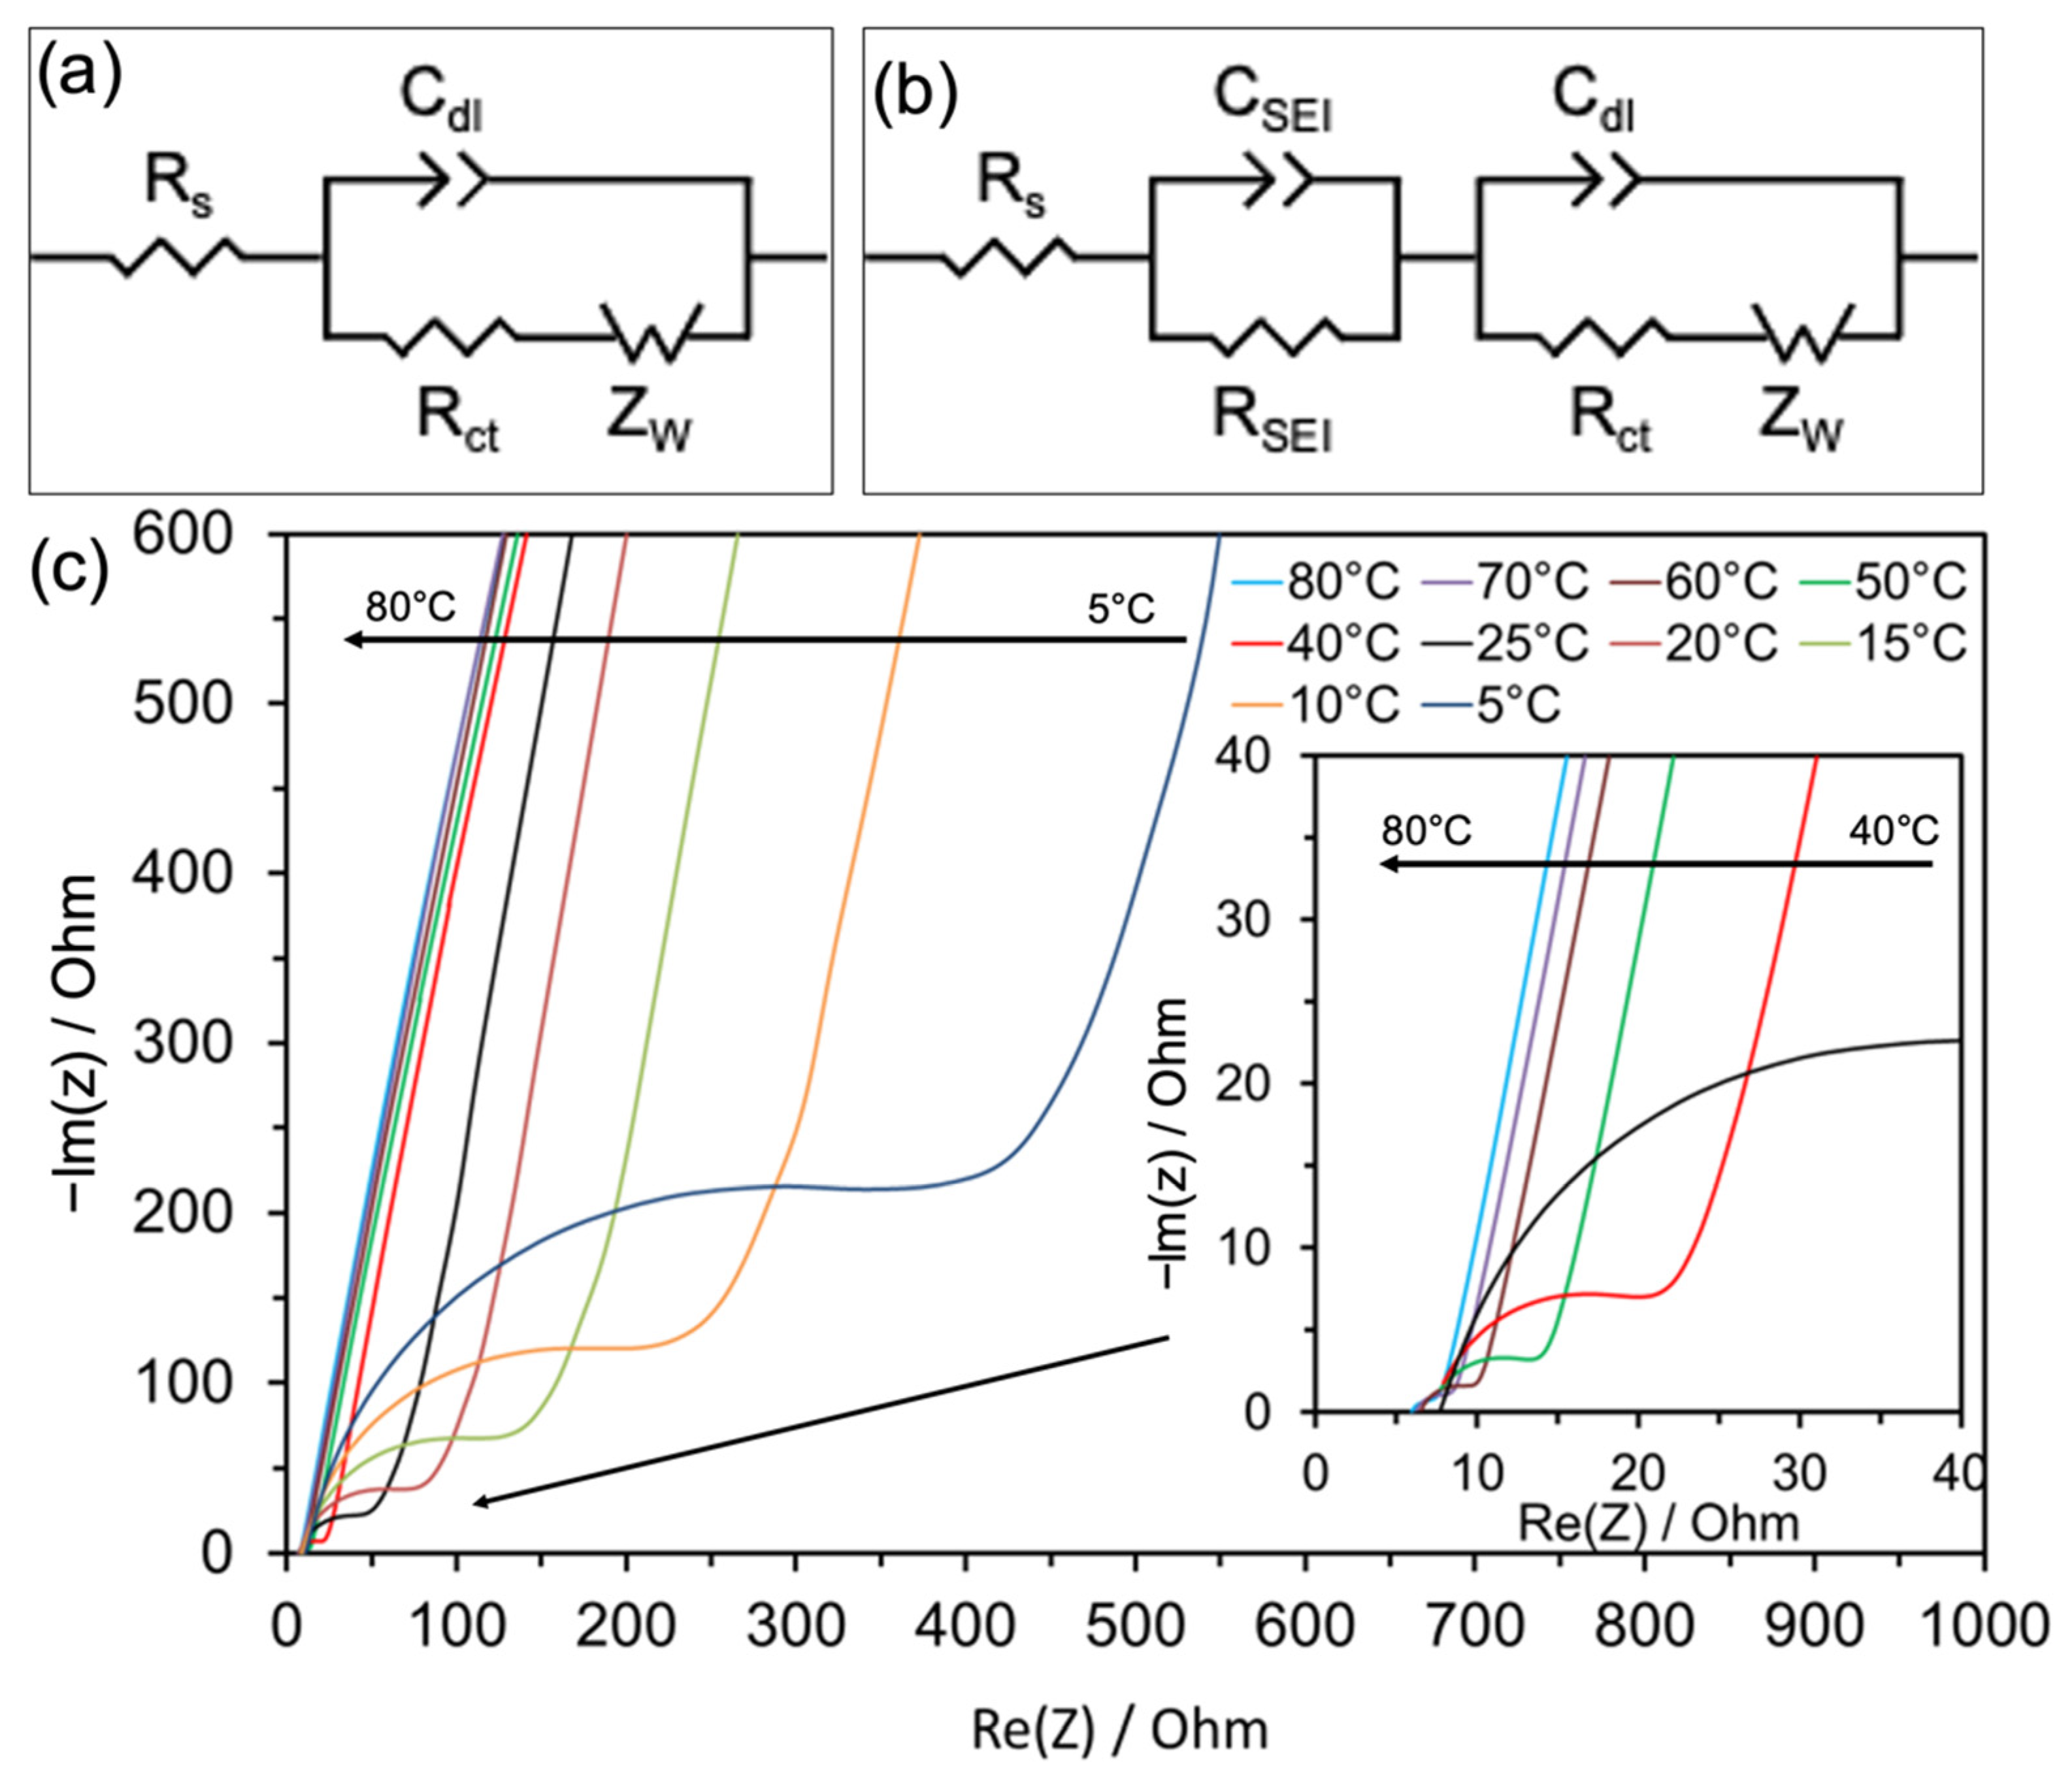
HC-sodium half-cells were tested by electrochemical impedance spectroscopy (EIS) at a series of temperatures with a potential of 2 V vs. Na+/Na and a 10 mV amplitude (Figure 3). A fresh cell was used for each measurement. The equivalent electric circuit components include an uncompensated resistance (Rs), charge transfer resistance (Rct), double layer capacitance (Cdl), resistance and capacitance of the solid electrolyte interphase (RSEI and CSEI) and a Warburg impedance (ZW) corresponding to diffusion of Na+ ions through the electrolyte (Figure 3b) [20,34]. EIS data collected with newly assembled sodium half-cells at 2 V should result in information on the unsodiated HC surfaces. Furthermore, the majority of the SEI layer should form around 1 V in a sodium half-cell [10], so a very thin SEI layer should be present in this testing and the RSEI and CSEI in the equivalent electric circuit can be ignored (Figure 3a). The Nyquist plots are composed of one semicircle in the high-frequency region corresponding to Rct, Cdl and an inclined line in the low-frequency region indicating ZW [25]. It is obvious that the semicircle becomes smaller when increasing temperature and the smallest semicircle is seen at 80 °C. Rs, Rct, exchange current (I0) and heterogeneous rate constant (Ks) are listed in Table 1. I0 and Ks can be described with the Butler–Volmer equation [35]:
I 0 = R T / n F R c t
K s = I 0 / n F A C
where R is the ideal gas constant (8.314 J K−1 mol−1), T is the absolute temperature, n is the number of electrons per molecule during oxidisation, F is Faraday’s constant (96,485.3 C mol−1), A is the surface area of the electrode (0.95 cm2), and C is the concentration of sodium ions (1 × 10⁻³ mol cm−3). Rs increases when reducing temperature due to the previously described changes in conductivity of the electrolyte. However, Rct possesses the largest change in the battery at low temperature, increasing 10-fold from 25 to 5 °C, which indicates smaller I0 and Ks than at 25 °C. Increasing the temperature reduces Rct from 41.9 Ω at 25 °C to 1.94 Ω at 80 °C with corresponding increases in I0 and Ks. Hence, an easier charge transfer is expected as the temperature rises.
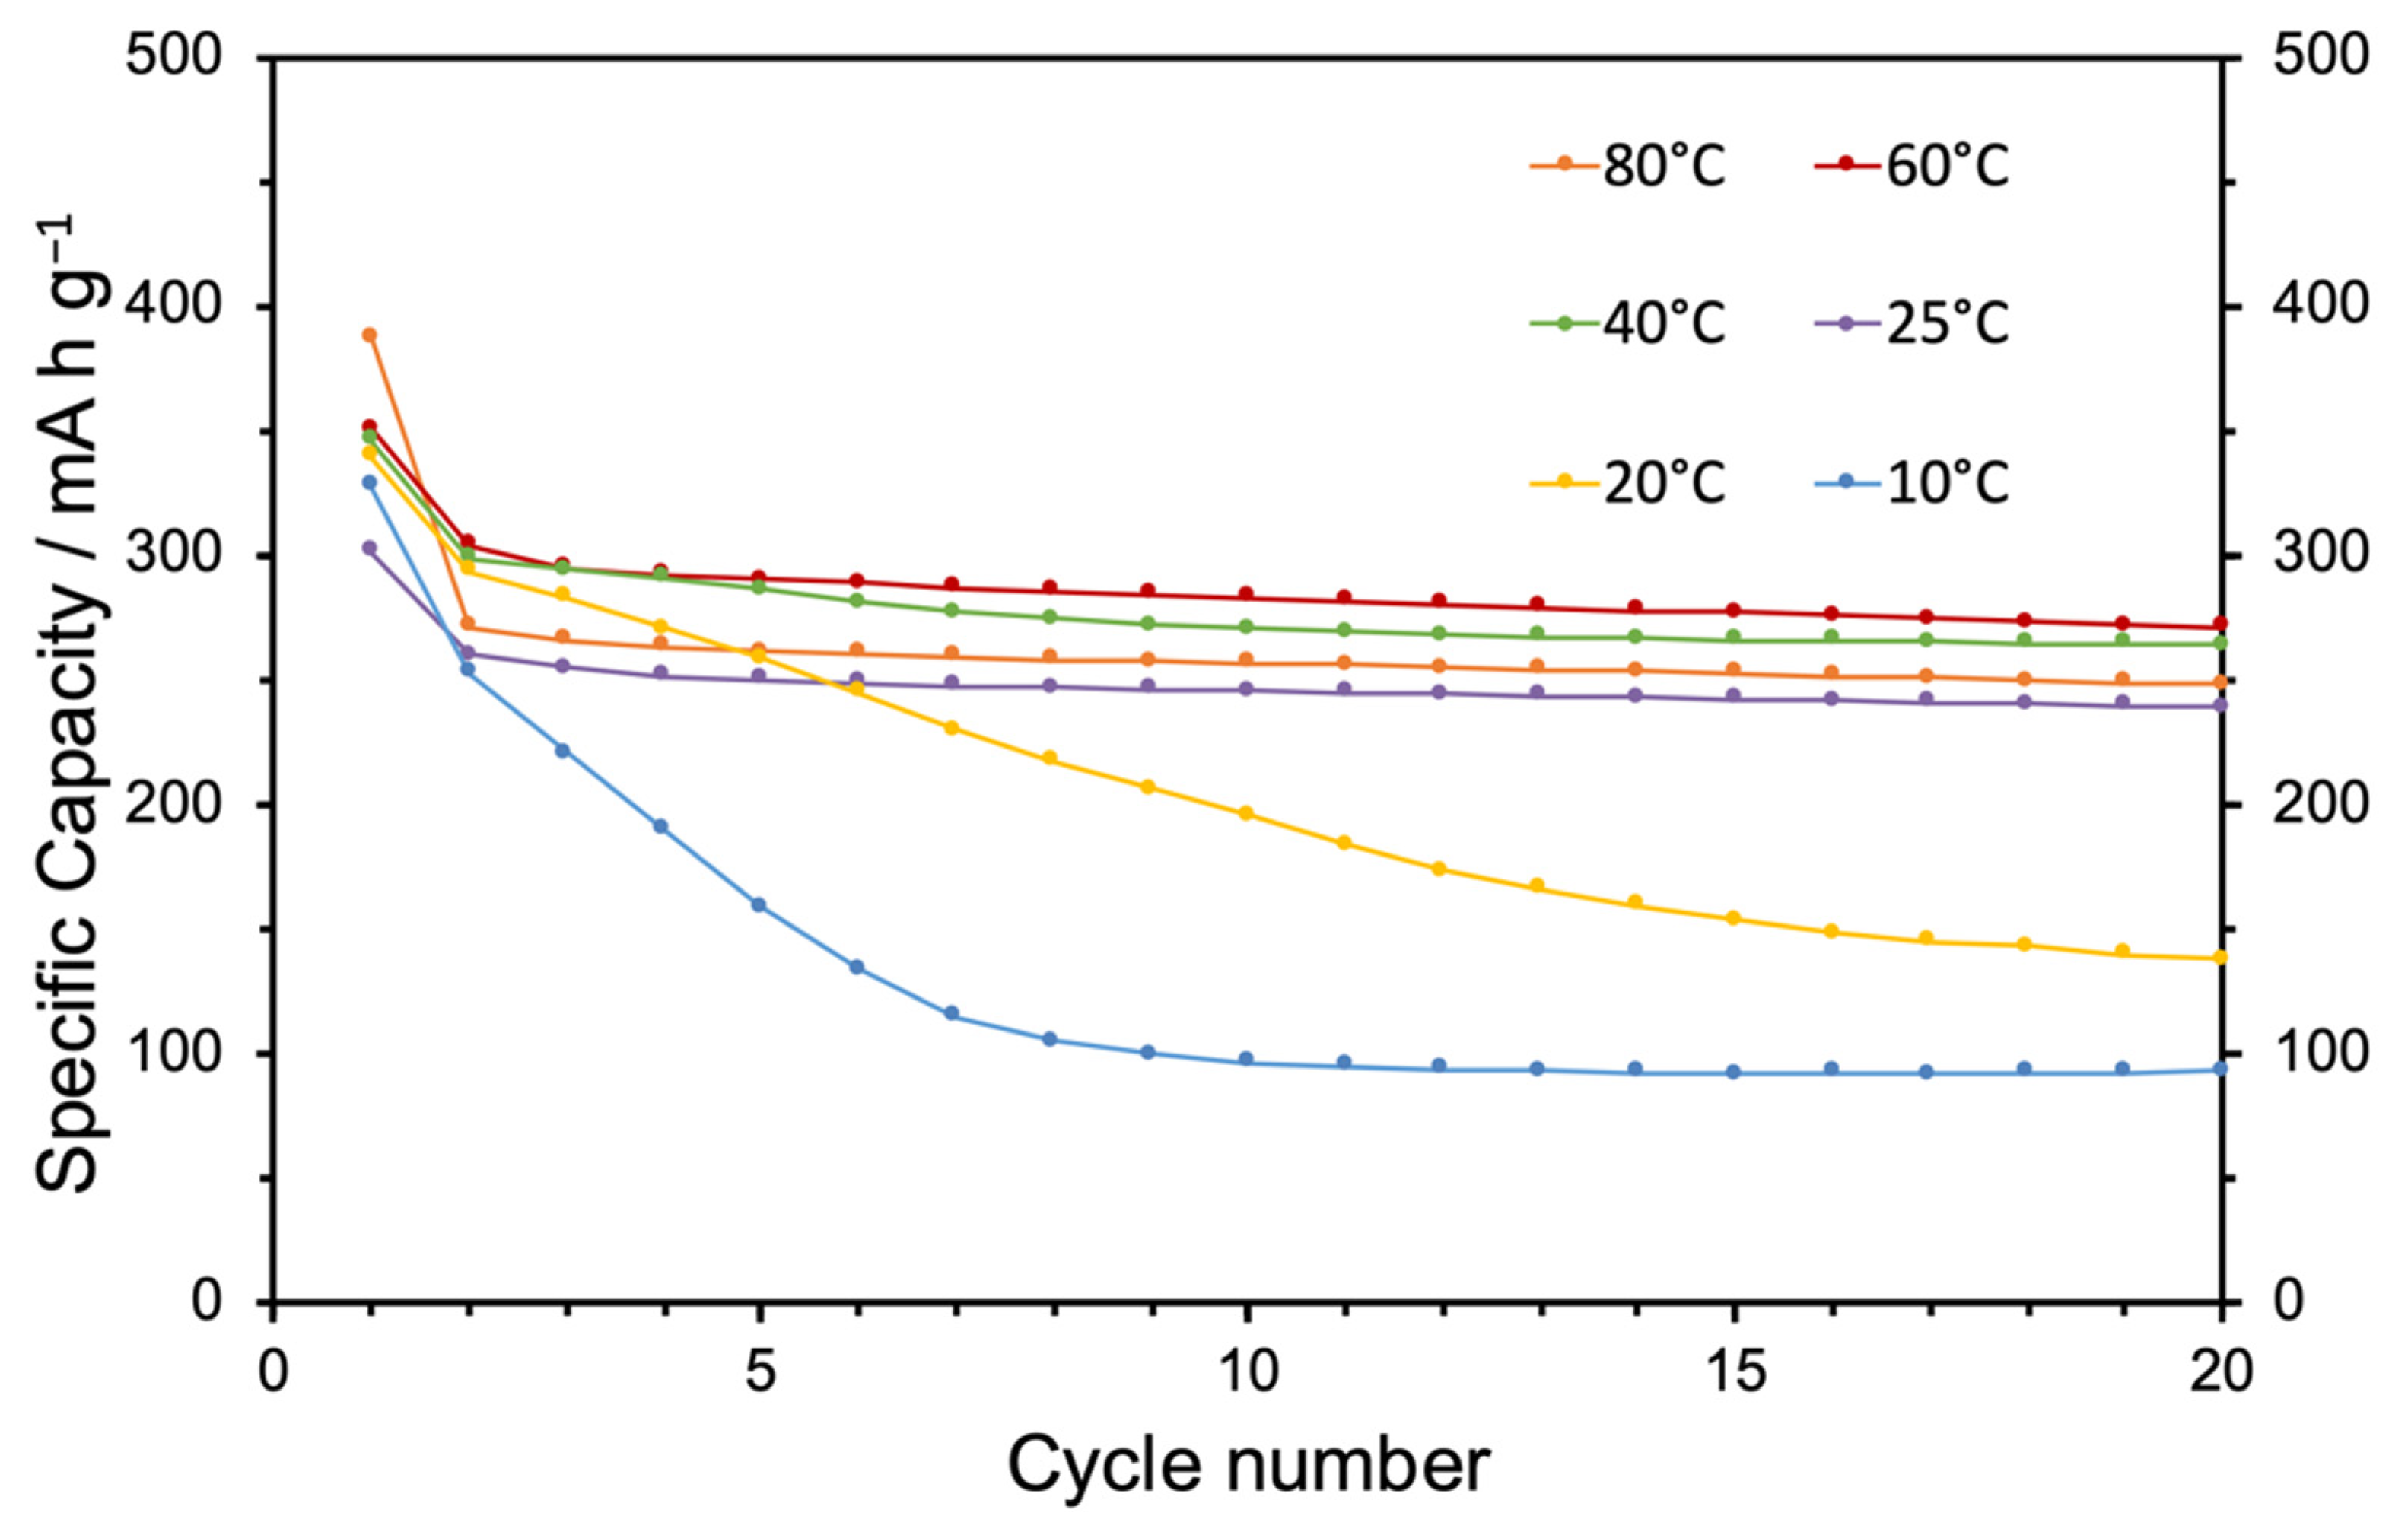
Galvanostatic cycling data for a series of half-cells measured at temperatures from 10 to 80 °C are shown in Figure 4. At 25 °C, HC provides a 300 mA h g−1 initial capacity (Figure S3). Over the first three cycles with 100 mA g−1 current, the reduction capacity (corresponding to discharge capacity of the anode in a SIB) rapidly dropped to circa 250 mA h g−1, and then gradually decreased further to 239 mA h g−1 after 20 cycles. The oxidation capacity (Figure S4) reduces by less than 15 mA h g−1 over 20 cycles. The initial Coulombic efficiency (oxidation capacity divided by reduction capacity) is 83%, and that rises to 99.3% after 20 cycles (Figure S5). When the temperature is below 25 °C, there is a significant capacity drop. At 10 or 15 °C, less than 40% of the initial capacity was retained after 20 cycles (Figures S3–S5). The battery at 10 °C displays a significant drop in capacity over the first few cycles, but becomes stable after 9 cycles. The capacity drops may be due to the high IR drop and slow kinetics which were shown in EIS testing. The large IR drop may shorten the reduction process as the lower potential limit of 0.001 V (vs. Na+/Na) that is applied to avoid sodium plating is reached before the intercalation process is complete [26]. In full cells the high IR drop may lead to Na deposition on the anode, reducing battery capacity and stability. The precipitation of EC from the electrolyte at low temperature may also reduce HC performance. Even just reducing the temperature by 5 °C (measured at 20 °C), the capacity exhibits a continuous decrease during cycling. That means the performance of this HC/electrolyte combination is severely curtailed even at a moderately low temperature.
When the temperature was higher than 25 °C (Figures S6–S8) the highest capacity was exhibited at 60 °C, with around 30 mA h g−1 higher capacity than at 25 °C. However, the separator colour was yellow after 20 cycles at 60 °C, indicating the start of high temperature electrolyte degradation (Figure S9) [24]. This is fairly consistent with differential scanning calorimetry testing by Eshetu. et al., who tested a series of SIB electrolyte reactivities and found that 1 mol dm−3 NaClO4 in 1:1 EC/DEC undergoes exothermic reactions starting at 70 °C [24]. Above 60 °C, the capacity fell with increasing temperature, and at 80 °C, the cell had a similar capacity to that measured at 25 °C. Furthermore, with a rising temperature, the first cycle Coulombic efficiency fell and the 80 °C cell had the lowest first cycle CE in the series at around 66%. The low first cycle efficiency can be attributed to electrolyte degradation in the formation of the SEI. The loss of capacity in subsequent cycling has a similar slope at all temperatures above 25 °C, suggesting good thermal stability of the SEI layers on the time scale of these experiments, although continuous electrolyte degradation may compromise longer term performance.
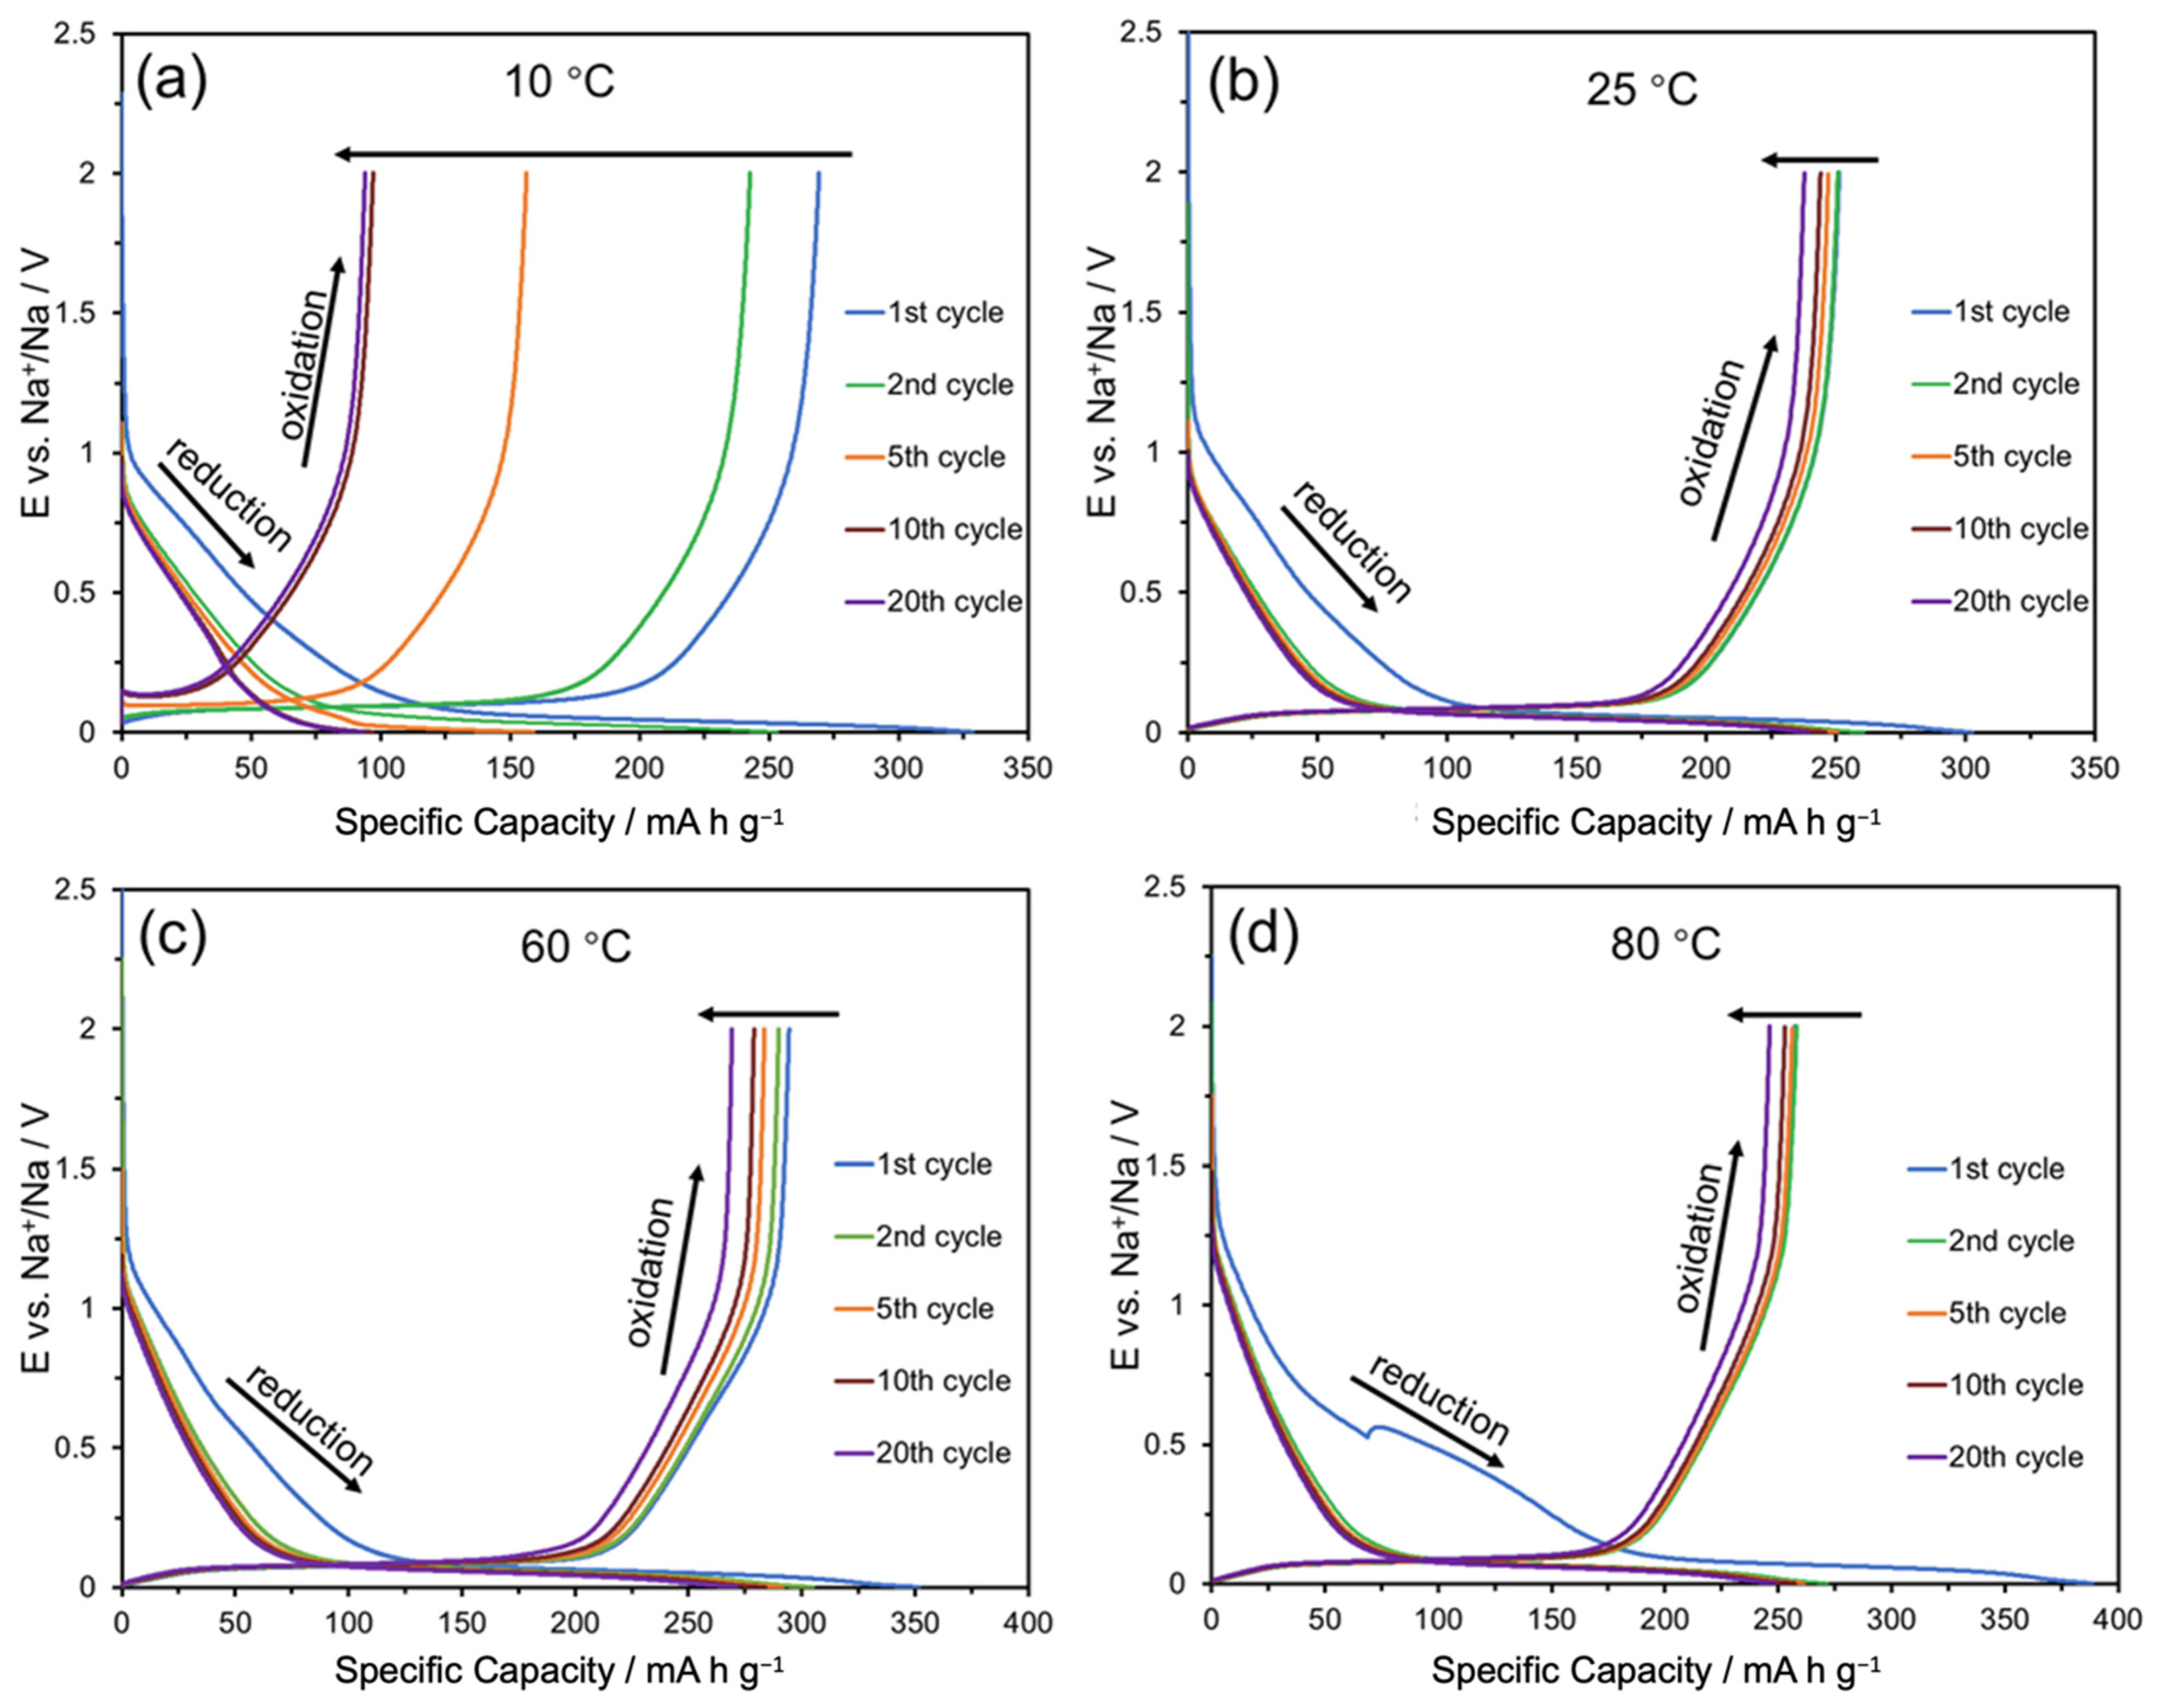
To investigate the mechanism of charge storage using HC at different temperatures, the galvanostatic cycling profiles are plotted in Figure 5, which displays the relationship between potential and capacity directly. At room temperature, there are two obvious regions in the potential plot during the first reduction that are related to the adsorption-intercalation mechanism of HC. The sloped region above 0.1 V is often referred to as the high potential plateau and contains around 100 mA h g−1 capacity due to sodium adsorption on the surfaces of HC nanopores [36,37,38,39]. The long, flat plateau region between 0.1 and 0.001 V corresponds to intercalation of sodium into HC layers and displays a 200 mA h g−1 specific capacity [37]. During oxidation these two regions show around 100 mA h g−1 and 160 mA h g−1 capacity, respectively. In the second cycle, the high potential region had a 30 mA h g−1 loss in its reduction capacity due to irreversible Na+ adsorption and SEI formation. Irreversible Na+ insertion into the HC layers also caused a 10 mA h g−1 lower reduction capacity in the low potential region. At the 20th cycle, even though the high and low potential plateaus are a further 7 mA h g−1 and 14 mA h g−1 lower, the HC maintained 90% and 93% of the reduction capacity seen in the 2nd cycle in these two regions.
For the cell cycling at 10 °C, the first reduction and oxidation curve is similar to that at 25 °C. The capacities have a significant drop in the 2nd cycle and become stable after ~10 cycles. Only 55 mA h g−1 and 40 mA h g−1 reduction capacity were observed in the high and low potential regions, respectively, at the 10th cycle. The capacity of the adsorption mechanism is less affected and provides the majority of the HC capacity. The serious capacity drop associated with the low potential plateau at this temperature can be related to slower Na+ insertion kinetics, slower diffusion in the electrolyte and IR drop at low temperature (i.e., less intercalation before the lower potential limit is reached). Those slower charge transfer kinetics are also manifested in an increasing start in the oxidation potential from 0.03 to 0.15 V after 20 cycles. The CE increases to close to 100% after nine cycles, suggesting that desodiation kinetics are not a limit on capacity.
Despite the signs of electrolyte degradation noted above (separator colour change), the sodium half-cell tested at 60 °C maintains the highest capacity after 20 cycles. Capacities of 120 and 230 mA h g−1 were associated with the adsorption and intercalation mechanisms (respectively) in the first reduction. The first cycle irreversible capacities from the two mechanisms are similar to those at 25 °C. In the second reduction, the capacity of 90 mA h g−1 in the high potential region exceeds the 70 mA h g−1 found at 25 °C, which may be due to the faster adsorption kinetics and electrolyte degradation. Faster intercalation kinetics also add 25 mA h g−1 capacity in the low potential region for the second reduction. Even though the oxidation capacity falls by 24 mA h g−1 over the first 20 cycles, a larger drop than that at 25 °C, the cell still displays a high stability after 20 cycles with 89% reversible reduction capacity in the first cycle. The cell at 40 °C shows a similar curve to the 60 °C cell, with 45 mA h g−1 more capacity in the first reduction process than observed at 25 °C, and around 30 mA h g−1 capacity drop over the first 20 cycles (Figure S10).
The cell tested at 80 °C has the highest initial reduction in capacity and shows low initial Coulombic efficiency. The majority of the irreversible capacity is from the high potential region with over 100 mA h g−1, which relates to electrolyte degradation when forming the SEI layer. The shape of the first reduction scan (Figure 5d) reveals the extra charge consumed during SEI layer formation alongside electrolyte degradation at 80 °C. In the low potential region, only 195 mA h g−1 capacity is observed in the first reduction process, which is less than that at 25 °C. Electrolyte degradation may be affecting access to sites inside the HC fibres, with a resulting loss in capacity due to the intercalation mechanism. In the second reduction, the 90 mA h g−1 adsorption capacity is similar to that found at 60 °C, but intercalation capacity is only 183 mA h g−1. After the first cycle, the cell became stable and only lost a further 20 mA h g−1 of specific capacity after 20 cycles, which indicates the electrolyte degradation mainly causes capacity loss in the first cycle. Furthermore, the observed capacity at this temperature is already close to the highest values observed with this type of HC.
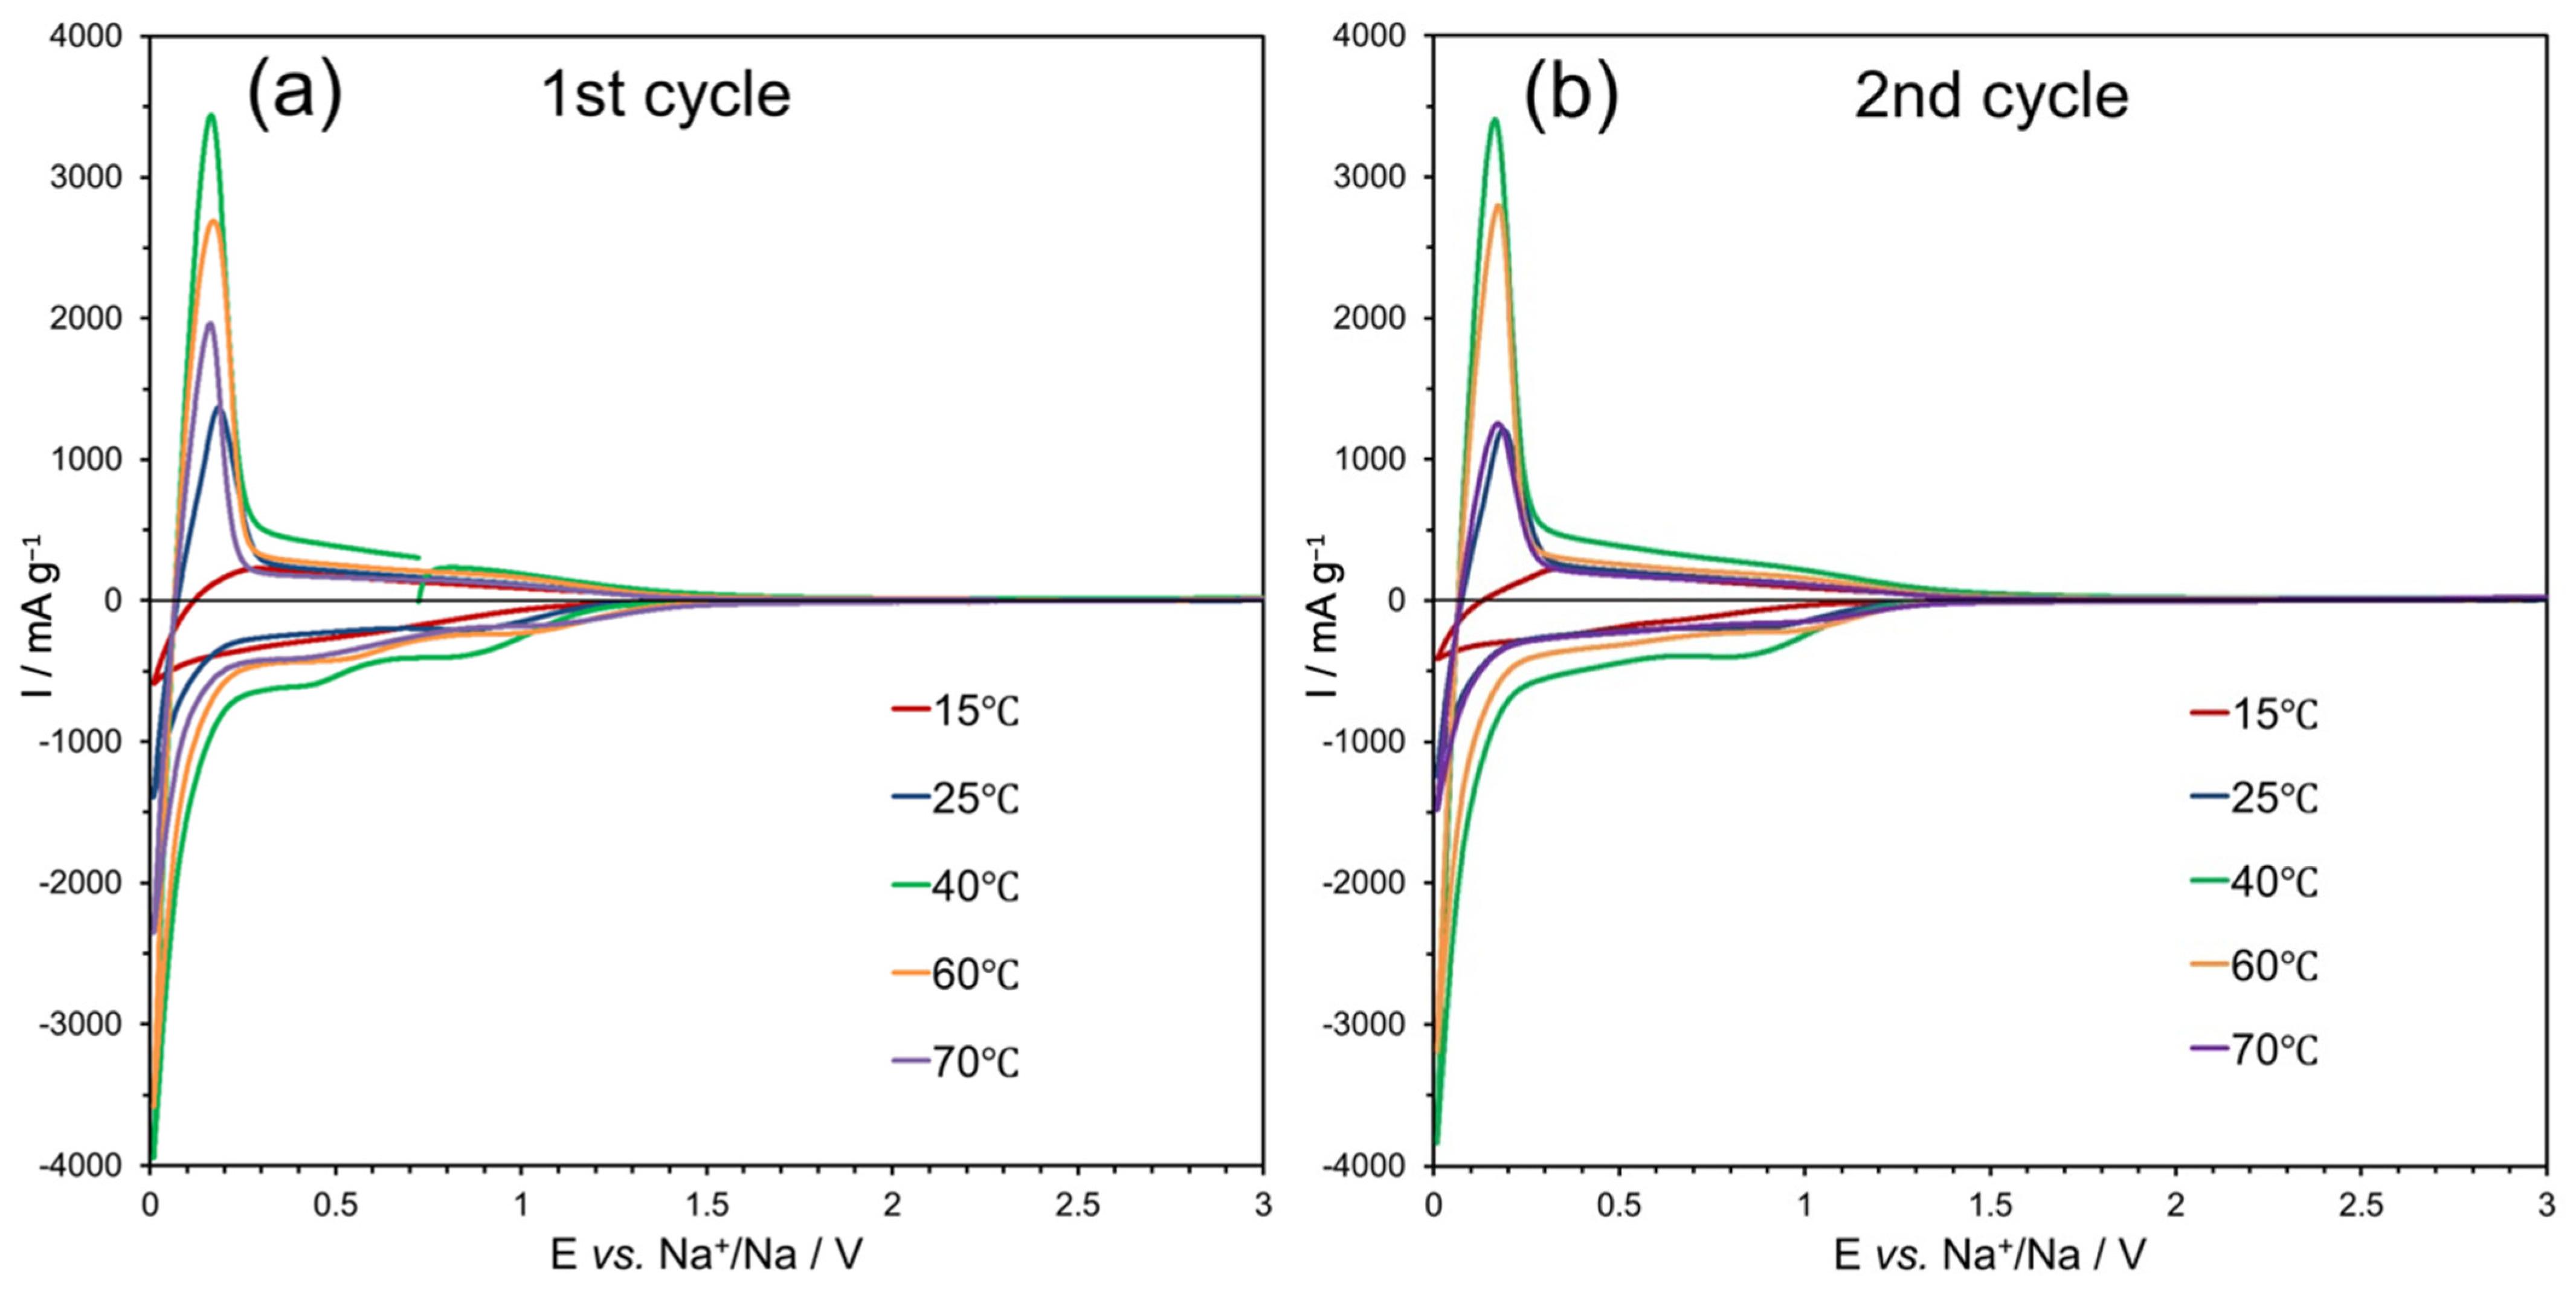
Figure 6a shows the first CV cycle at a HC electrode at temperatures from 15 to 70 °C in the range of 3 to 0.01 V at a scan rate of 1 mV s−1. There are three cathodic peaks at 1, 0.5 and circa 0 V vs. Na+/Na in the first cycle, which correspond to the SEI formation, adsorption and intercalation mechanisms, respectively [8,10,13]. Furthermore, the electrolyte was tested with CV by Eshetu and co-workers, who showed stability between 0 and 3 V vs. Na+/Na [24]. The SEI formation peaks near 1 V are at higher potential in cells studied above 25 °C, suggesting that high temperature leads to quicker formation of the SEI layer. All CV curves have one narrow oxidation peak at 0.1 V and one broad peak between 0.4 and 1 V. The 15 °C CV curve displays the smallest oxidation peak, which means lower HC activity. The oxidation peak size increases with temperature until 40 °C and then further heating decreases its intensity. The smallest potential of oxidation peaks is present at 40 °C, which indicates the lowest IR drop is present at 40 °C. In the second cycle, the 40 and 60 °C oxidation peaks are around the same size as in the first cycle, but the peak intensity from 70 °C drops to around the level seen at 25 °C. Hence, this HC/electrolyte combination has less stability at 70 °C (Figures S11 and S12).
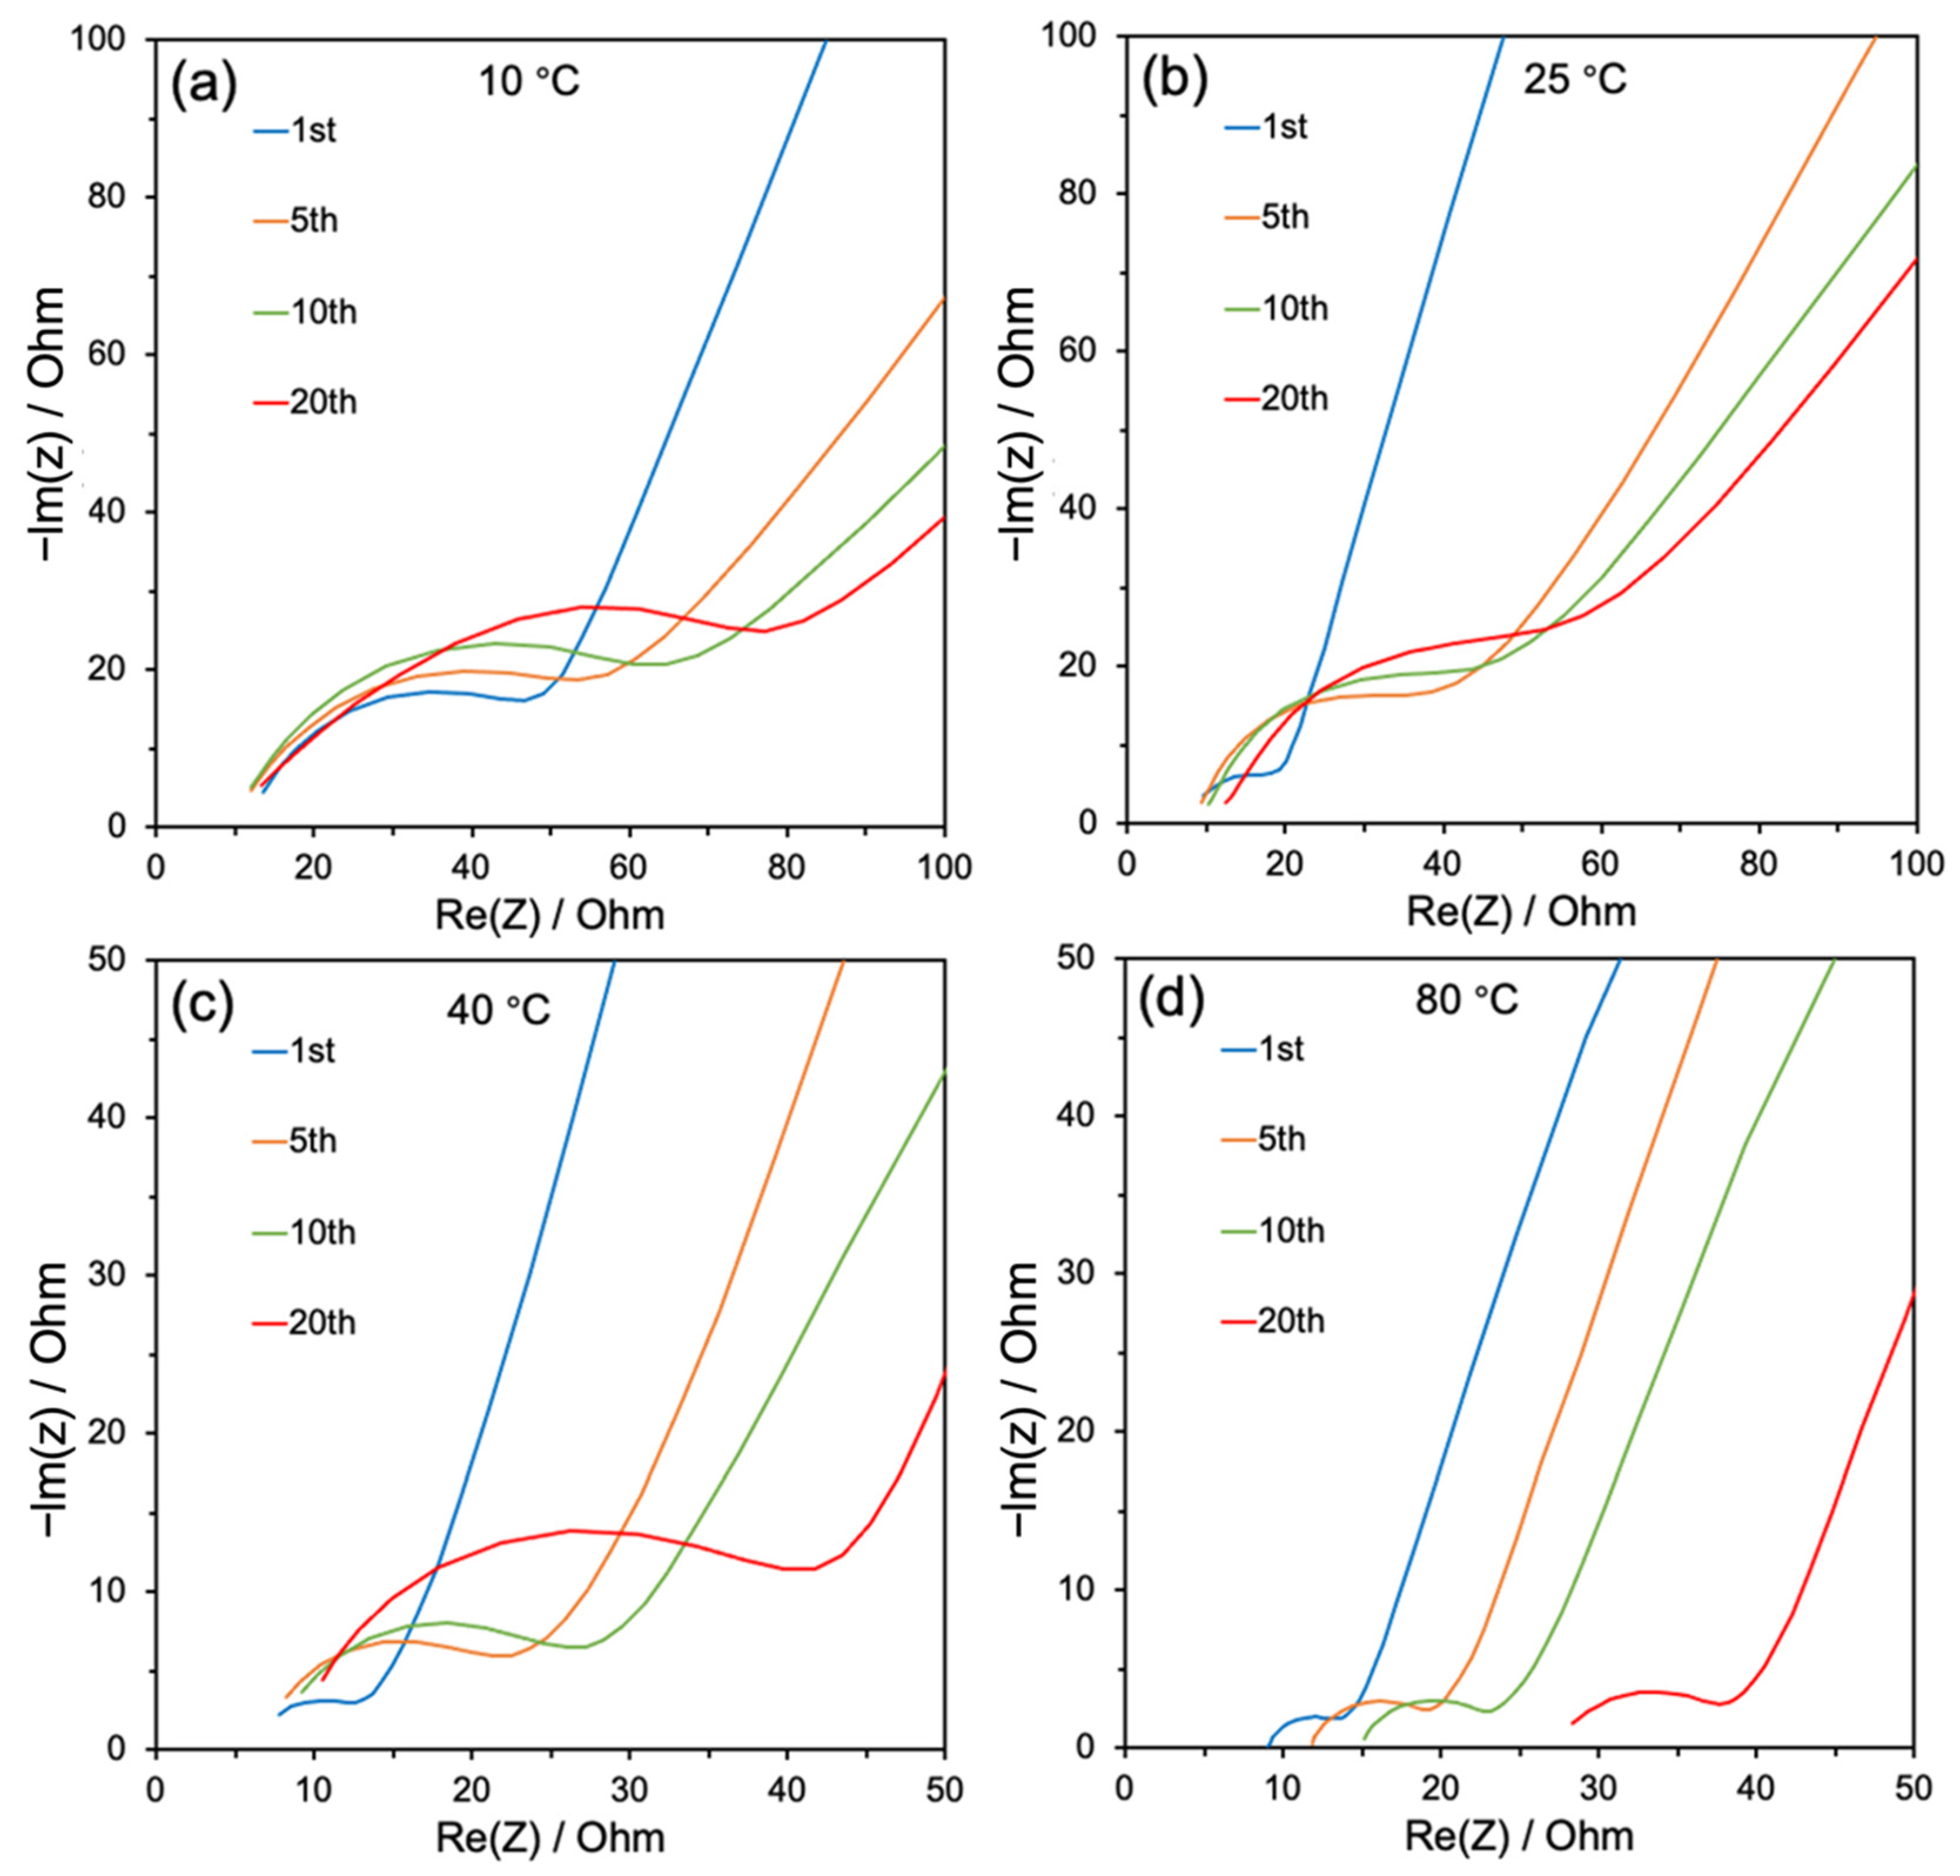
Impedance measurements were made at 2 V vs. Na+/Na, in a region where the CV shows little electrochemical activity. Nyquist plots at temperatures from 10 to 80 °C are shown in Figure 7, showing variations as the HC electrodes were cycled in sodium half-cells at 100 mA h g−1 current density. The semicircles in the Nyquist plots are formed by the superposition of two semicircles from the SEI layers, Cdl and Rct. All semicircles increase in diameter during the cycling, which indicates the growth of SEI layers during the cycling. The largest semicircle is seen in the 10 °C Nyquist plots, which relates to the largest charge transfer resistance. The semicircle diameter reduces with increasing temperature indicating thinner SEI layers. The semicircles in the Nyquist plots at 25 °C are shifted right after 20 cycles, indicating an increasing solution resistance corresponding to electrolyte degradation [34,40]. At 40 °C, more electrolyte decomposition is observed during the galvanostatic cycling compared with 25 °C. The increasing temperature increases both HC sodiation and SEI forming kinetics, with Na2CO3 produced at high potential and sodium alkyl carbonate at low potential [41,42]. At 80 °C, Nyquist plots exhibit the smallest semicircle size and only a slight increase in diameter of the semicircle after 20 cycles, suggesting an unstable SEI, and a large increase in Rs is displayed in the plots, indicating serious electrolyte breakdown as observed in the previously mentioned separator colour change. Furthermore, the small change in semicircle radius shows that a stable SEI layer is not formed on the HC surfaces. Even though the continuous formation of new SEI layers and electrolyte break down consume electrolyte and increase Rs, the cell still maintains high capacity and stability over 20 cycles due to its low overall resistance, high reaction kinetics and fast Na+ diffusion at 80 °C. For long cycling, the uninterrupted electrolyte degradation is likely to lead to fast cell degradation.
In the low frequency part of the data, the Warburg impedance corresponding to sodium ion diffusion and its diffusion coefficient ( D N a + ) could be calculated with the following equation [43]:
D = R 2 T 2 / 2 A 2 n 4 F 4 C 2 σ W 2
where σW is the Warburg factor, which is related to the real part of the impedance (Zre). Zre is a function of square root of frequency (ω −1/2) expressed as:
Z r e = R s + R c t + σ W ω 1 / 2
At the beginning of the galvanostatic cycling, SEI layers are gradually built up, which will affect diffusion (Figures S13 and S14). After 19 galvanostatic cycles, the batteries become stable and their sodium ion diffusion coefficients from 10 to 80 °C are shown in Figure S15. When increasing the temperature, the average D N a + increases from 1.14 × 10⁻¹² cm2 s−1 at 10 °C to 4.62 × 10⁻¹² cm2 s−1 at 80 °C. Furthermore, D N a + and thermal activities can be described with the Arrhenius equation [44]:
D N a + = D 0 e x p ( E a / R T )
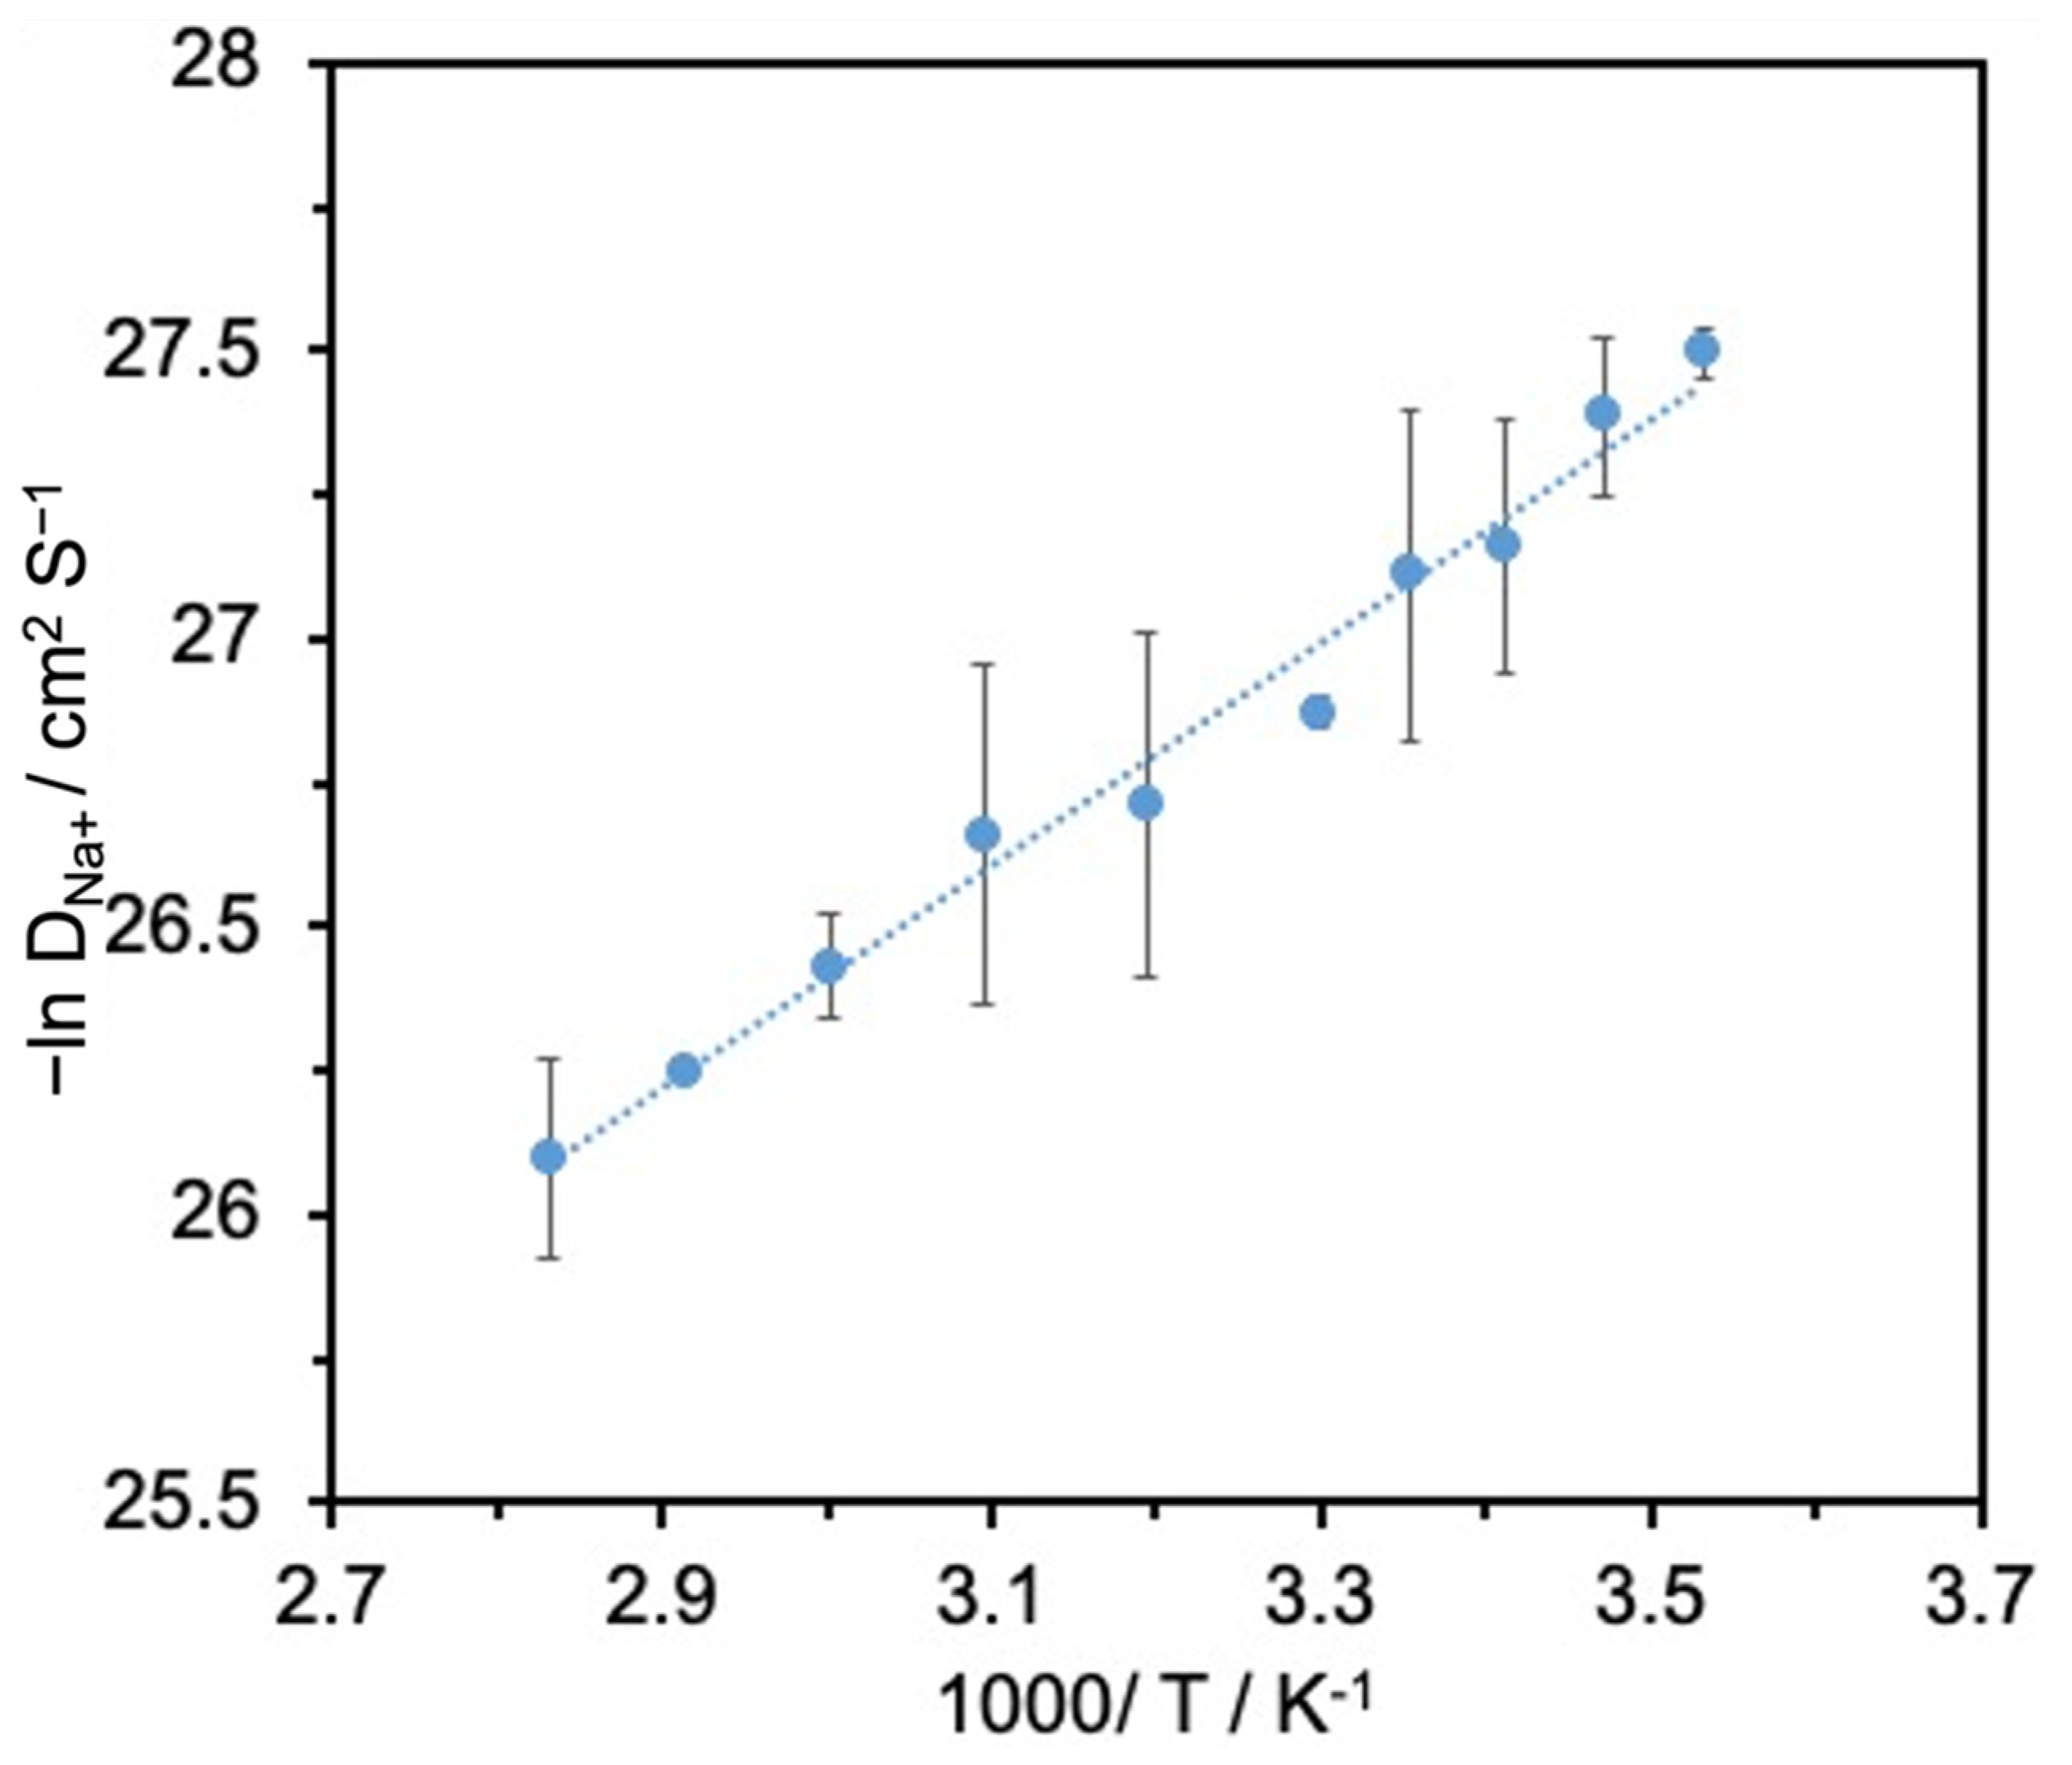
where D0 is the exponential prefactor and Ea is the activation energy. Overall, ln( D N a + ) and the reciprocal of temperature exhibit a linear relationship (R2 = 0.983) in Figure 8 and Figure S16, with 16.13 kJ mol−1 activation energy. Although the electrolyte precipitates EC below 25 °C and degrades above 50 °C, it does not affect D N a + , which related to the temperature. Moreover, large D N a + provides faster Na+ transport and can enhance the capacity with a large current rate at high temperature.
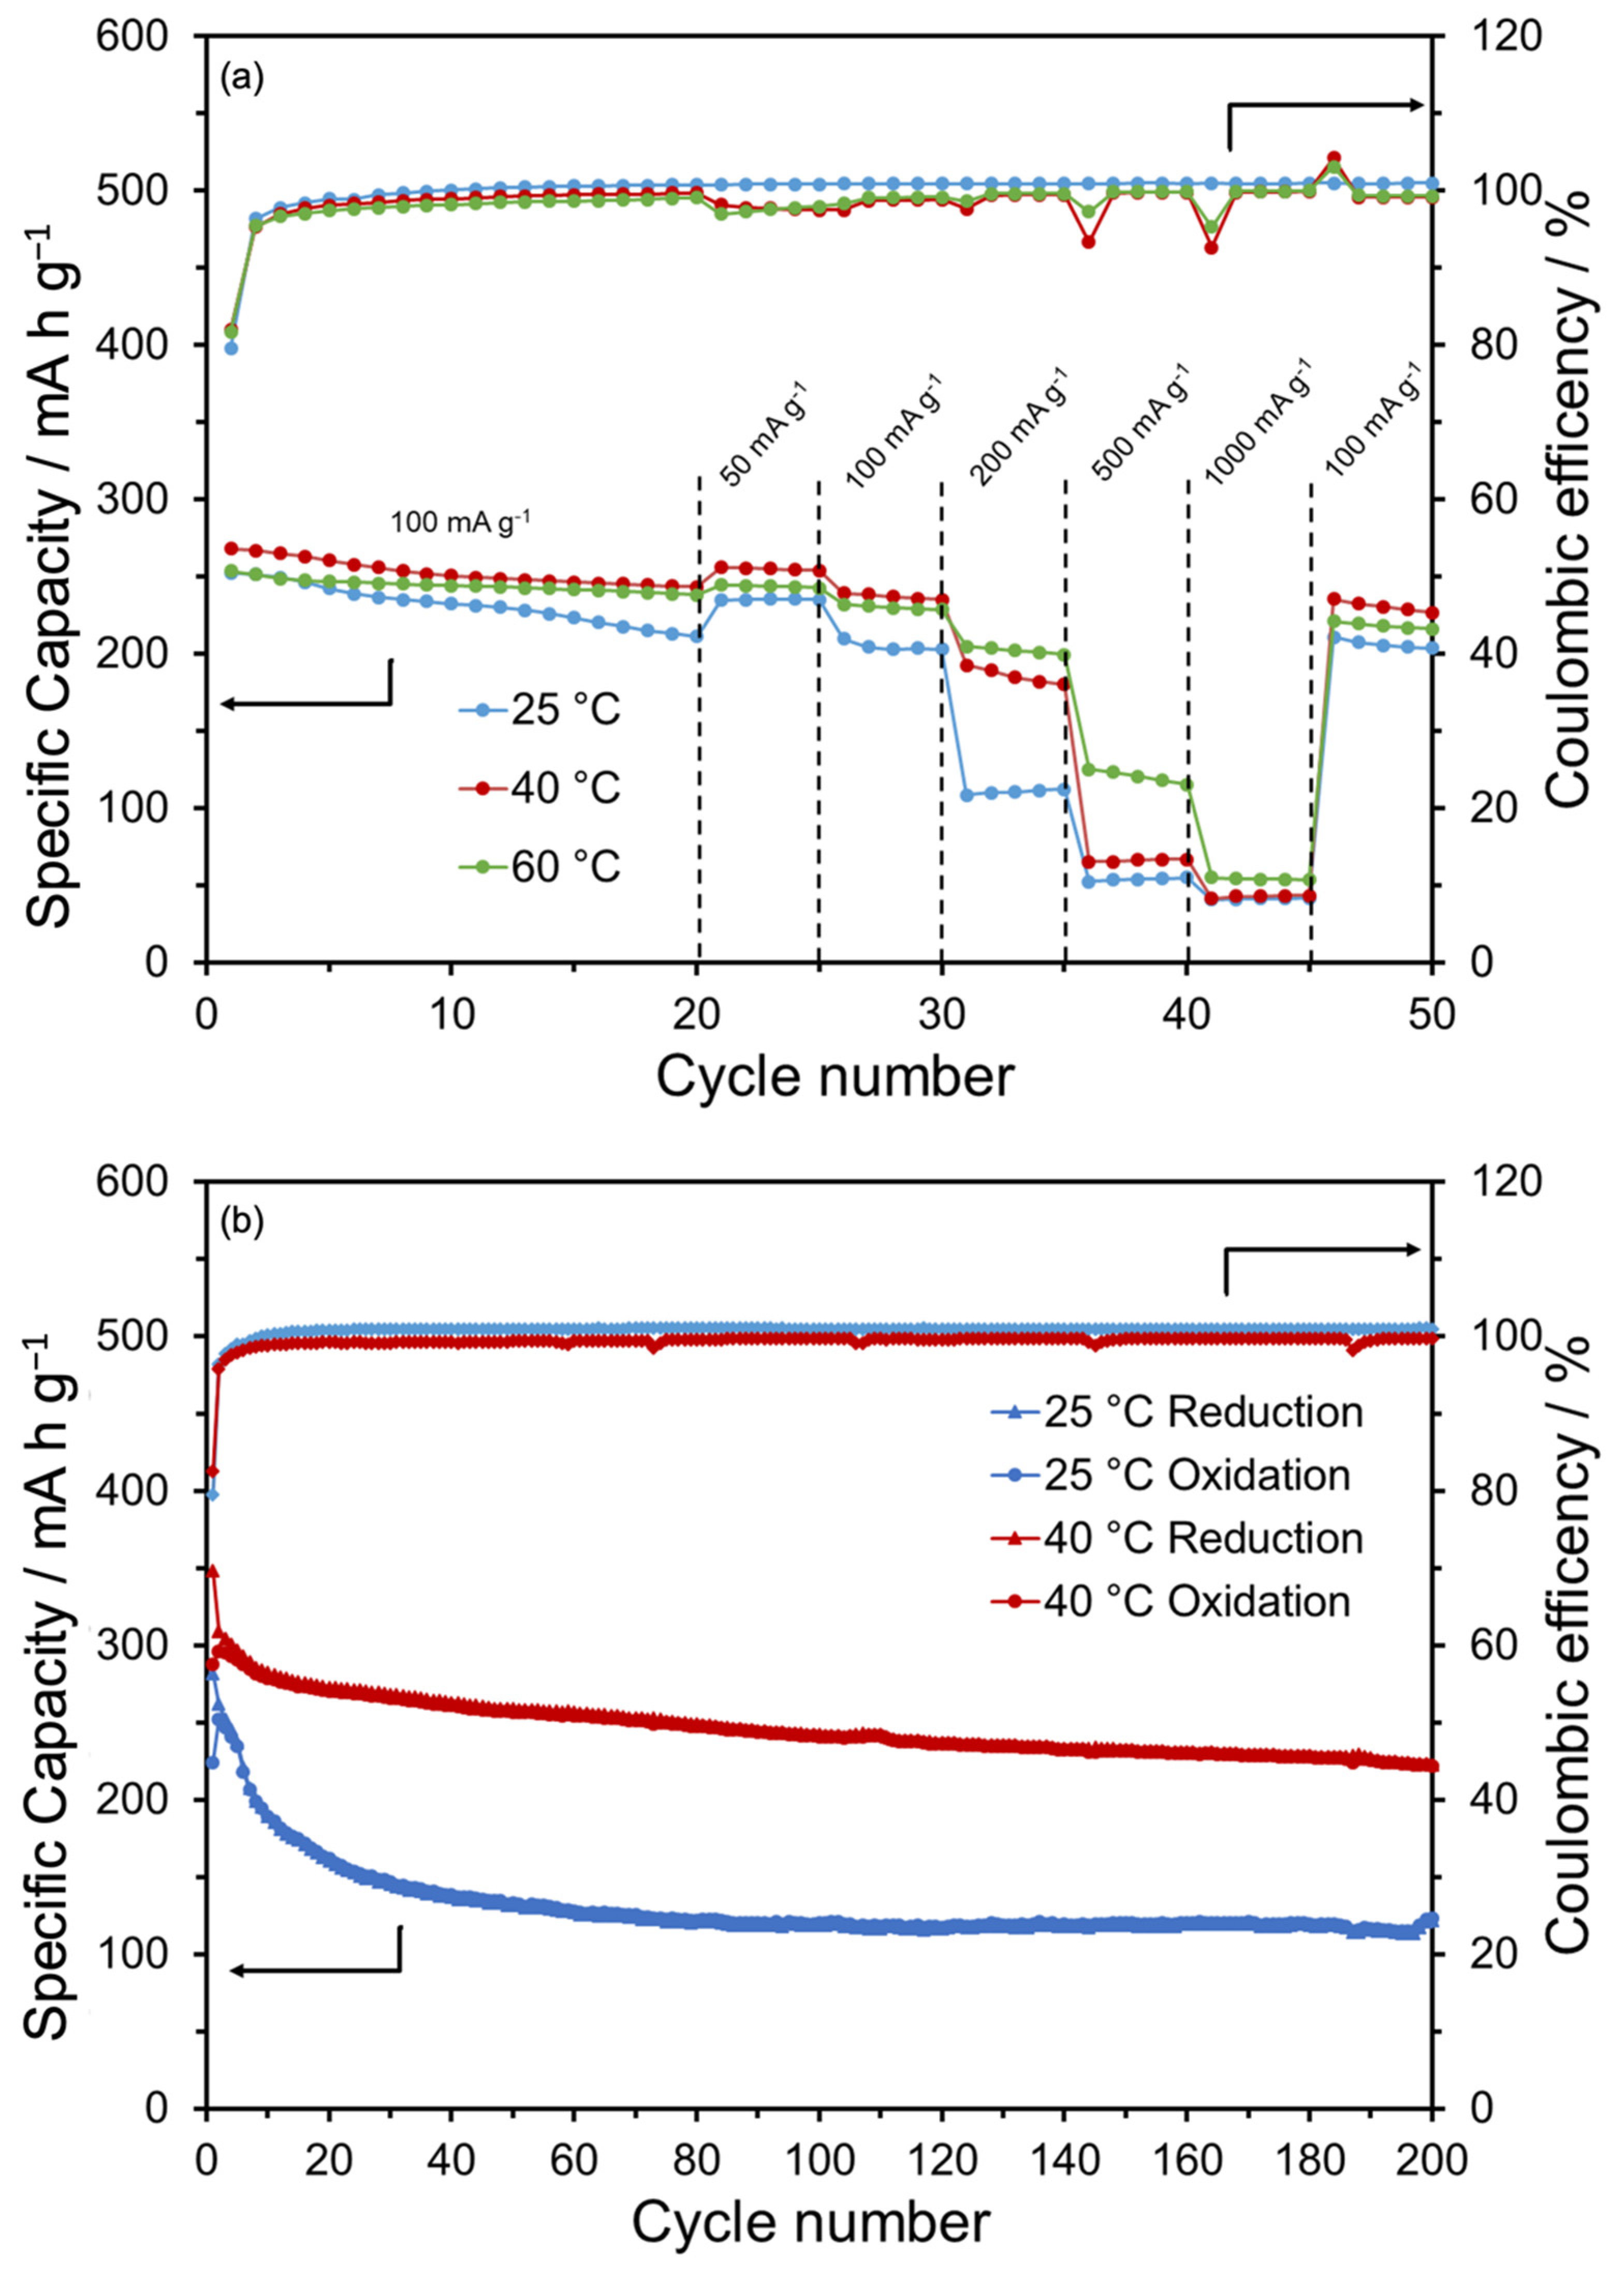
Figure 9a shows the HC electrode galvanostatic oxidation capacity with multiple current rates at 25, 40 and 60 °C (reduction in Figure S17). After stabilising at 100 mA g−1 current density for 20 cycles, it exhibits 240, 205, 112, 55 and 41 mA h g−1 specific capacity for 50, 100, 200, 500 and 1000 mA g−1 current density at 25 °C, respectively. The battery tested at 40 °C shows the highest capacity at 50 and 100 mA g−1 (260 and 240 mA h g−1) and increases of 80 and 10 mA h g−1 in the capacity at 200 mA g−1 and 500 mA g−1 compared with the battery at 25 °C (respectively). Moreover, even though the battery at 60 °C shows less specific capacity with 50 and 100 mA g−1 currents compared with at 40 °C, it displays the highest capacity at a large current rate (200, 120 and 55 for 200, 500 and 1000 mA g−1 current density). Improved HC capacities for high current density operations at high temperatures may be due to the faster reaction kinetics and a higher Na+ diffusion coefficient. However, electrolyte degradation starts from 60 °C, which will affect battery performance for long cycling. When current density is dropped back to 100 mA g−1, the capacities of all batteries return to the same level as before, changing the current density, indicating high stability and reversibility of the HC over 50 cycles. The oxidation capacities during long-term cycling at 25 and 40 °C with 100 mA g−1 current density are exhibited in Figure 9b. At 25 °C, the capacity decreases slowly and continuously with 115 mA h g−1 oxidation capacity maintained after 200 cycles. EIS showed an increasing semi-circle diameter during 25 °C cycling, which indicated a rising of Rct due to continuous growth of the SEI layer (Figure S18). Furthermore, the growing SEI layer reduced the specific capacity due to increased overpotentials and shortened intercalation processes (Figure S19). At 40 °C, the faster kinetics, larger D N a + and smaller SEI layer cause a smaller IR drop (Figure S20), which boosts the HC specific capacity and cyclic stability with over 220 mA h g−1 specific capacity after 200 cycles at 40 °C, corresponding to 76% initial oxidation capacity. Even though the capacity at 40 °C is higher than that at 25 °C, it still displays a continuous capacity drop, which may relate to high electrolyte degradation kinetics.

4. Conclusions

In this study, HC sodium half-cells made with 1 mol dm−3 NaClO4 in 1:1 EC and DEC are tested within a temperature range from 10 to 80 °C. The analysis demonstrates that performance is significantly affected by temperature. HC delivered less than 130 mA h g−1 specific capacity below 25 °C. Even though the electrolyte starts to degrade at 60 °C, it still shows the highest capacity at this temperature of 270 mA h g−1 after 20 cycles with 100 mA g−1 current. Furthermore, temperatures above 25 °C improved HC high current density performance with double the capacity at 200 and 500 mA g−1 current at 60 °C compared with that at 25 °C. HC also shows higher long-term cycling stability at 40 °C than at 25 °C with an extra 100 mA h g−1 capacity. Impedance spectroscopy shows the temperature to affect HC desodiation kinetics, electrolyte resistance and sodium ion diffusion coefficient. Overall, this electrolyte, 1 mol dm−3 NaClO4 in 1:1 EC and DEC, shows a stable working temperature range from 25 to 50 °C.

Supplementary Materials

The following supporting information can be downloaded at: https://www.mdpi.com/article/10.3390/batteries8090108/s1, Figure S1 Aqueous KCl solution conductivity as function of reciprocal of resistance; Table S1 Resistance and conductivity of 1 mol dm−3 NaClO4 in 1:1 EC/DEC electrolyte at various temperatures; Figure S2 Photograph of 1 mol dm−3 NaClO4 in 1:1 EC/DEC after standing overnight around 20 °C; Figure S3 Reduction specific capacity of HC at temperatures from 10 to 30 °C between 0.001 and 2 V (vs. Na+/Na) at 100 mA g−1 in sodium half-cells; Figure S4 Oxidation specific capacity of HC at temperatures from 10 to 30 °C between 0.001 and 2 V (vs. Na+/Na) at 100 mA g−1 in sodium half-cells; Figure S5 Coulombic efficiency of HC at temperatures from 10 to 30 °C cycled between 0.001 and 2 V (vs. Na+/Na) at 100 mA g−1 in sodium half-cells; Figure S6 Reduction specific capacity of HC at temperatures from 40 to 80 °C between 0.001 and 2 V (vs. Na+/Na) at 100 mA g−1 in sodium half-cells; Figure S7 Oxidation specific capacity of HC at temperatures from 40 to 80 °C between 0.001 and 2 V (vs. Na+/Na) at 100 mA g−1 in sodium half-cells; Figure S8 Coulombic efficiency of HC at temperatures from 40 to 80 °C cycled between 0.001 and 2 V (vs. Na+/Na) at 100 mA g−1 in sodium half-cells; Figure S9 Separators (12 mm discs) after 20 cycles at 25 °C (left) and 60 °C (right); Figure S10 Voltage-capacity plots of galvanostatic cycling data at 100 mA g−1 current for HC at the 1st, 2nd, 5th, 10th and 20th cycle at 40 °C; Figure S11 CV profile of the 5th cycle of HC at temperatures from 15 to 70 °C at 1 mV s−1 scan rate between 3 and 0.01 V vs. Na+/Na; Figure S12 CV profile of the 10th cycle of HC at temperatures from 15 to 70 °C at 1 mV s−1 scan rate between 3 and 0.01 V vs. Na+/Na; Figure S13 The relationship between Zre and ω −1/2 at low frequency with freshly prepared cells at 10, 25, 40 and 80 °C; Figure S14 The relationship between Zre and ω −1/2 at low frequency with cycled 19 times cells at 10, 25, 40 and 80 °C; Figure S15 Na ion diffusion coefficients after 19 cycles at temperatures from 10 to 80 °C; Figure S16 Dependence of the natural logarithm of the Na+ diffusion coefficient on reciprocal temperature; Figure S17 Rate capability of HC reduction capacity at different current densities and at temperatures of 25, 40 and 60 °C; Figure S18 Nyquist plots of HC electrode after different numbers of cycles at 25 °C long-term cycling; Figure S19 Voltage-capacity plots of galvanostatic cycling data at 100 mA g−1 current for HC at the 1st, 20th, 50th, 100th and 200th cycle at 25 °C; Figure S20 Voltage-capacity plots of galvanostatic cycling data at 100 mA g−1 current for HC at the 1st, 20th, 50th, 100th and 200th cycle at 40 °C.

Author Contributions

Conceptualization, B.L., A.L.H. and R.G.A.W.; methodology, B.L. and W.O.R.; manuscript writing, B.L.; review and editing, B.L., A.L.H., R.G.A.W. and W.O.R. All authors have read and agreed to the published version of the manuscript.

Funding

The authors thank EPSRC for funding the Smartlab diffractometer under EP/K00509x/1 and EP/K009877/1.

Institutional Review Board Statement

Not applicable.

Informed Consent Statement

Not applicable.

Data Availability Statement

The raw data associated with figures in this manuscript and in the supplementary file can be found at https://doi.org/10.5258/SOTON/D2327 (accessed on 8 August 2022).

Acknowledgments

Thanks to John R Owen, University of Southampton, for kindly providing advice with EIS fitting.

Conflicts of Interest

The authors declare that they have no known competing financial interest or personal relationships that could have appeared to influence the work reported in this paper.

References

  1. Slater, M.D.; Kim, D.; Lee, E.; Johnson, C.S. Sodium-Ion Batteries. Adv. Funct. Mater. 2013, 23, 947–958. [Google Scholar] [CrossRef]
  2. Nayak, P.K.; Yang, L.; Brehm, W.; Adelhelm, P. From Lithium-Ion to Sodium-Ion Batteries: Advantages, Challenges, and Surprises. Angew. Chem. Int. Ed. 2018, 57, 102–120. [Google Scholar] [CrossRef] [PubMed]
  3. Kim, T.; Song, W.; Son, D.Y.; Ono, L.K.; Qi, Y. Lithium-Ion Batteries: Outlook on Present, Future, and Hybridized Technologies. J. Mater. Chem. A 2019, 7, 2942–2964. [Google Scholar] [CrossRef]
  4. Li, Y.; Lu, Y.; Adelhelm, P.; Titirici, M.M.; Hu, Y.S. Intercalation Chemistry of Graphite: Alkali Metal Ions and Beyond. Chem. Soc. Rev. 2019, 48, 4655–4687. [Google Scholar] [CrossRef]
  5. Asher, R.C.; Wilson, S.A. Lamellar Compound of Sodium with Graphite. Nature 1958, 181, 409–410. [Google Scholar] [CrossRef]
  6. Ge, P.; Fouletier, M. Electrochemical intercalation of sodium in graphite. Solid State Ion. 1988, 28–30, 1172–1175. [Google Scholar] [CrossRef]
  7. Xiao, B.; Rojo, T.; Li, X. Hard Carbon as Sodium-Ion Battery Anodes: Progress and Challenges. ChemSusChem 2019, 12, 133–144. [Google Scholar] [CrossRef]
  8. Wang, Q.; Zhu, X.; Liu, Y.; Fang, Y.; Zhou, X.; Bao, J. Rice Husk-Derived Hard Carbons as High-Performance Anode Materials for Sodium-Ion Batteries. Carbon 2018, 127, 658–666. [Google Scholar] [CrossRef]
  9. Li, Y.; Hu, Y.S.; Titirici, M.M.; Chen, L.; Huang, X. Hard Carbon Microtubes Made from Renewable Cotton as High-Performance Anode Material for Sodium-Ion Batteries. Adv. Energy Mater. 2016, 6, 1600659. [Google Scholar] [CrossRef]
  10. Yasin, G.; Arif, M.; Mehtab, T.; Shakeel, M.; Mushtaq, M.A.; Kumar, A.; Nguyen, T.A.; Slimani, Y.; Nazir, M.T.; Song, H. A Novel Strategy for the Synthesis of Hard Carbon Spheres Encapsulated with Graphene Networks as a Low-Cost and Large-Scalable Anode Material for Fast Sodium Storage with an Ultralong Cycle Life. Inorg. Chem. Front. 2020, 7, 402–410. [Google Scholar] [CrossRef]
  11. Yu, Z.E.; Lyu, Y.; Wang, Y.; Xu, S.; Cheng, H.; Mu, X.; Chu, J.; Chen, R.; Liu, Y.; Guo, B. Hard Carbon Micro-Nano Tubes Derived from Kapok Fiber as Anode Materials for Sodium-Ion Batteries and the Sodium-Ion Storage Mechanism. Chem. Commun. 2020, 56, 778–781. [Google Scholar] [CrossRef] [PubMed]
  12. Kamiyama, A.; Kubota, K.; Nakano, T.; Fujimura, S.; Shiraishi, S.; Tsukada, H.; Komaba, S. High-Capacity Hard Carbon Synthesized from Macroporous Phenolic Resin for Sodium-Ion and Potassium-Ion Battery. ACS Appl. Energy Mater. 2020, 3, 135–140. [Google Scholar] [CrossRef]
  13. Wang, P.; Yang, B.; Zhang, G.; Zhang, L.; Jiao, H.; Chen, J.; Yan, X. Three-Dimensional Carbon Framework as a Promising Anode Material for High Performance Sodium Ion Storage Devices. Chem. Eng. J. 2018, 353, 453–459. [Google Scholar] [CrossRef]
  14. Demir, E.; Aydin, M.; Arie, A.A.; Demir-Cakan, R. Apricot Shell Derived Hard Carbons and Their Tin Oxide Composites as Anode Materials for Sodium-Ion Batteries. J. Alloys Compd. 2019, 788, 1093–1102. [Google Scholar] [CrossRef]
  15. Bandhauer, T.M.; Garimella, S.; Fuller, T.F. A Critical Review of Thermal Issues in Lithium-Ion Batteries. J. Electrochem. Soc. 2011, 158, R1. [Google Scholar] [CrossRef]
  16. Ma, S.; Jiang, M.; Tao, P.; Song, C.; Wu, J.; Wang, J.; Deng, T.; Shang, W. Temperature Effect and Thermal Impact in Lithium-Ion Batteries: A Review. Prog. Nat. Sci. Mater. Int. 2018, 28, 653–666. [Google Scholar] [CrossRef]
  17. Feng, X.; Ouyang, M.; Liu, X.; Lu, L.; Xia, Y.; He, X. Thermal Runaway Mechanism of Lithium Ion Battery for Electric Vehicles: A Review. Energy Storage Mater. 2018, 10, 246–267. [Google Scholar] [CrossRef]
  18. Wang, Q.; Ping, P.; Zhao, X.; Chu, G.; Sun, J.; Chen, C. Thermal Runaway Caused Fire and Explosion of Lithium Ion Battery. J. Power Sources 2012, 208, 210–224. [Google Scholar] [CrossRef]
  19. Ratnakumar, B.V.; Smart, M.C.; Surampudi, S. Effects of SEI on the Kinetics of Lithium Intercalation. J. Power Sources 2001, 97–98, 137–139. [Google Scholar] [CrossRef]
  20. Zhang, S.S.; Xu, K.; Jow, T.R. The Low Temperature Performance of Li-Ion Batteries. J. Power Sources 2003, 115, 137–140. [Google Scholar] [CrossRef]
  21. Ding, C.; Nohira, T.; Hagiwara, R.; Fukunaga, A.; Sakai, S.; Nitta, K. Electrochemical Performance of Hard Carbon Negative Electrodes for Ionic Liquid-Based Sodium Ion Batteries over a Wide Temperature Range. Electrochim. Acta 2015, 176, 344–349. [Google Scholar] [CrossRef]
  22. Lin, X.; Du, X.; Tsui, P.S.; Huang, J.-Q.; Tan, H.; Zhang, B. Exploring Room- and Low-Temperature Performance of Hard Carbon Material in Half and Full Na-Ion Batteries. Electrochim. Acta 2019, 316, 60–68. [Google Scholar] [CrossRef]
  23. Cao, Y.; Cao, X.; Dong, X.; Zhang, X.; Xu, J.; Wang, N.; Yang, Y.; Wang, C.; Liu, Y.; Xia, Y. All-Climate Iron-Based Sodium-Ion Full Cell for Energy Storage. Adv. Funct. Mater. 2021, 31, 2102856. [Google Scholar] [CrossRef]
  24. Eshetu, G.G.; Grugeon, S.; Kim, H.; Jeong, S.; Wu, L.; Gachot, G.; Laruelle, S.; Armand, M.; Passerini, S. Comprehensive Insights into the Reactivity of Electrolytes Based on Sodium Ions. ChemSusChem 2016, 9, 462–471. [Google Scholar] [CrossRef]
  25. Chen, Z.; Duan, H.; Xu, Z.; Chen, C.; Yan, Y.; Wu, S. Fast Sodium Storage with Ultralong Cycle Life for Nitrogen Doped Hollow Carbon Nanofibers Anode at Elevated Temperature. Adv. Mater. Interfaces 2020, 7, 1901922. [Google Scholar] [CrossRef]
  26. Ponrouch, A.; Palacín, M.R. On the High and Low Temperature Performances of Na-Ion Battery Materials: Hard Carbon as a Case Study. Electrochem. Commun. 2015, 54, 51–54. [Google Scholar] [CrossRef]
  27. Hou, B.H.; Wang, Y.Y.; Ning, Q.L.; Li, W.H.; Xi, X.T.; Yang, X.; Liang, H.J.; Feng, X.; Wu, X.L. Self-Supporting, Flexible, Additive-Free, and Scalable Hard Carbon Paper Self-Interwoven by 1D Microbelts: Superb Room/Low-Temperature Sodium Storage and Working Mechanism. Adv. Mater. 2019, 31, 1903125. [Google Scholar] [CrossRef]
  28. Cheng, H.; Garcia-Araez, N.; Hector, A.L.; Soulé, S. Synthesis of Hard Carbon-TiN/TiC Composites by Reacting Cellulose with TiCl 4 Followed by Carbothermal Nitridation/Reduction. Inorg. Chem. 2019, 58, 5776–5786. [Google Scholar] [CrossRef]
  29. Mei, J.; Liao, T.; Sun, Z. Two-Dimensional Metal Oxide Nanosheets for Rechargeable Batteries. J. Energy Chem. 2018, 27, 117–127. [Google Scholar] [CrossRef]
  30. Gao, Y.; Qiu, X.; Wang, X.; Chen, X.; Gu, A.; Yu, Z. Nitrogen-Doped Porous Carbon Microspheres for High-Rate Anode Material in Lithium-Ion Batteries. Nanotechnology 2020, 31, 155702. [Google Scholar] [CrossRef]
  31. Atkins, P.W.; de Paula, J. Motion in Liquids. In Atkins’ Physical Chemistry, 10th ed.; Oxford University Press: Oxford, UK, 2014; p. 799. [Google Scholar]
  32. Reichstädter, L.; Fischerová, E.; Fischer, O. Conductance of Lithium and Sodium Perchlorates and Tetraphenylborates in 2-Butanone from −35 to 25 °C. J. Solut. Chem. 1999, 28, 35–60. [Google Scholar] [CrossRef]
  33. Bhide, A.; Hofmann, J.; Katharina Dürr, A.; Janek, J.; Adelhelm, P. Electrochemical Stability of Non-Aqueous Electrolytes for Sodium-Ion Batteries and Their Compatibility with Na0.7CoO2. Phys. Chem. Chem. Phys. 2014, 16, 1987–1998. [Google Scholar] [CrossRef] [PubMed]
  34. Bai, Y.; Liu, Y.; Li, Y.; Ling, L.; Wu, F.; Wu, C. Mille-Feuille Shaped Hard Carbons Derived from Polyvinylpyrrolidone: Via Environmentally Friendly Electrostatic Spinning for Sodium Ion Battery Anodes. RSC Adv. 2017, 7, 5519–5527. [Google Scholar] [CrossRef]
  35. Pletcher, D. AC Impedance. In A first Course in Electrode Processes, 2nd ed.; Royal Society of Chemistry: Cambridge, UK, 2009; pp. 211–214. [Google Scholar]
  36. Bommier, C.; Surta, T.W.; Dolgos, M.; Ji, X. New Mechanistic Insights on Na-Ion Storage in Nongraphitizable Carbon. Nano Lett. 2015, 15, 5888–5892. [Google Scholar] [CrossRef] [PubMed]
  37. Qiu, S.; Xiao, L.; Sushko, M.L.; Han, K.S.; Shao, Y.; Yan, M.; Liang, X.; Mai, L.; Feng, J.; Cao, Y.; et al. Manipulating Adsorption–Insertion Mechanisms in Nanostructured Carbon Materials for High-Efficiency Sodium Ion Storage. Adv. Energy Mater. 2017, 7, 1700403. [Google Scholar] [CrossRef]
  38. Sun, N.; Guan, Z.; Liu, Y.; Cao, Y.; Zhu, Q.; Liu, H.; Wang, Z.; Zhang, P.; Xu, B. Extended “Adsorption–Insertion” Model: A New Insight into the Sodium Storage Mechanism of Hard Carbons. Adv. Energy Mater. 2019, 9, 1901351. [Google Scholar] [CrossRef]
  39. Alvin, S.; Cahyadi, H.S.; Hwang, J.; Chang, W.; Kwak, S.K.; Kim, J. Revealing the Intercalation Mechanisms of Lithium, Sodium, and Potassium in Hard Carbon. Adv. Energy Mater. 2020, 10, 2000283. [Google Scholar] [CrossRef]
  40. Chen, T.; Liu, Y.; Pan, L.; Lu, T.; Yao, Y.; Sun, Z.; Chua, D.H.C.; Chen, Q. Electrospun Carbon Nanofibers as Anode Materials for Sodium Ion Batteries with Excellent Cycle Performance. J. Mater. Chem. A 2014, 2, 4117–4121. [Google Scholar] [CrossRef]
  41. Thomas, P.; Ghanbaja, J.; Billaud, D. Electrochemical Insertion of Sodium in Pitch-Based Carbon Fibres in Comparison with Graphite in NaClO4-Ethylene Carbonate Electrolyte. Electrochim. Acta 1999, 45, 423–430. [Google Scholar] [CrossRef]
  42. Kumar, H.; Detsi, E.; Abraham, D.P.; Shenoy, V.B. Fundamental Mechanisms of Solvent Decomposition Involved in Solid-Electrolyte Interphase Formation in Sodium Ion Batteries. Chem. Mater. 2016, 28, 8930–8941. [Google Scholar] [CrossRef]
  43. Bard, A.J.; Faulkner, L.R. Impedance. In Electrochemical Methods: Fundamentals and Applications, 2nd ed.; John Wiley: Chichester, UK, 2001; pp. 383–385. [Google Scholar]
  44. Adams, R.A.; Varma, A.; Pol, V.G. Temperature Dependent Electrochemical Performance of Graphite Anodes for K-Ion and Li-Ion Batteries. J. Power Sources 2019, 410–411, 124–131. [Google Scholar] [CrossRef]
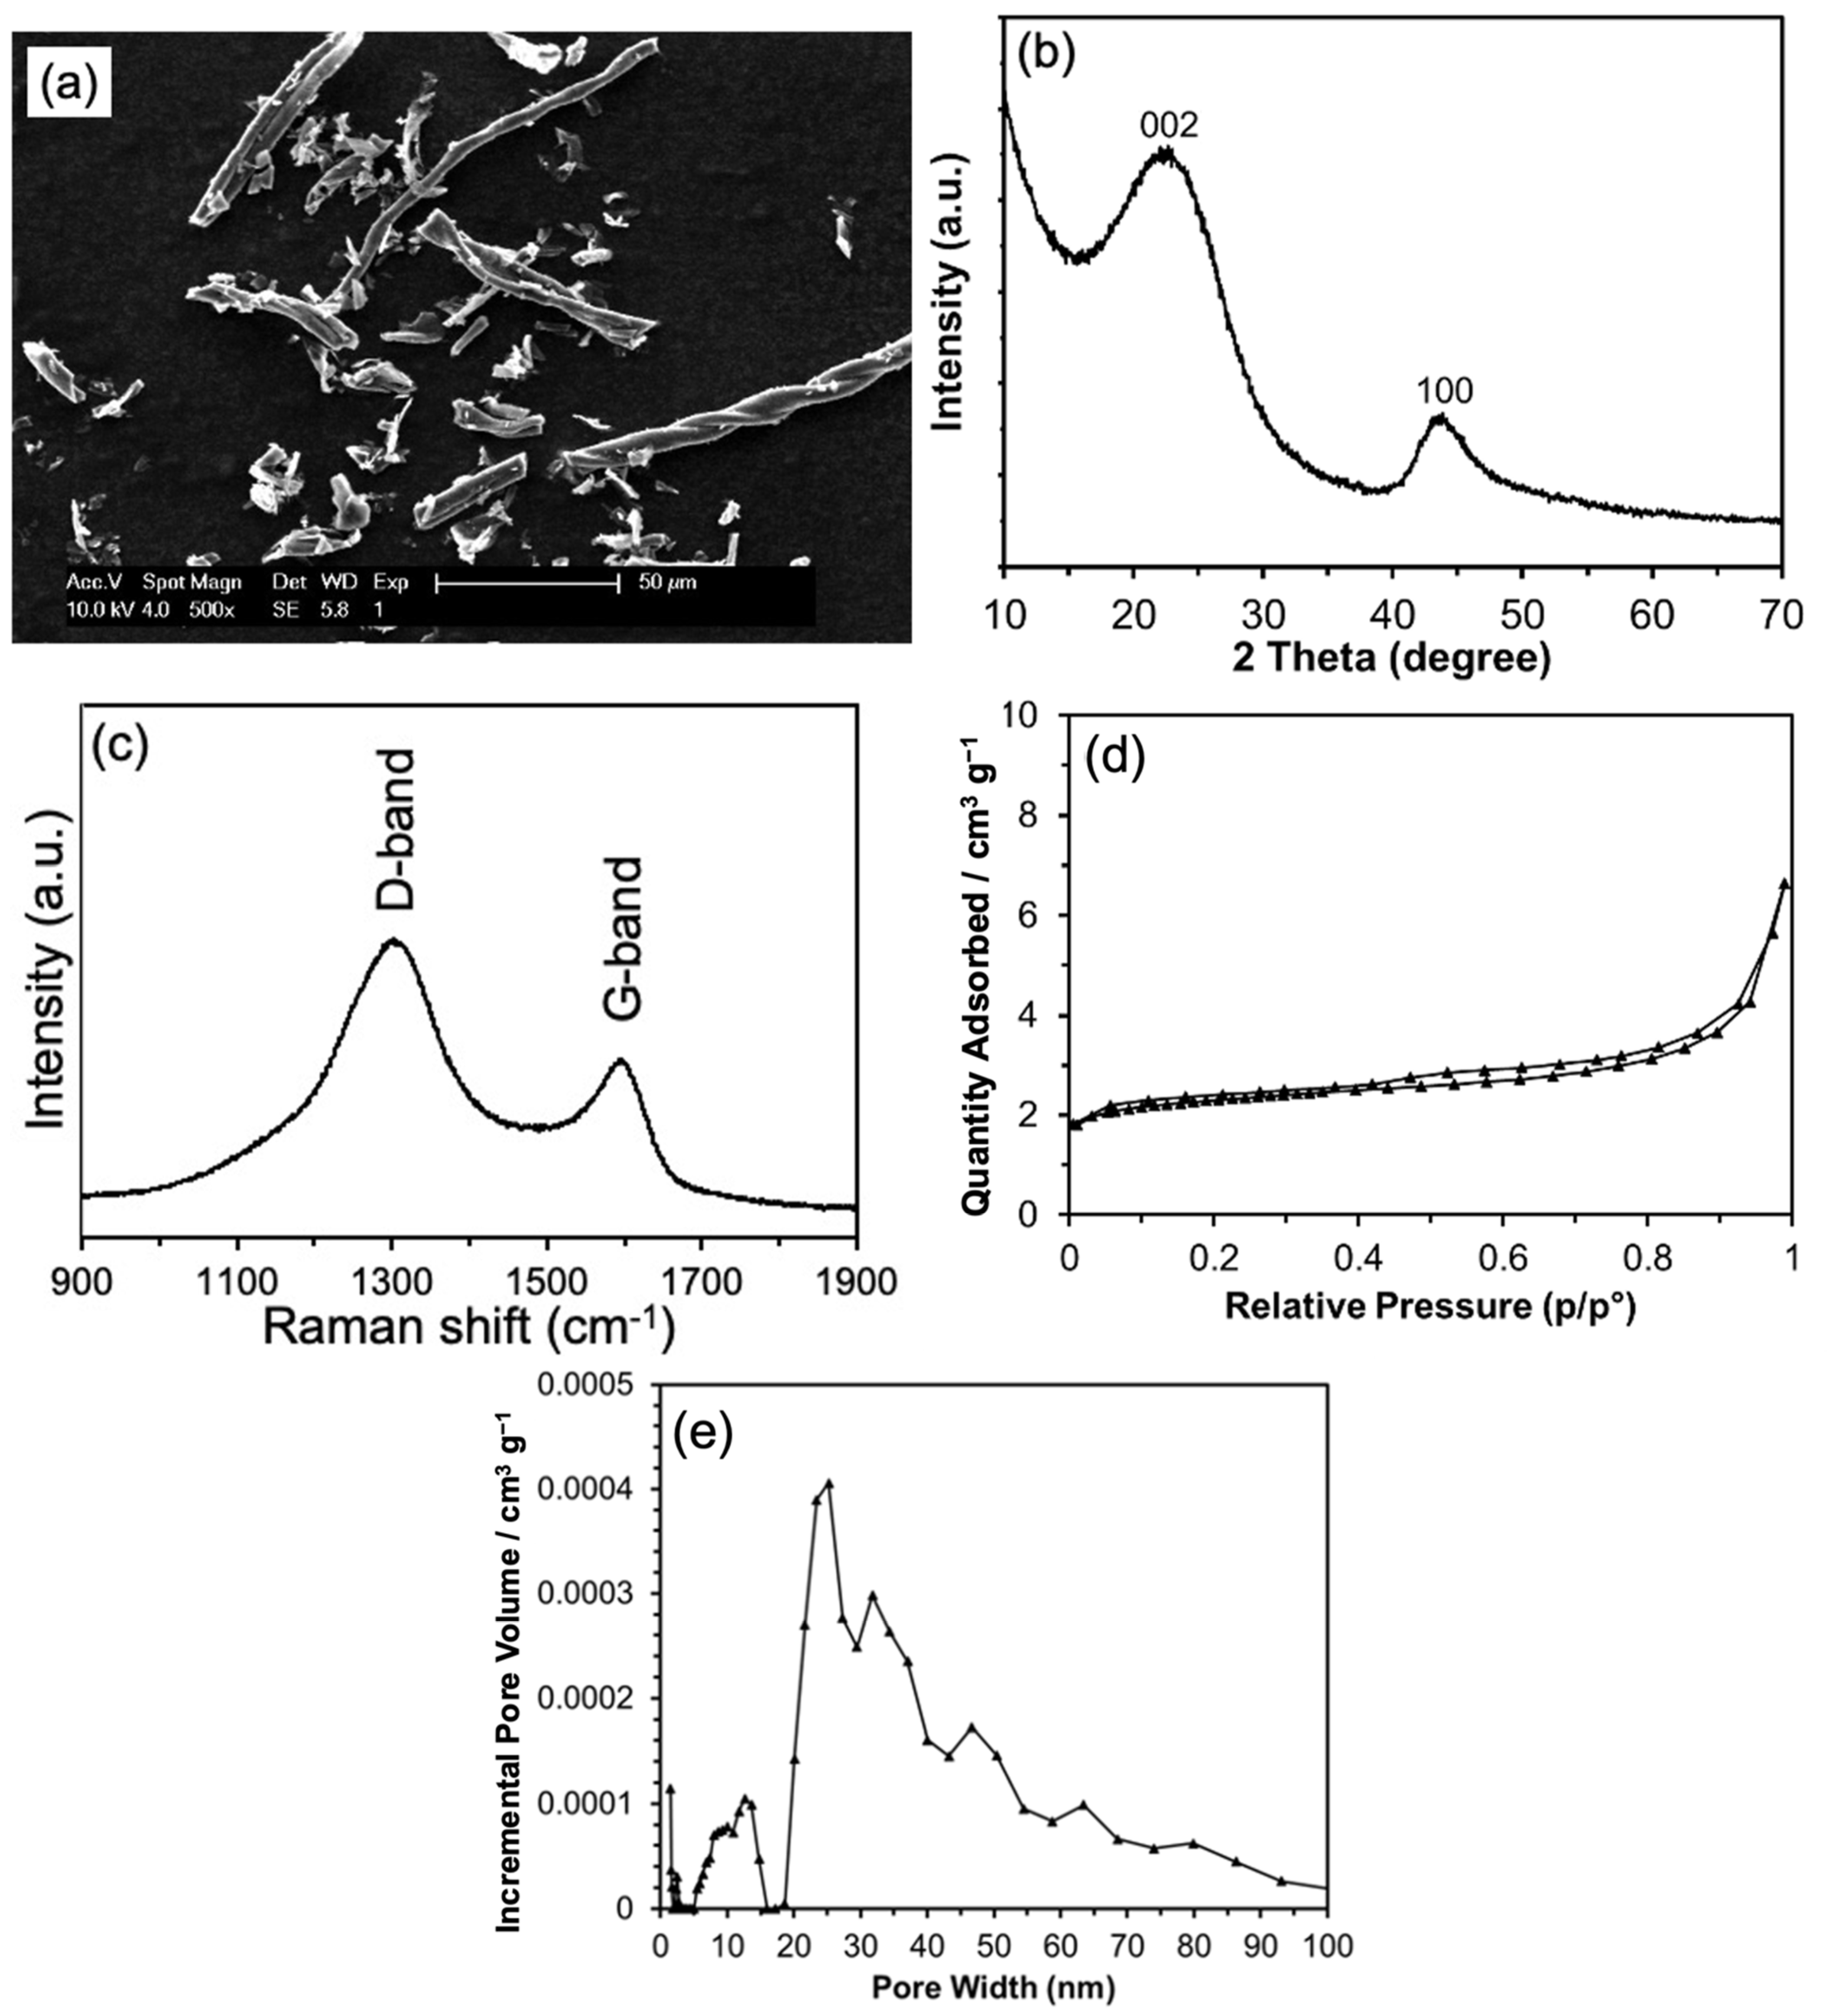
Figure 1. SEM micrograph (a), XRD pattern (b), Raman spectrum (c), N2 adsorption–desorption isotherm (d) and pore size distribution (e) of the hard carbon used in this study.
Batteries 08 00108 g001
Figure 2. Variation in the conductivity of a 1 mol dm−3 NaClO4 in 1:1 EC/DEC electrolyte with temperature.
Batteries 08 00108 g002
Figure 3. Equivalent circuit model of (a) fresh sodium half cells and (b) sodium half cells cycled at 100 mA g1 and (c) Nyquist plots of HC electrode at various temperature from 5 °C to 80 °C and frequency from 100 kHz to 0.1 HZ, with the high frequency part expanded in the inset.
Batteries 08 00108 g003
Figure 4. Oxidation specific capacity of HC at temperatures from 10 to 80 °C measured between 2 and 0.001 V (vs. Na+/Na) at 100 mA g1 in sodium half-cells.
Batteries 08 00108 g004
Figure 5. Voltage-capacity plots of galvanostatic cycling data at 100 mA g−1 current for HC at the 1st, 2nd, 5th, 10th and 20th cycle at (a) 10 °C, (b) 25 °C (c) 60 °C and (d) 80 °C.
Batteries 08 00108 g005
Figure 6. CV profile of HC at temperatures from 15 to 70 °C at 1 mV s−1 scan rate between 3 and 0.01 V vs. Na+/Na (a) 1st cycle and (b) 2nd cycle.
Batteries 08 00108 g006
Figure 7. Nyquist plots of HC electrode after different numbers of cycles at 100 mA g−1 (a) 10 °C, (b) 25 °C, (c) 40 °C and (d) 80 °C.
Batteries 08 00108 g007
Figure 8. Dependence of natural logarithm of the average Na+ diffusion coefficient on reciprocal temperature.
Batteries 08 00108 g008
Figure 9. (a) Rate capability of HC oxidation capacity and Coulombic efficiency at different current densities with various temperatures of 25, 40 and 60 °C, (b) long-term cycling stability and Coulombic efficiency of HC with 25 and 40 °C.
Batteries 08 00108 g009
Table 1. HC sodium half-cell resistance at several temperatures measured by EIS.
Temperature (°C)Rs (Ω)Rct (Ω)I0 (μA)Ks (cm s−1)
511.24395.46 × 10−55.96 × 10⁻⁷
109.642469.92 × 10−51.08 × 10⁻⁶
158.541421.75 × 10−41.91 × 10⁻⁶
207.6380.93.12 × 10−43.41 × 10⁻⁶
258.5141.96.13 × 10−46.69 × 10⁻⁶
407.2515.71.72 × 10−31.88 × 10⁻⁵
507.247.273.83 × 10−34.18 × 10⁻⁵
606.553.268.81 × 10−39.61 × 10⁻⁵
706.182.481.19 × 10−21.30 × 10⁻⁴
805.921.941.57 × 10−21.71 × 10⁻⁴
Publisher’s Note: MDPI stays neutral with regard to jurisdictional claims in published maps and institutional affiliations.