
Influence of Fluoroethylene Carbonate in the Composition of an Aprotic Electrolyte on the Electrochemical Characteristics of LIB’s Anodes Based on Carbonized Nanosilicon

 ,
,  and
and
Abstract
:
1. Introduction
2. Materials and Methods
3. Results
4. Discussion
5. Conclusions
Author Contributions
Funding
Institutional Review Board Statement
Informed Consent Statement
Data Availability Statement
Acknowledgments
Conflicts of Interest
References
- Zafar Abbas Manj, R.; Zhang, F.; Ur Rehman, W.; Luo, W.; Yang, J. Toward understanding the interaction within silicon-based anodes for stable lithium storage. Chem. Eng. J. 2020, 385, 123821. [Google Scholar] [CrossRef]
- Liu, X.; Zhu, X.; Pan, D. Solutions for the problems of silicon–carbon anode materials for lithium-ion batteries. R. Soc. Open Sci. 2018, 5, 172370. [Google Scholar] [CrossRef] [PubMed]
- Ashuri, M.; Hea, Q.; Shaw, L.L. Silicon as a potential anode material for Li-ion batteries: Where size, geometry and structure matter. Nanoscale 2016, 8, 74. [Google Scholar] [CrossRef]
- Jin, Y.; Kneusels, N.-J.H.; Marbella, L.E.; Castillo-Martínez, E.; Magusin, P.C.M.M.; Weatherup, R.S.; Jónsson, E.; Liu, T.; Paul, S.; Grey, C.P. Understanding fluoroethylene carbonate and vinylene carbonate based electrolytes for Si anodes in lithium ion batteries with NMR spectroscopy. J. Am. Chem. Soc. 2018, 140, 9854–9867. [Google Scholar] [CrossRef]
- Ren, W.-F.; Zhou, Y.; Li, J.-T.; Huang, L.; Sun, S.-G. Si anode for next generation lithium-ion battery. Curr. Opin. Electrochem. 2019, 18, 46–54. [Google Scholar] [CrossRef]
- Pender, J.P.; Jha, G.; Youn, D.H.; Ziegler, J.M.; Andoni, I.; Choi, E.J.; Heller, A.; Dunn, B.S.; Weiss, P.S.; Penner, R.M.; et al. Electrode degradation in lithium-ion batteries. ACS Nano 2020, 14, 1243–1295. [Google Scholar] [CrossRef]
- Obrovac, M.N.; Chevrier, V.L. Alloy negative electrodes for Li-ion batteries. Chem. Rev. 2014, 114, 11444–11502. [Google Scholar] [CrossRef]
- Majdi, H.S.; Latipov, Z.A.; Borisov, V.; Nedorezova, O.Y.; Kadhim, M.M.; Suksatan, W.; Khlewee, I.H.; Kianfar, E. Nano and battery anode: A review. Nanoscale Res. Lett. 2021, 16, 177. [Google Scholar] [CrossRef]
- Choi, N.-S.; Yew, K.H.; Lee, K.Y.; Sung, M.; Kim, H.; Kim, S.-S. Effect of fluoroethylene carbonate additive on interfacial properties of silicon thin-film electrode. J. Power Sources 2006, 161, 1254–1259. [Google Scholar] [CrossRef]
- Etacheri, V.; Haik, O.; Goffer, Y.; Roberts, G.A.; Stefan, I.C.; Fasching, R.; Aurbach, D. Effect of fluoroethylene carbonate (FEC) on the performance and surface chemistry of Si-nanowire Li-ion battery anodes. Langmuir 2012, 28, 965–976. [Google Scholar] [CrossRef] [PubMed]
- Xu, C.; Lindgren, F.; Philippe, B.; Gorgoi, M.; Björefors, F.; Edström, K.; Gustafsson, T. Improved performance of the silicon anode for Li-ion batteries: Understanding the surface modification mechanism of fluoroethylene carbonate as an effective electrolyte additive. Chem. Mater. 2015, 27, 2591–2599. [Google Scholar] [CrossRef]
- Matsumoto, T.; Kimur, K.; Nishihara, H.; Kasukabe, T.; Kyotani, T.; Kobayashi, H. Fabrication of Si nanopowder from Si swarf and application to high capacity and low cost Li-ion batteries. J. Alloys Compd. 2017, 720, 529–540. [Google Scholar] [CrossRef]
- Klett, M.; Gilbert, J.A.; Pupek, K.Z.; Trask, S.E.; Abraham, D.P. Layered oxide, graphite and silicon-graphite electrodes for lithium-ion cells: Effect of electrolyte composition and cycling windows. J. Electrochem. Soc. 2017, 164, A6095. [Google Scholar] [CrossRef]
- Yao, K.; Zhenga, J.P.; Lianga, R. Ethylene carbonate-free fluoroethylene carbonate-based electrolyte works better for freestanding Si-based composite paper anodes for Li-ion batteries. J. Power Sources 2018, 381, 164–170. [Google Scholar] [CrossRef]
- Pathak, A.D.; Samanta, K.; Sahu, K.K.; Pati, S. Mechanistic insight into the performance enhancement of Si anode of a lithium-ion battery with a fluoroethylene carbonate electrolyte additive. J. Appl. Electrochem. 2021, 51, 143–154. [Google Scholar] [CrossRef]
- Astrova, E.V.; Ulin, V.P.; Parfeneva, A.V.; Voronkov, V.B. Fluorocarbon carbonization of nanocrystalline silicon. Tech. Phys. Lett. 2019, 45, 664–667. [Google Scholar] [CrossRef]
- Astrova, E.V.; Ulin, V.P.; Parfeneva, A.V.; Rumyantsev, A.M.; Voronkov, V.B.; Nashchekin, A.V.; Nevedomskiy, V.N.; Koshtyal, Y.M.; Tomkovich, M.V. Silicon–carbon nanocomposites produced by reduction of carbon monofluoride by silicon. J. Alloys Compd. 2020, 826, 154242. [Google Scholar] [CrossRef]
- Retter, U.; Lohse, H. Electrochemical impedance spectroscopy. In Electroanalytical Methods: Guide to Experiments and Applications, 2nd ed.; Scholz, F., Ed.; Springer: Berlin/Heidelberg, Germany, 2010; pp. 159–176. [Google Scholar]
- Umeda, M.; Dokko, K.; Fujita, Y.; Mohamedi, M.; Uchida, I.; Selman, J.R. Electrochemical impedance study of Li-ion insertion into mesocarbon microbead single particle electrode: Part I. Graphitized carbon. Electrochim. Acta 2001, 47, 885–890. [Google Scholar] [CrossRef]
- Aurbach, D.; Weissman, I.; Schechter, A.; Cohen, H. X-ray photoelectron spectroscopy studies of lithium surfaces prepared in several important electrolyte solutions. A comparison with previous studies by Fourier transform infrared spectroscopy. Langmuir 1996, 12, 3991–4007. [Google Scholar] [CrossRef]
- Wang, C.; Appleby, A.J.; Little, F.E. Electrochemical impedance study of initial lithium ion intercalation into graphite powders. Electrochim. Acta 2001, 46, 1793–1813. [Google Scholar] [CrossRef]
- Nguyen, C.C.; Lucht, B.L. Comparative study of fluoroethylene carbonate and vinylene carbonate for silicon anodes in lithium ion batteries. J. Electrochem. Soc. 2014, 161, A1933. [Google Scholar] [CrossRef]
- Churikov, A.V.; Pridatko, K.I.; Ivanishchev, A.V.; Ivanishcheva, I.A.; Gamayunova, I.M.; Zapsis, K.V.; Sycheva, V.O. Impedance spectroscopy of lithium-tin film electrodes. Russ. J. Electrochem. 2008, 44, 550–557. [Google Scholar] [CrossRef]
- Aurbach, D.; Gamolsky, K.; Markovsky, B.; Salitra, G.; Gofen, Y.; Heider, U.; Oesten, R.; Schmidt, M. The study of surface phenomena related to electrochemical lithium intercalation into LixMOy host materials (M = Ni, Mn). J. Electrochem. Soc. 2000, 147, 1322. [Google Scholar] [CrossRef]
- Ivanishchev, A.V.; Churikov, A.V.; Ivanishcheva, I.A.; Zapsis, K.V.; Gamayunova, I.M. Impedance spectroscopy of lithium-carbon electrodes. Russ. J. Electrochem. 2008, 44, 510–524. [Google Scholar] [CrossRef]
- Evschik, E.Y. Silicon-Based Anode Materials for Lithium-Ion Batteries. Ph.D. Thesis, IHTE UB RAS, Yekaterinburg, Russia, 21 December 2016. Available online: http://www.ihte.uran.ru/?page_id=7307 (accessed on 18 July 2022). (In Russian).
- Kulova, T.L.; Pleskov, Y.V.; Skundin, A.M.; Terukov, E.I.; Kon’kov, O.I. Lithium intercalation into amorphous-silicon thin films: An electrochemical-impedance study. Russ. J. Electrochem. 2006, 42, 708–714. [Google Scholar] [CrossRef]
- Stoynov, Z.B.; Grafov, B.M.; Savova-Stoynov, B.S.; Elkin, V.V. Electrochemical Impedance; Nauka Publisher: Moscow, Russia, 1991; pp. 12–51. (In Russian) [Google Scholar]
- Wang, W.; Yang, S. Enhanced overall electrochemical performance of silicon/carbon anode for lithium-ion batteries using fluoroethylene carbonate as an electrolyte additive. J. Alloys Compd. 2017, 695, 3249. [Google Scholar] [CrossRef]
- Zhang, X.R.; Kostecki, R.; Richardson, T.J.; Pugh, J.K.; Ross, P.N. Electrochemical and infrared studies of the reduction of organic carbonates. J. Electrochem. Soc. 2001, 148, A1341. [Google Scholar] [CrossRef]
- Chan, C.K.; Ruffo, R.; Hong, S.S.; Cui, Y. Surface chemistry and morphology of the solid electrolyte interphase on silicon nanowire lithium-ion battery anodes. J. Power Sources 2009, 189, 1132–1140. [Google Scholar] [CrossRef]
- Lukomsky, Y.Y.; Gamburg, Y.D. Physicochemical Foundations of Electrochemistry; ID Intellect: Dolgoprudny, Russia, 2008; pp. 203–207. (In Russian) [Google Scholar]


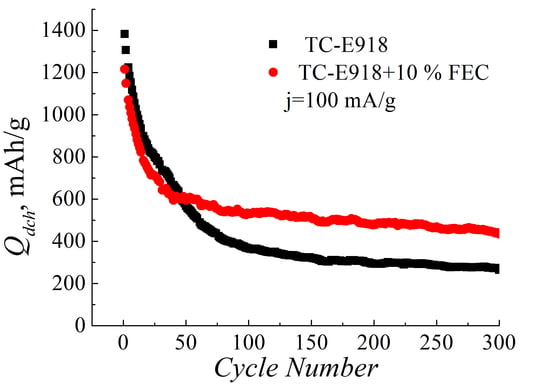
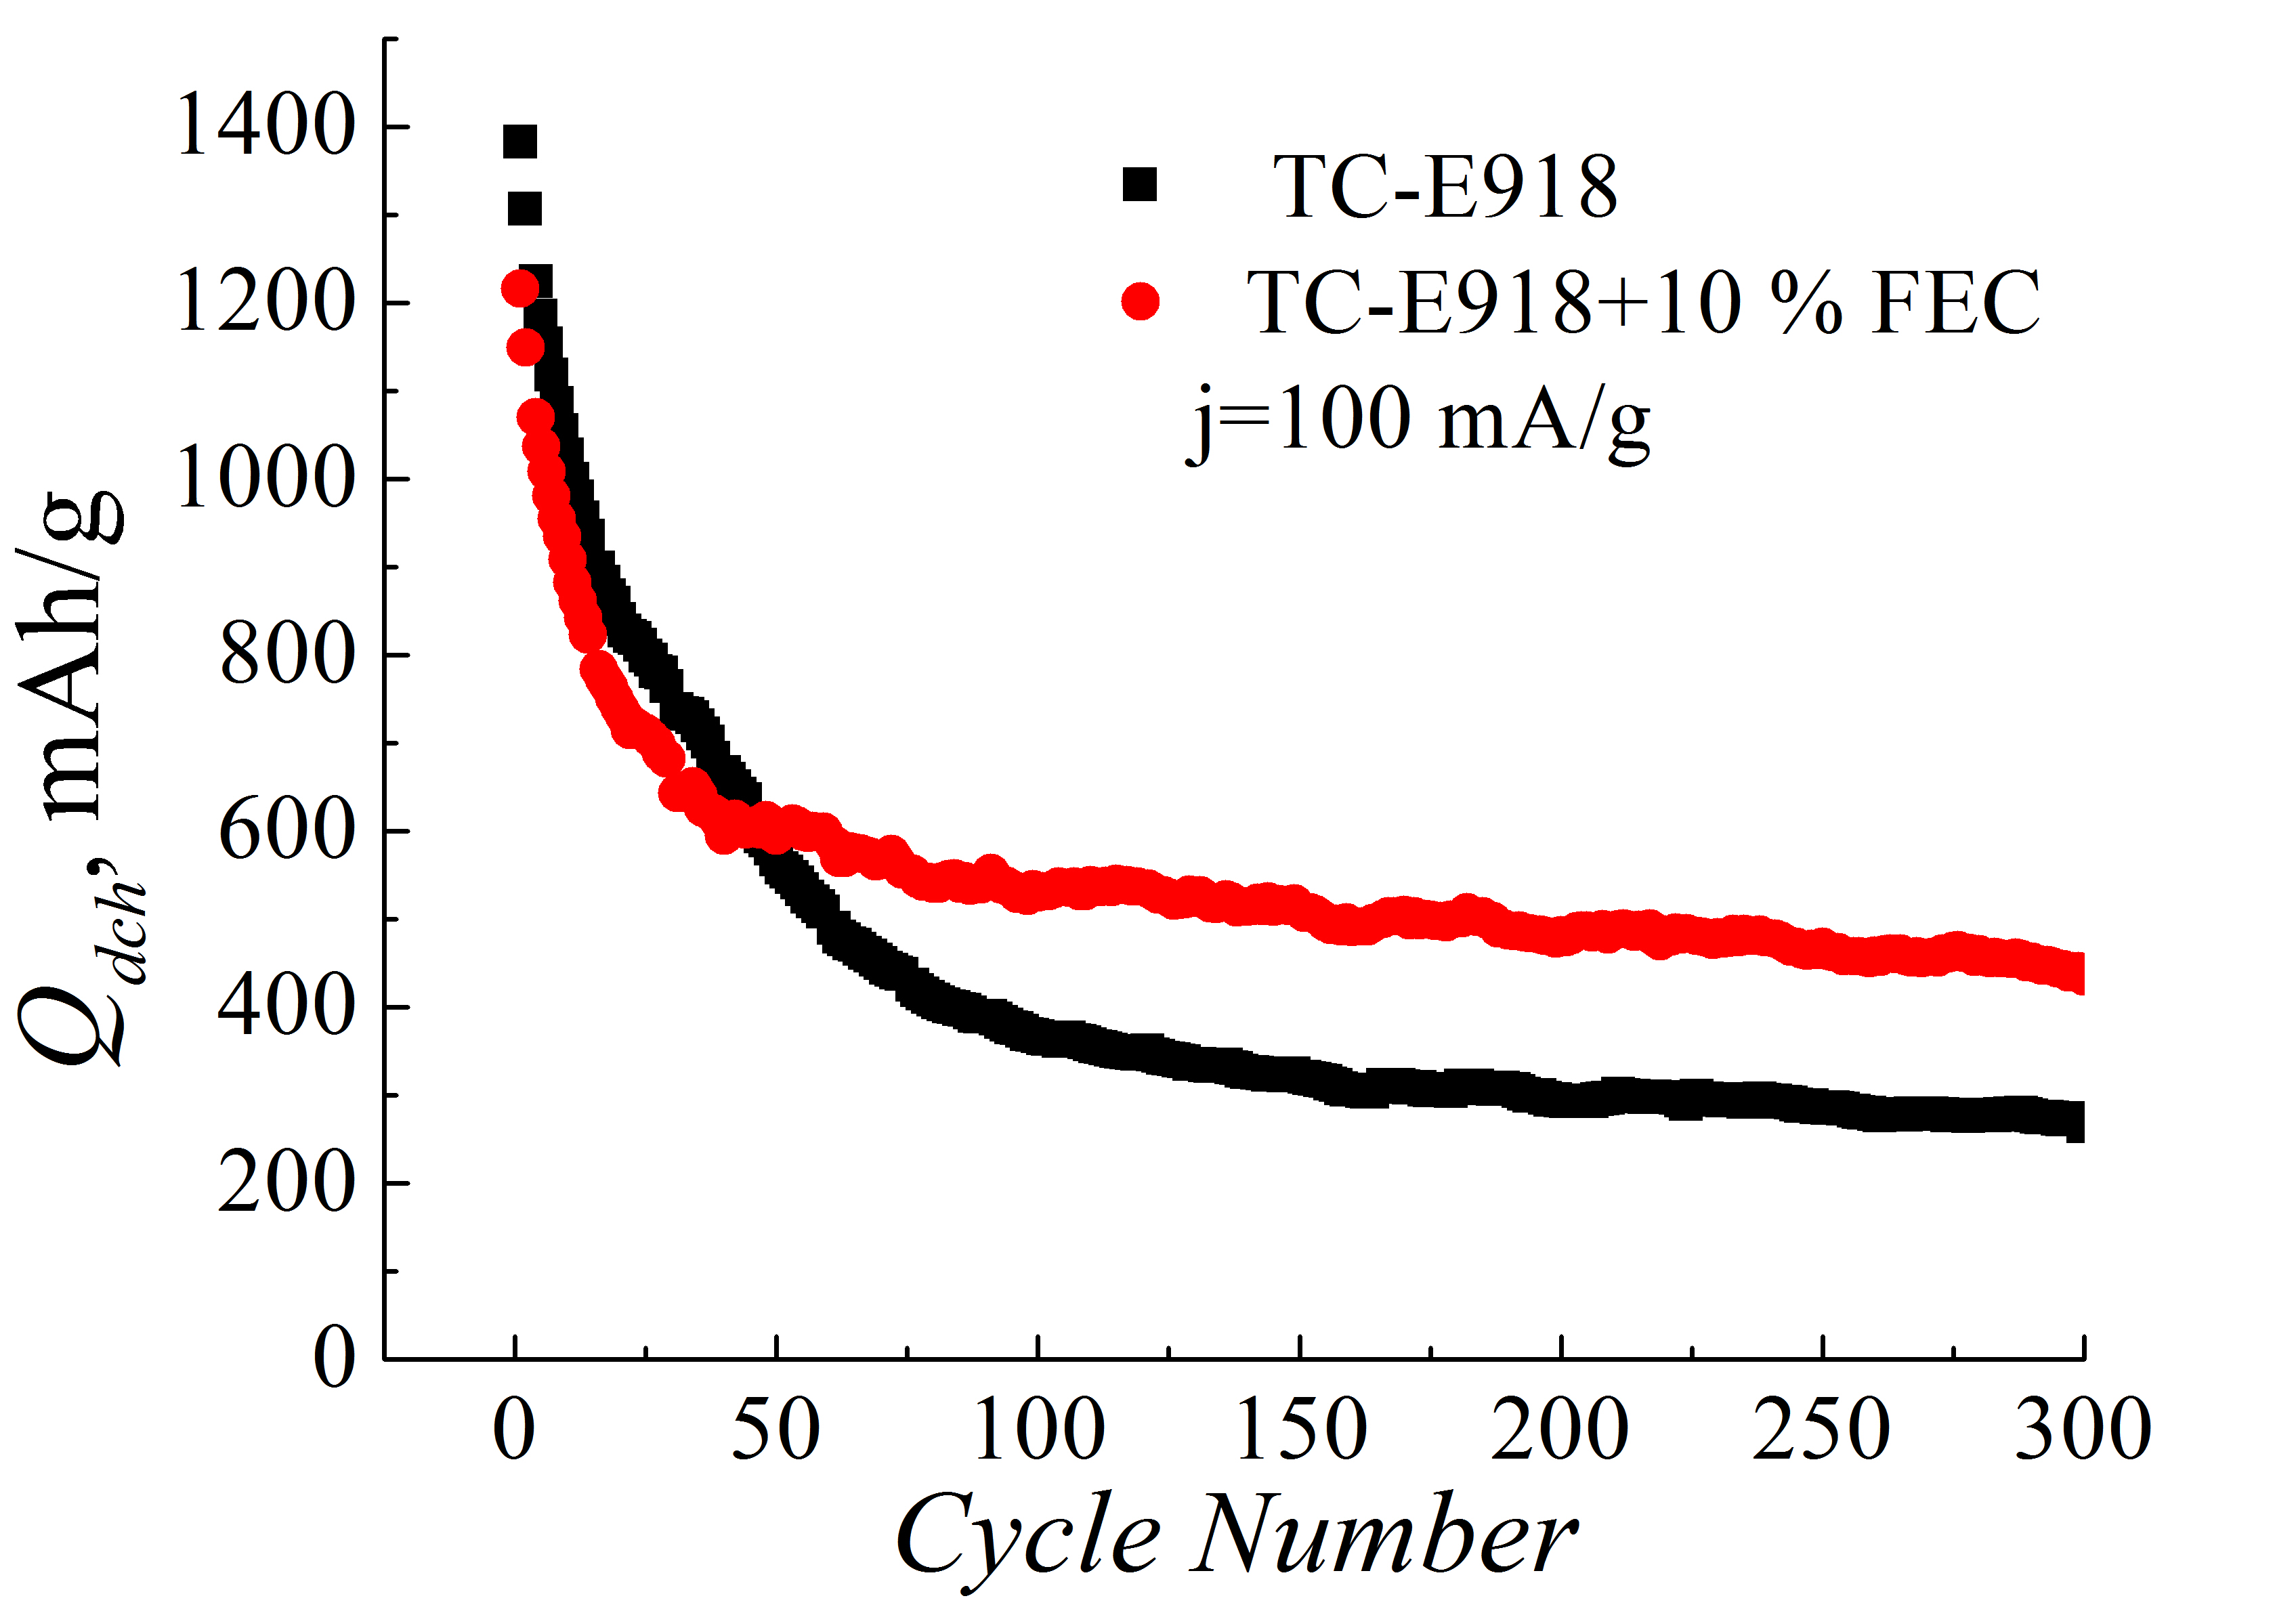
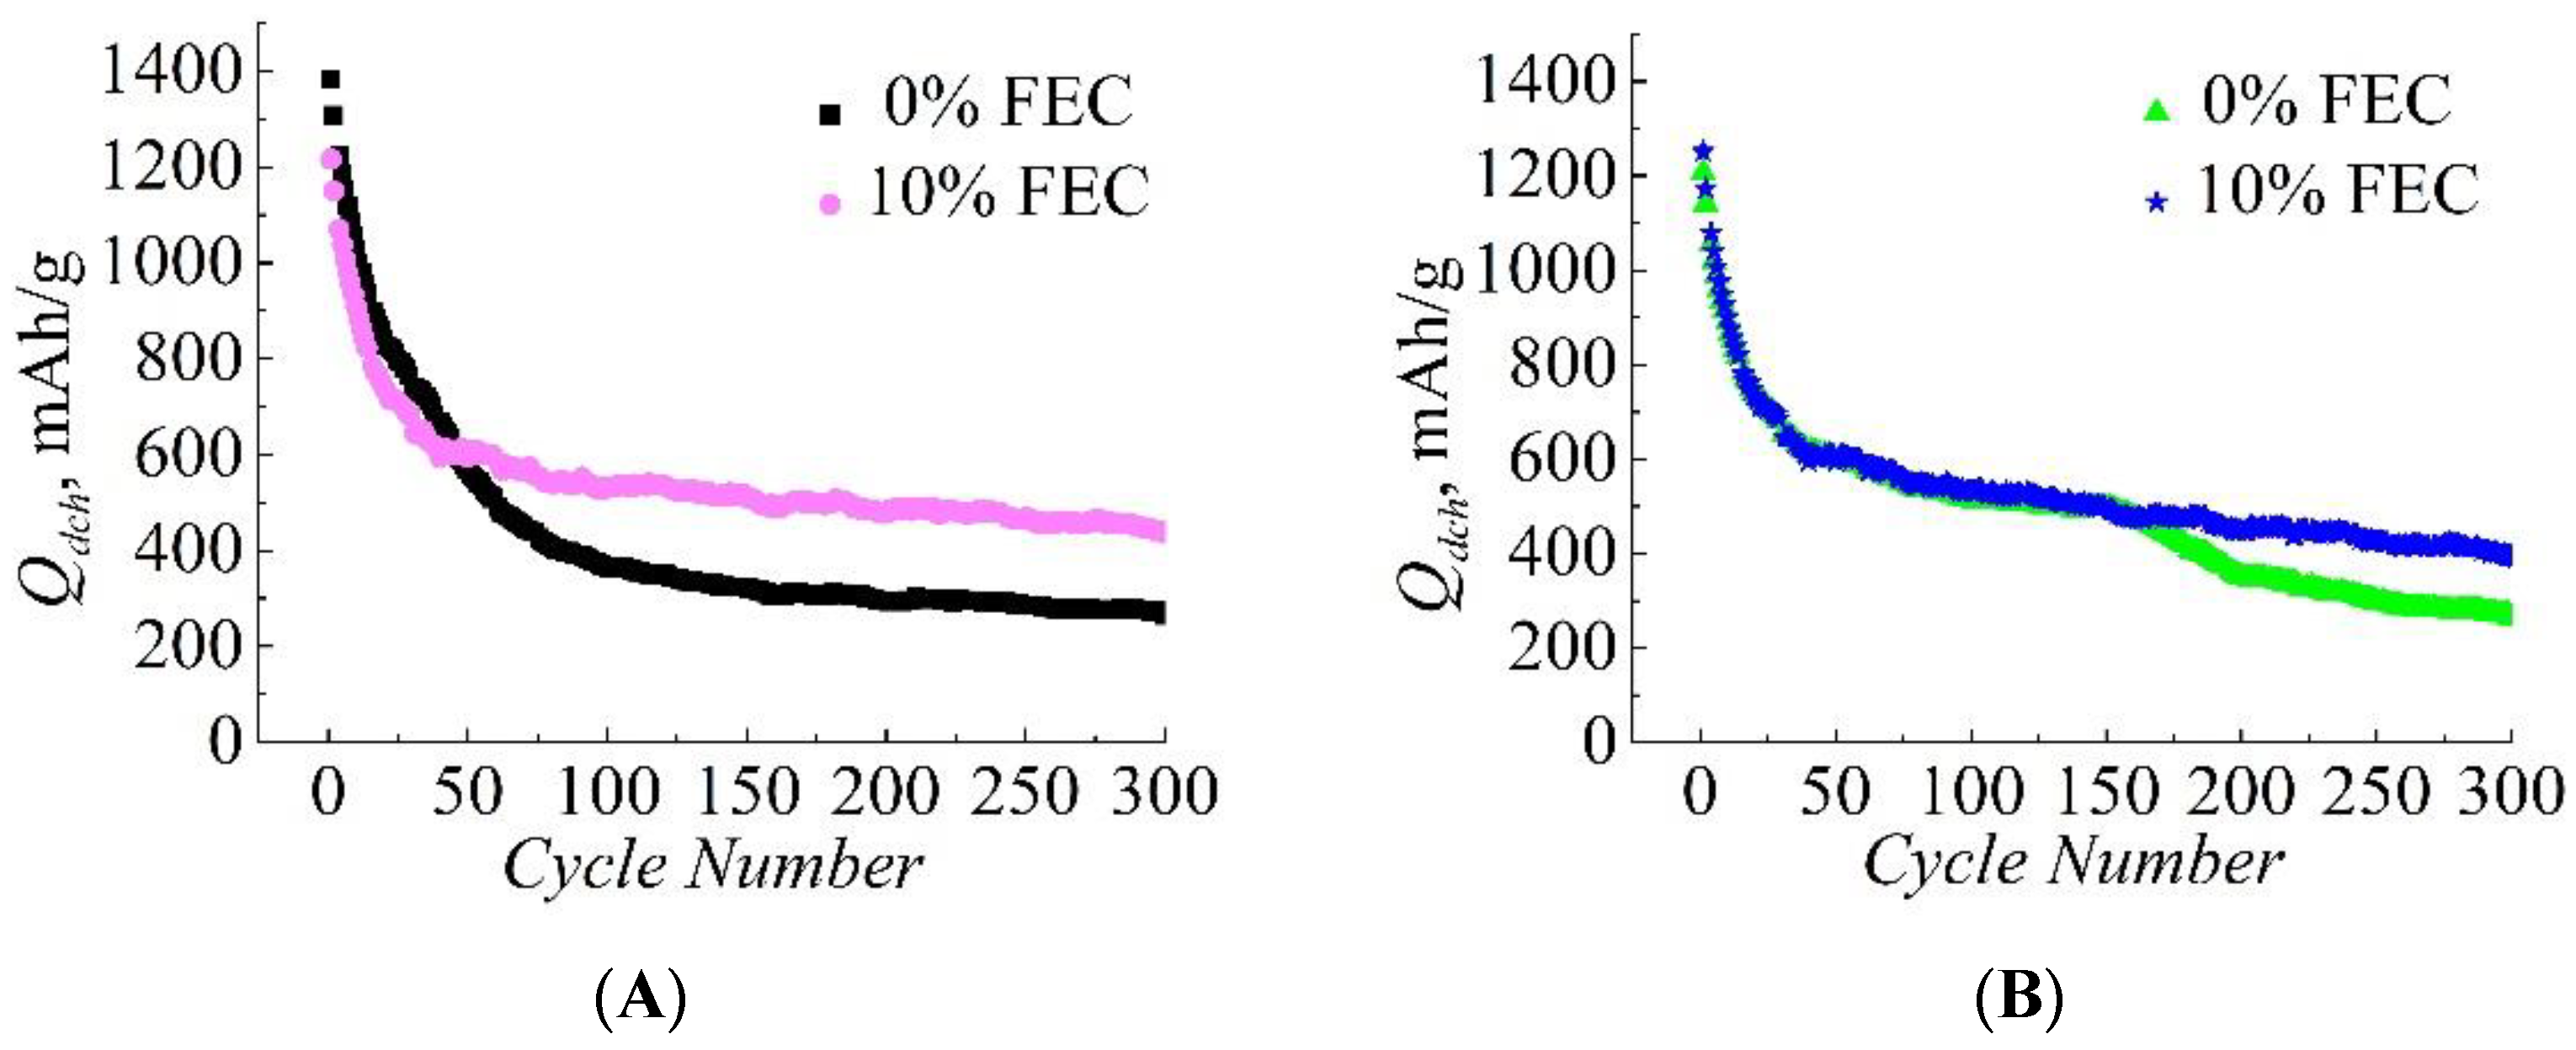
| Compared Pairs | Sample No. | S, cm2 | m Si/C, mg | j, mA/g | Capacity Retained at the 300th Cycle, Qdch(300)/Qdch(1) |
|---|---|---|---|---|---|
| A | 0% FEC | 1.77 | 1.67 | 100 | 20% |
| 10% FEC | 1.67 | 37% | |||
| B | 0% FEC | 1.50 | 22% | ||
| 10% FEC | 1.50 | 32% |
| Pair | A | B | ||||||
|---|---|---|---|---|---|---|---|---|
| Sample | 0% FEC | 10% FEC | 0% FEC | 10% FEC | ||||
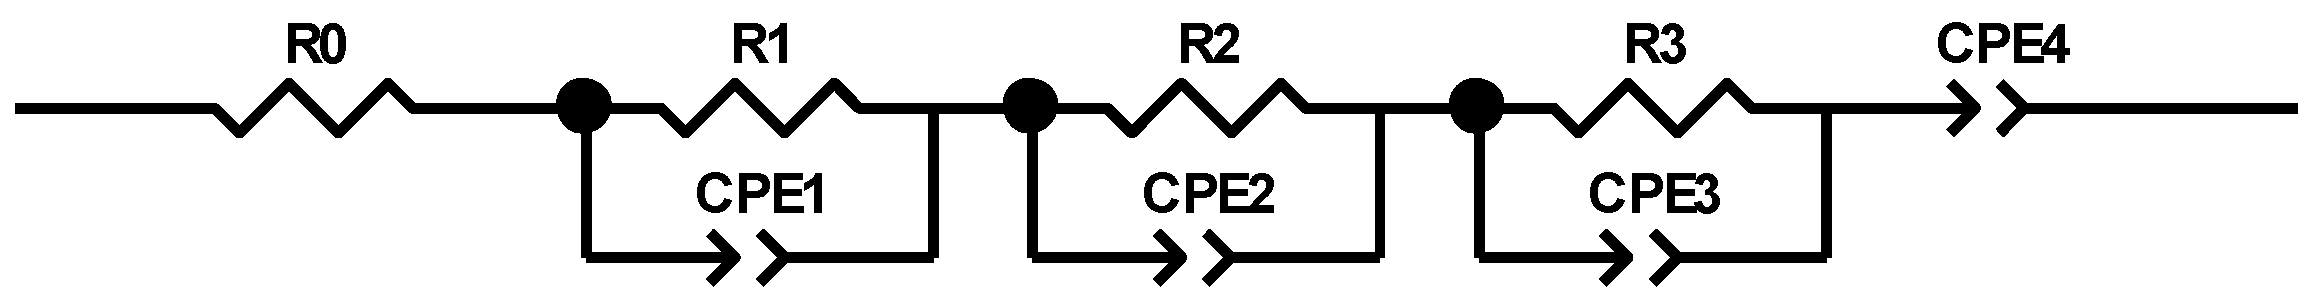
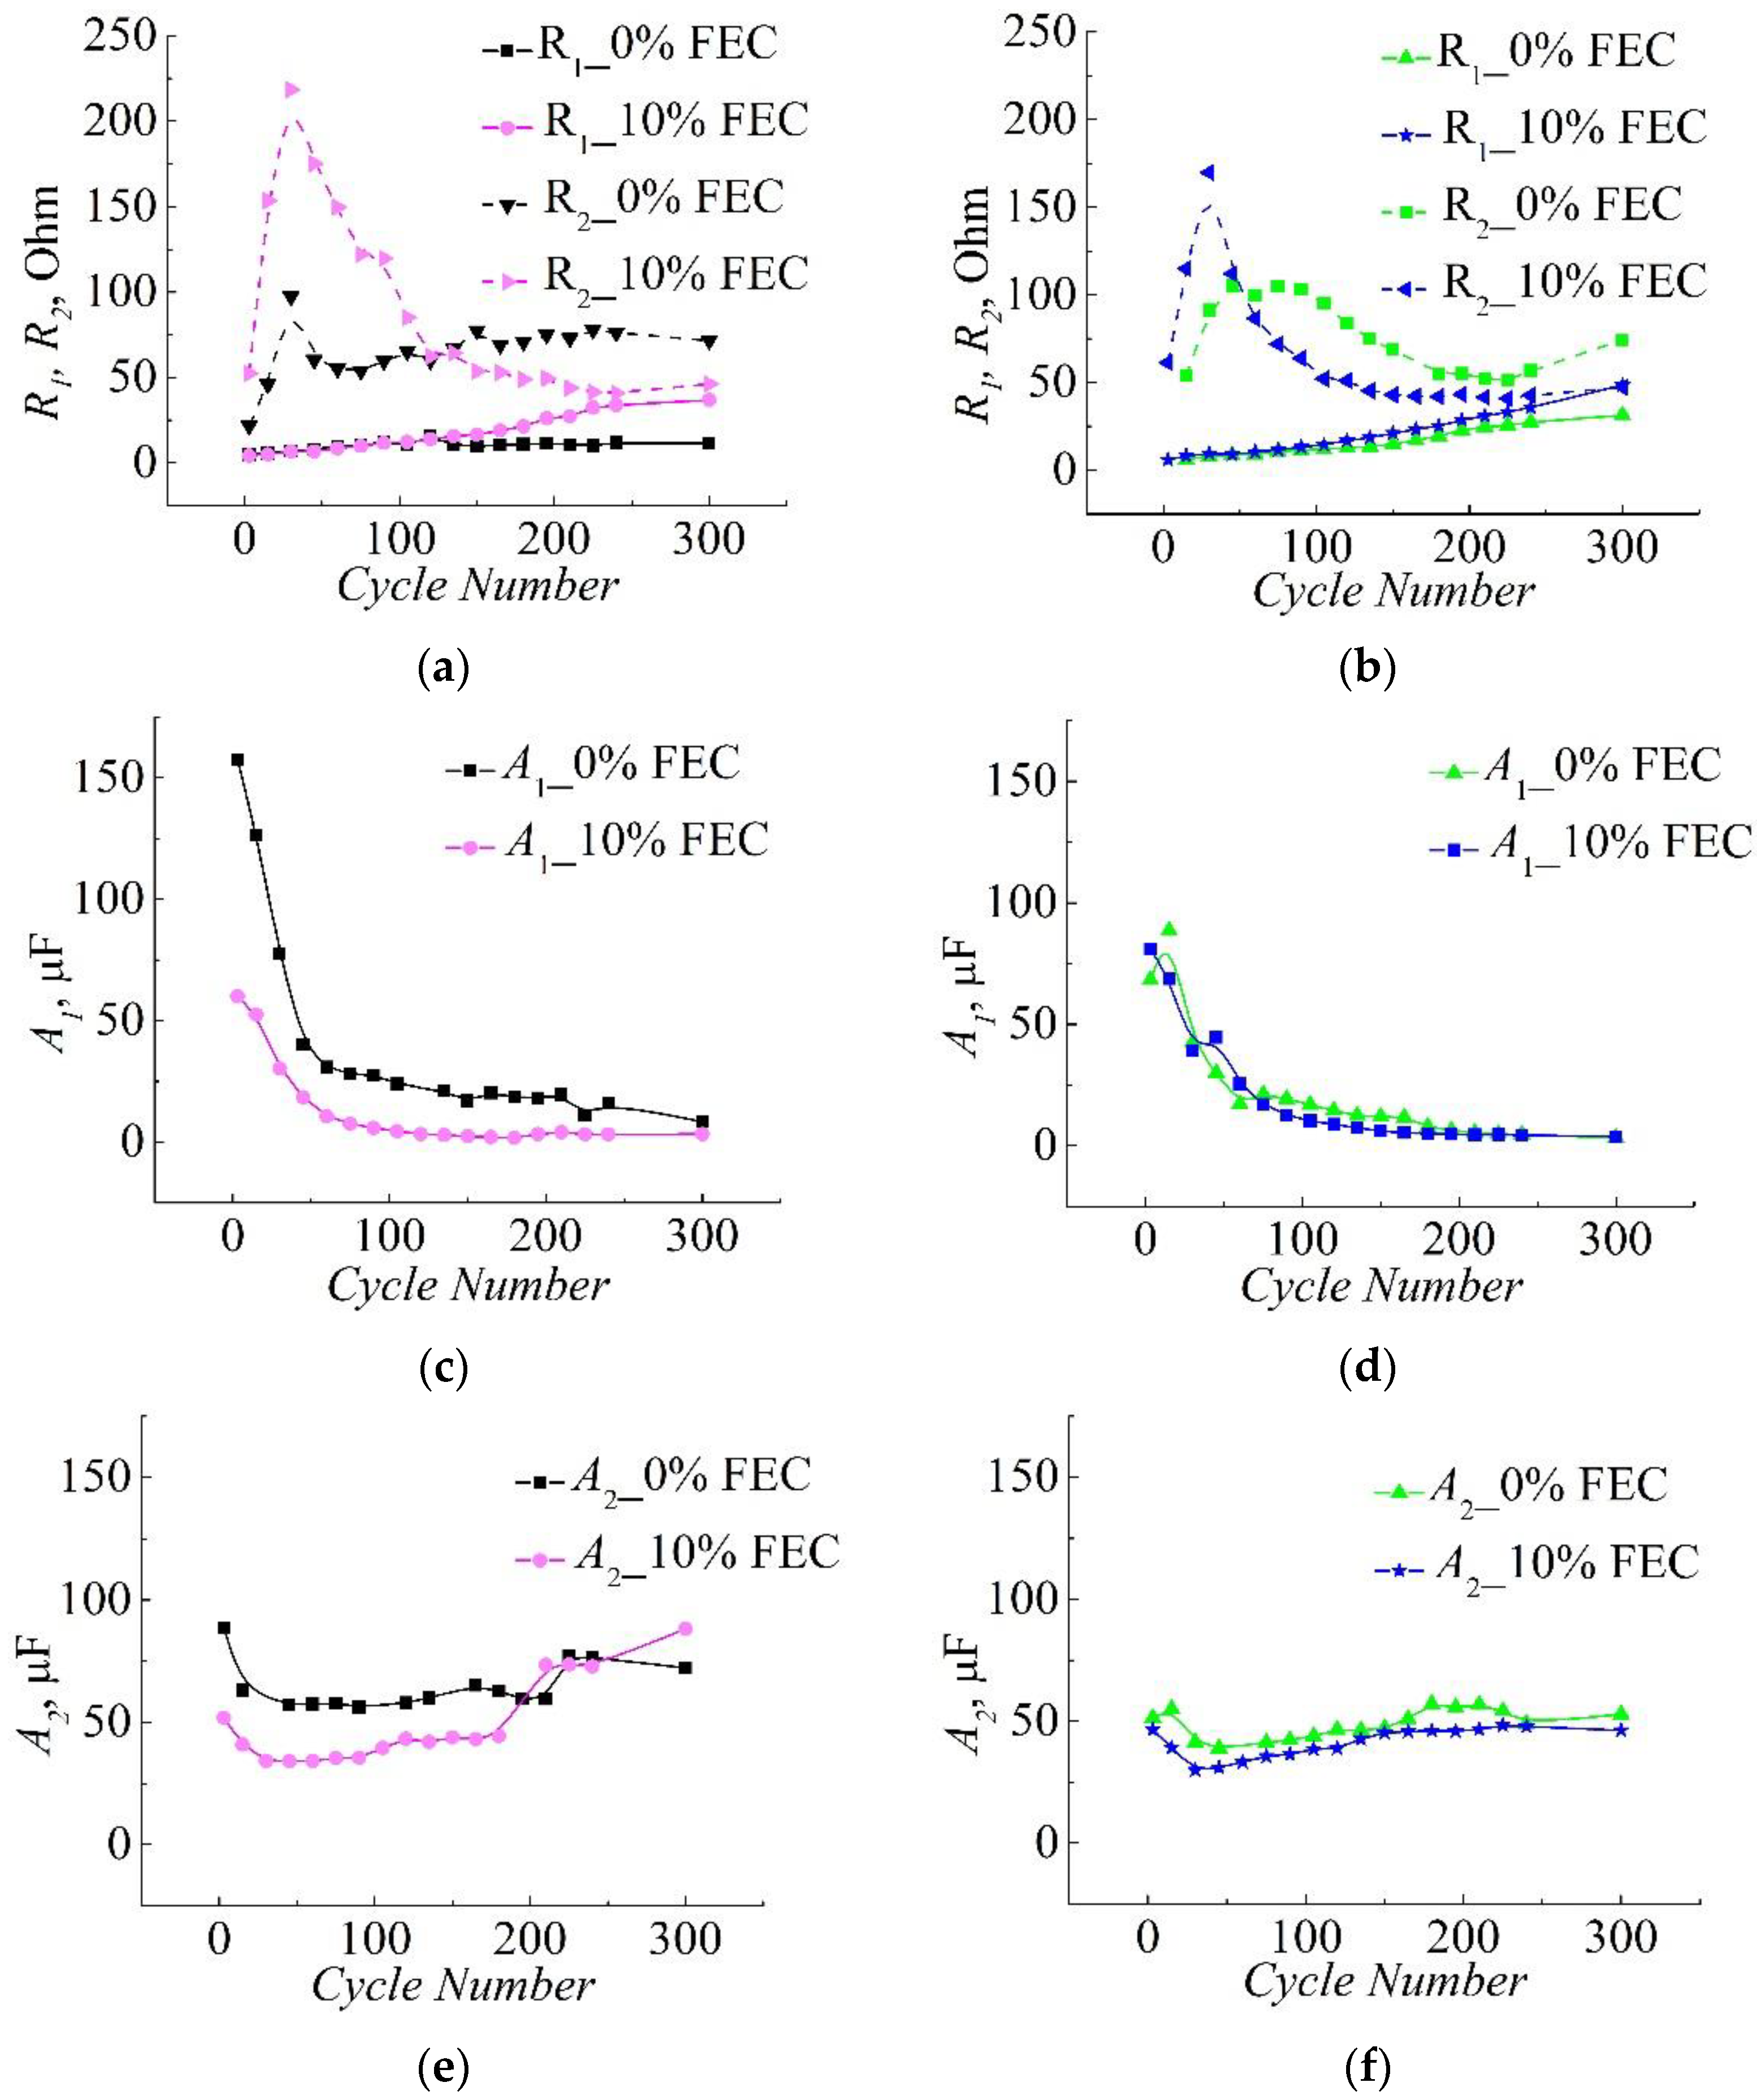
| Cycle No. | 3 | 300 | 3 | 300 | 3 | 300 | 3 | 300 |
| R0, Ohm | 6.6 | 13.6 | 6.6 | 12.5 | 6.7 | 11.8 | 6.8 | 12.1 |
| R1, Ohm | 4.8 | 11.4 | 4.2 | 36.8 | 30.7 | 31.3 | 5.9 | 48.6 |
| A1, µF | 157.0 | 8.40 | 60.1 | 3.28 | 68.3 | 3.26 | 81.0 | 3.72 |
| n1 | 0.7 | 0.7 | 0.8 | 0.7 | 0.85 | 0.7 | 0.75 | 0.7 |
| R2, Ohm | 21.7 | 71.6 | 52.4 | 46.2 | 4.0 | 74.2 | 61.3 | 47.3 |
| A2, µF | 88.7 | 72.3 | 51.9 | 88.2 | 51.4 | 52.9 | 46.6 | 46.3 |
| n2 | 0.85 | 0.7 | 0.85 | 0.7 | 0.8 | 0.75 | 0.85 | 0.8 |
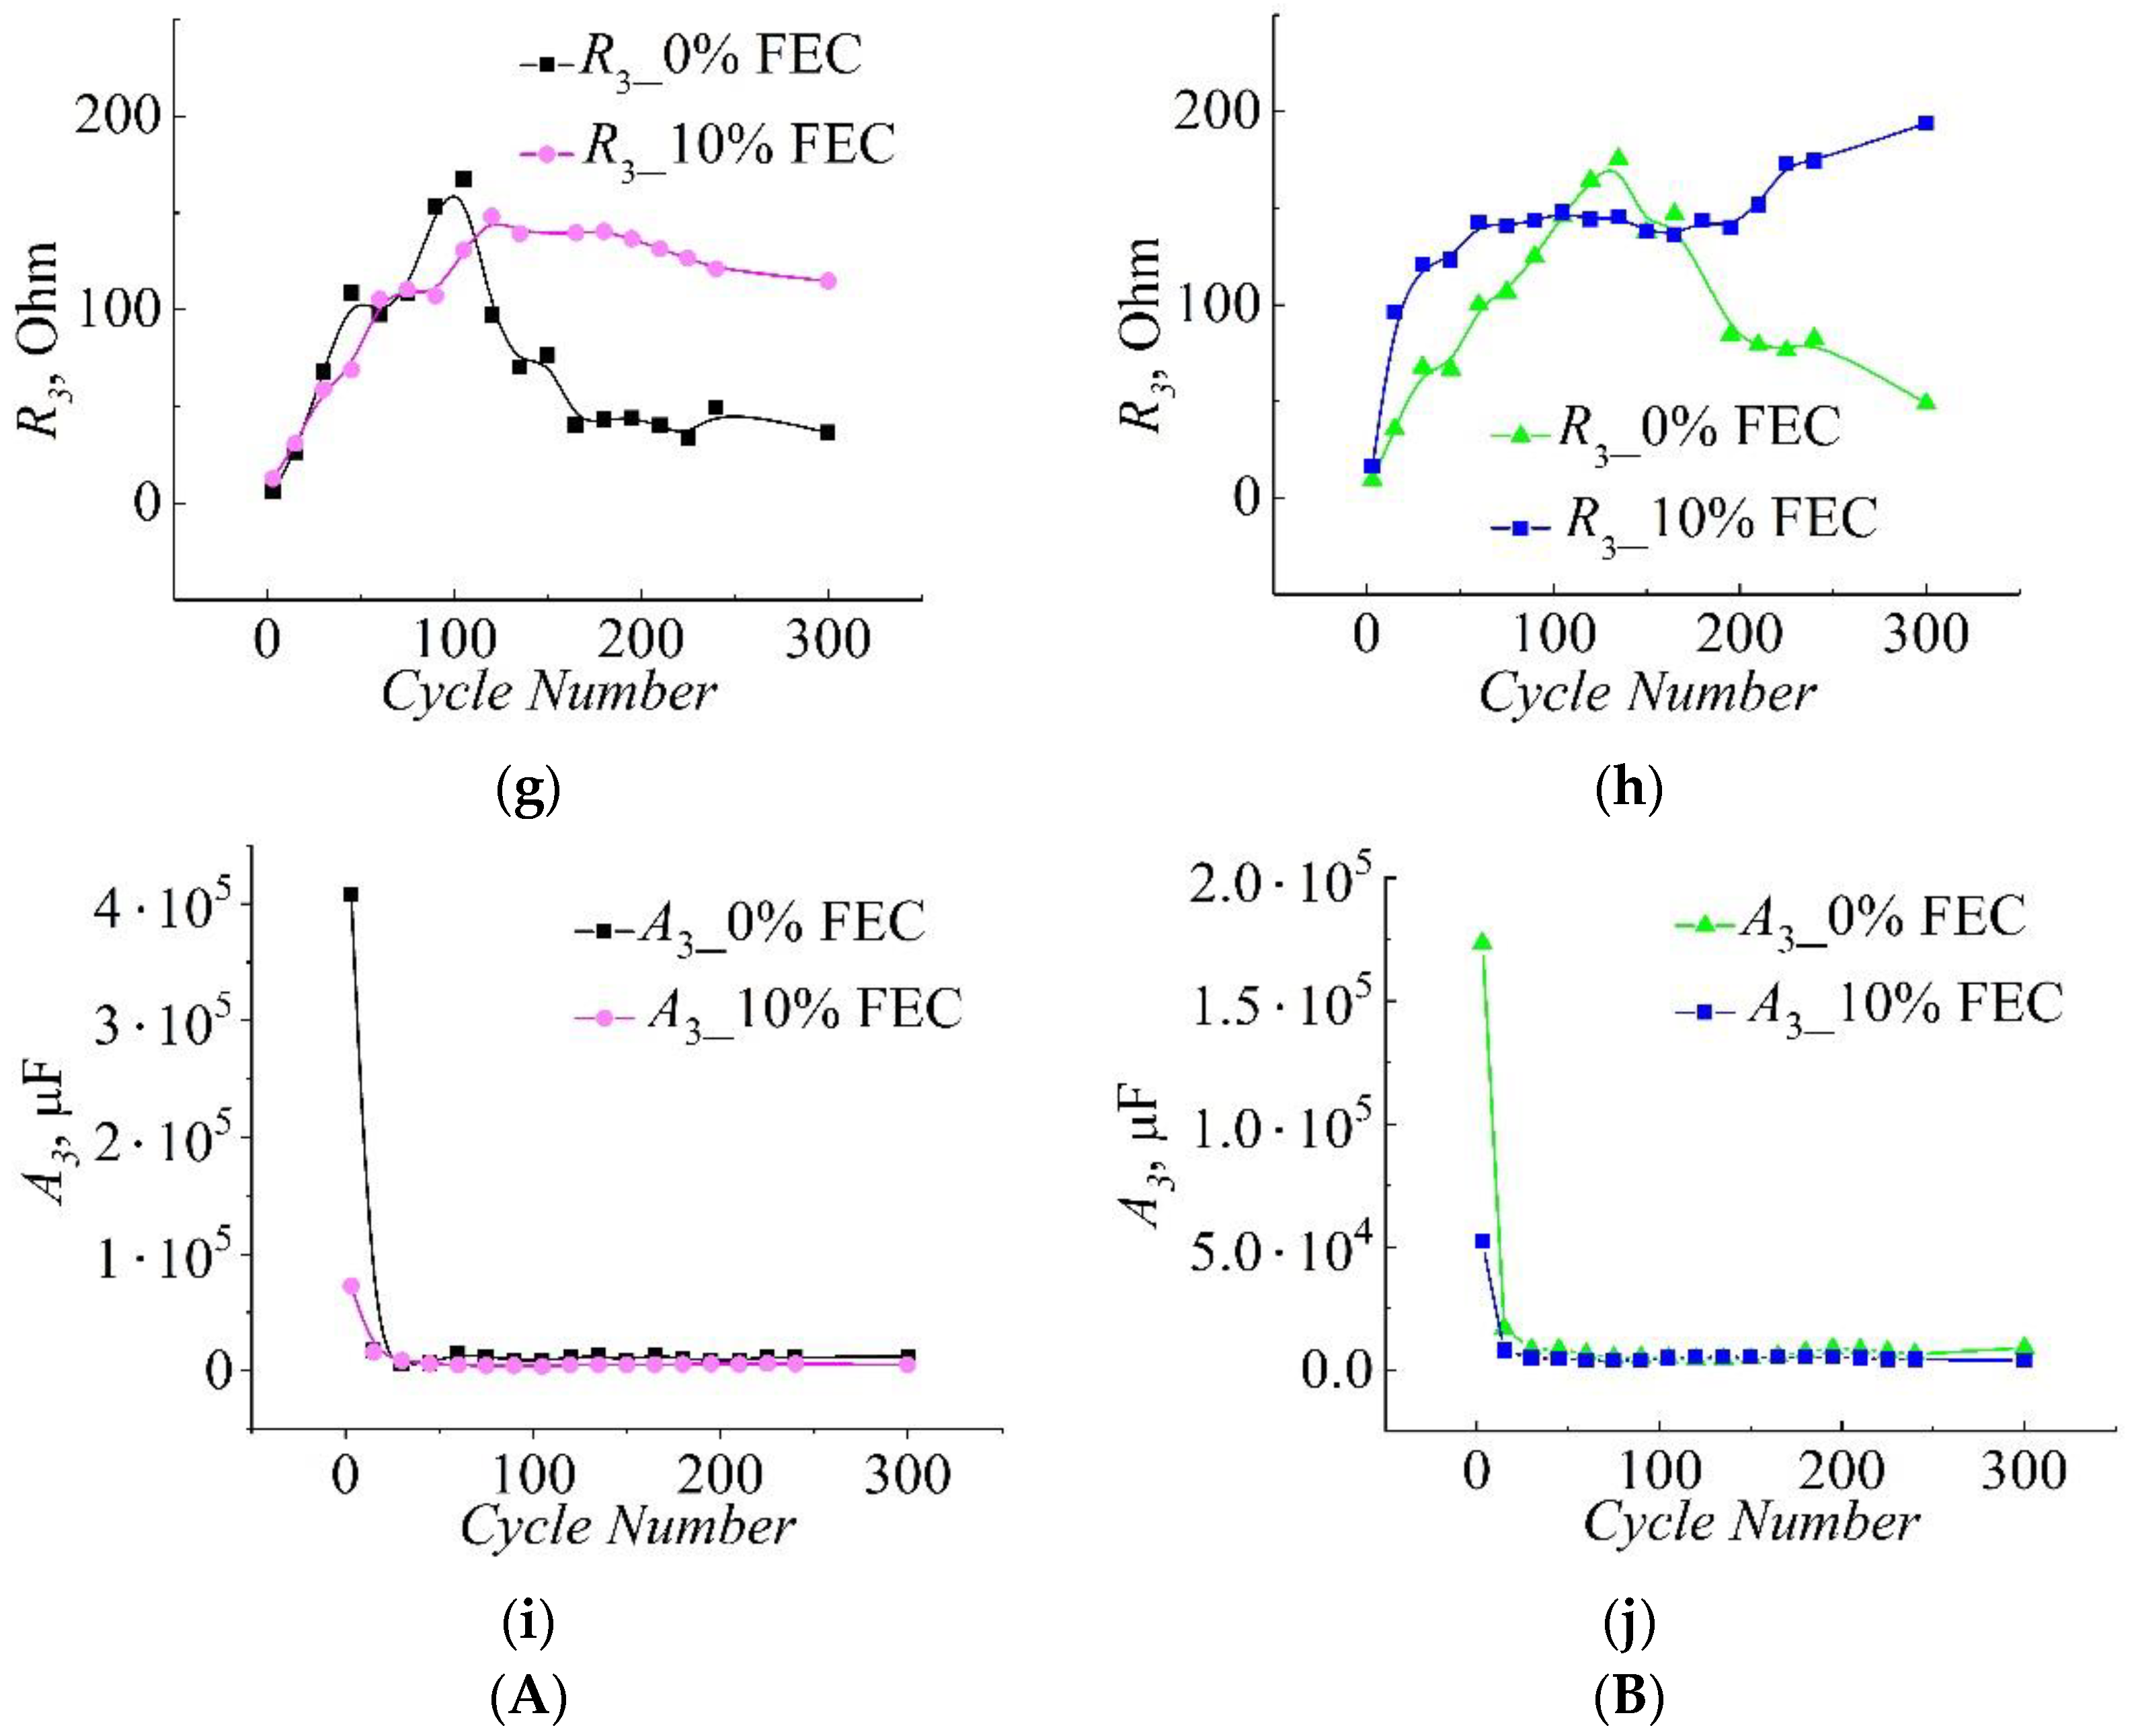
| R3, Ohm | 6.12 | 36.4 | 12.67 | 115.0 | 9.14 | 48.8 | 16.0 | 194.0 |
| A3, 104µF | 40.72 | 1.24 | 7.28 | 0.52 | 17.34 | 0.9 | 5.23 | 0.39 |
| n3 | 0.7 | 0.7 | 0.8 | 0.65 | 0.7 | 0.7 | 0.8 | 0.65 |
| A4, Ohm−1·Hz−n4 | 0.168 | 0.052 | 0.097 | 0.048 | 0.133 | 0.02 | 0.091 | 0.040 |
| n4 | 0.6 | 0.63 | 0.5 | 0.5 | 0.6 | 0.45 | 0.5 | 0.5 |
Publisher’s Note: MDPI stays neutral with regard to jurisdictional claims in published maps and institutional affiliations. |
© 2022 by the authors. Licensee MDPI, Basel, Switzerland. This article is an open access article distributed under the terms and conditions of the Creative Commons Attribution (CC BY) license (https://creativecommons.org/licenses/by/4.0/).
Share and Cite
Parfeneva, A.V.; Rumyantsev, A.M.; Lozhkina, D.A.; Maximov, M.Y.; Astrova, E.V. Influence of Fluoroethylene Carbonate in the Composition of an Aprotic Electrolyte on the Electrochemical Characteristics of LIB’s Anodes Based on Carbonized Nanosilicon. Batteries 2022, 8, 91. https://doi.org/10.3390/batteries8080091
Parfeneva AV, Rumyantsev AM, Lozhkina DA, Maximov MY, Astrova EV. Influence of Fluoroethylene Carbonate in the Composition of an Aprotic Electrolyte on the Electrochemical Characteristics of LIB’s Anodes Based on Carbonized Nanosilicon. Batteries. 2022; 8(8):91. https://doi.org/10.3390/batteries8080091
Chicago/Turabian StyleParfeneva, Alesya V., Aleksander M. Rumyantsev, Darina A. Lozhkina, Maxim Yu. Maximov, and Ekaterina V. Astrova. 2022. "Influence of Fluoroethylene Carbonate in the Composition of an Aprotic Electrolyte on the Electrochemical Characteristics of LIB’s Anodes Based on Carbonized Nanosilicon" Batteries 8, no. 8: 91. https://doi.org/10.3390/batteries8080091
APA StyleParfeneva, A. V., Rumyantsev, A. M., Lozhkina, D. A., Maximov, M. Y., & Astrova, E. V. (2022). Influence of Fluoroethylene Carbonate in the Composition of an Aprotic Electrolyte on the Electrochemical Characteristics of LIB’s Anodes Based on Carbonized Nanosilicon. Batteries, 8(8), 91. https://doi.org/10.3390/batteries8080091