Article

Numerical Parametric Investigation of Nonaqueous Vanadium Redox Flow Batteries

College of Chemistry and Environmental Engineering, Shenzhen University, Shenzhen 518060, China
*
Author to whom correspondence should be addressed.
Batteries 2022, 8(8), 75; https://doi.org/10.3390/batteries8080075
Submission received: 1 June 2022 / Revised: 16 July 2022 / Accepted: 20 July 2022 / Published: 23 July 2022
(This article belongs to the Special Issue Redox Flow Batteries: Recent Advances and Perspectives)

Abstract

:
Nonaqueous redox flow batteries are promising candidates for large-scale energy storage technologies. However, the effect of structural design and key factors limiting the performance are still not thoroughly understood. In this work, we constructed a physical model to study the effect of various design parameters on the performance of such a battery. It was found that the kinetics of redox reaction was improved with active material concentration and electrode surface area. The modeling results also showed that the local current density was much higher in the vicinity of membrane than near the current collector due to relatively low ionic conductivity of electrolytes. Furthermore, decreasing the electrode thickness and increasing the membrane conductivity both reduced the voltage loss associated with ohmic resistance, thereby resulting in improved battery performance. The obtained numerical simulation results would be helpful not only for understanding the physicochemical process in nonaqueous vanadium flow batteries but also for future structural optimization of these batteries.

1. Introduction

Due to the necessity of decarbonization, renewable energy technologies have witnessed huge development over the past two decades. However, the intermittent nature of renewable energy sources, such as wind and solar, poses spatial and temporal gaps between the availability of energy and its consumption by the end-users. In order to address these issues, it is necessary to develop suitable energy storage systems for the power grid [1,2,3]. Unlike conventional solid-state batteries, RFBs are more promising for storing electricity in large-scale energy systems as they offer high efficiency and excellent scalability. Despite their attractive merits, the commercialization of RFB technology is still hindered by technical and economic barriers, including relatively low energy and power densities [4,5,6].
Currently, both aqueous and nonaqueous flow batteries are being studied. Aqueous electrolyte systems, such as all-vanadium, iron–chromium, and zinc–bromide, offer several advantages of high electrolyte conductivity, low viscosity, and potentially low cost of aqueous electrolyte, especially for zinc- or iron-based flow batteries [7,8,9,10]. Hence, up to now, most research in the field of flow batteries has focused on aqueous chemistry [11,12]. However, in aqueous systems, the achievable cell voltage is restricted by water electrolysis. In addition, the options for redox-active materials are also quite limited. Switching to a nonaqueous electrolyte enables an expanded potential window, which results in higher cell voltage and thus higher energy density compared to aqueous flow batteries. Because the restriction of redox potential caused by water electrolysis can be removed, nonaqueous electrolytes can also expand the selection range of redox-active materials and thus highly soluble redox couple can be identified to offer the possibility of higher energy densities [13,14,15,16]. Theoretically, using nonaqueous systems can also unlock the possibility of developing new redox-active materials with better reversibility and higher solubility, which might contribute to reduced kinetic and mass-transport losses to somehow compensate for the ohmic loss due to the lower ionic conductivity of nonaqueous electrolytes. In this sense, nonaqueous redox flow batteries (NRFBs) may open a new pathway towards achieving economically viable grid-level energy storage.
Compared to their aqueous counterparts, research on NRFBs is in its infancy. Studies have been carried out on the electrochemical performance of newly developed redox-active materials, salts, and solvent combinations [17,18,19,20,21,22,23,24,25,26,27]. However, most of these NRFBs were evaluated and tested only in static cells or nonoptimized flow cells exhibiting a relatively low power density (<50 mW cm−2). In order to reach the competitive cost target for large-scale energy storage, NRFBs must meet the 3.5 V, 130 mA cm−2, and 91% voltage efficiency requirements [28] if a coulombic efficiency of >90% is guaranteed by a highly selective membrane [29,30]. Such a requirement is rather demanding as the typical concentration of active materials in nonaqueous electrolyte and its ionic conductivity are only ~0.5 M L−1 and ~10 mS cm−1 [31,32], respectively. To date, there have been some experimental studies on performance characteristics and optimization of NRFBs [31,32]. Due to the fact that experimental investigations are costly and time-consuming, numerical modeling can act as an alternative tool for optimizing the operational and structural parameters of batteries and for identifying rate-limiting processes or factors [33,34]. A few numerical models have already been developed to simulate the operation of aqueous flow batteries [35,36,37,38,39,40,41,42,43,44,45,46,47,48,49,50,51,52]. Shah et al. [35] developed a two-dimensional transport model for vanadium redox flow batteries (VRFBs), which was utilized to investigate the effects of electrode porosity, flow rate, and vanadium ion concentration on the battery performance. Zhang et al. [36] presented a simplified two-dimensional model to explore the influence of operating current density and electrode porosity on the charge–discharge performance of VRFBs. To study the effects of temperature variations on the battery charge–discharge behavior, Shah et al. [37] also built a nonisothermal model for VRFBs. Knehr et al. [38] developed a transient model incorporating vanadium crossover and water transport through the membrane. With this model, the effects of vanadium crossover and water transport on the battery performance were investigated. Recently, Zhou and Zhao [39] presented a two-dimensional VRFB model to investigate the effects of porous membrane properties and operational conditions on the battery performance. However, there are no models of NARFBs of sufficient complexity to simulate battery behavior during the charge–discharge process.
In this work, we present a two-dimensional, transient model to simulate the coupled mass/ion/electron transport and electrochemical reactions in nonaqueous redox flow batteries (NARFBs). The present model, which was developed based on the Darcy’s law and conservation of mass and charge, enables study of the effects of electrolyte properties, membrane properties, and electrode structural parameters on battery performance. Specifically, the nonaqueous vanadium flow battery was adopted as the model system as this type of NARFB has been widely investigated. The redox reactions of vanadium (III) acetylacetonate (V(III)(acac)3) at negative and positive half-cells are as follows [32]:
Negative   electrode :   [ V ( I I I ) ( a c a c ) 3 ] + e [ V ( I I ) ( a c a c ) 3 ]   E 0 = 1.75 V   v s .   A g / A g +
Positive   electrode :   [ V ( I I I ) ( a c a c ) 3 ] [ V ( I V ) ( a c a c ) 3 ] + + e   E 0 = 0.45 V   v s .   A g / A g +
V(III) is present in both the negative and positive electrolytes. During charge, V(III) is reduced to V(II) in the negative electrode and oxidized to V(IV) in the positive electrode, whereas V(II) is oxidized to V(III) in the negative electrode and V(IV) is reduced to V(III) in the positive electrode during discharge [32]. The positive and negative electrolytes are solutions of vanadium acetylacetonate and tetraethylammonium tetrafluoroborate (TEABF4) dissolved in acetonitrile (CH3CN) [32].

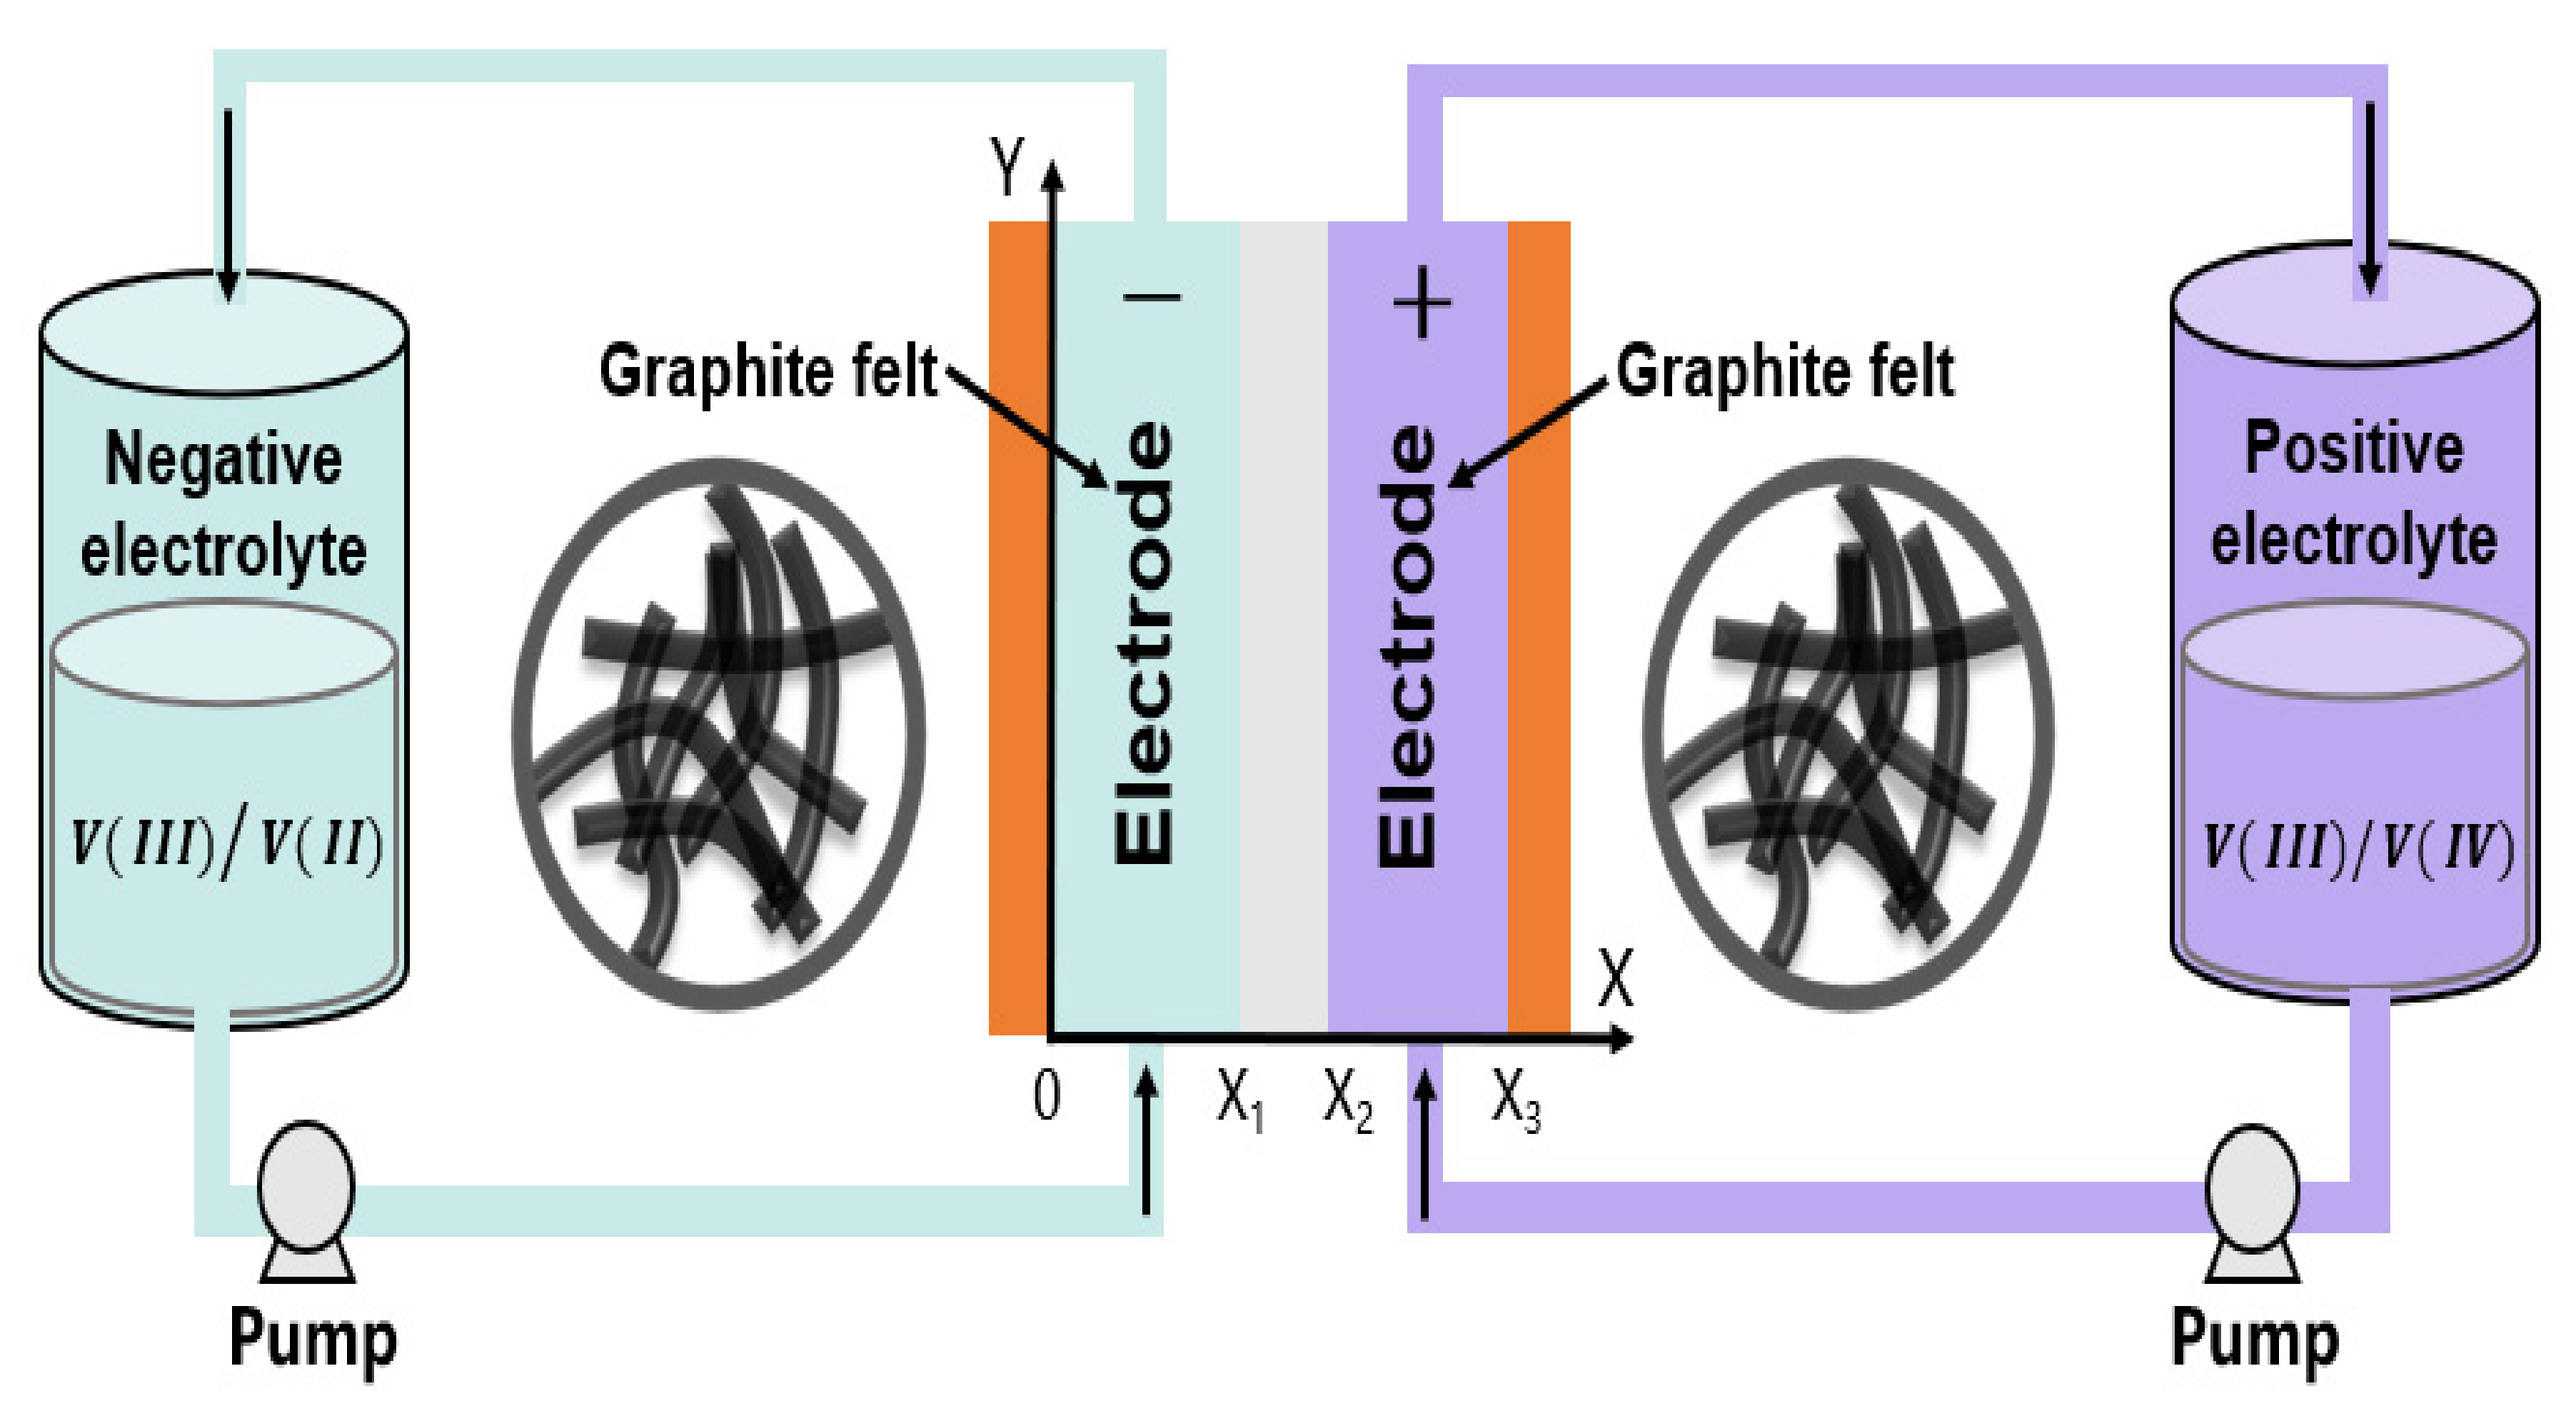
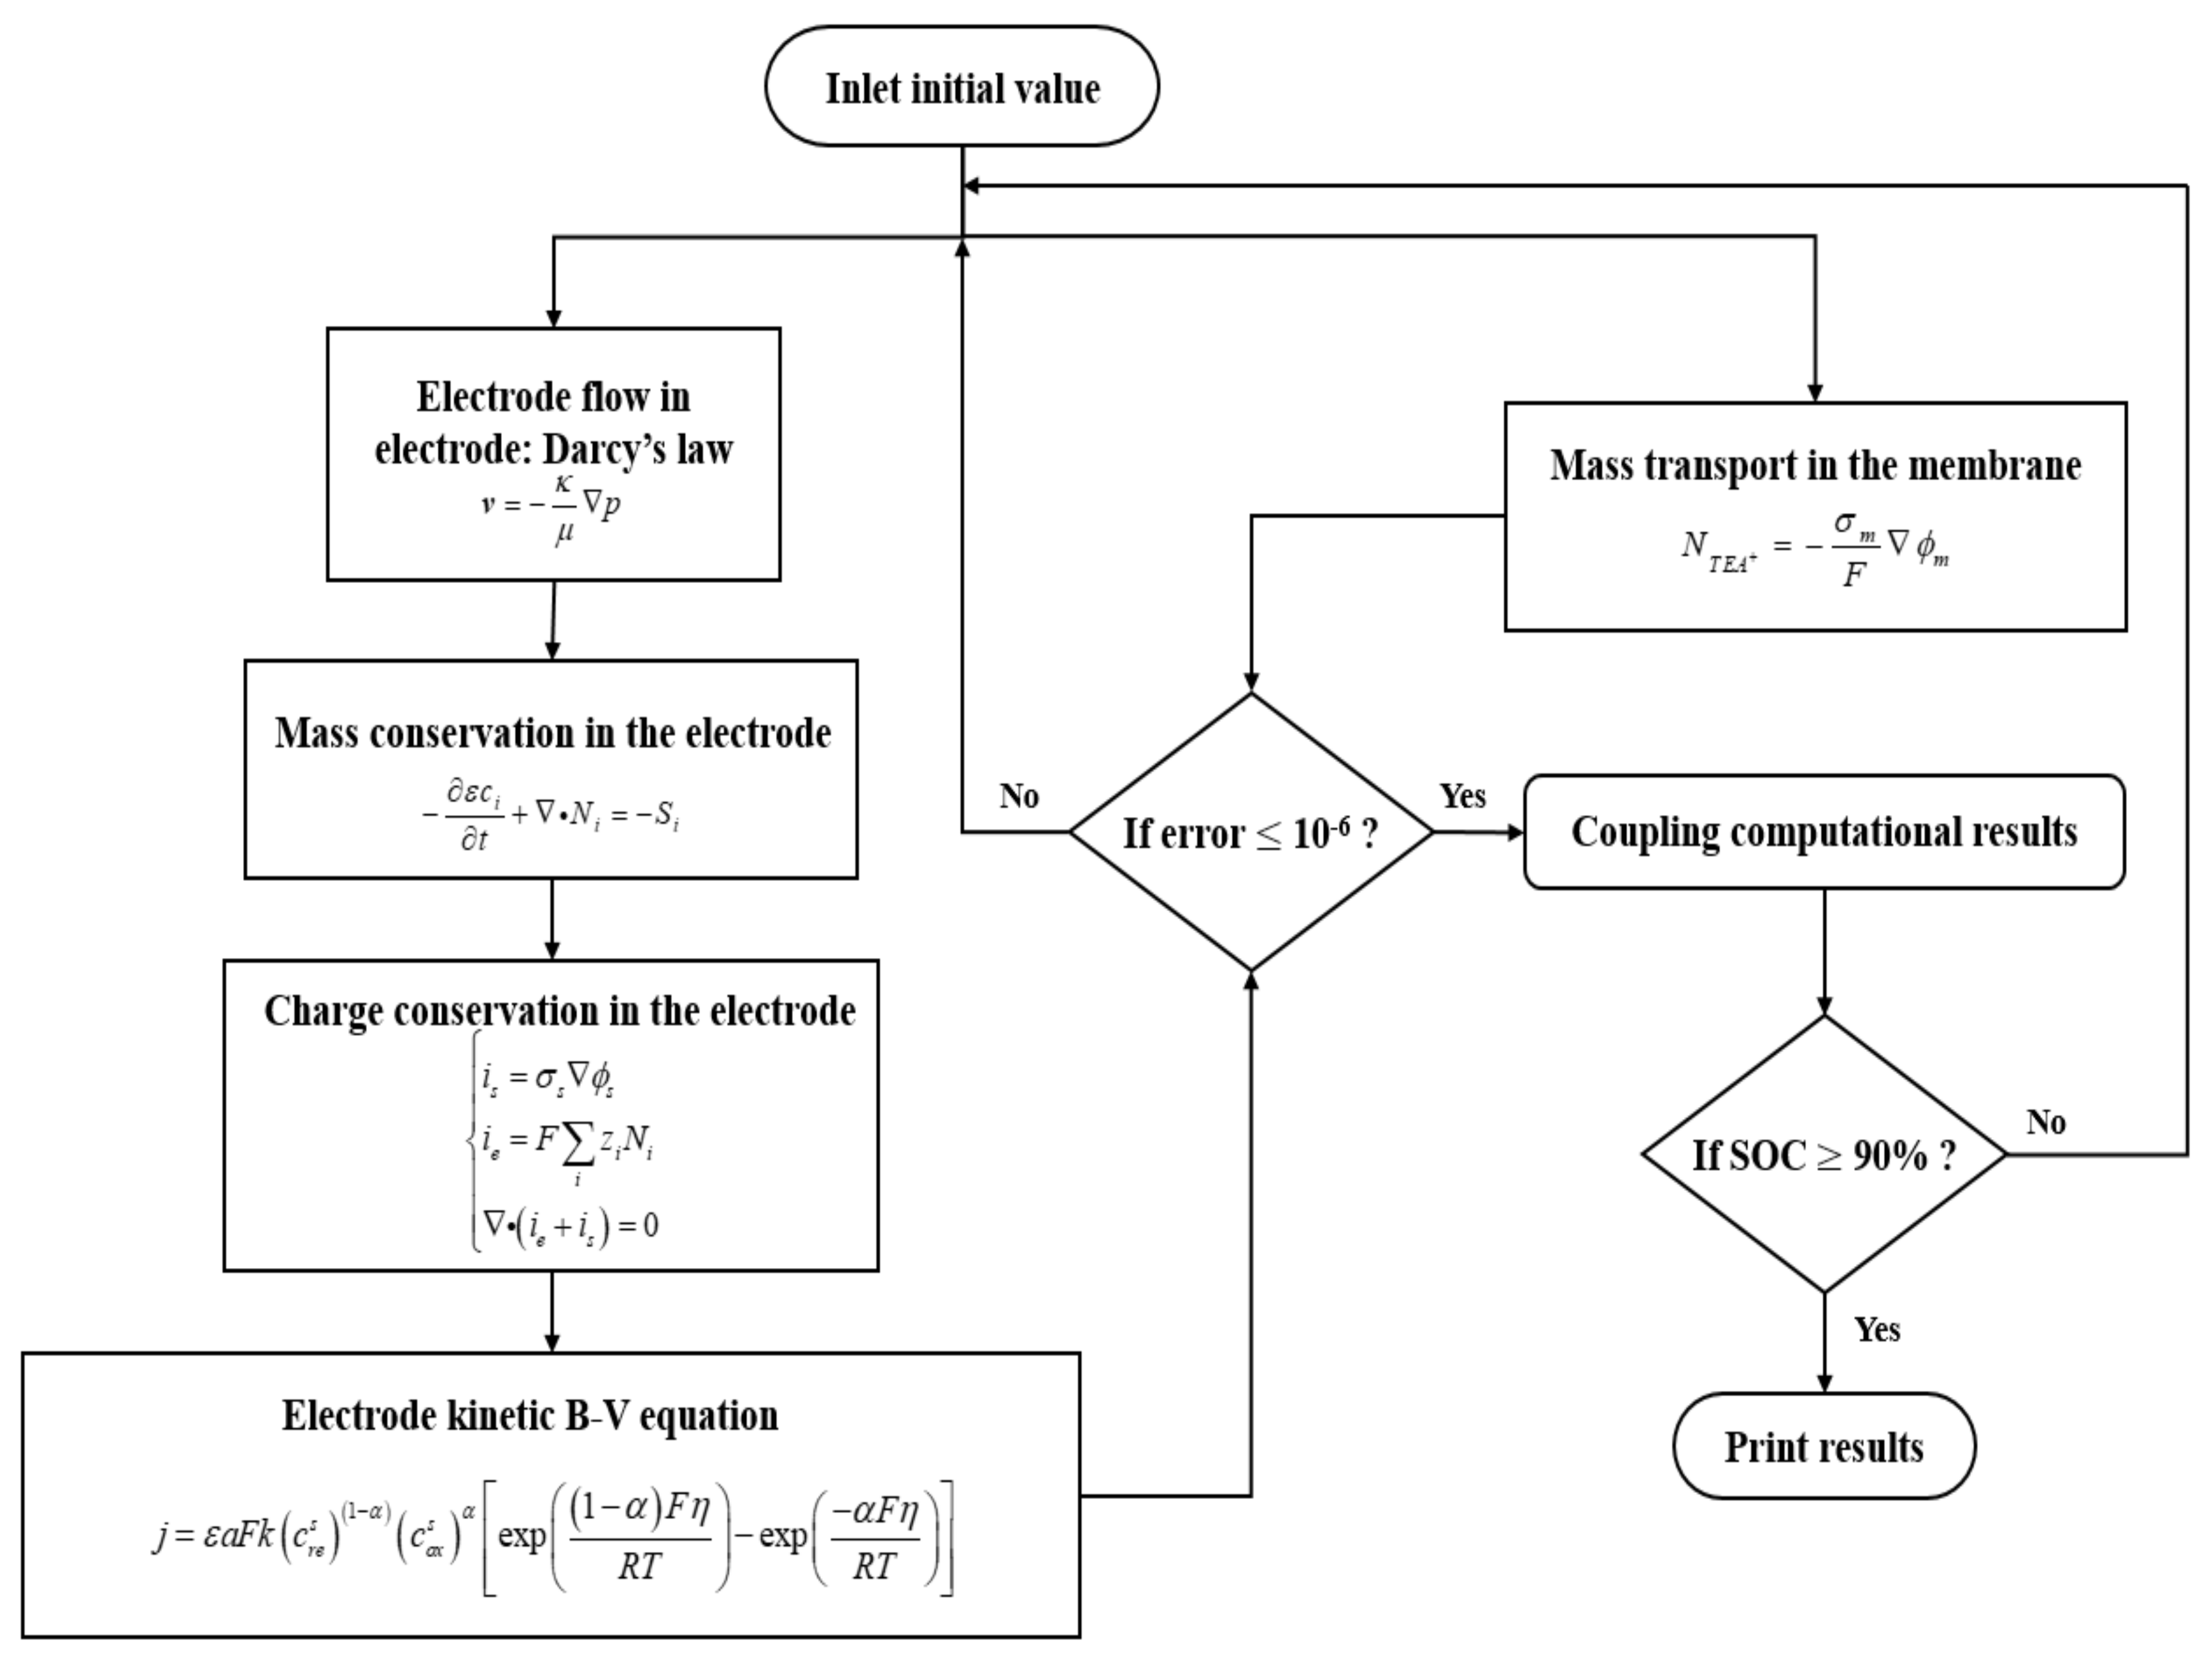
2. Model Formulation

As depicted in Figure 1, the present model considers a computational domain that consists of two porous carbon electrodes separated by a membrane. The geometrical parameters and physical/chemical properties of the electrodes and membrane are summarized in Table 1. To describe physical/chemical processes that occur in the battery, simplifications and assumptions in the present model were made:
(1)
Variations of redox-active species, solid/liquid potentials, pressure, and velocity in the direction perpendicular to the x–y plane were neglected.
(2)
The fluid flow through the porous electrodes was considered to be incompressible.
(3)
The cell was assumed to be isothermal.
(4)
Parasitic reactions were neglected.
(5)
The membrane was a cation exchange membrane, and tetraethylammonium ions (TEA+) were assumed to be the only charge carrier and transfer in the membrane; other solvent and redox-active species crossover through the membrane was not considered.
Figure 1. The computational domains of the present study.
Batteries 08 00075 g001
Table 1. Electrolyte properties.
TermValue
Electrolyte density800 kg m−3
Electrolyte dynamic viscosity 0.34 Pa s
V(II) ion diffusivity, DV2 [53]3.93 × 10⁻¹⁰ m2 s−1
V(III) ion diffusivity, DV3 [53]3.93 × 10⁻¹⁰ m2 s−1
V(IV) ion diffusivity, DV4 [53]3.93 × 10⁻¹⁰ m2 s−1
TEA+ ion diffusivity, DTEA+ [54]1.88 × 10⁻⁹ m2 s−1
Tetrafluoroborate (BF4-) ion diffusivity, DBF4- [54]3.33 × 10⁻⁹ m2 s−1
Adjusting   factor ,   θ *9
* Fitted parameter.

2.1. Governing Equations

2.1.1. Transport Processes in Porous Electrodes

During the operation of NRFBs, the electrolyte-containing solvent (CH3CN) and solutes (dissolved redox-active species and charge carriers) are pumped to the porous electrodes. The electrolyte flow through the porous carbon electrodes can be described by Darcy’s law:
v = κ μ p
where κ is the porous electrode permeability; μ denotes the viscosity of the anolyte or catholyte; and p should be the liquid pressure of electrolytes, which can be obtained with the law of overall mass conversation:
ρ v = 0
where ρ denotes the density of electrolyte solutions, as provided in Table 2.
For the redox-active species and charge carriers (exclude the BF4) in the electrolyte solutions, the mass conservation can be formulated as follows:
ε c i t + N i = S i
where ε represents the electrode porosity; ci refers to the concentration of species i; Ni denotes the concentration flux of species i, and Si refers to the source term, as indicated in Table 3. The concentration of BF4 can be calculated with the electro-neutrality condition:
i z i c i = 0
where zi refers to the valence of species i.
The concentration flux of species i, Ni, can be best expressed by the Nernst–Planck equation.
N i = D i e f f c i z i u i e f f c i F ϕ e + v c i
where F is the Faraday constant; ϕ e is the liquid electrolyte potential; and u i e f f and D i e f f denote the effective mobility and diffusivity of species i, which can be expressed as follows:
u i e f f = u i N M θ
D i e f f = D i N M θ
where Di and u i are the intrinsic diffusivity and mobility of species i, NM is the MacMullin number [39], θ is the adjusting factor accounting for the effects of the viscosity [33].
With respect to charge conservation in the electrodes, the charge leaving (or entering) the liquid electrolyte is balanced by that entering (or leaving) the solid porous matrix. We thus have the following:
i s = i e = j
where j refers to the local current density, and i s and i e are the electronic and ionic current densities, respectively, which can be calculated as follows:
i s = σ s ϕ s
i e = F i z i N i
where σ s is the effective electronic conductivity, and ϕ s is the potential in the solid matrix.

2.1.2. Transport Processes in the Membrane

A commercial microporous separator (Daramic 175 SLI flat sheet) with thickness of 250 µm and conductivity of 17 mS cm−1 in 0.5 M TEABF4CH3CN solution [32] was used as the separator in the present modeling study. The other properties and operational conditions are shown in Table 1, Table 2, Table 3, Table 4 and Table 5. Because TEA+ was assumed to be the only charge carrier in the membrane, the transfer of TEA+ satisfies the following:
N TEA + = σ m F ϕ m
where σm represents the ionic conductivity of the membrane, and ϕ m denotes the potential in the membrane.

2.1.3. Electrochemical Reactions in Porous Electrodes

With regard to both electrochemical reactions occurring at the negative (“−”) and positive (“+”) electrodes, the local current density j can be obtained with the current-overpotential equation described in [55]:
j = ε a F k ( c V ( II ) s ) ( 1 α ) ( c V ( III ) s ) α exp ( ( 1 α ) F η R T ) e x p ( α F η R T )
j + = ε a F k + ( c V ( III ) s ) ( 1 α + ) ( c V ( IV ) s ) α + e x p ( ( 1 α + ) F η + R T ) e x p ( α + F η + R T )
where a refers to the porous electrode volumetric surface area; k denotes the reaction rate constant; α represents the charge transfer coefficient; and η is the overpotential, which can be expressed as follows:
η j = ϕ s ϕ e U 0 , j
where U0,j is the equilibrium potential for the redox reactions in positive or negative electrodes, which can be given as follows:
U 0 , + = U 0 , + + R T F ln c V ( IV ) c V ( III )
U 0 , = U 0 , + R T F ln c V ( II ) c V ( III )
where U 0 , + and U 0 , are the standard equilibrium potentials for the redox reactions in the positive and negative electrodes, respectively. The electrokinetic parameters are summarized in Table 4.
Through the balance of the electrochemical reaction rate and mass transfer rate of reactants from bulk solutions to surfaces of electrodes, the term c i s in Equation (13a) and Equation (13b) can be correlated with the concentration of species i in the bulk solution. Specifically, the balance at the positive electrode can be given as follows:
k m c V ( III ) c V ( III ) s = F k + ( c V ( III ) ) ( 1 α + ) ( c V ( IV ) ) α + ( c V ( III ) s c V ( III ) ) e x p ( ( 1 α + ) F η + R T ) ( c V ( IV ) s c V ( IV ) ) e x p ( α + F η + R T )
k m c V ( IV ) c V ( IV ) s = F k + ( c V ( III ) ) ( 1 α + ) ( c V ( IV ) ) α + ( c V ( IV ) s c V ( IV ) ) e x p ( α + F η + R T ) ( c V ( III ) s c V ( III ) ) e x p ( ( 1 α + ) F η + R T )
where km is the pore-level mass transfer coefficient, which can be obtained as follows [36]:
k m = 1.6 × 10 4 v 0.4
To better understand the framework of this model work, the flow chart of the present model is shown in Figure 2.

2.2. Boundary Conditions

By referring to Figure 1, the boundary conditions in the present model can be given as follows:
At x = 0 , the nonslip boundary condition is adopted for the velocity.
ϕ e x = 0 ,   ϕ s = 0
p x = 0 ,   p y = 0
N i n = 0 ,   i = V ( II ) ,   V ( III ) ,   TEA +
At x = x 1 ,
N i n = 0 ,   i = V ( II ) ,   V ( III )
i e n = i i m n   ( for   TEA + )  
At x = x 2 , the interfacial conditions are similar to those at x = x 1 ,
N i n = 0 ,   i = V ( III ) ,   V ( IV )
i e n = i i m n   ( for   TEA + )  
At x = x 3 ,
ϕ e x = 0 , σ s ϕ s x = I
p x = 0 ,   p y = 0
N i n = 0 ,   i = V ( III ) ,   V ( IV ) ,   TEA +
At y = 0 ,
ϕ e y = 0 ,   ϕ s y = 0
c i = c i i n ,   i = V ( II ) ,   V ( III ) ,   TEA +   when   0 < x < x 1
i = V ( III ) ,   V ( IV ) ,   TEA +   when   x 2 < x < x 3
v n = v i n
At y = H cell ,
ϕ e y = 0 ,   ϕ s y = 0
c i x = 0 ,   i = V ( II ) ,   V ( III ) ,   TEA +   when   0 < x < x 1
i = V ( III ) ,   V ( IV ) ,   TEA +   when   x 2 < x < x 3
p = p o u t

2.3. Electrolyte Tanks, Inlet Concentrations, and Initial Values

During the operation of NRFB, species concentration in the tanks varies with the electrochemical reactions tacking place at the surface of porous electrodes. In order to model the species concentration changes at the inlet, the mass conservation is given as follows:
c i i n t = ε w c e l l V tank v o u t c i o u t d l v i n c i i n d l     c i i n ( 0 ) = c i 0
where Vtank is the volume of the tank. The superscripts in and out represent the values at the inlet and outlet of the porous electrode, respectively. The initial value c i 0 is summarized in Table 5. The state of charge (SOC) can be defined as follows:
Negative half-cell :   SOC = c V ( II ) c V ( II ) + c V ( III )
Positive half-cell :   SOC = c V ( V ) c V ( IV ) + c V ( V )

3. Results and Discussion

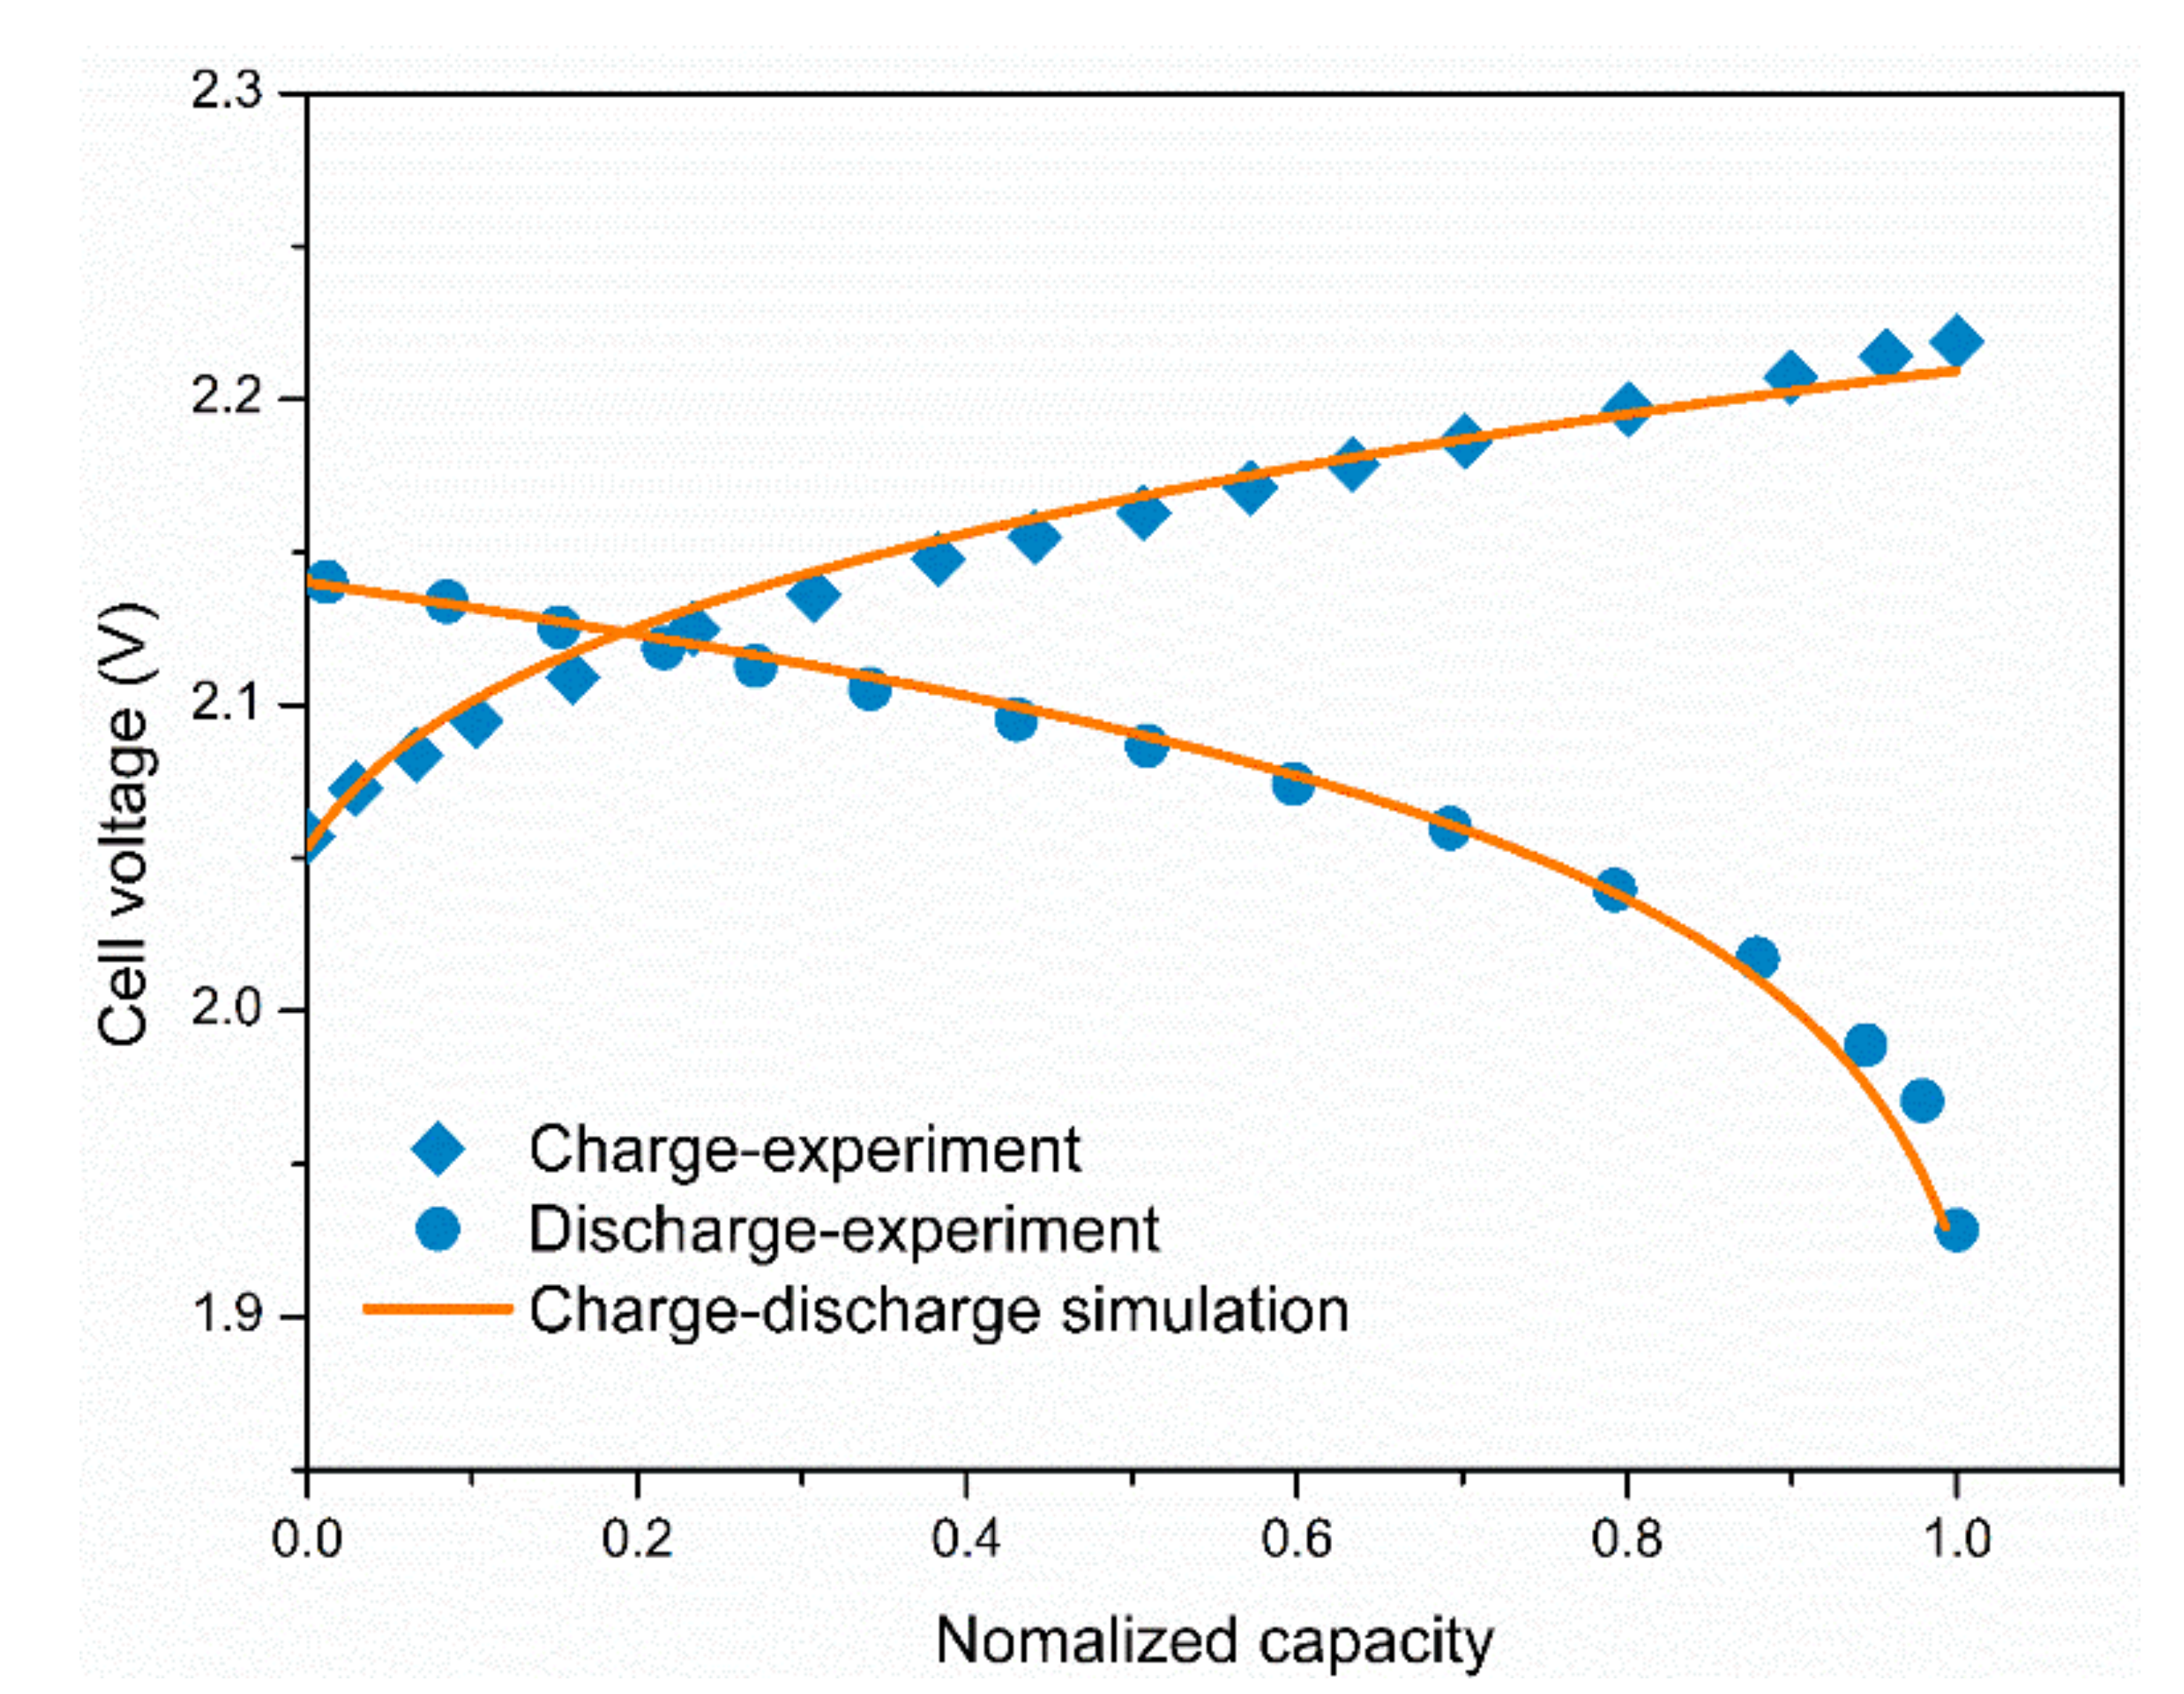
3.1. Model Validation

As depicted in Figure 3, we compared the simulated charge–discharge curve with the experimental data of an NRFB that operated with electrolytes of 100 mM V(acac)3 in 500 mM TEABF4 at the current density of 10 mA cm−2. All electrode and membrane properties and operational conditions were set to be the same as those in [32]. The electrode thickness was 400 μm, and the membrane thickness was 250 μm. It was found that the simulation results produced by the present model agreed well with the experimental data, and the average margin of error for the cell voltage was less than 3.9%. The slight discrepancy in cell voltage can be explained by the fact parasitic reactions and redox-active species crossover were not considered in the present model. Such a small discrepancy was somehow unexpected with the assumption of no crossover, and it possibly arose from the fairly low concentration of active materials (i.e., 0.1 M/L) used in this work, which led to a relatively small crossover rate due to weak concentration gradient. Hence, the effect of species crossover on the reaction kinetics (e.g., exchange current density) and electrolyte conductivity may not be pronounced. It is worth mentioning that the beginning and ending SOCs of electrolytes adopted in the present simulation were fitted to match the beginning and ending charge–discharge voltages.

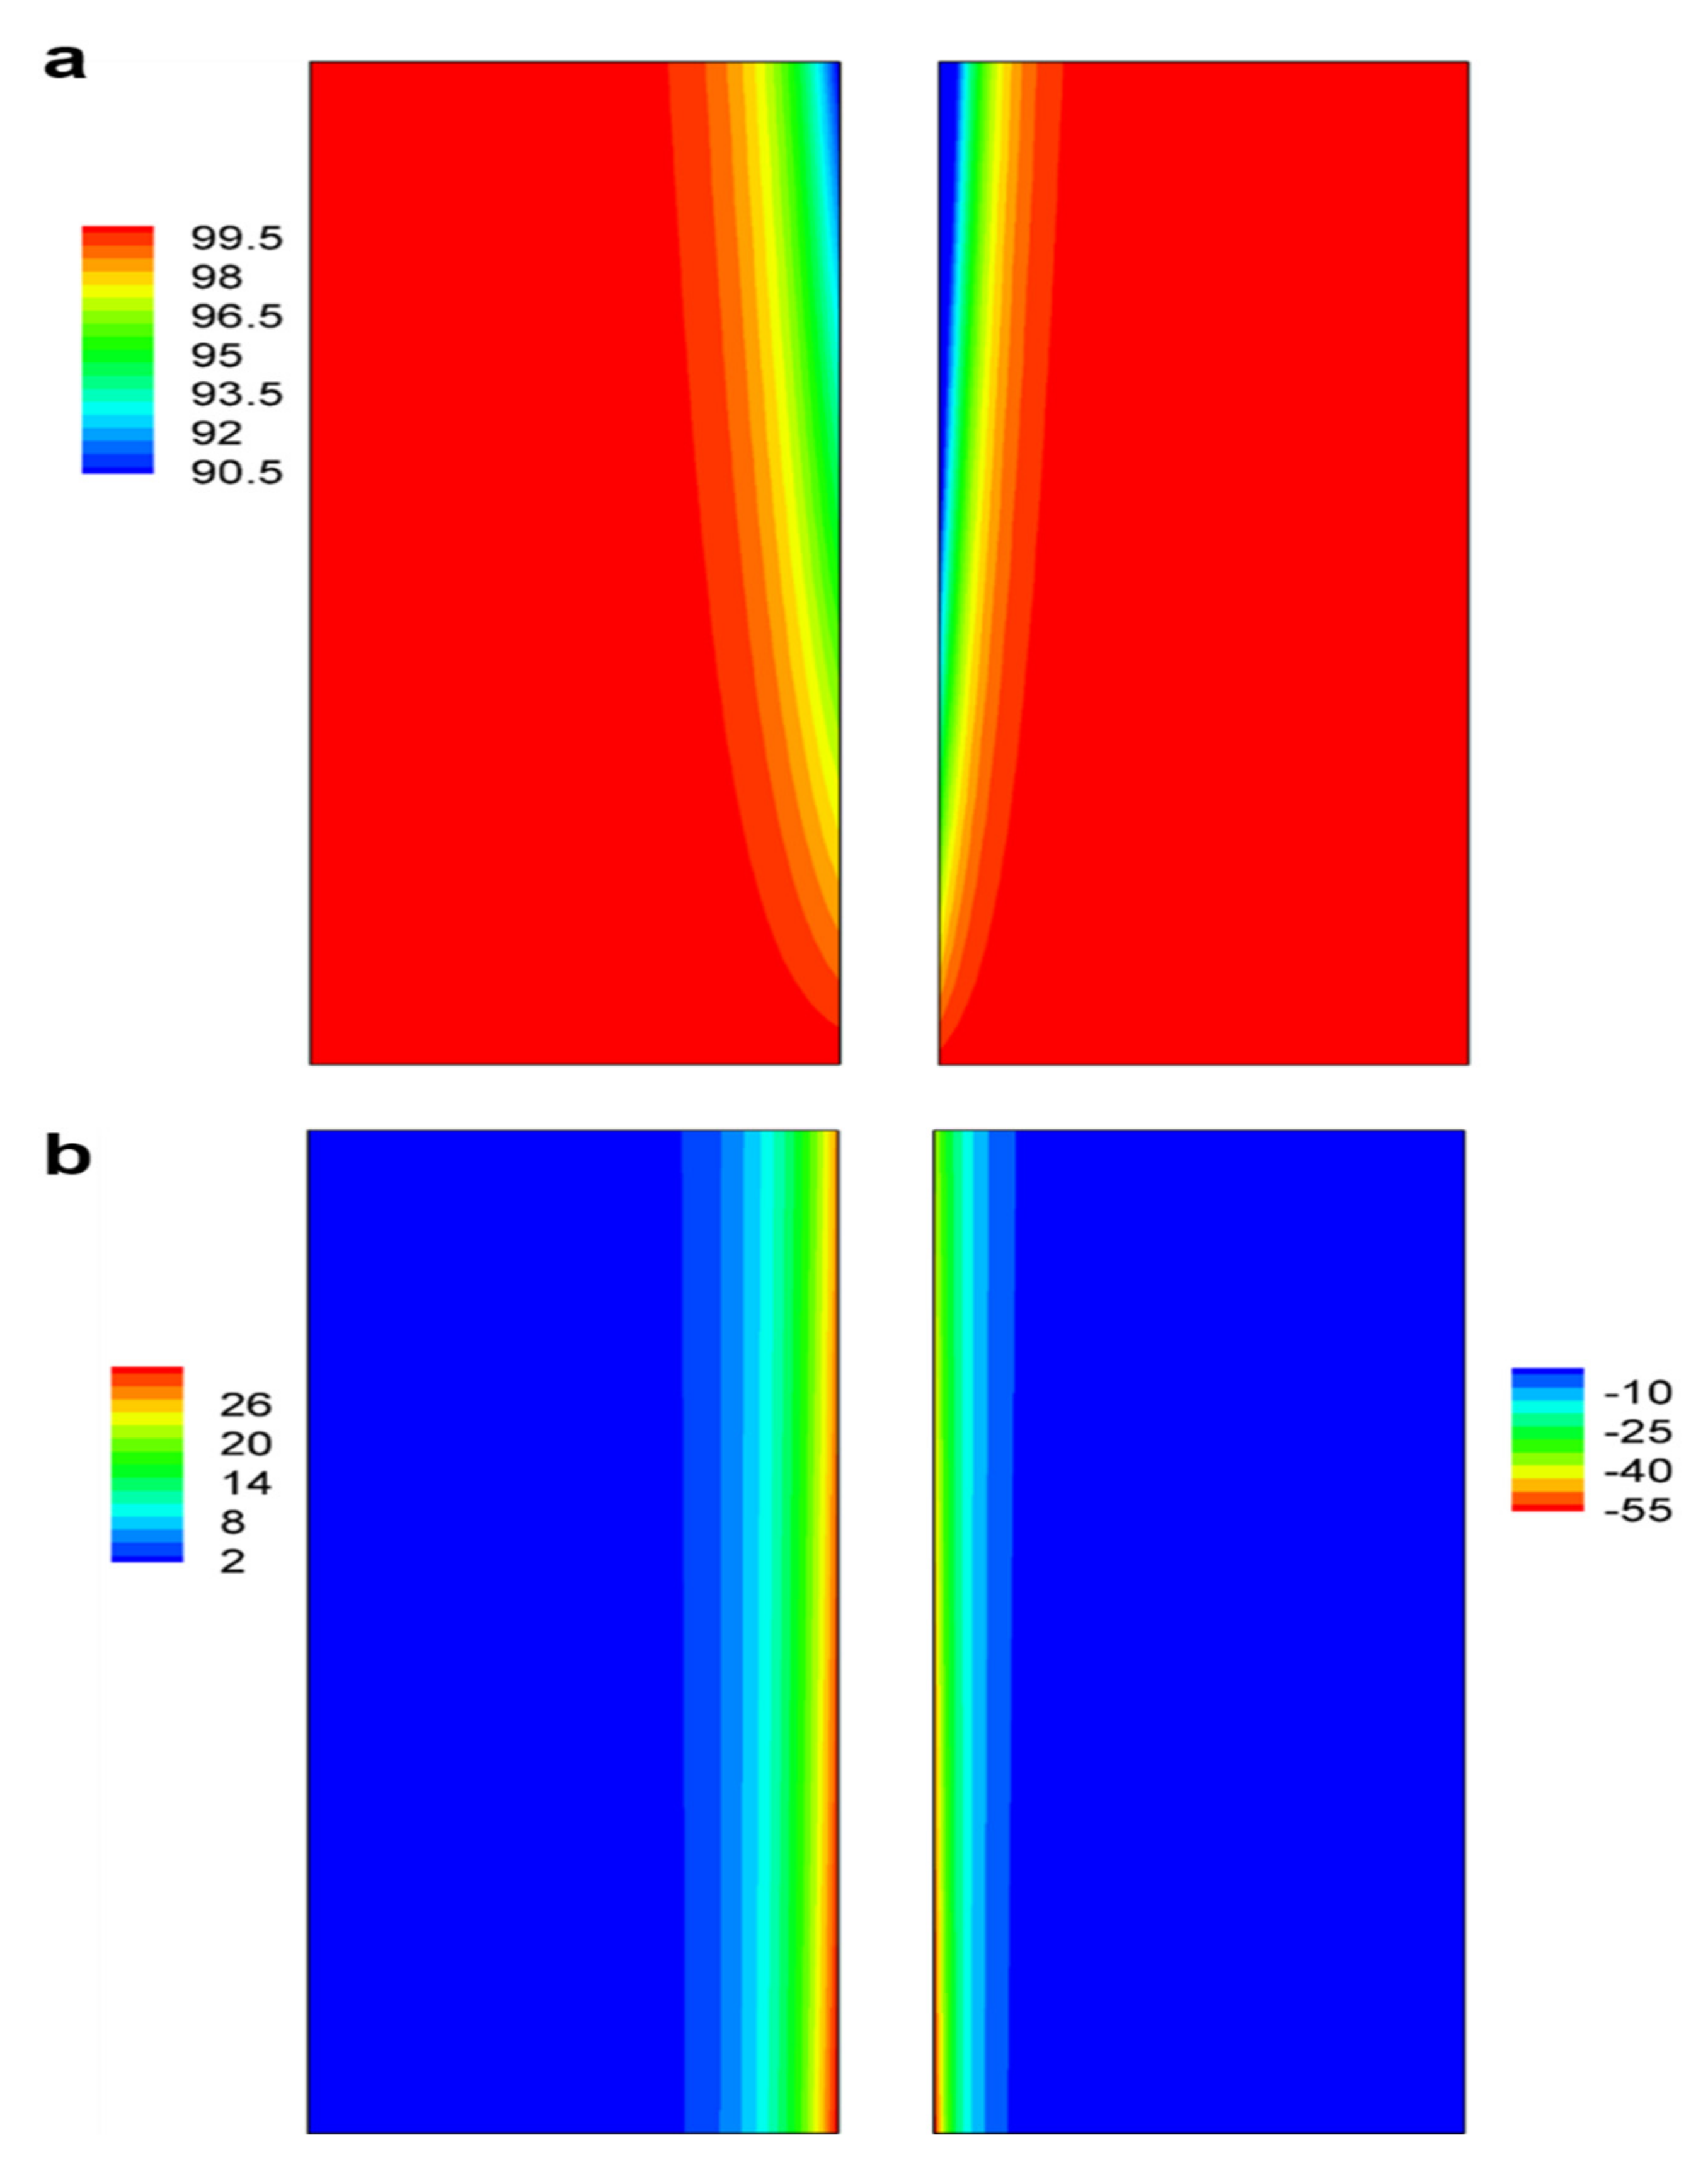
3.2. Concentration and Reaction Current Density Distributions in Electrodes

To gain a better understanding of underlying physical–chemical processes occurring in the battery, we performed a case study with electrode thickness of 1.6 mm at each side, current density of 10 mA cm−2, and 200 mM total vanadium concentration. Figure 4 displays the distribution of vanadium salt concentration and reaction current density at SOC of 50%. It was found that the concentration of V(II) and V(IV) ions in the battery both decreased significantly when approaching the membrane/electrode interface, which was caused by nonuniform distribution of reaction current densities at both the negative and positive electrodes, as shown in Figure 4b. With regard to the reaction current density distribution in porous electrodes, it is mainly determined by the electrolyte conductivity or electronic conductivity in cases where mass transport is not an issue. In the present case, the mass transport should not be an issue as the flow rate was high and reaction current density was low. The electrolyte conductivity (e.g., 34 mS cm−1) was several order of magnitude lower than the electronic conductivity (e.g., 4000 mS cm−1), and thus the main reactions occurred at the region near the membrane/electrode interfaces, where the length of ion transport pathway from one half-cell to another half-cell was relatively shorter.

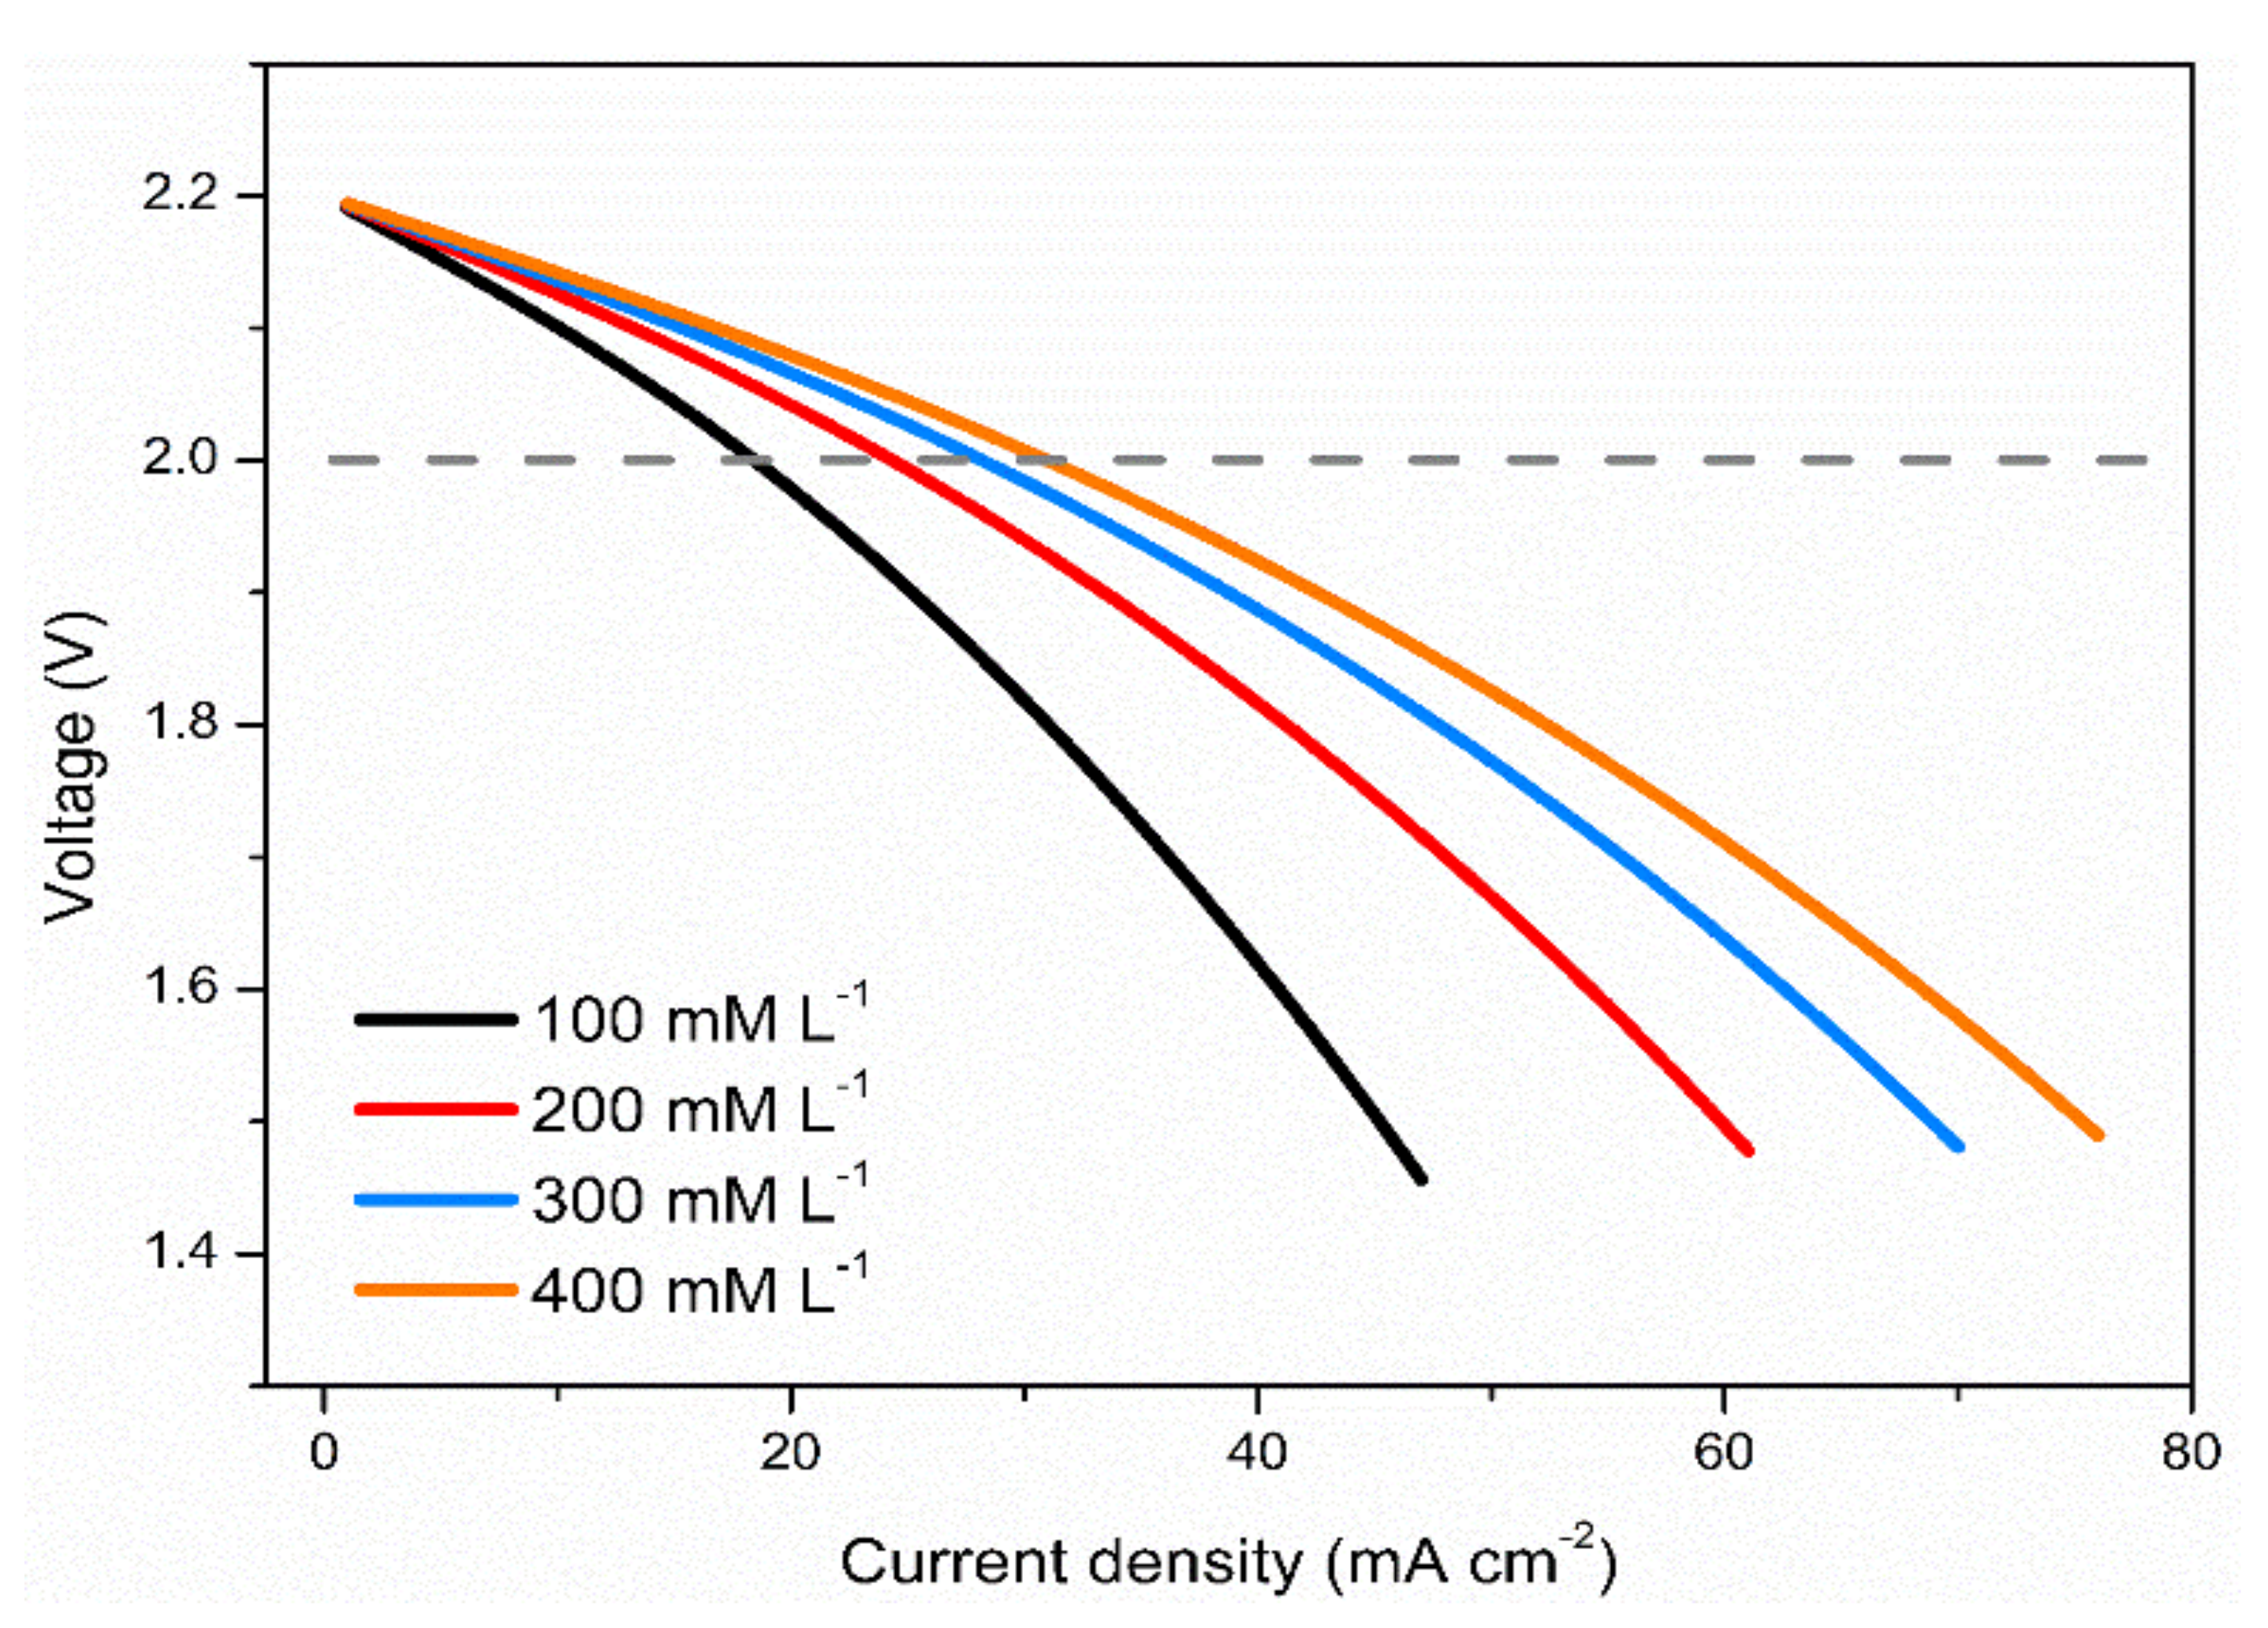
3.3. Effects of Vanadium Salt Concentrations

Electrolytes of NRFBs mainly consist of redox-active species, salts, and solvents. Nonaqueous vanadium redox flow batteries utilize V(acac)3 as the redox-active species, TEABF4 as the salt, and CH3CN as the solvent. It should be noted that the properties of nonaqueous electrolytes are much different from those of aqueous electrolytes. One of the differences is the redox-active species solubility. The solubility of vanadium salts in the aqueous system can be as high as 2.5 M, while the achievable vanadium salt solubility at room temperature for the nonaqueous system is only 0.6 M. Apparently, the low solubility will result in a relatively low energy density. Apart from that, it also exerts a significant influence on the power density of the battery. Hence, we performed simulations of discharge polarization curves of batteries with different total vanadium concentrations at SOC of 50%, as shown in Figure 5.
As can be seen, the voltage loss decreased significantly as the total vanadium concentration increased from 100 to 400 mM. The current density, at which the voltage efficiency achieves 91%, for the battery operating with 100 mM total vanadium salts was only 18 mA cm−2. In contrast, current density of 33 mA cm−2 could be achieved by the battery with 400 mM total vanadium salts. The difference in the cell performance should be related to the reaction kinetics. Although previous investigations have revealed that the reaction constant for nonaqueous systems is much higher than that for aqueous systems, the concentration of redox-active species in the prototype of nonaqueous systems is extremely low (e.g., 100 mM) [32], which results in low exchange current densities for both positive and negative reactions. This result also suggests that the reaction kinetics should be one of the key factors that limit the cell performance of nonaqueous flow batteries. Hence, the solubility of redox-active species needs to be further increased not only for pursuing a high energy density but also for achieving an excellent rate capability.

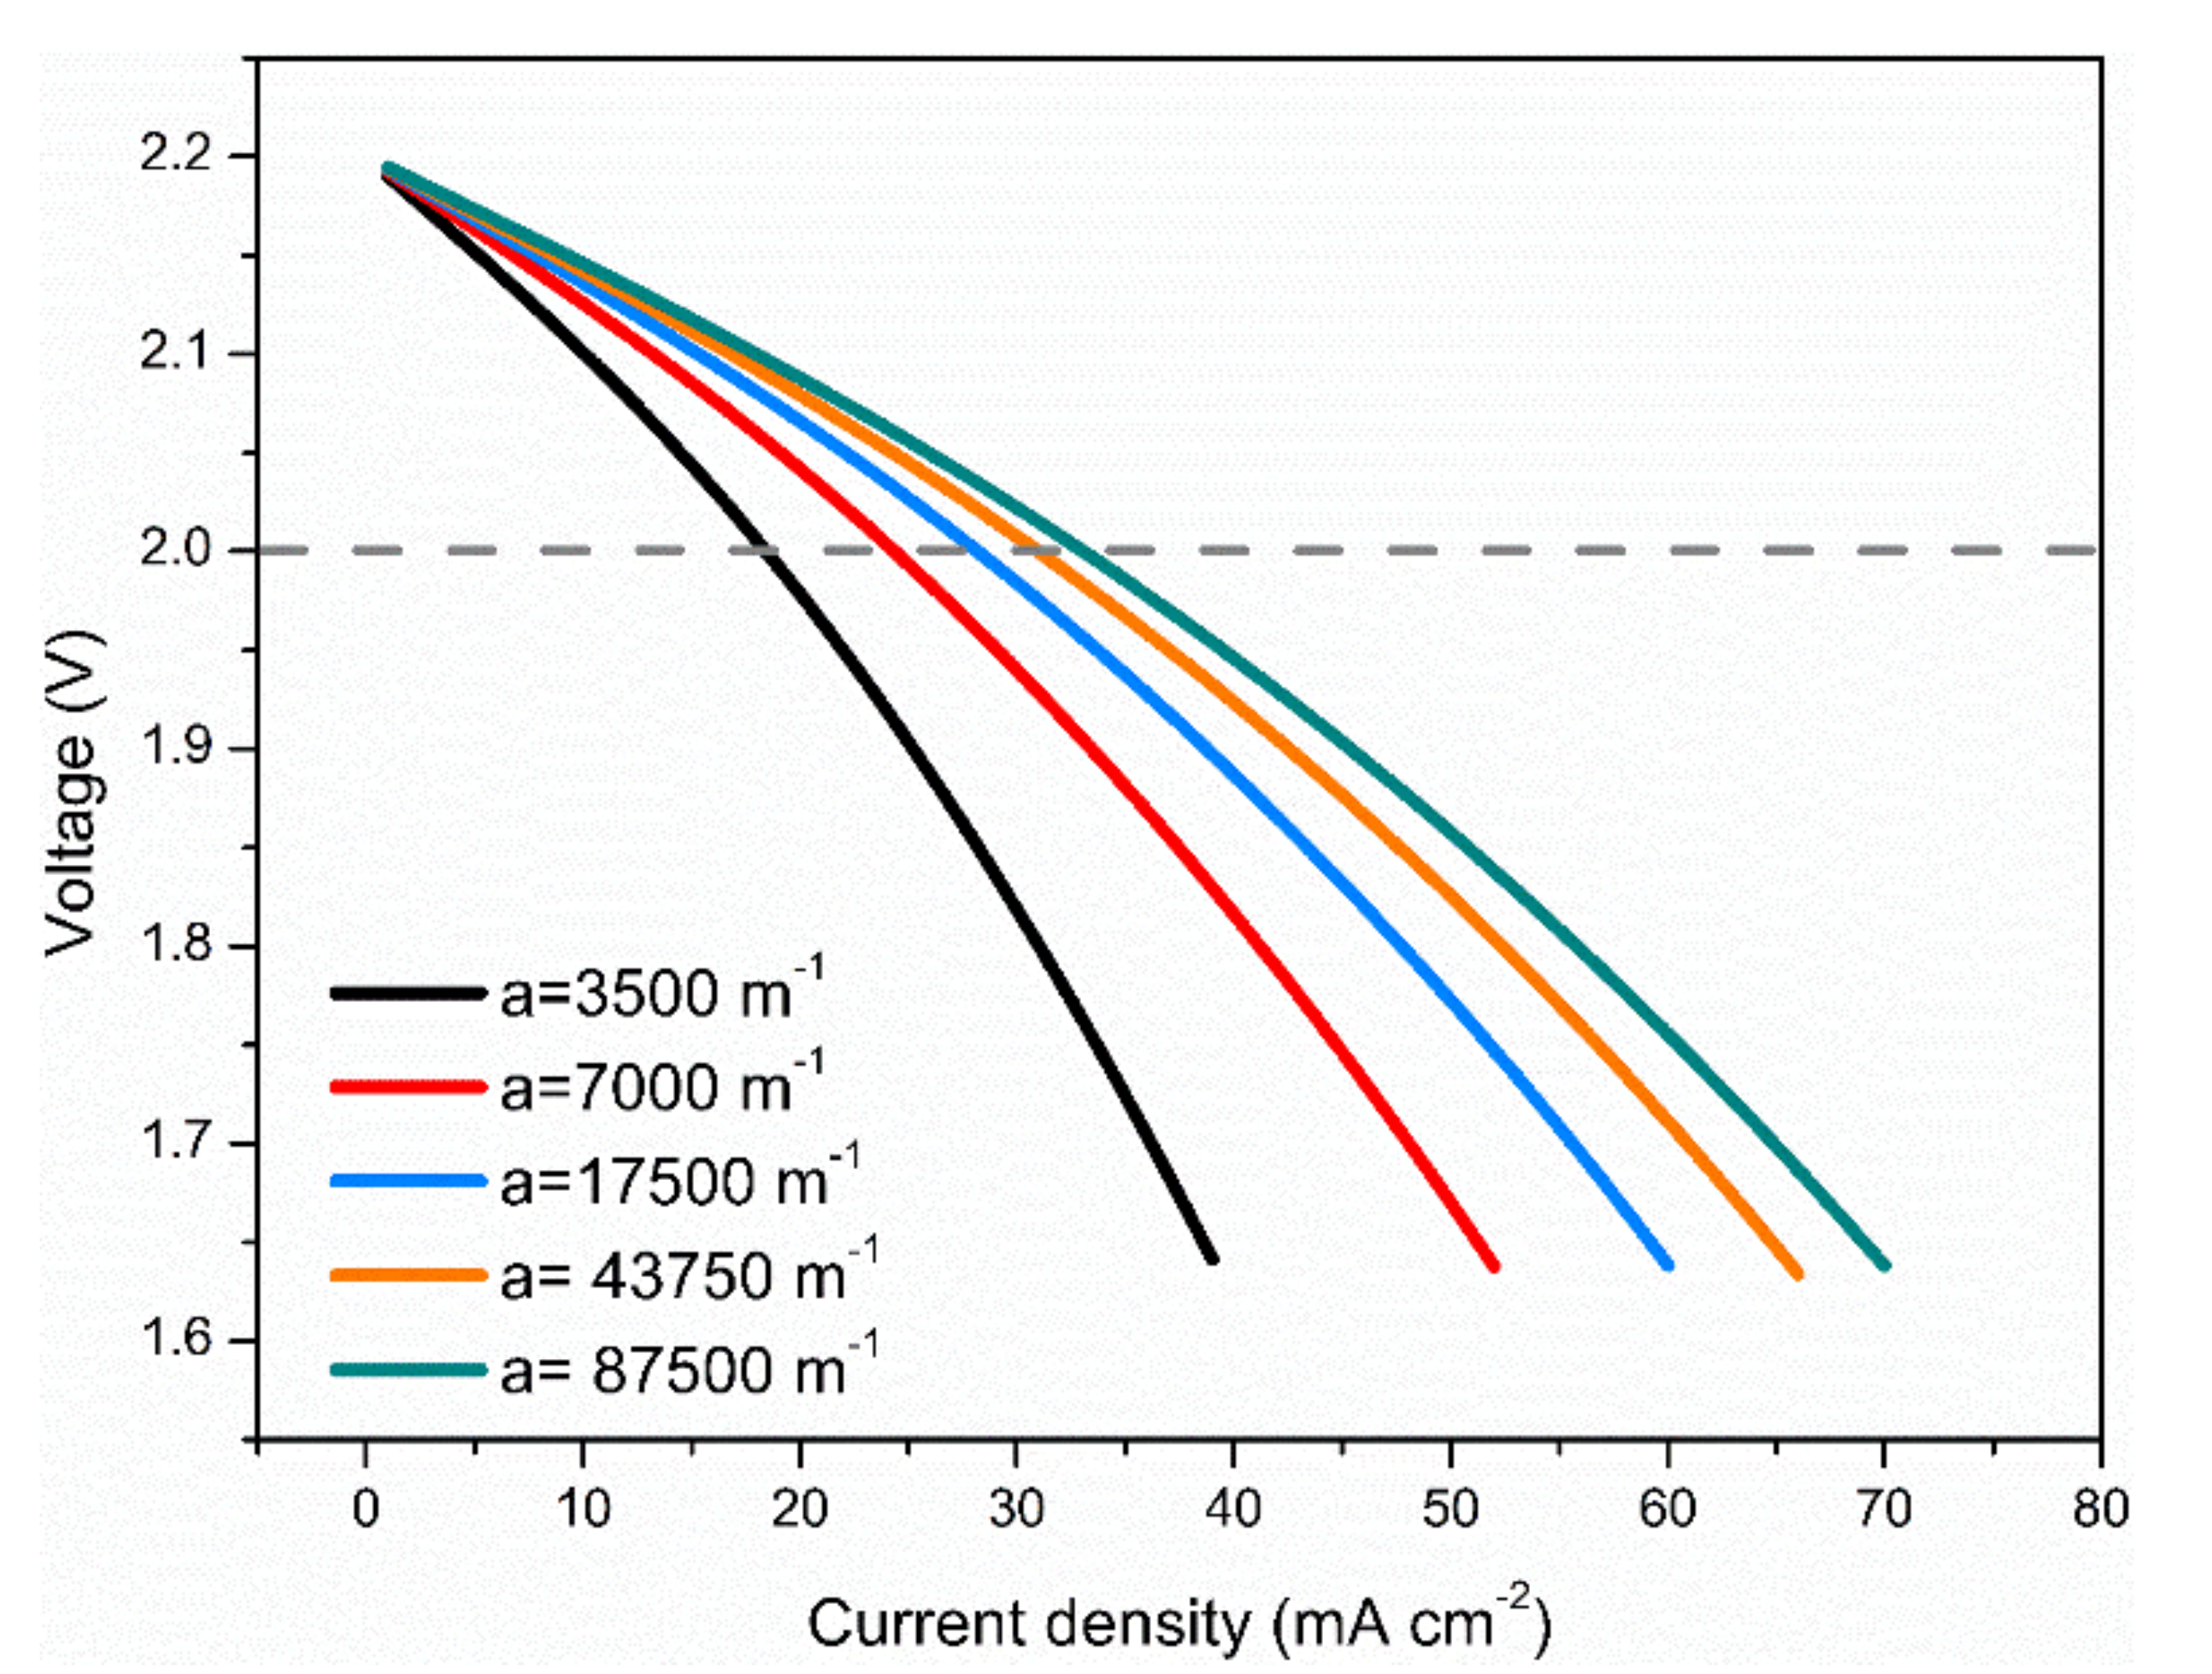
3.4. Effects of Electrode Surface Area

Because the reaction kinetics is one of the key factors that influence the performance, the design of electrode structure is critically important for performance improvement. Therefore, the effects of electrode surface area were examined. Figure 6 shows the polarization curves of batteries with different electrode surface areas. As can be seen, the voltage loss decreased substantially with increased surface area. With voltage efficiency of 90%, the battery with surface area of 3500 m−1 offered low current density of 17 mA cm−2, while a current density of 32 mA cm−2 could be achieved by the battery with electrode surface area of 87,500 m−1. For the typical pristine graphite felt and carbon felt, the surface area should be around 17,500 m−1 [36]. As we have reported previously, a ten-fold improvement can be expected after KOH activation, which means electrode surface modification should be an effective strategy in improving the performance of NRFBs. In this sense, developing catalysts with excellent catalytic activities for redox reactions is also important.

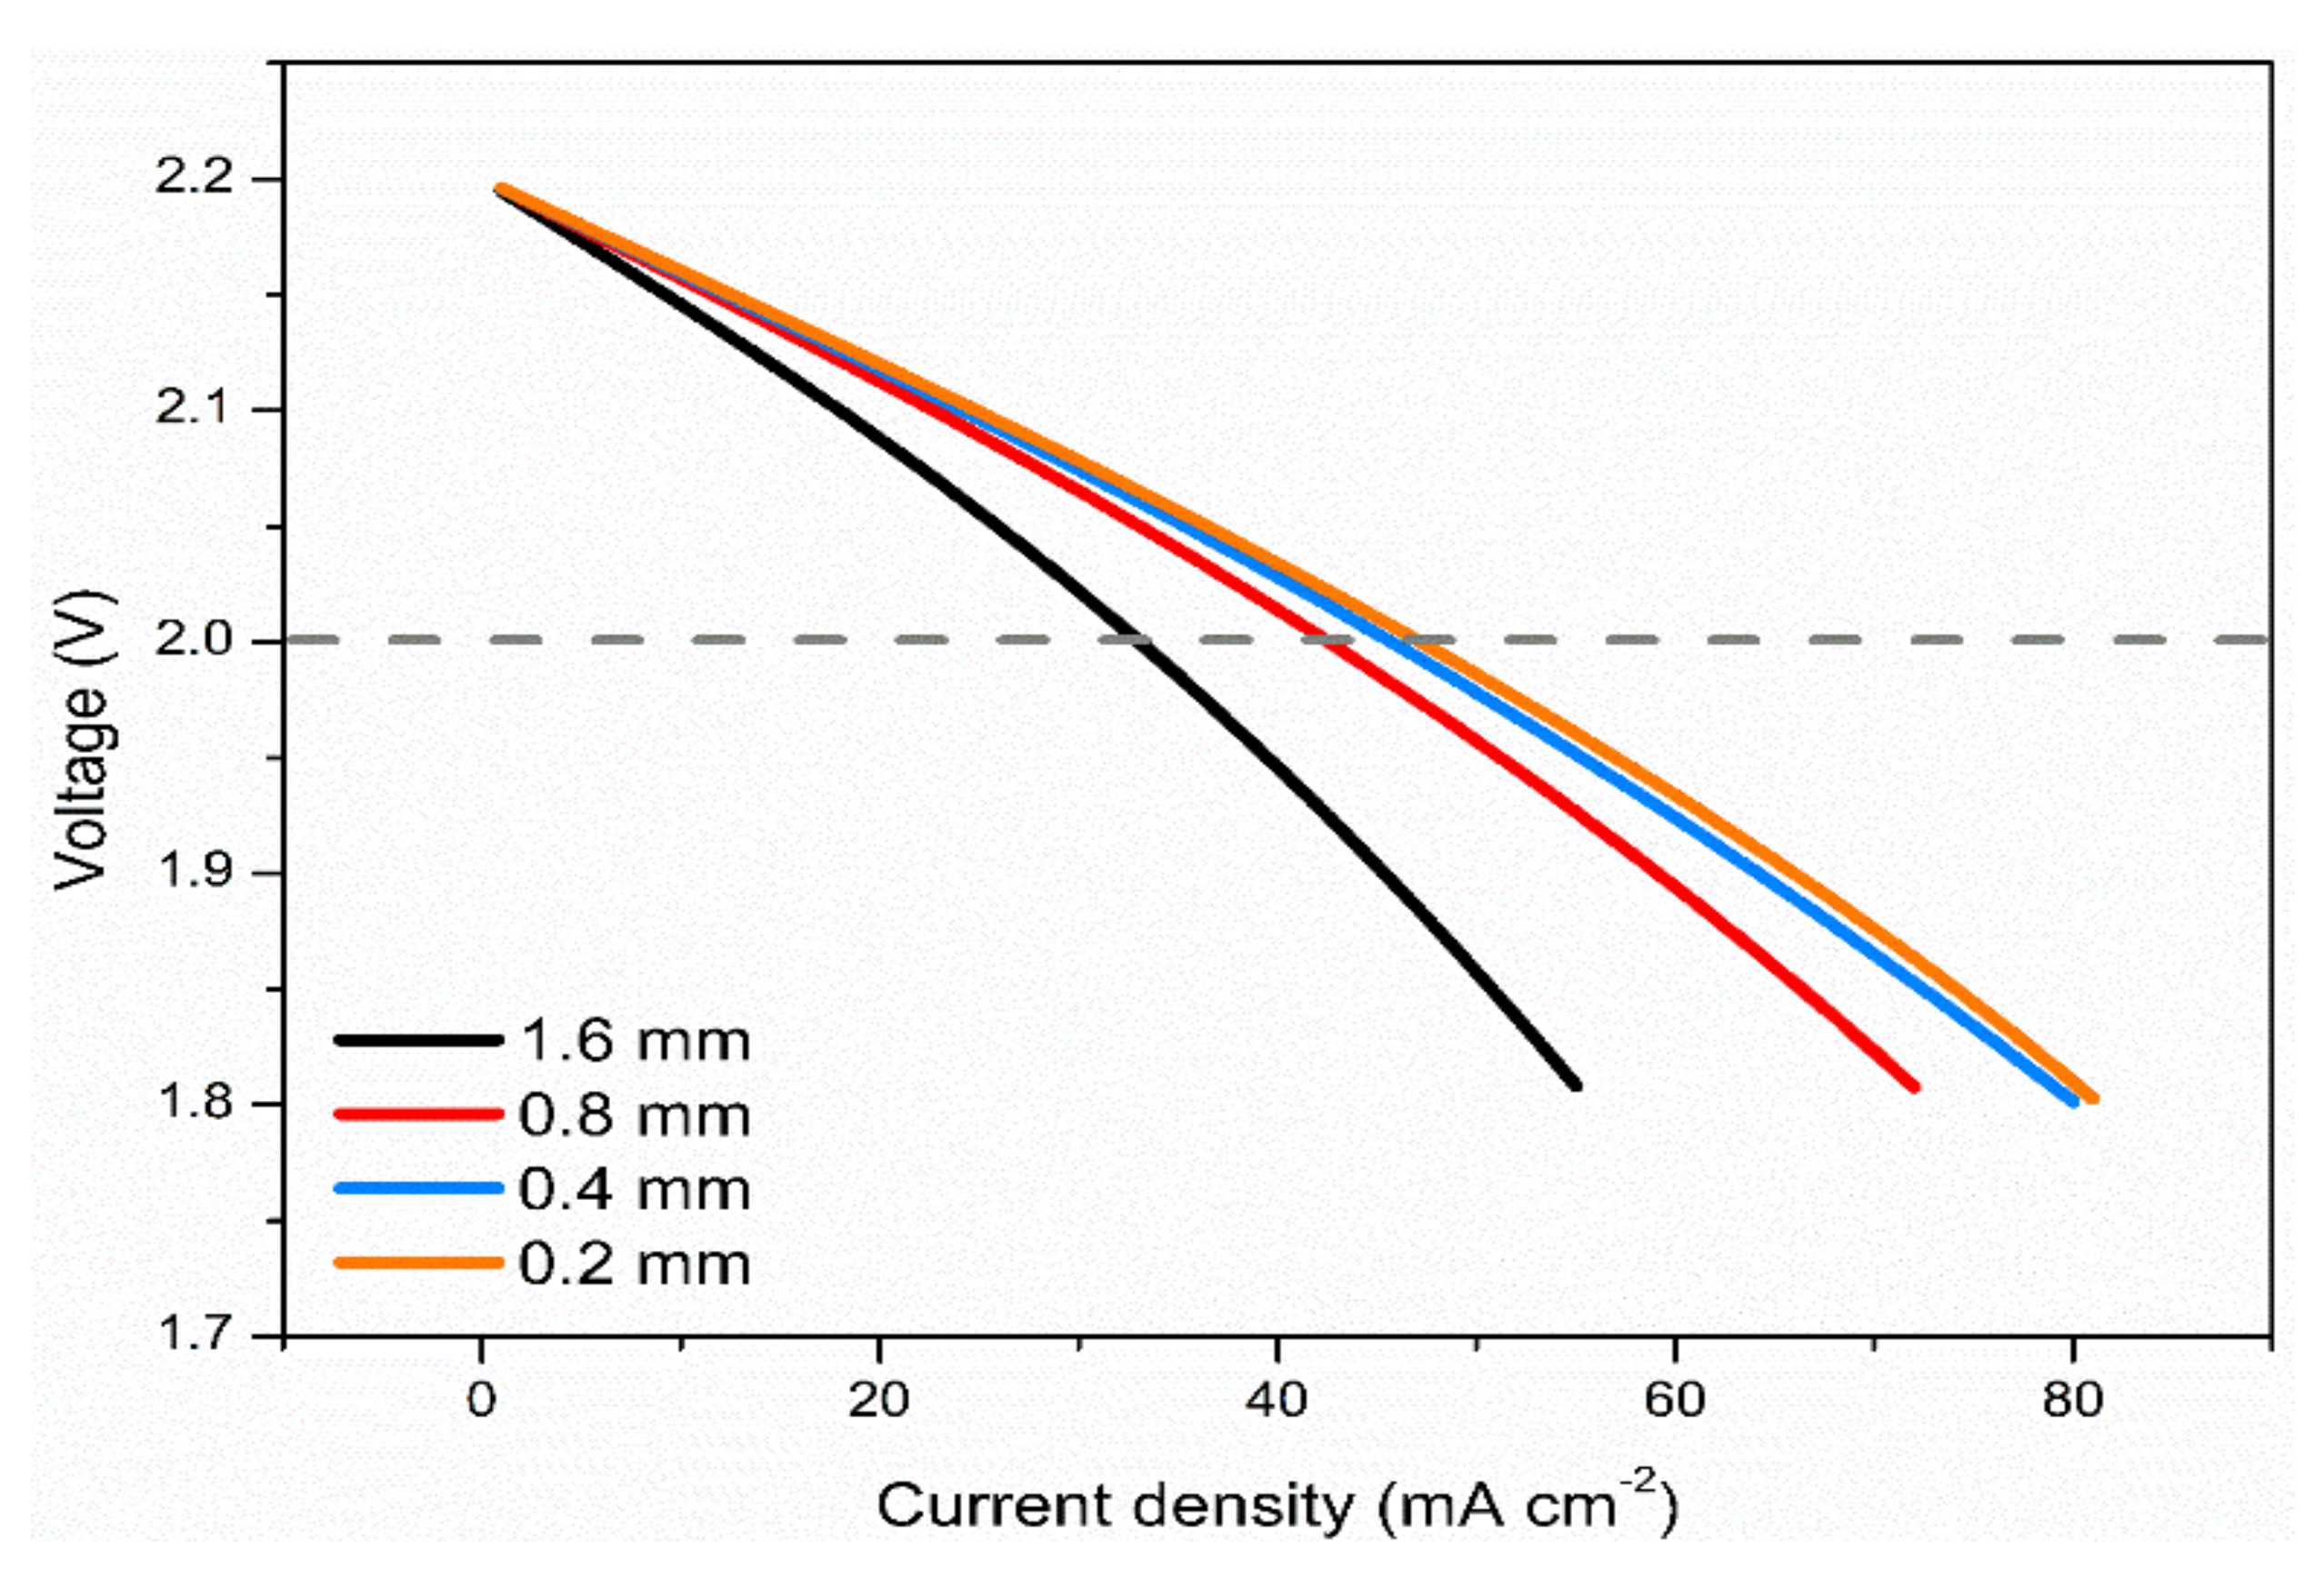
3.5. Effects of Electrode Thickness

As mentioned in Section 3.2, the main reactions occur in regions near membrane/electrode interfaces, suggesting that the regions away from the membrane/electrode interfaces are not well utilized. In this regard, thinning the electrode thickness may improve performance. Therefore, the effects of electrode thickness were examined. As shown in Figure 7, the polarization loss decreased significantly with reduced electrode thickness because ohmic loss decreased and electrode utilization could also be improved. With voltage efficiency of 90%, the battery with electrode thickness of 1.6 mm offered low current density of 33 mA cm−2, while current density of 47 mA cm−2 could be achieved by the battery with electrode thickness of 0.2 mm. It should also be noted that reducing the electrode thickness from 0.4 to 0.2 mm produced limited performance improvement because the electrode reaction surface area was significantly reduced with reduced electrode thickness. If the electrode thickness is reduced to the level of around 0.4 mm, the flow-by configuration with serpentine flow-fields or interdigitated flow-fields should be adopted for NRFBs to minimize pump work [6].

3.6. Effects of Electrolyte Conductivity

One major difference between aqueous and nonaqueous flow systems is the electrolyte conductivity. For aqueous vanadium redox flow batteries, the electrolyte conductivity in bulk solution, which incorporates 2–4 M sulfur acids, can be as high as ~400 mS cm−1. With regard to nonaqueous flow systems, the electrolyte conductivity is as low as ~30 mS cm−1. The difference in conductivity can be ascribed to the difference in properties of solvents and motilities of charge carrier ions. To elucidate the effects of electrolyte conductivity on battery performance, we performed a simulation of polarization curves of the battery with different electrolyte conductivities. As depicted in Figure 8, the voltage loss was significantly reduced with increased electrolyte conductivity. Specifically, the battery with electrolyte conductivity of 37 mS cm−1 only had the capability to work at 42 mA cm−2 with voltage efficiency of 90%. With increased conductivity of 74 mS cm−1, the battery delivered much better rate capability, enabling operations at 55 mA cm−2 with voltage efficiency of 90%. It should be noted that electrolyte conductivity of 37 mS cm−1 can be achieved by solutions of 0.5 M TEABF4 dissolved in CH3CN, which is commonly used in current practical prototypes of nonaqueous flow batteries. With improved salt concentrations and proper solvent selection, it is possible to achieve 74 mS cm−1, enabling significant performance improvement of nonaqueous flow batteries.

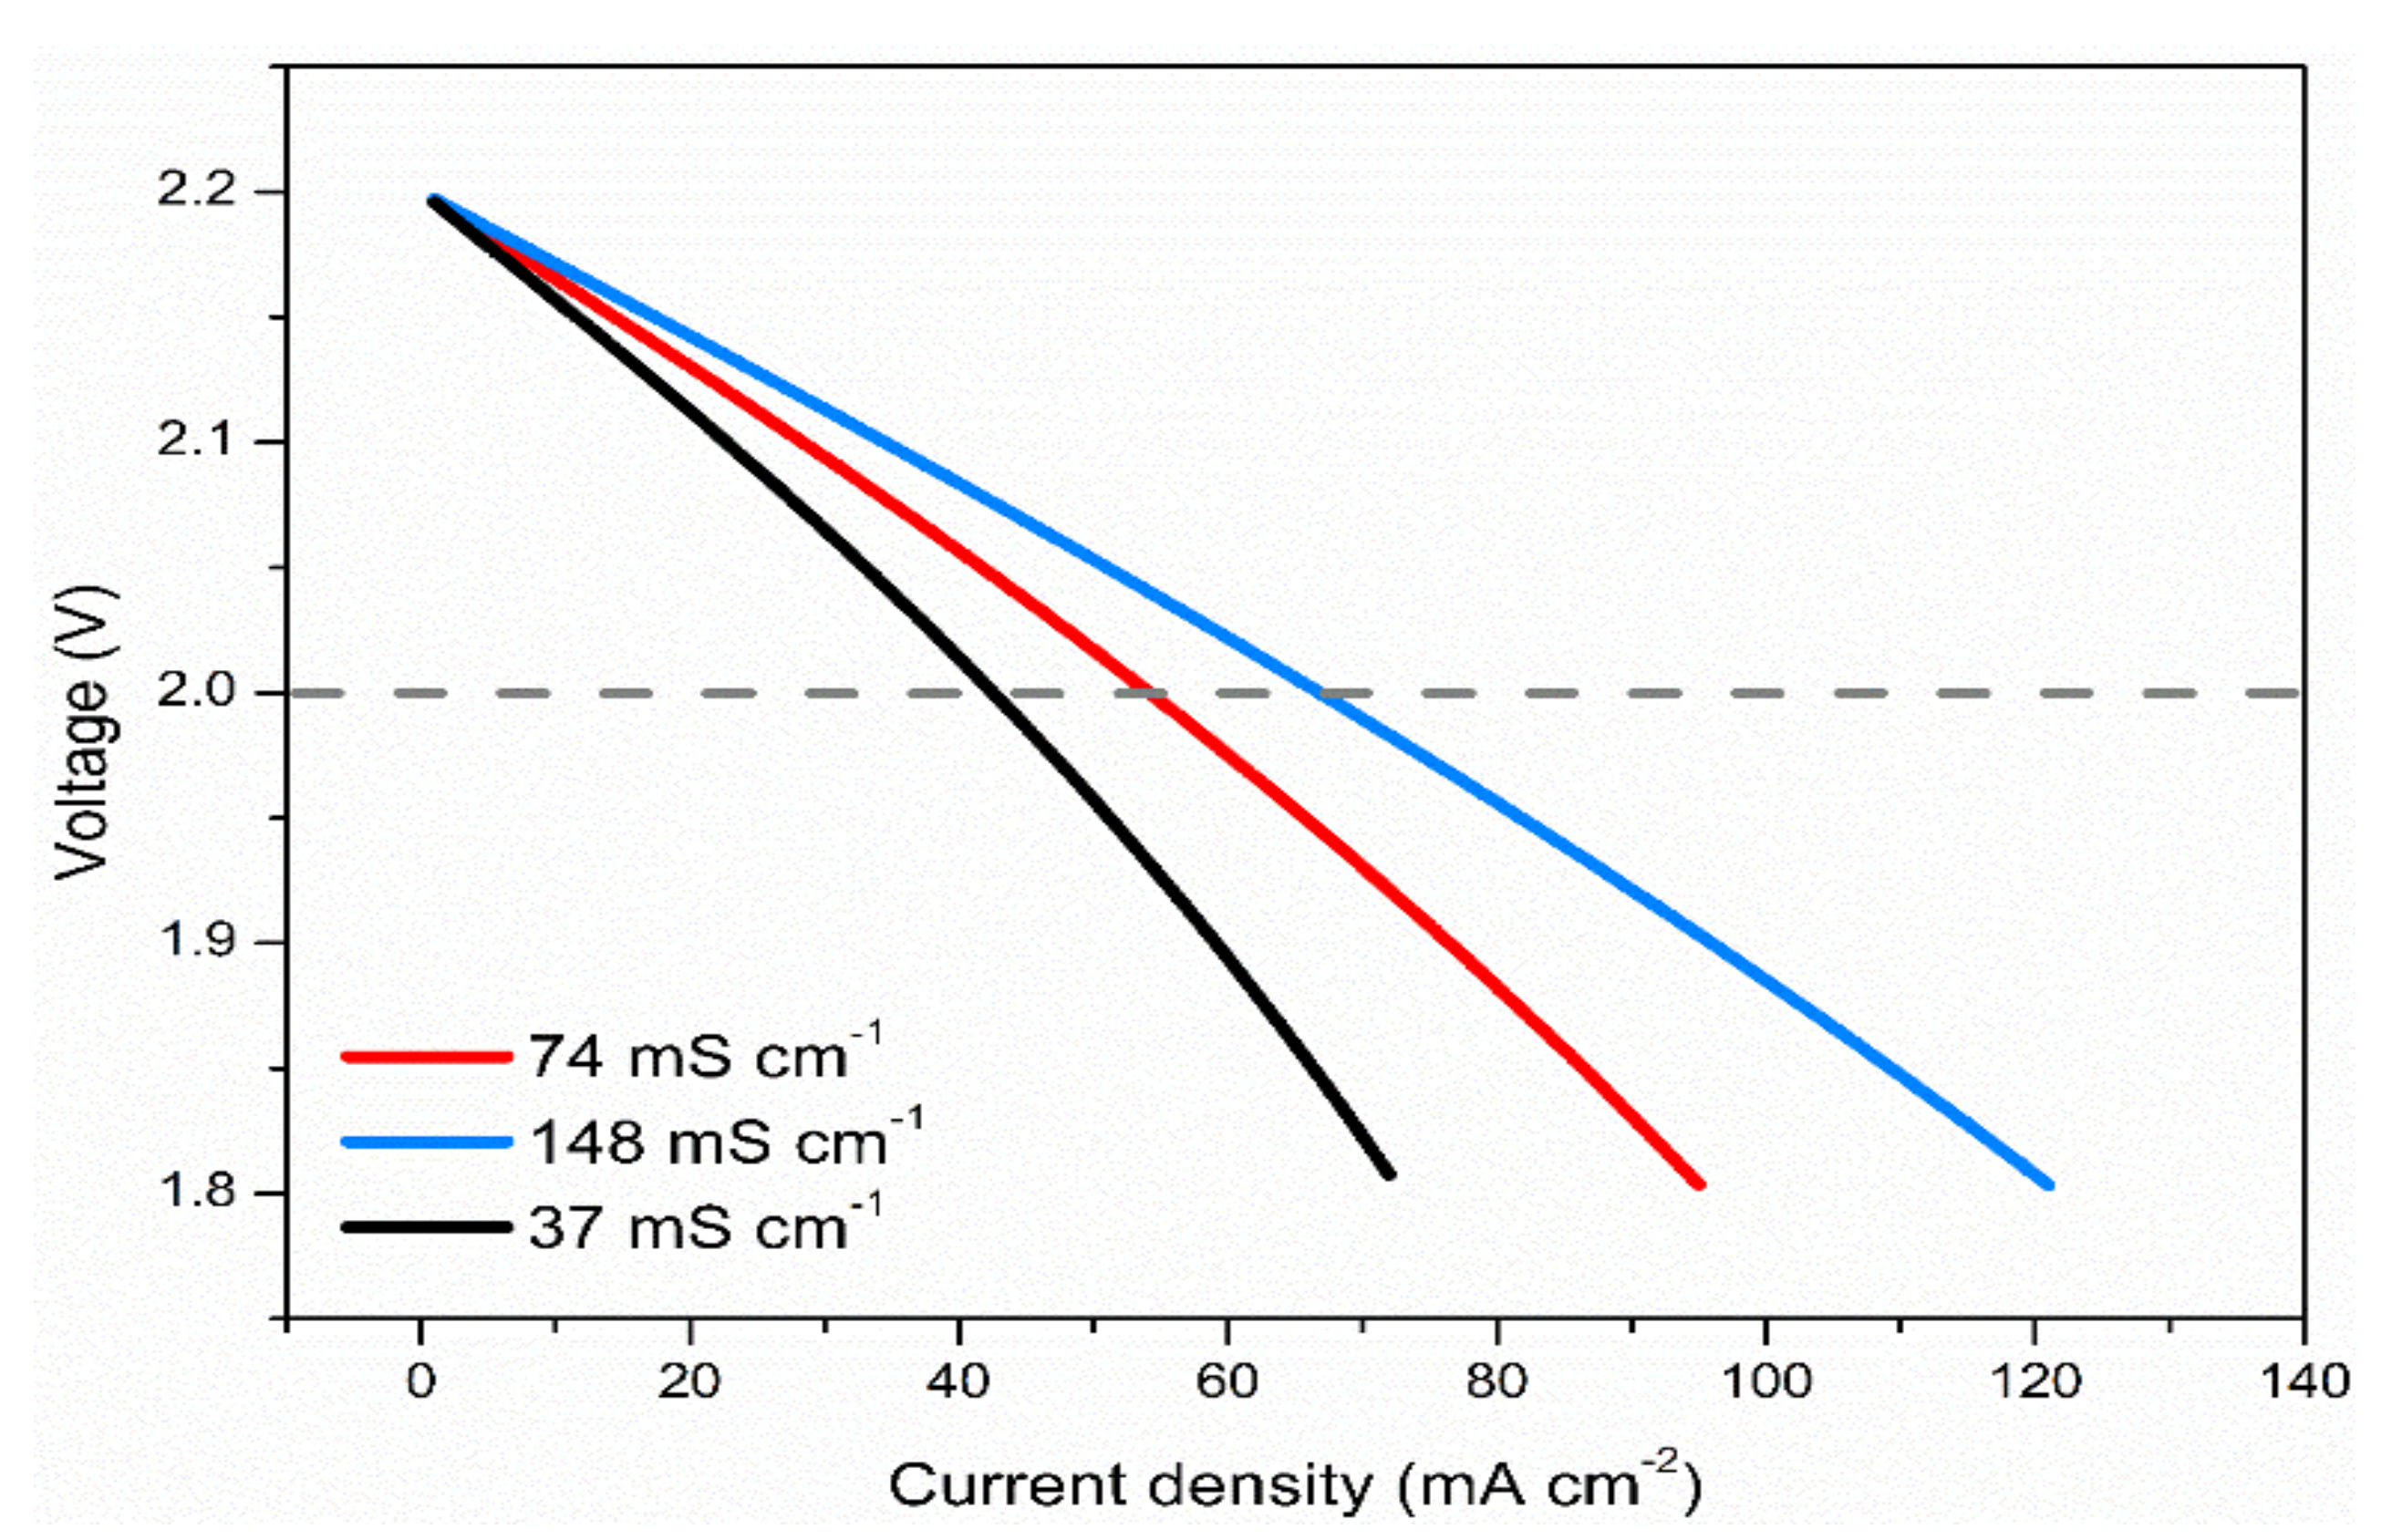
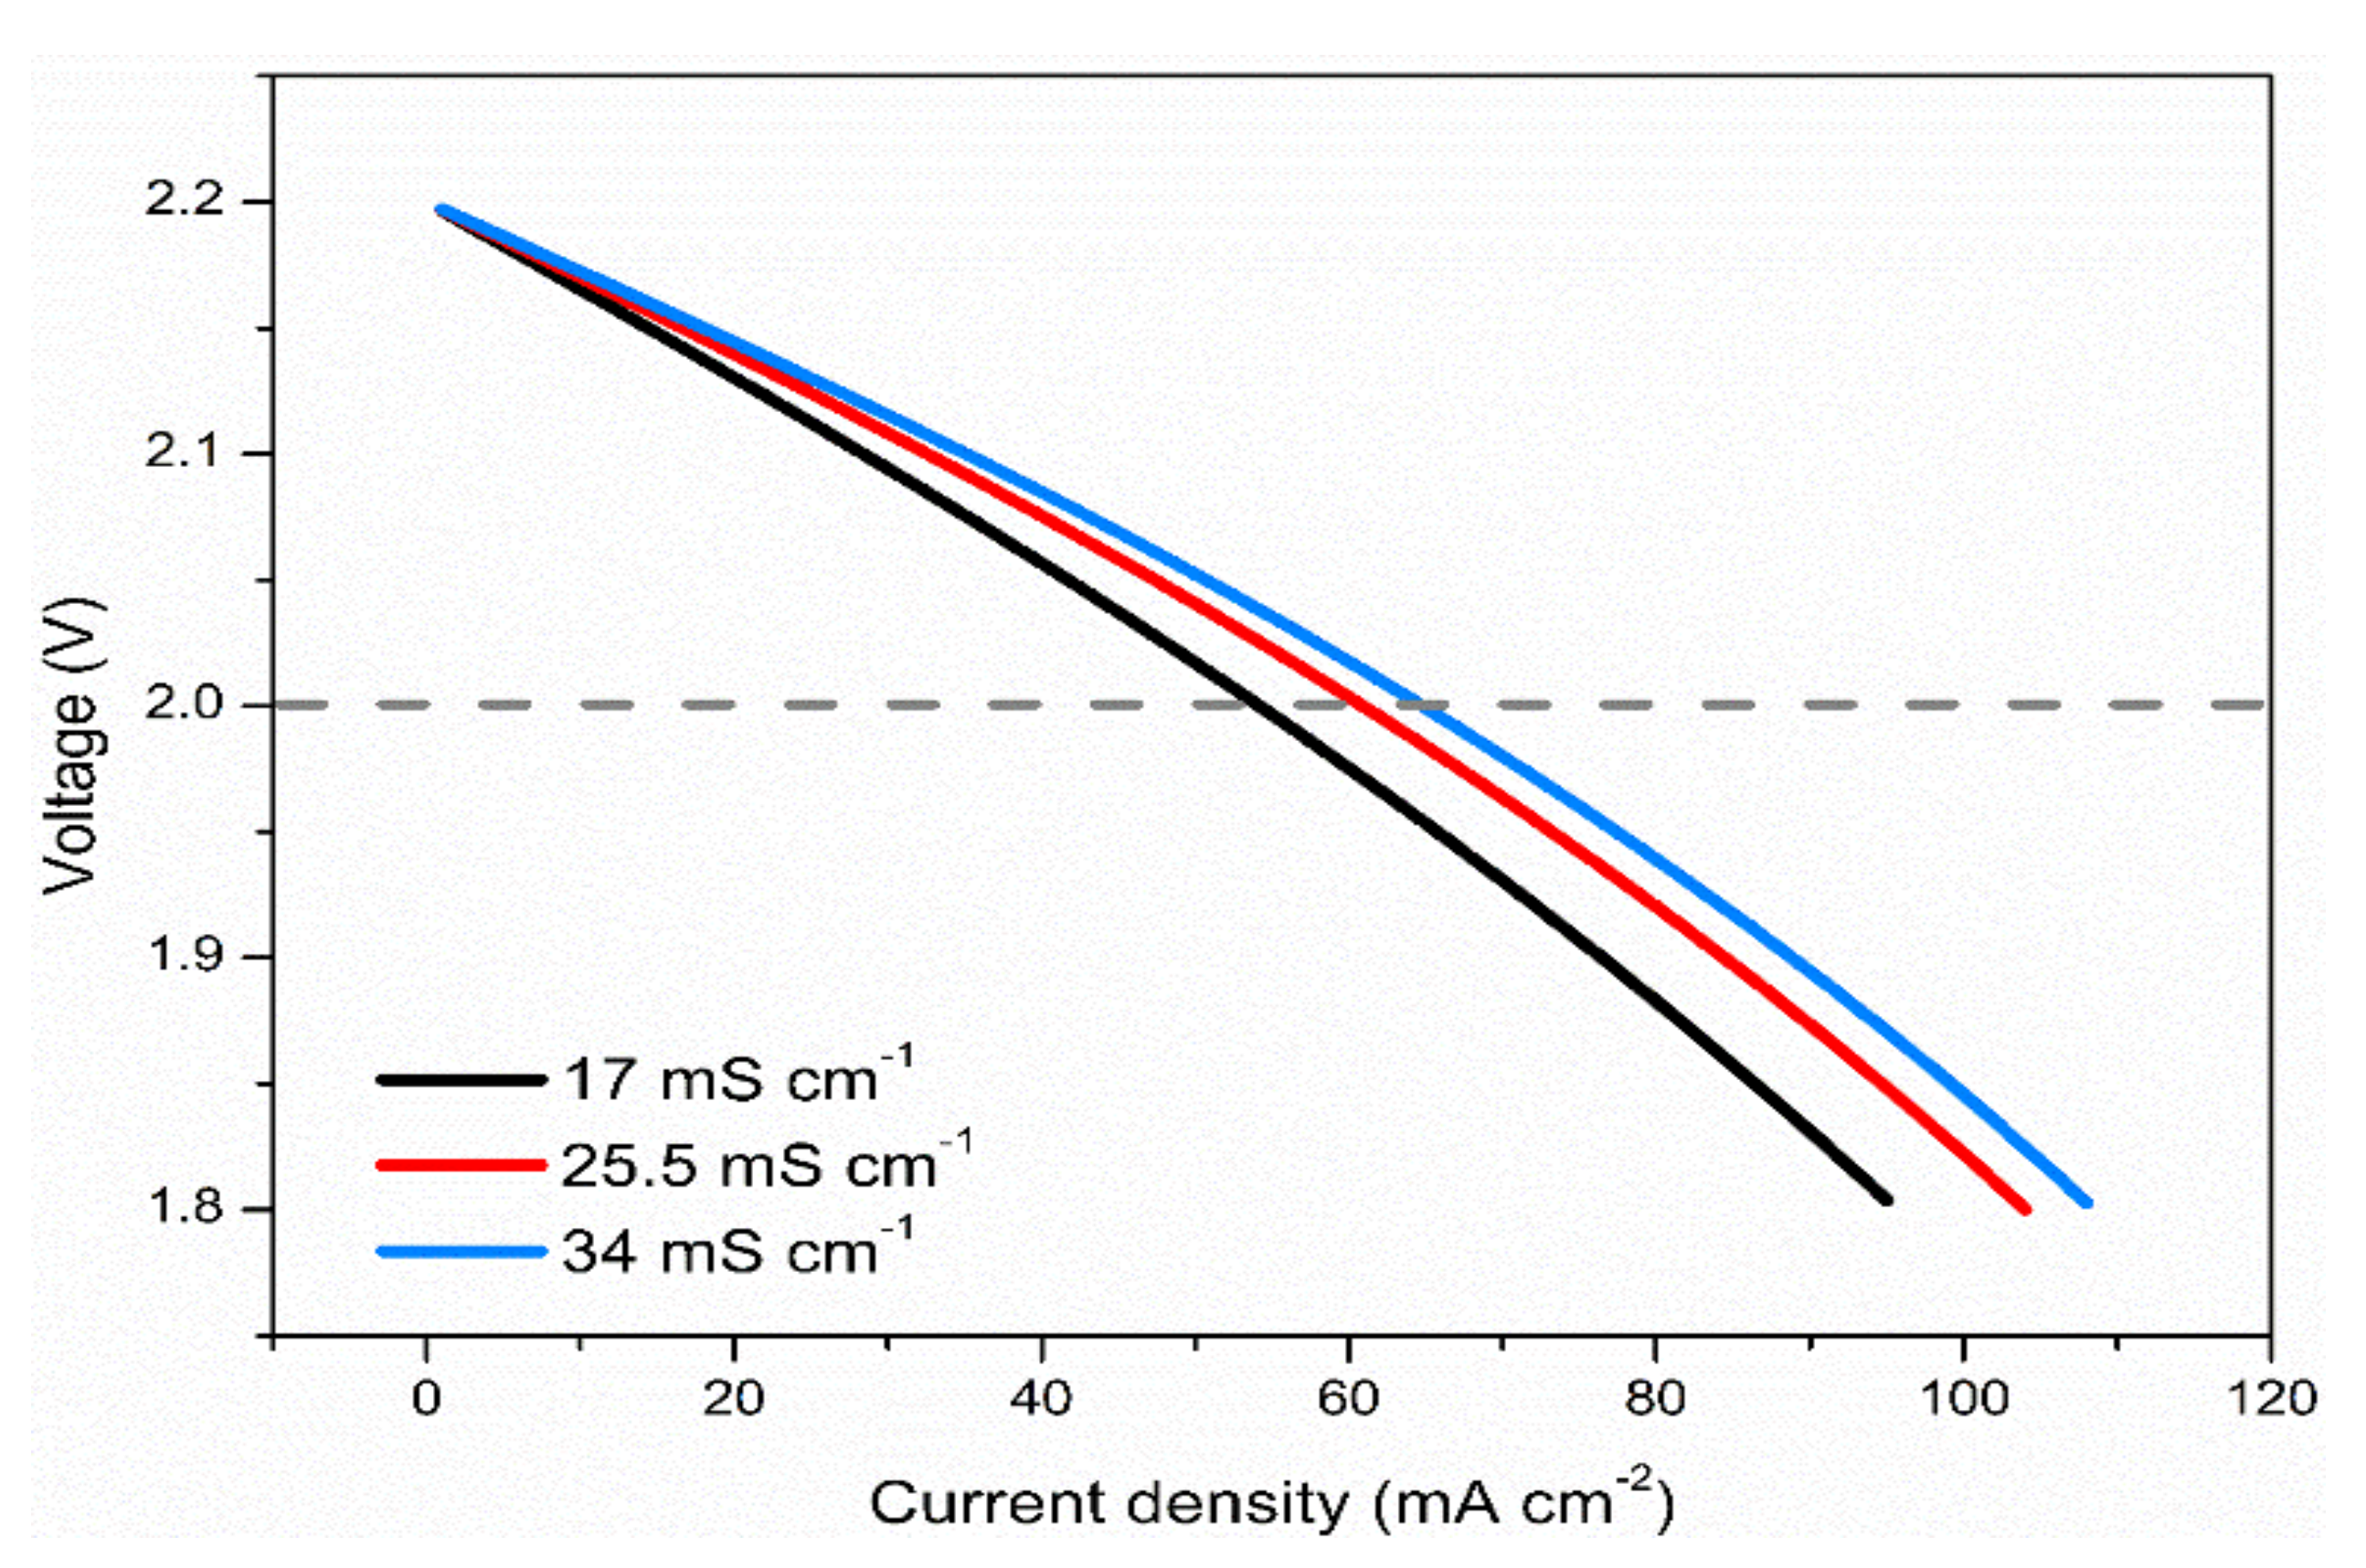
3.7. Effects of Membrane Conductivity

Apart from the influence of electrodes and electrolytes, the membrane is also a key component and exerts a large influence on the battery rate performance. As the roles of the membrane in an NRFB include transportation of charge carriers and separation of the positive and negative electrolytes, it requires the membrane to be not only conductive but also selective. Although the conventional Nafion membrane gives high selectivity, the conductivity of this type of membrane in nonaqueous flow battery is very low, as reported in [32]. In this regard, a porous membrane shows great potential as the conductivity and selectivity can be tuned by the pore sizes. Hence, a porous separator was adopted in the present study with a conductivity of 17 mS cm−1, as indicated in [32]. Because membrane conductivity should have an influence on the rate capability of batteries, we performed simulations of polarization curves of different batteries with different membrane conductivities. The results showed that the battery with higher membrane conductivity delivered higher performance with lower polarization, as shown in Figure 9. Increasing the membrane conductivity from 17 to 25.6 mS cm−1 led to improvement in performance. The current density, at which the voltage efficiency is 90%, could be increased from 54 to 61 mA cm−2. It is worth mentioning that it is possible to achieve 1.5 times improvement in conductivity by tuning and adjusting the tortuosity and pore size of the membrane in practical situations [39].

4. Concluding Remarks

Replacing an aqueous electrolyte with a nonaqueous one can extend the working electrochemical window and increase the operating cell voltage and thus the energy density of a flow battery. In this work, a physical model that considers electrolyte flow, transfer of active materials, ions, and electrons as well as electrochemical reactions is proposed for a nonaqueous vanadium flow battery in order to understand the effect of structural design and key factors limiting battery performance. The concentration of active materials and the electrode surface area were found to greatly influence the kinetics of redox reactions, and the battery performance improved with increase in concentration and surface area. As a result of the relatively low ionic conductivity of nonaqueous electrolytes, the local reaction rate or current density exhibited highly uneven distribution with a much larger value towards the membrane and a smaller value towards the current collector, suggesting low utilization of the electrode. The simulation results also showed that reducing the electrode thickness and increasing the membrane conductivity were both beneficial for decreasing ohmic loss, thereby leading to improved flow battery performance. The proposed model and the obtained numerical results may help gain in-depth understanding of the performance characteristics of nonaqueous flow batteries and guide future optimization of their design parameters.

Author Contributions

Conceptualization, validation, manuscript writing, S.H. and Y.L. All authors have read and agreed to the published version of the manuscript.

Funding

This research received no external funding.

Institutional Review Board Statement

Not applicable.

Informed Consent Statement

Not applicable.

Data Availability Statement

Not applicable.

Conflicts of Interest

The authors declare no conflict of interest.

Nomenclature

athe specific surface area of the porous electrode, m−1
cconcentration of species, mol m−3
dthickness of the electrode, m
Ddiffusivity of the species, m2 s−1
FFaraday’s constant, C mol−1
Hcelllength of the porous electrode
Ioperational current density, A m−2
jlocal reaction current density, A m−2
k+/-reaction rate constant, m s−1
kmpore-level mass transport coefficient, s−1
Nsuperficial molar flux, mol m2 s−1
ppressure, Pa
Runiversal gas constant, J mol−1 K−1
Ssource term
ttime, s
Ttemperature, K
umobility, mol s−1 kg−1
v superficial velocity, m s−1 v
U0equilibrium potential, V
U 0 standard equilibrium potential, V
Vtank volume, m−3
wcellwidth of the porous electrode
zvalence
Greek
ρdensity, kg m−3
μviscosity, kg m−1 s−1
εporosity
κhydraulic permeability, m2
σconductivity, S m−1
potential, V
ηoverpotential, V
αcharge transfer coefficient
ωvolumetric flow rate, m3 s−1
Superscripts and subscripts
eelectrolyte
effeffective
ispecies
ininlet
mmembrane
outoutlet
ssolid
V(II)V(acac)3
V(III)V(acac)3
V(IV)V(acac)3+

References

  1. Sun, C.; Negro, E.; Vezzu, K.; Pagot, G.; Cavinato, G.; Nale, A.; Bang, Y.H.; Noto, V.D. Hybrid inorganic-organic proton-conducting membranes based on SPEEK doped with WO3 nanoparticles for application in vanadium redox flow batteries. Electrochim. Acta 2019, 309, 311–325. [Google Scholar] [CrossRef]
  2. Weber, A.Z.; Mench, M.M.; Meyers, J.P.; Ross, P.N.; Gostick, J.T.; Liu, Q. Redox flow batteries: A review. J. Appl. Electrochem. 2011, 41, 1137–1164. [Google Scholar] [CrossRef] [Green Version]
  3. Huskinson, B.; Marshak, M.P.; Suh, C.; Er, S.; Gerhardt, M.R.; Galvin, C.J.; Chen, X.; Aspuru-Guzik, A.; Gordon, R.G.; Aziz, M.J. A metal-free organic–inorganic aqueous flow battery. Nature 2014, 505, 195–198. [Google Scholar] [CrossRef]
  4. Lin, K.; Chen, Q.; Gerhardt, M.R.; Tong, L.; Kim, S.B.; Eisenach, L.; Valle, A.W.; Hardee, D.; Gordon, R.G.; Aziz, M.J.; et al. Alkaline quinone flow battery. Science 2015, 349, 1529–1532. [Google Scholar] [CrossRef] [PubMed] [Green Version]
  5. Chalamala, B.R.; Soundappan, T.; Fisher, G.R.; Anstey, M.R.; Viswanathan, V.V.; Perry, M.L. Redox flow batteries: An engineering perspective. Proc. IEEE 2014, 102, 976–999. [Google Scholar] [CrossRef]
  6. Perry, M.L.; Weber, A.Z. Advanced redox-flow batteries: A perspective. J. Electrochem. Soc. 2015, 163, A5064–A5067. [Google Scholar] [CrossRef]
  7. Zhang, H.; Sun, C. Cost-effective iron-based aqueous redox flow batteries for large-scale energy storage application: A review. J. Power Sources 2021, 493, 229445. [Google Scholar] [CrossRef]
  8. Darling, R.M.; Gallagher, K.G.; Kowalski, J.A.; Ha, S.; Brushett, F.R. Pathways to low-cost electrochemical energy storage: A comparison of aqueous and nonaqueous flow batteries. Energy Environ. Sci. 2014, 7, 3459–3477. [Google Scholar] [CrossRef] [Green Version]
  9. Yuan, Z.; Yin, Y.; Xie, C.; Zhang, H.; Yao, Y.; Li, X. Advanced materials for zinc-based flow battery: Development and challenge. Adv. Mater. 2019, 31, 1902025. [Google Scholar] [CrossRef]
  10. Kim, D.; Seo, S.; Lee, M.; Park, J.; Moon, S.; Kang, Y.S.; Choi, Y.; Kang, M. Pore-filled anion-exchange membranes for non-aqueous redox flow batteries with dual-metal-complex redox shuttles. J. Membr. Sci. 2014, 454, 44–50. [Google Scholar] [CrossRef]
  11. Davies, T.J.; Tummino, J.J. High-performance vanadium redox flow batteries with graphite felt electrodes. C—J. Carbon Res. 2018, 4, 8. [Google Scholar] [CrossRef] [Green Version]
  12. Khataee, A.; Drazevic, E.; Catalano, J.; Bentien, A. Performance optimization of differential pH quinone-bromide redox flow battery. J. Electrochem. Soc. 2018, 165, A3918–A3924. [Google Scholar] [CrossRef] [Green Version]
  13. Liu, Q.; Sleightholme, A.E.; Shinkle, A.A.; Li, Y.; Thompson, L.T. Non-aqueous vanadium acetylacetonate electrolyte for redox flow batteries. Electrochem. Commun. 2009, 11, 2312–2315. [Google Scholar] [CrossRef]
  14. Brushett, F.R.; Vaughey, J.T.; Jansen, A.N. An all-organic non-aqueous lithium-ion redox flow battery. Adv. Energy Mater. 2012, 2, 1390–1396. [Google Scholar] [CrossRef]
  15. Liu, Q.; Shinkle, A.A.; Li, Y.; Monroe, C.W.; Thompson, L.T.; Sleightholme, A.E. Non-aqueous chromium acetylacetonate electrolyte for redox flow batteries. Electrochem. Commun. 2010, 12, 1634–1637. [Google Scholar] [CrossRef]
  16. Shin, S.; Yun, S.; Moon, S. A review of current developments in non-aqueous redox flow batteries: Characterization of their membranes for design perspective. Rsc Adv. 2013, 3, 9095–9116. [Google Scholar] [CrossRef]
  17. Hamelet, S.; Tzedakis, T.; Leriche, J.; Sailler, S.; Larcher, D.; Taberna, P.; Simon, P.; Tarascon, J. Non-aqueous Li-based redox flow batteries. J. Electrochem. Soc. 2012, 159, A1360–A1367. [Google Scholar] [CrossRef] [Green Version]
  18. Zhang, D.; Liu, Q.; Shi, X.; Li, Y. Tetrabutylammonium hexafluorophosphate and 1-ethyl-3-methyl imidazolium hexafluorophosphate ionic liquids as supporting electrolytes for non-aqueous vanadium redox flow batteries. J. Power Sources 2012, 203, 201–205. [Google Scholar] [CrossRef]
  19. Sleightholme, A.E.; Shinkle, A.A.; Liu, Q.; Li, Y.; Monroe, C.W.; Thompson, L.T. Non-aqueous manganese acetylacetonate electrolyte for redox flow batteries. J. Power Sources 2011, 196, 5742–5745. [Google Scholar] [CrossRef]
  20. Mun, J.; Lee, M.; Park, J.; Oh, D.; Lee, D.; Doo, S. Non-aqueous redox flow batteries with nickel and iron tris (2, 2′-bipyridine) complex electrolyte. Electrochem. Solid-State Lett. 2012, 15, A80–A82. [Google Scholar] [CrossRef]
  21. Shinkle, A.A.; Sleightholme, A.E.; Griffith, L.D.; Thompson, L.T.; Monroe, C.W. Degradation mechanisms in the non-aqueous vanadium acetylacetonate redox flow battery. J. Power Sources 2012, 206, 490–496. [Google Scholar] [CrossRef]
  22. Herr, T.; Noack, J.; Fischer, P.; Tübke, J. 1, 3-Dioxolane, tetrahydrofuran, acetylacetone and dimethyl sulfoxide as solvents for non-aqueous vanadium acetylacetonate redox-flow-batteries. Electrochim. Acta 2013, 113, 127–133. [Google Scholar] [CrossRef]
  23. Maurya, S.; Shin, S.; Sung, K.; Moon, S. Anion exchange membrane prepared from simultaneous polymerization and quaternization of 4-vinyl pyridine for non-aqueous vanadium redox flow battery applications. J. Power Sources 2014, 255, 325–334. [Google Scholar] [CrossRef]
  24. Suttil, J.; Kucharyson, J.; Escalante-Garcia, I.; Cabrera, P.; James, B.; Savinell, R.; Sanford, M.; Thompson, L. Metal acetylacetonate complexes for high energy density non-aqueous redox flow batteries. J. Mater. Chem. A 2015, 3, 7929–7938. [Google Scholar] [CrossRef]
  25. Wei, X.; Xu, W.; Vijayakumar, M.; Cosimbescu, L.; Liu, T.; Sprenkle, V.; Wang, W. TEMPO-based catholyte for high-energy density nonaqueous redox flow batteries. Adv. Mater. 2014, 26, 7649–7653. [Google Scholar] [CrossRef] [PubMed]
  26. Su, L.; Ferrandon, M.; Kowalski, J.A.; Vaughey, J.T.; Brushett, F.R. Electrolyte development for non-aqueous redox flow batteries using a high-throughput screening platform. J. Electrochem. Soc. 2014, 161, A1905–A1914. [Google Scholar] [CrossRef]
  27. Herr, T.; Fischer, P.; Tübke, J.; Pinkwart, K.; Elsner, P. Increasing the energy density of the non-aqueous vanadium redox flow battery with the acetonitrile-1, 3-dioxolane–dimethyl sulfoxide solvent mixture. J. Power Sources 2014, 265, 317–324. [Google Scholar]
  28. Darling, R.; Gallagher, K.; Xie, W.; Su, L.; Brushett, F. Transport Property Requirements for Flow Battery Separators. J. Electrochem. Soc. 2015, 163, A5029–A5040. [Google Scholar] [CrossRef] [Green Version]
  29. Sun, C.; Negro, E.; Nale, A.; Pagot, G.; Vezzu, K.; Zawodzinski, T.A.; Meda, L.; Gambaro, C.; Noto, V.D. An efficient barrier toward vanadium crossover in redox flow batteries: The bilayer [Nafion/(WO3)x] hybrid inorganic-organic membrane. Electrochim. Acta 2021, 378, 138133. [Google Scholar]
  30. Yuan, J.; Pan, Z.Z.; Jin, Y.; Qiu, Q.; Zhang, C.; Zhao, Y.; Li, Y. Membranes in non-aqueous redox flow battery: A review. J. Power Sources 2021, 500, 229983. [Google Scholar]
  31. Milshtein, J.D.; Barton, J.L.; Darling, R.M.; Brushett, F.R. 4-acetamido-2, 2, 6, 6-tetramethylpiperidine-1-oxyl as a model organic redox active compound for nonaqueous flow batteries. J. Power Sources 2016, 327, 151–159. [Google Scholar]
  32. Escalante-García, I.L.; Wainright, J.S.; Thompson, L.T.; Savinell, R.F. Performance of a non-aqueous vanadium acetylacetonate prototype redox flow battery: Examination of separators and capacity decay. J. Electrochem. Soc. 2014, 162, A363–A372. [Google Scholar]
  33. Zhou, X.; Zhao, T.; An, L.; Zeng, Y.; Yan, X. A vanadium redox flow battery model incorporating the effect of ion concentrations on ion mobility. Appl. Energy 2015, 158, 157–166. [Google Scholar]
  34. Li, Y.; Skyllas-Kazacos, M.; Bao, J. A dynamic plug flow reactor model for a vanadium redox flow battery cell. J. Power Sources 2016, 311, 57–67. [Google Scholar]
  35. Shah, A.; Watt-Smith, M.; Walsh, F. A dynamic performance model for redox-flow batteries involving soluble species. Electrochim. Acta 2008, 53, 8087–8100. [Google Scholar]
  36. You, D.; Zhang, H.; Chen, J. A simple model for the vanadium redox battery. Electrochim. Acta 2009, 54, 6827–6836. [Google Scholar]
  37. Al-Fetlawi, H.; Shah, A.; Walsh, F. Non-isothermal modelling of the all-vanadium redox flow battery. Electrochim. Acta 2009, 55, 78–89. [Google Scholar]
  38. Knehr, K.; Agar, E.; Dennison, C.; Kalidindi, A.; Kumbur, E. A transient vanadium flow battery model incorporating vanadium crossover and water transport through the membrane. J. Electrochem. Soc. 2012, 159, A1446–A1459. [Google Scholar]
  39. Zhou, X.; Zhao, T.; An, L.; Zeng, Y.; Wei, L. Modeling of ion transport through a porous separator in vanadium redox flow batteries. J. Power Sources 2016, 327, 67–76. [Google Scholar]
  40. Yang, W.; He, Y.; Li, Y. Performance modeling of a vanadium redox flow battery during discharging. Electrochim. Acta 2015, 155, 279–287. [Google Scholar] [CrossRef]
  41. Yang, X.; Ye, Q.; Cheng, P.; Zhao, T.S. Effects of the electric field on ion crossover in vanadium redox flow batteries. Appl. Energy 2015, 145, 306–319. [Google Scholar] [CrossRef]
  42. Won, S.; Oh, K.; Ju, H. Numerical analysis of vanadium crossover effects in all-vanadium redox flow batteries. Electrochim. Acta 2015, 177, 310–320. [Google Scholar] [CrossRef]
  43. Oh, K.; Won, S.; Ju, H. A comparative study of species migration and diffusion mechanisms in all-vanadium redox flow batteries. Electrochim. Acta 2015, 181, 238–247. [Google Scholar] [CrossRef]
  44. Wang, Y.; Cho, S.C. Analysis and three-dimensional modeling of vanadium flow batteries. J. Electrochem. Soc. 2014, 161, A1200–A1212. [Google Scholar] [CrossRef] [Green Version]
  45. Sharma, A.; Ling, C.; Birgersson, E.; Vynnycky, M.; Han, M. Verified reduction of dimensionality for an all-vanadium redox flow battery model. J. Power Sources 2015, 279, 345–350. [Google Scholar] [CrossRef]
  46. Xiong, B.; Zhao, J.; Wei, Z.; Skyllas-Kazacos, M. Extended Kalman filter method for state of charge estimation of vanadium redox flow battery using thermal-dependent electrical model. J. Power Sources 2014, 262, 50–61. [Google Scholar] [CrossRef]
  47. Chen, C.L.; Yeoh, H.K.; Chakrabarti, M.H. An enhancement to Vynnycky’s model for the all-vanadium redox flow battery. Electrochim. Acta 2014, 120, 167–179. [Google Scholar] [CrossRef]
  48. Ma, X.; Zhang, H.; Xing, F. A three-dimensional model for negative half cell of the vanadium redox flow battery. Electrochim. Acta 2011, 58, 238–246. [Google Scholar] [CrossRef]
  49. Mohamed, M.; Ahmad, H.; Seman, M.A.; Razali, S.; Najib, M. Electrical circuit model of a vanadium redox flow battery using extended Kalman filter. J. Power Sources 2013, 239, 284–293. [Google Scholar]
  50. Yin, C.; Gao, Y.; Guo, S.; Tang, H. A coupled three dimensional model of vanadium redox flow battery for flow field designs. Energy 2014, 74, 886–895. [Google Scholar]
  51. Yan, Y.; Li, Y.; Skyllas-Kazacos, M.; Bao, J. Modelling and simulation of thermal behaviour of vanadium redox flow battery. J. Power Sources 2016, 322, 116–128. [Google Scholar] [CrossRef]
  52. Wandschneider, F.; Finke, D.; Grosjean, S.; Fischer, P.; Pinkwart, K.; Tübke, J.; Nirschl, H. Model of a vanadium redox flow battery with an anion exchange membrane and a Larminie-correction. J. Power Sources 2014, 272, 436–447. [Google Scholar] [CrossRef]
  53. Wandschneider, F.; Küttinger, M.; Noack, J.; Fischer, P.; Pinkwart, K.; Tübke, J.; Nirschl, H. A coupled-physics model for the vanadium oxygen fuel cell. J. Power Sources 2014, 259, 125–137. [Google Scholar] [CrossRef]
  54. Shinkle, A.A.; Sleightholme, A.E.; Thompson, L.T.; Monroe, C.W. Electrode kinetics in non-aqueous vanadium acetylacetonate redox flow batteries. J. Appl. Electrochem. 2011, 41, 1191–1199. [Google Scholar] [CrossRef]
  55. Bard, A.J.; Faulkner, L.R. Electrochemical Methods: Fundamentals and Applications, 2nd ed.; John Wiley & Sons, Inc.: Hoboken, NJ, USA, 2000. [Google Scholar]
Figure 2. The flow chart of the present model.
Batteries 08 00075 g002
Figure 3. Validation of the present model with experimental data from [32]. Electrolyte: 100 mM V(acac)3 in 500 mM TEABF4; membrane: microporous separator (Daramic 175); flow rate: 25 mL min−1; current density: 10 mA cm−2; temperature: 300 K.
Batteries 08 00075 g003
Figure 4. (a) Concentration distribution of V(II) at negative side and V(IV) at positive side and (b) reaction current density distribution at SOC of 50% during discharging at 10 mA cm−2. Flow rate: 25 mL min−1; temperature: 300 K.
Batteries 08 00075 g004
Figure 5. Effect of different initial vanadium concentrations. SOC: 50%; flow rate: 25 mL min−1; temperature: 300 K.
Batteries 08 00075 g005
Figure 6. Effect of different electrode specific surface areas. Electrolyte: 100 mM V(acac)3 in 500 mM TEABF4; SOC: 50%; flow rate: 25 mL min−1; temperature: 300 K.
Batteries 08 00075 g006
Figure 7. Effect of different electrode thicknesses. Electrolyte: 100 mM V(acac)3 in 500 mM TEABF4; SOC: 50%; flow rate: 25 mL min−1; temperature: 300 K.
Batteries 08 00075 g007
Figure 8. Effect of different bulk electrolyte conductivities. SOC: 50%; flow rate: 25 mL min−1; temperature: 300 K.
Batteries 08 00075 g008
Figure 9. Effect of different membrane conductivities. Electrolyte: 100 mM V(acac)3 in 500 mM TEABF4; SOC: 50%; flow rate: 25 mL min−1; temperature: 300 K.
Batteries 08 00075 g009
Table 2. Source terms of the governing equations.
TermPositive ElectrodeNegative Electrode
Mass conservation equation of V(II), SV(II)j/F
Mass conservation equation of V(III), SV(III)j/F-j/F
Mass conservation equation of V(IV), SV(IV)-j/F
Table 3. Geometric parameters, material properties and operating conditions.
ParameterValue
Cell length, Hcell0.026 m
Cell width, wcell0.026 m
Electrode thickness, Le0.0036 m
Membrane thickness, Lm0.000125 m
Electrode porosity [39], ε0.883
Electrode spicific surface area *, a1.75 × 104 m2/m3
Electrode permeability [39] ,   κ 6.0 × 10⁻¹¹
Electrode electrical conductivity [39] ,   σ s 220 S m−1
Temperature, T300 K
Membrane conductivity [32] ,   σ m 17 S m−1
Areal contact resistance [42] ,   R con 74 mΩ cm−2
* Fitted parameter.
Table 4. Kinetic parameters.
TermValue
Standard rate constant of negative reaction, k [53]1.25 × 10⁻⁵ m s−1
Standard rate constant of positive reaction, k+ [53]1.18 × 10⁻⁵ m s−1
Cathodic transfer coefficient of negative electrode, α 0.5
Cathodic transfer coefficient of positive electrode, α+ 0.5
Equilibrium   potential   of   negative   reaction ,   U 0 , [32]−1.75 V
Equilibrium   potential   of   positive   reaction ,   U 0 , + [32]0.45 V
Table 5. Initial species concentrations.
TermValue at 10% SOC
V ( II ) +   concentration   in   negative   electrolyte ,   c V ( II ) 0 10 mol m−3
V ( III )   concentration   in   negative   electrolyte ,   c V ( III ) ,   neg 0 90 mol m−3
V ( III )   concentration   in   positive   electrolyte ,   c V ( III ) ,   pos 0 90 mol m−3
V ( IV )   concentration   in   positive   electrolyte ,   c V ( IV ) 0 10 mol m−3
TEA +   concentration   in   positive   electrolyte ,   c TEA + ,   pos 0 490 mol m−3
TEA +   concentration   in   negative   electrolyte ,   c TEA + ,   neg 0 510 mol m−3
BF 4   concentration   in   positive   electrolyte ,   c BF 4 - ,   pos 0 500 mol m−3
BF 4   concentration   in   negative   electrolyte ,   c BF 4 , neg 0 500 mol m−3
Publisher’s Note: MDPI stays neutral with regard to jurisdictional claims in published maps and institutional affiliations.

