1. Introduction
Today, much of the industry is beginning to adapt to the advent of electromobility. In other words, society is pushing to produce energy from renewable sources and to use it efficiently. These aspects determine that developments in the field of energy storage systems are beginning to flourish. The development of new chemicals, battery management systems, or the maximization of battery safety opens the door for development in this research area. The production of batteries is experiencing a significant boom. Many manufacturers are trying to supply new types of batteries, new packaging, or parameter improvements. Development requires battery parameters, which the manufacturer rarely states. Therefore, development needs a system that can detect these parameters. Energy storage systems composed of batteries are nowadays increasingly gaining popularity within industrial applications requiring high power and high voltage rankings. This is due to their advantageous features, such as high operational efficiencies and low environmental impact when compared to fossil fuels. Currently, it is possible to discover several battery technologies, while electrochemical cells based on Li-ion are typically the preferred solutions due to their specific energy density and acceptable operational life [
1,
2].
To maximize battery performance, an effective battery simulation model plays a crucial role in supporting the system design, its functional analysis, and control strategies. Considering current battery model types–electrochemical models, reduced order models, and data-driven black-box models–the equivalent electrical circuit models (EECMs) offer acceptable accuracy of the results related to expected battery operation. In this way, it is possible to analyze power prediction, estimate the state of charge and state of health as well. An additional advantage of the use of such models is the possibility to evaluate balancing methods during charging and discharging procedures [
3,
4,
5].
Due to the abovementioned facts, the proposal and design of the system of parameter identification of an equivalent electrical circuit of electrochemical cells is required. Basically, this statement can be confirmed by the fact that almost all manufacturers provide electrical parameters for their batteries, while the parameters corresponding to the element of the equivalent circuit are not subject to publication in the product datasheets.
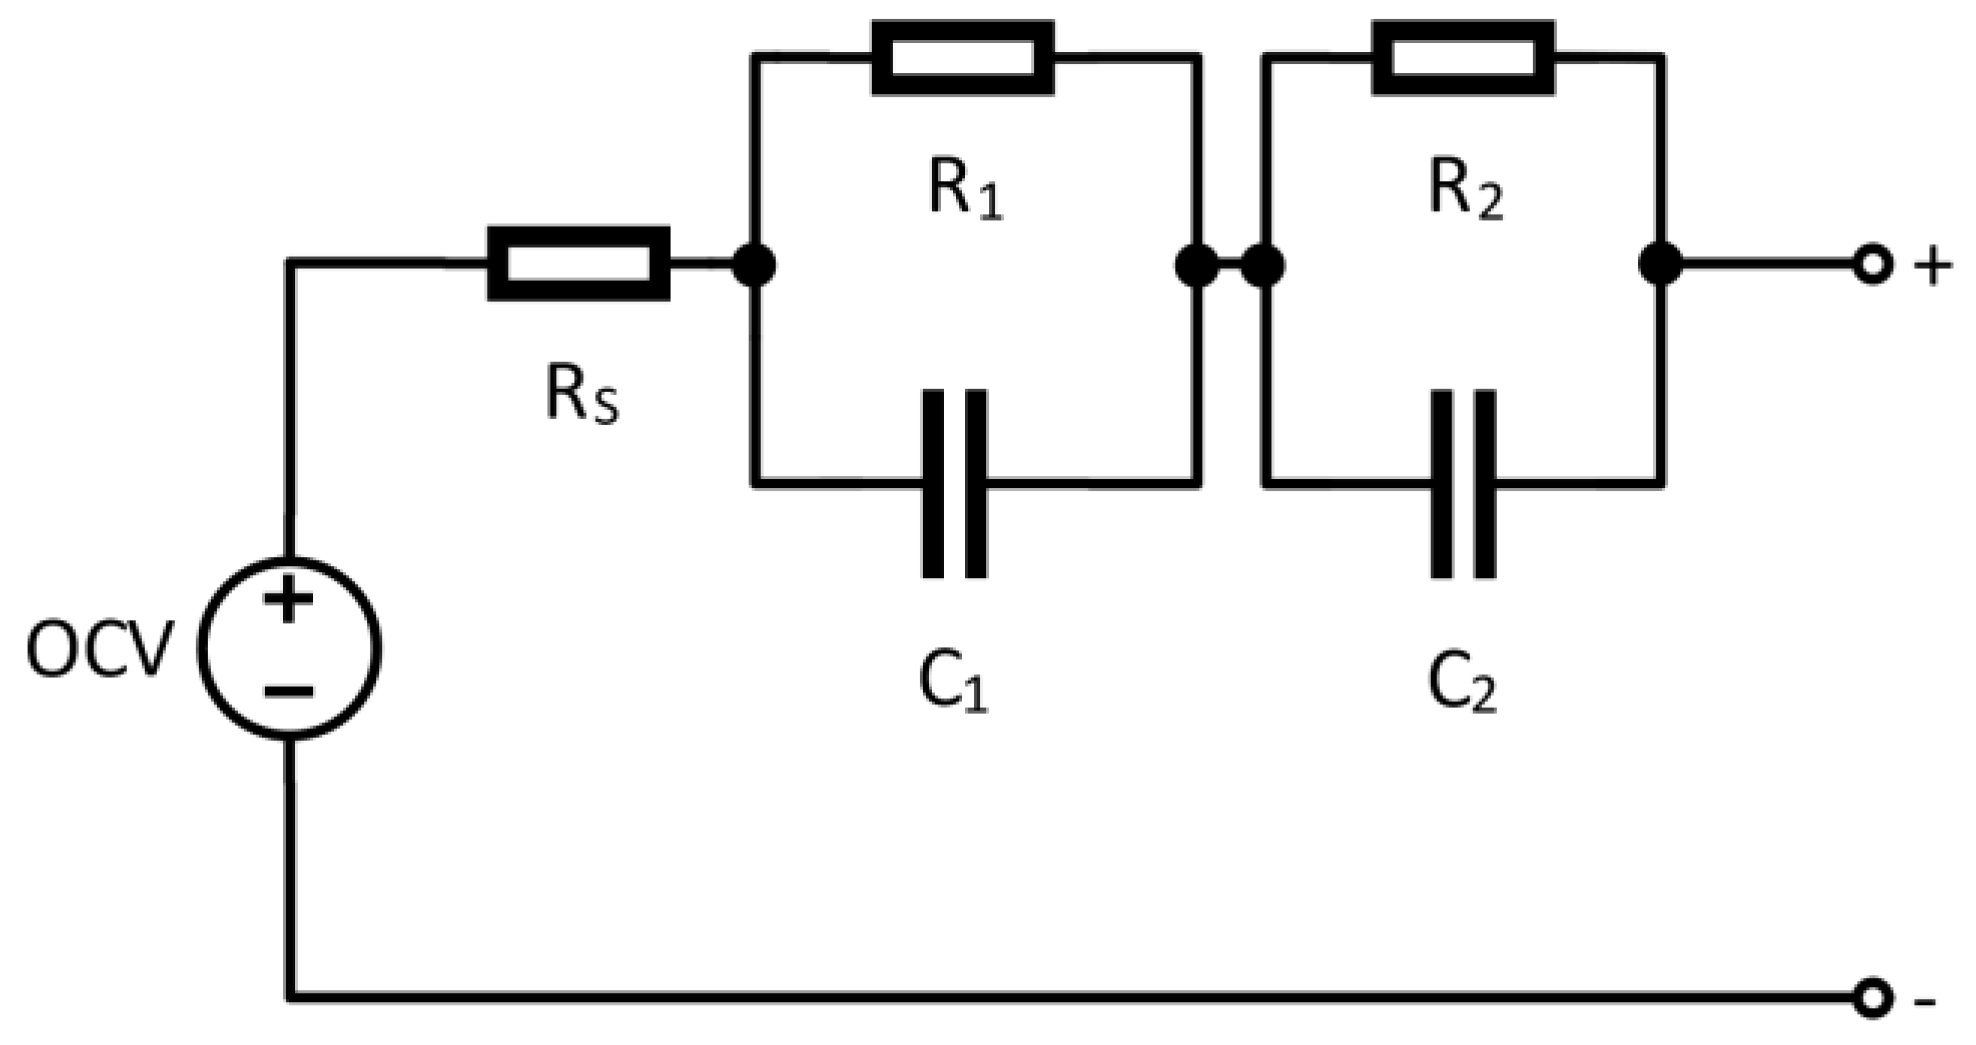
According to the dynamic behavior of the battery cell, the EECM is composed from resistances, capacitances, and a voltage source [
6,
7]. In order to model open–circuit voltage (Voc), the ideal voltage source or capacitor is being utilized within the simulation model. The other components of the circuit simulate the dynamic effects such as terminal voltage relaxation and battery internal resistance [
8,
9,
10,
11]. Based on the manufacturer datasheet information, it is possible to determine the maximum current load of the cell, while this parameter is directly related to the internal resistance of the cell. The internal resistance of the cell is only rarely mentioned by the manufacturer. At the same time, this parameter is very important when considering the maximum operational power of the cell, whereby it is directly related to temperature variation of the cell itself. Considering battery safety management, the value of internal resistance indirectly influences safety conditions, in the way of voltage drop during battery loading. Voltage drop cannot reach the value of safe minimum voltage level (mainly for lithium-based cells) [
12,
13,
14].
Based on the previous description, it is desirable to be able to identify EECM of electro-chemical cells in order to evaluate the operational performance of energy storage systems. In other words, various operational scenarios of cell itself can be identified, or investigation of battery packs can be carried out, and modules can be better optimized with the use of accurate and fast computing simulation models. Moreover, analysis can be performed considering cooperation with charging/discharging systems, i.e., power electronic systems equipped by ESS can actually be evaluated. Based on previous facts, the paper presents description of the system configuration together with description of the identification methodology and consequent simulation model development based on EECM of selected lithium-based cells. The results show that the methodology enables to identify parameters of EECM in dependency of SOC, while compared to experimental results, the accuracy of proposed methodology reaches max. 5% of the relative error.
2. System Configuration for the Identification of EECM of the Battery
A block diagram of the proposed identification algorithm using system configurations of laboratory measuring devices is shown in
Figure 1. The main principle of the operation is based on the control of a programmable load and a programmable power supply unit. For this main equipment, a special control algorithm was designed using an automated data measurement and recording system through LabView environment (setting of the charging and discharging parameters—voltage, current, power). At the same time, the cell temperature is monitored, and in case of high temperature, the control system switches off the procedure for EECM identification. The main control element is represented by PXI 1031, in which two cards PXI 4070 and PXI 8101 are connected [
15]. The measuring card PXI 4070 represents a very precise multimeter. This card monitors the voltages directly on the cell and the voltage change of the thermistor, which is the thermal sensor. The PXI 8101 control card is the interface between the PC and the load/power supply. This card includes an HDMI port for connecting a display, USB ports for a mouse keyboard, and serial communication with a programmable power supply and load. These programmable devices are controlled via this serial communication. The investigation electrochemical cell is place within special chamber, where terminals of power supply and load are connected.
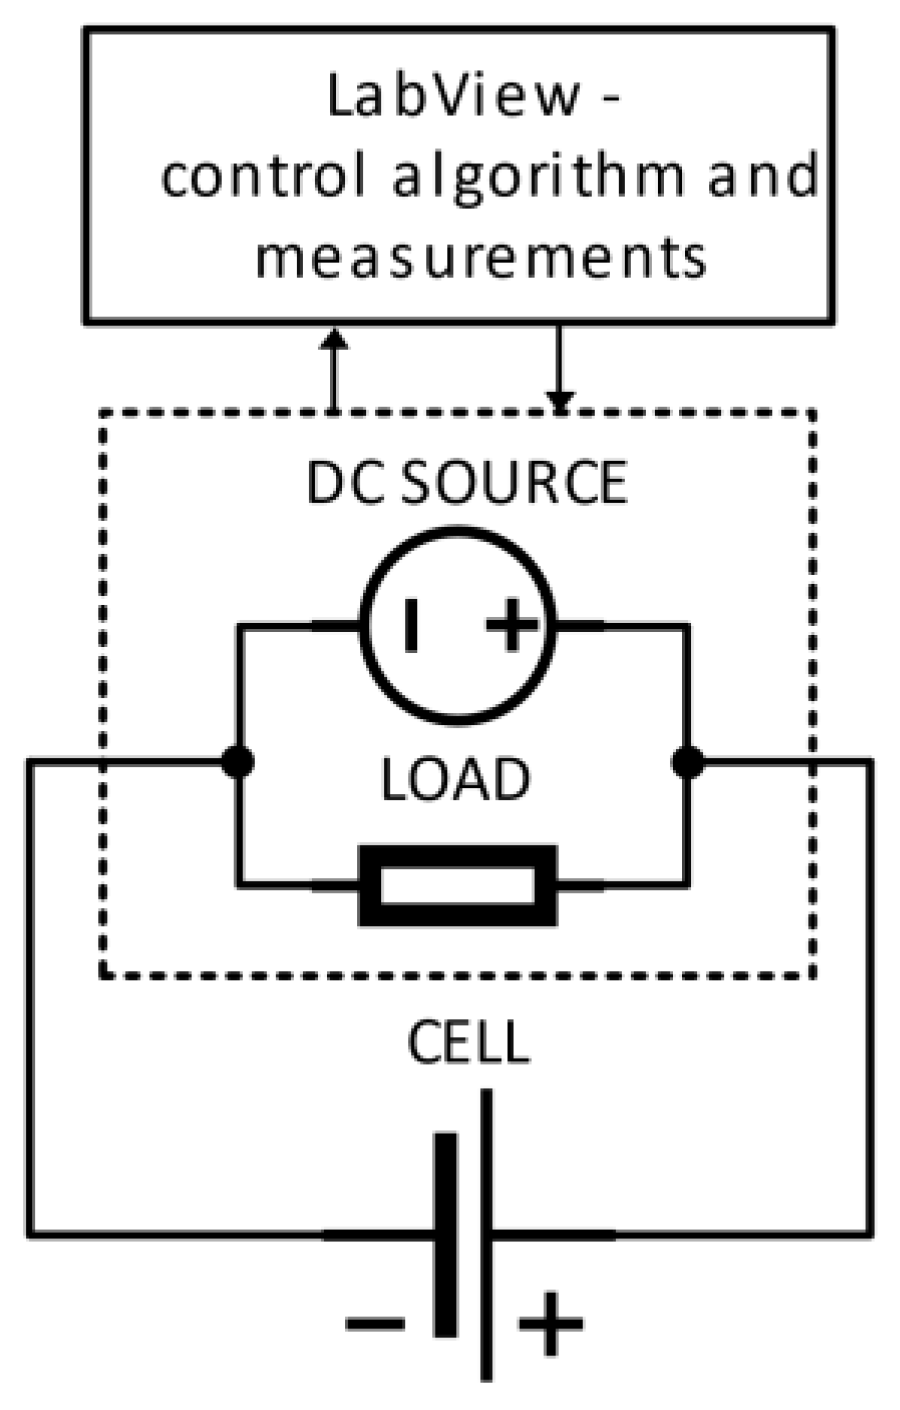
The principal electrical schematics of measurement set-up related to the described algorithm is shown on
Figure 2, while the experimental laboratory set-up is shown in
Figure 3. This system is adapted to be able to log measured values even during charging or discharging process, and also during battery relaxation. The identification algorithm is defined by these relaxation periods that allow it to evaluate values of RC networks responsible for short and long dynamic actions of electrochemical cells. The experimental set-up is equipped by the abovementioned power supply unit and electronic programable load, while its main properties are summarized in
Table 1 and
Table 2. KIKUSUI PLZ1004W is a programmable load. This load works up to a power of 1 kW, a maximum voltage of 150 V, and a maximum current of 200 A. EA-PSI 8080-60 is a programmable power supply. This power supply can work up to 1.5 kW, maximum voltage 80 V, and maximum current 60 A. The last part of the laboratory set-up is a measuring chamber, where terminals for the battery are placed; it also contains battery racks, a thermistor, a webcam, and a mechanical disconnector. It is also adapted for testing electrochemical cells within critical operational conditions (short circuit, deep discharge, overcharging, etc.) [
16,
17].
3. Description of Identification Process Procedure
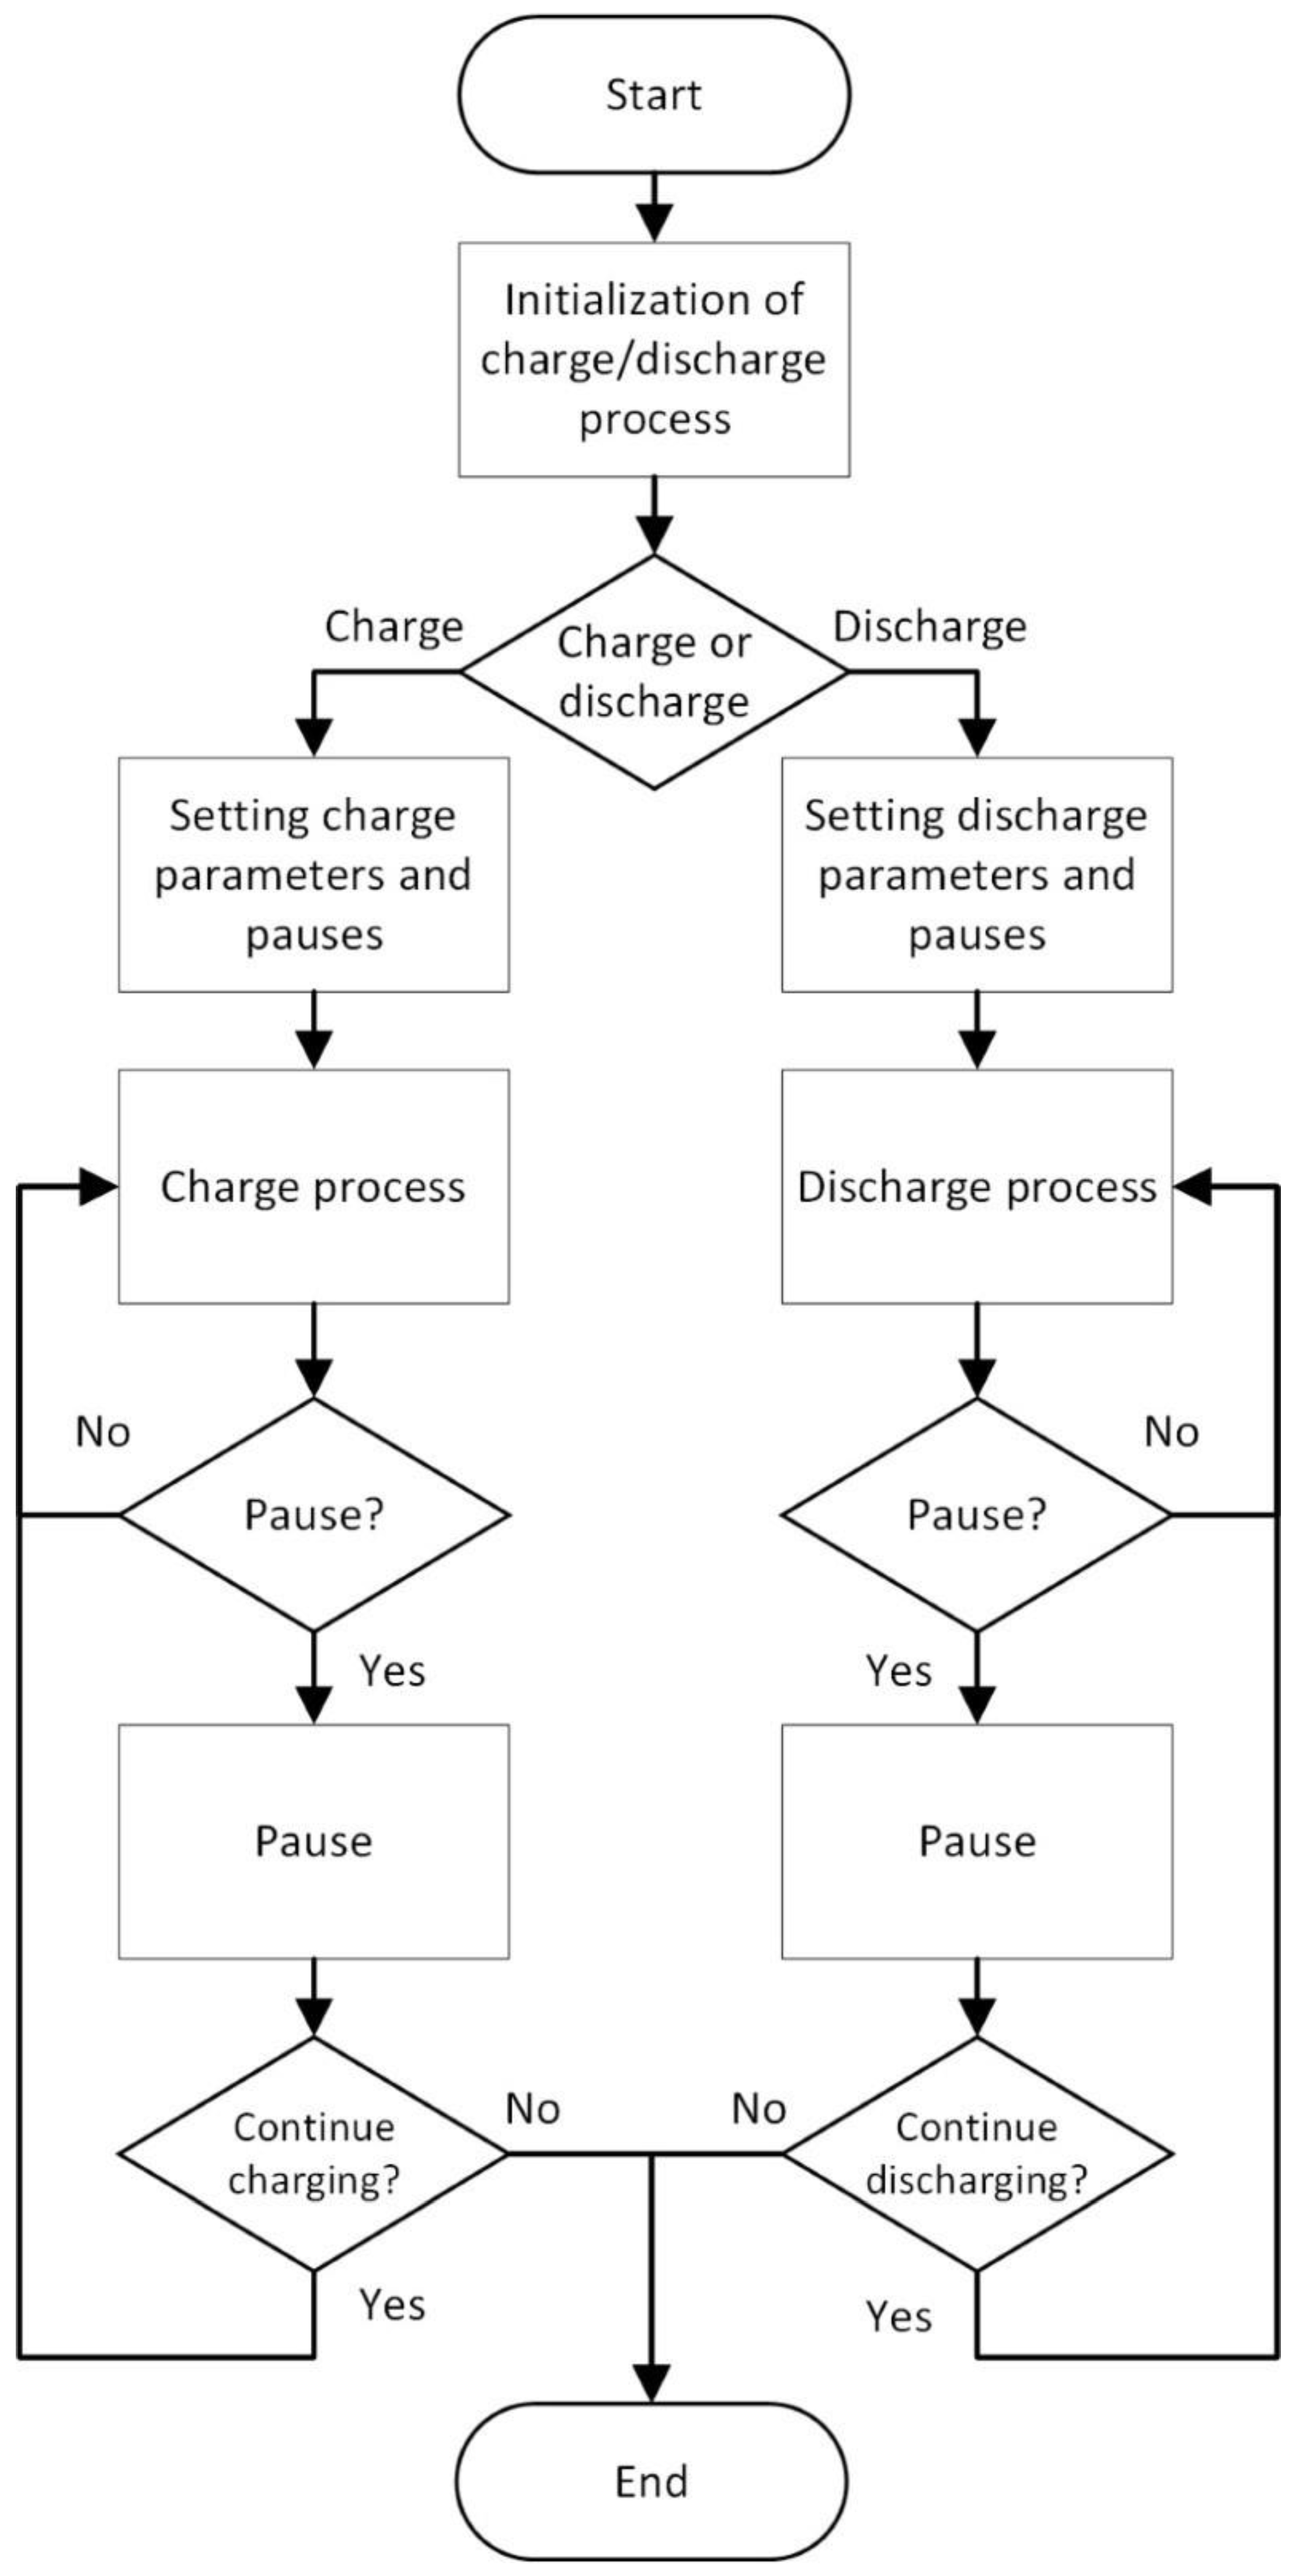
3.1. Charging Process
During charging, the algorithm sets the maximum value of voltage, charging current, and charging power, while the current control mode is set. This mode ensures that there will never be a situation where the voltage of the source can overcharge the cell or damage it with higher voltage applied. In other words, if the maximum value of the voltage is achieved by a slow rise, the value of the current is automatically reduced. Then, the source switches from current control mode to voltage control mode. During battery charging, the cell voltage is monitored by a special measuring card–PXI 4070–with high resolution and measurement accuracy, which is required due to the cell voltage level and the need for the smallest possible error. The charging process is defined in the way that after charge of the 1/10 of the battery capacity, the procedure passes into relaxation stage. This is repeated 10 times, each time after charging 1/10 of the battery capacity. In this way, the dependency of EECM parameters on
SOC are identified [
15,
16,
17].
3.2. Discharging Process
During the discharging process, the algorithm sets the amount of discharge current, the capacity at which the discharge ends, and the value of the deep discharge voltage of the electrochemical cell. Setting the value of the deep discharge is important when full
SOC range is accomplished [
18,
19]. Therefore, a fully charged cell is discharged to a voltage level of 2.5 V. This ensures that the discharge characteristic is entirely completed. Similarly to the charging process, the algorithm here is preset to adopt relaxation periods when 1/10 of the cell capacity is discharged. The process is repeated 10 times to be able to identify dependency of RC components for the whole range of
SOC [
20,
21].
3.3. Analysis of Measurement Data
The measured data consist of four values, which are logged every second:
the value of the current flowing through the cell,
the cell voltage,
the power currently sunk/sourced from battery,
and the value of the amount of capacity.
A crucial task during measurement is to precisely identify time-dependency of the relaxation period to be consequently able to accurately estimate values of equivalent electrical circuit model components (
Figure 4).
Figure 5 shows the example of one relaxation period, while the duration is reflected from the time constants of RC networks. Time instant
t0 is the time before the battery passes to the relaxation period,
t1 is the time instant related to switch-off action of the load,
t2 is the instant for the end of relaxation after the load is switched off (short relaxation) and
t3 is the time after passing 600 s (long relaxation).
The voltage difference between
t0 and
t1 determines the value of the internal resistance of the cell. This is represented by voltage
V0 (1). Considering EEM, this represents the parameter
RS in Equation (4). As was already mentioned, the voltage difference between
t1 and
t2 and the voltage difference between
t2 and
t3 represent a fast and a slow time constant; this corresponds to the values of voltage
V1 (2) (fast) and
V2 (3) (slow). Related to fast time constant, components
C1 and
R1 are forming this network, and Equations (5) and (7) should be used for their calculation. The slow time constant is represented by parameters
C2 and
R2, while Equations (6) and (8) shall be used for identification. Related to the dependency on
SOC, the values of components of EECM are evaluated for the whole range of
SOC with the step of 10%.
3.4. Selected Battery Technology Undergoing Parameters Identification
LiFePO
4-based electrochemical cells were used to verify the system methodology. Selected cells were from the same manufacturer, Winston, while the main difference was related to the package. The manufacturer declared parameters shown in
Table 3 and
Table 4. As can be seen, parameters required for modelling the equivalent electrical circuit schematics are not mentioned; while considering development, design, and investigation of behavior of the high-voltage battery pack, the parameters of EECS are more than important.
The first cell LFP040AHA is a cell using a prismatic package. The second cell NPB60AH is provided with a pouch package. Both cells have similar operating voltages, while power capability differs [
22,
23,
24].
3.4.1. WINSTON LFP040AHA
This call is based on cathode type LiFePO
4. The manufacturer declares better temperature stability than Li-ion (LiCoO
2) cells. However, better thermal stability of the cell is at the expense of lower energy density. The prismatic package of this cell is designed to make it easier to construct high-voltage battery packs. The parameters defined by the manufacturer are shown in
Table 3 [
5].
3.4.2. WINSTON NPB 60 AH
Like the previous cell, this cell has a cathode made of LiFePO
4 material. The main difference compared to the previous cell is in the package (pouch type) and the higher capacity. The pouch type cell package does not have a pressure relief valve. Its construction allows the cell to inflate, thus the evaporated electrolyte does not leave the cell. This is an advantage over the previous type, because in the critical state, the electrolyte remains in the cell, thus not losing much capacity when reused. The great disadvantage of this cell is that the high-voltage batteries disassembled from this type of cell must consider that the packaging allows the cell to inflate. This results in higher space and hardware requirements. The parameters declared by the manufacturer are shown in
Table 4 [
6].
4. Experimental Results and Their Verification
The identification of the parameters of EECM was carried out as described at
Figure 1. The discharge was performed by setting the constant current value to 0.25 C. This value represents a current value that is low enough to be able to regenerate the cell voltage in a relatively short time and to ensure the voltage drop is not too high. For LFP040AHA it refers to 10 A, and for NPB 60 AH to 15 A. At every 10%
SOC of the cell, the relaxation period was applied, so the cell voltage regeneration was monitored, and after a certain time it started to discharge within next 10%
SOC cycle. This procedure was repeated until the cell dropped below 2.5 V.
The charging process was similar to discharging, thus the constant current value, maximum cell voltage, and charging steps reflecting 10% of SOC cycle were set. The result of this measurement was received as a characteristic of OCV in dependency on SOC, while it was received by approximation of the peaks of the regenerated voltages. The recovered voltages were approximated and compared with the mean of the voltage differences when discharging and charging a particular cell. In this way, an open circuit voltage (OCV) was expressed.
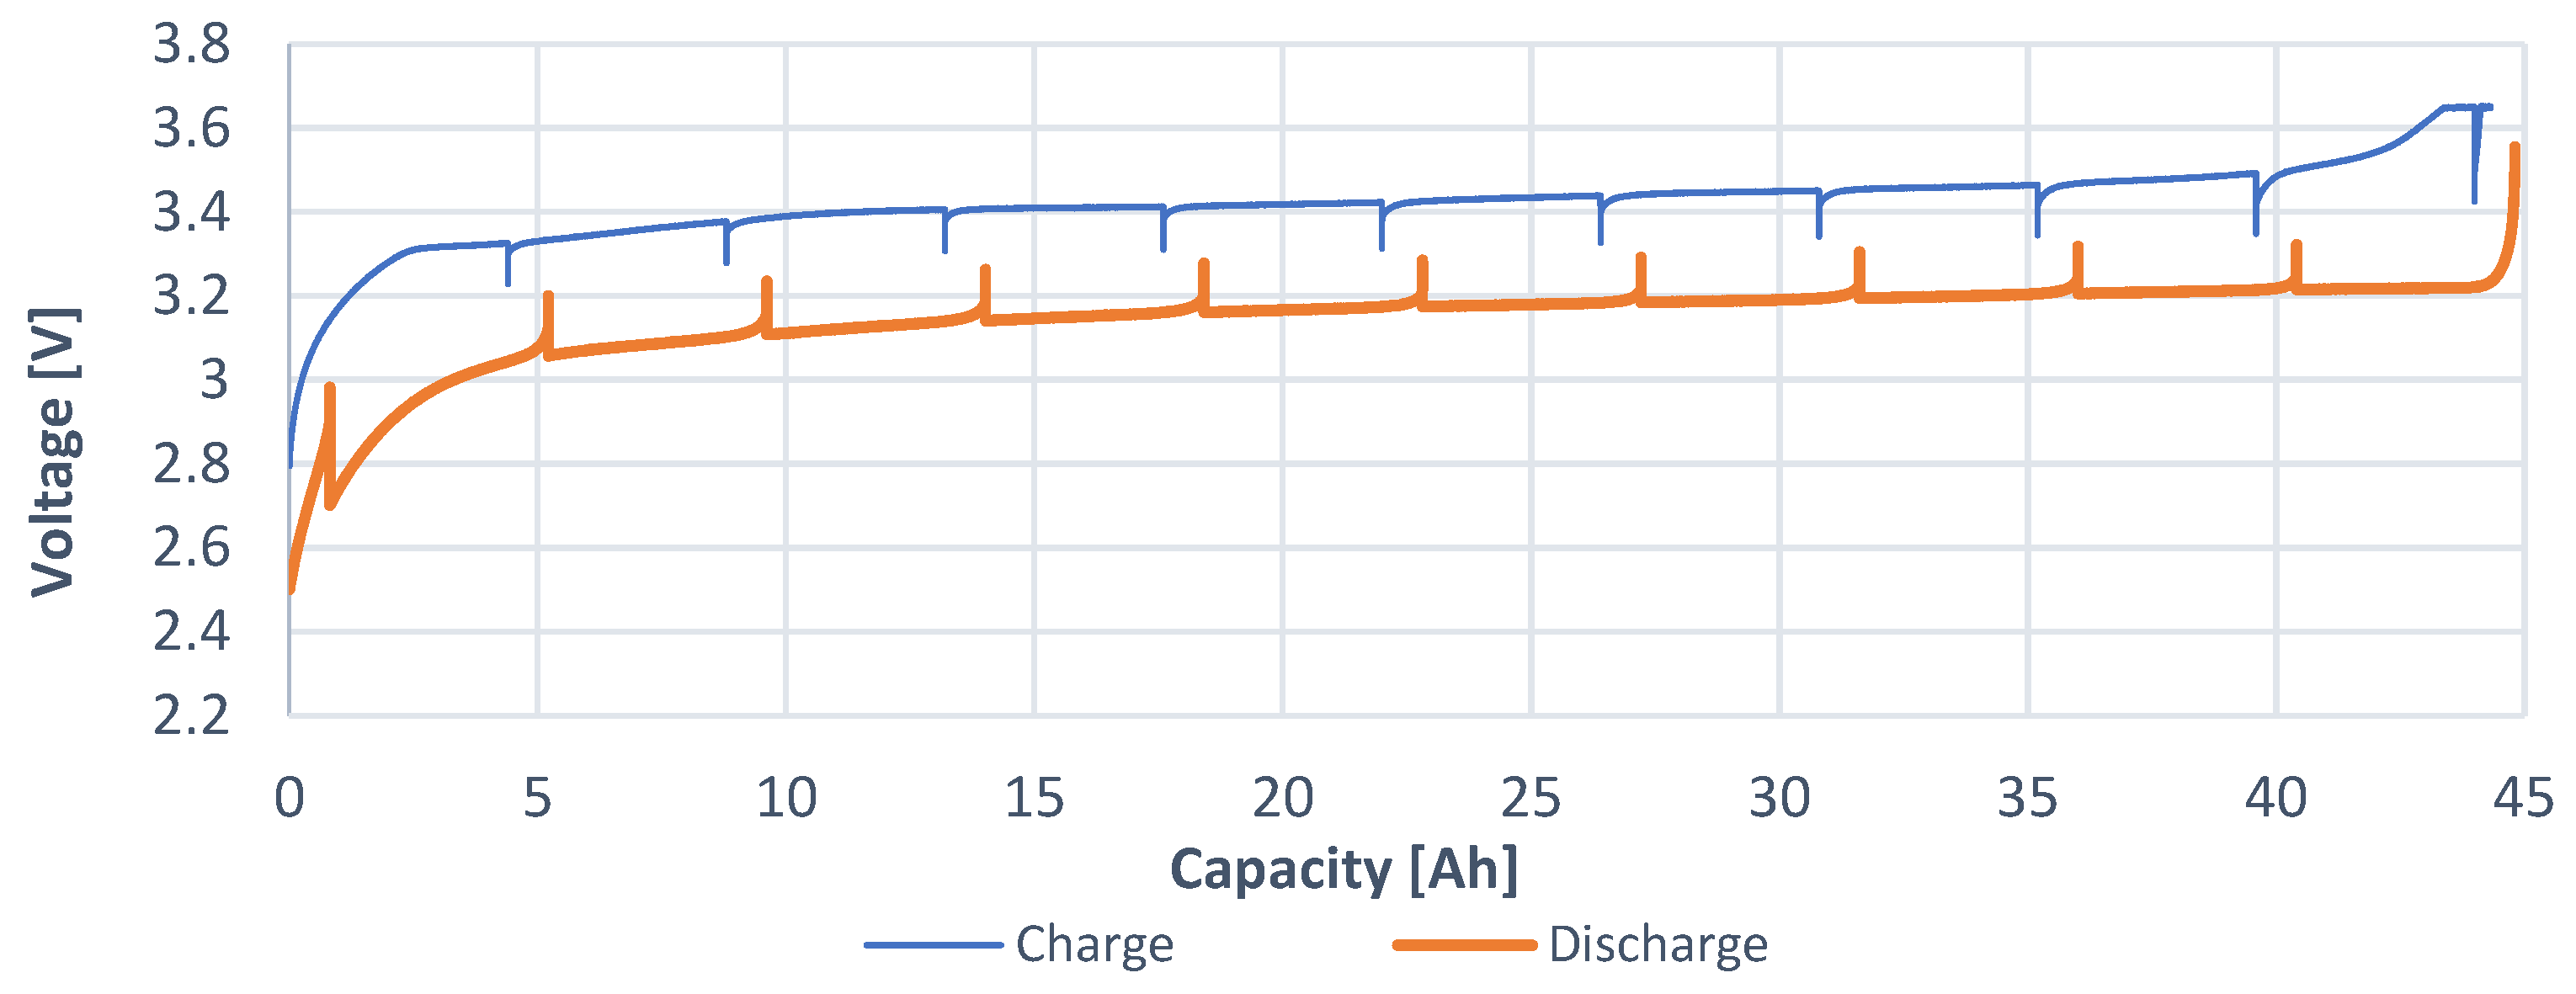
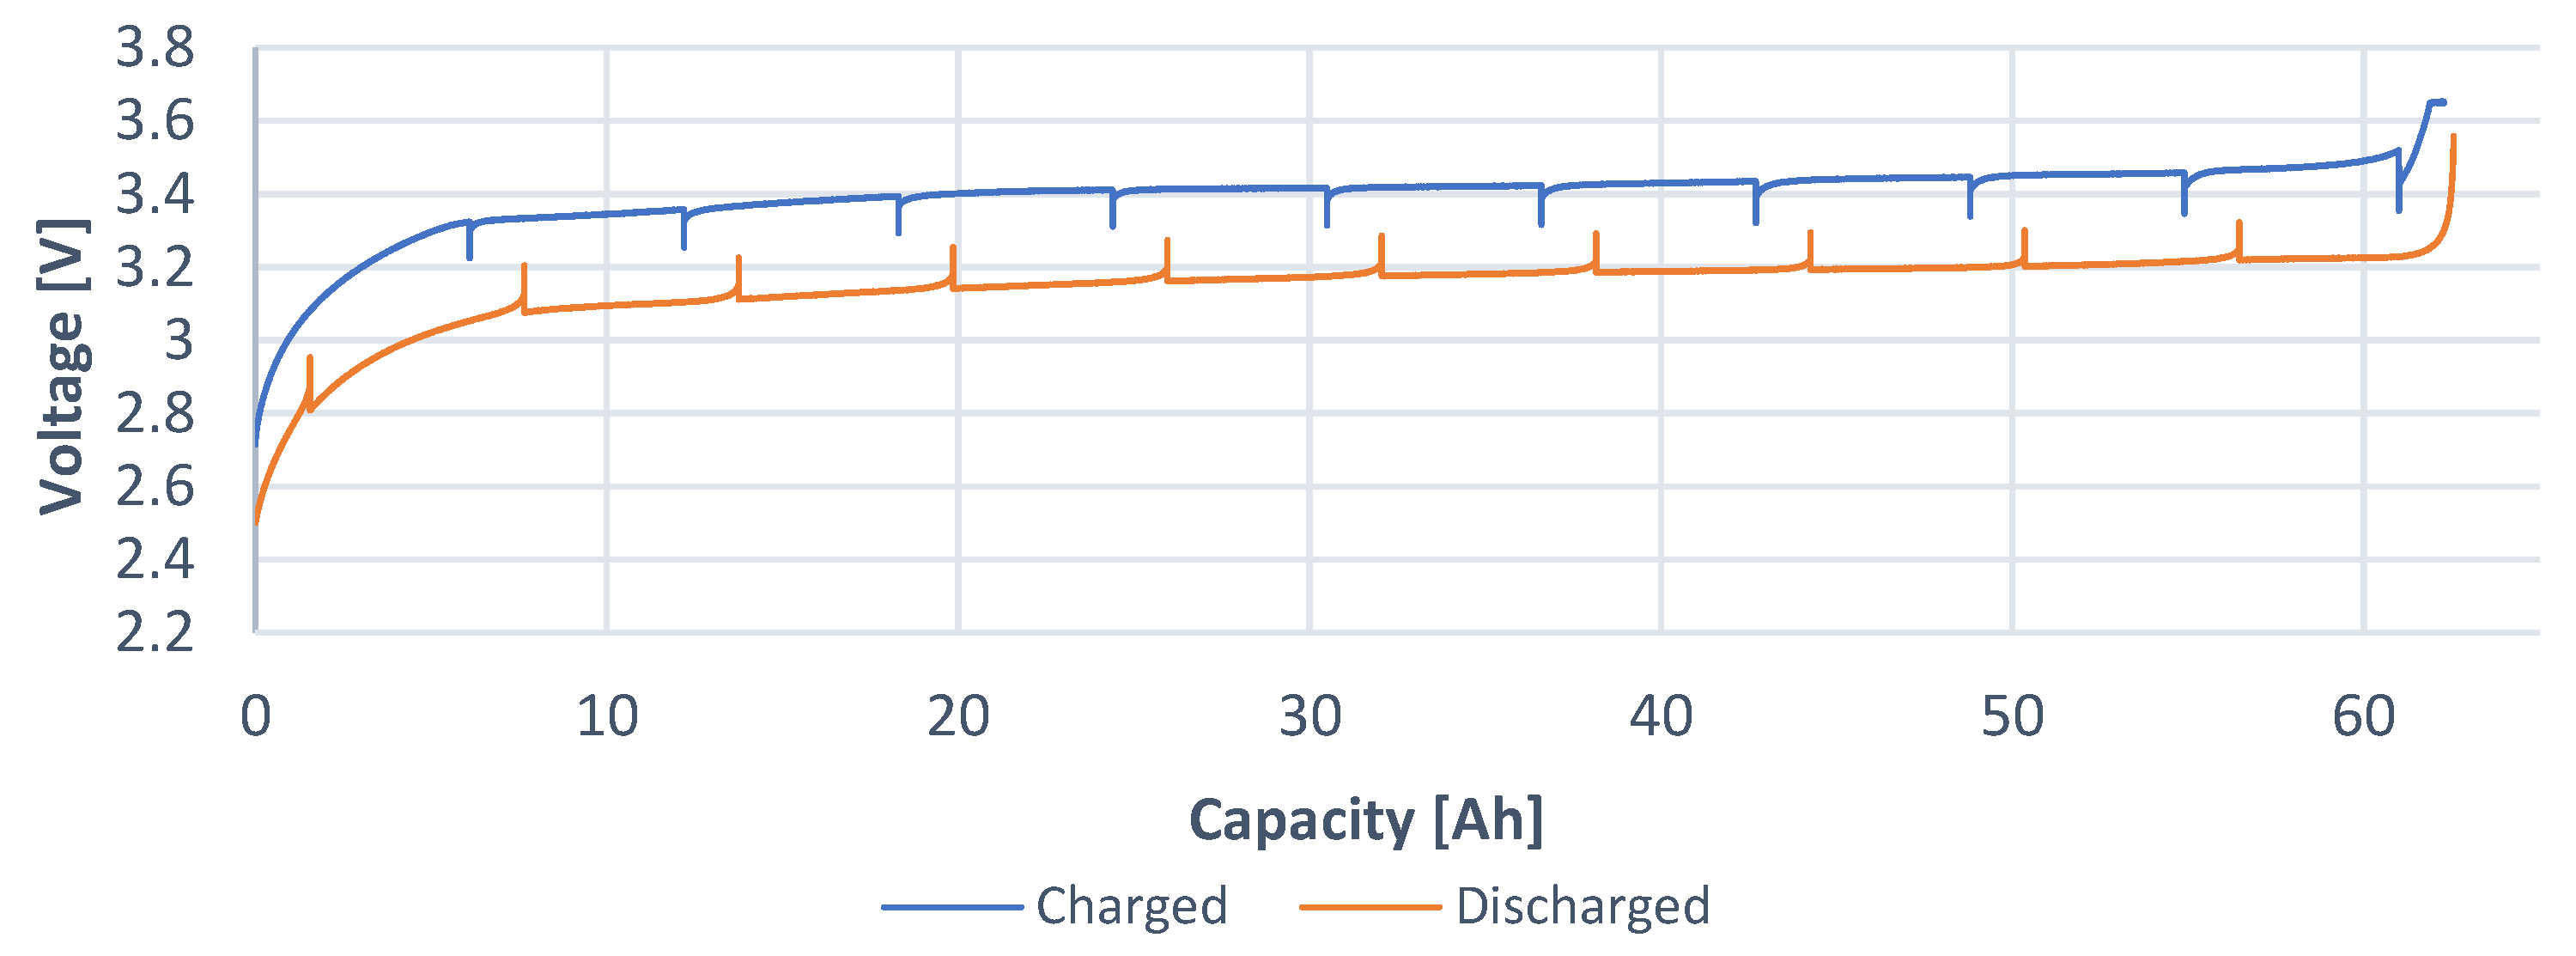
The capacity characteristic was constructed for a better approximation of the recovered voltages. This characteristic consists of two waveforms: charging progress (blue) and discharging progress (orange). This characteristic represents a waveform in the range from 0% to 100% of the SOC of a given cell. Therefore, the charging characteristic goes from left to right, and the discharging characteristic goes from right to left. The capacity of 0 Ah represents 0% SOC, and the end of the characteristic represents 100% SOC.
The time characteristic was created for the analysis of individual relaxation periods, as these are necessary for identification of the parameters of EECM. The analysis of these elements is shown in more detail in the article below. From these characteristics, it is seen that the end times of charging and discharging parts are not the same. As a result, the cell is charged in the CC (current control) mode. When the cell reaches the maximum set current value, the current must naturally decrease. As a result, charging takes a little longer than discharging. The current value is still constant throughout the discharge profile. This is up to the value of the limit voltage (the value of the deep discharge of the cell) at which the discharge is terminated.
4.1. LFP040AHA
The capacity characteristic (
Figure 6) shows how much Ah can be sourced and need to be sunk for full charge of the battery:
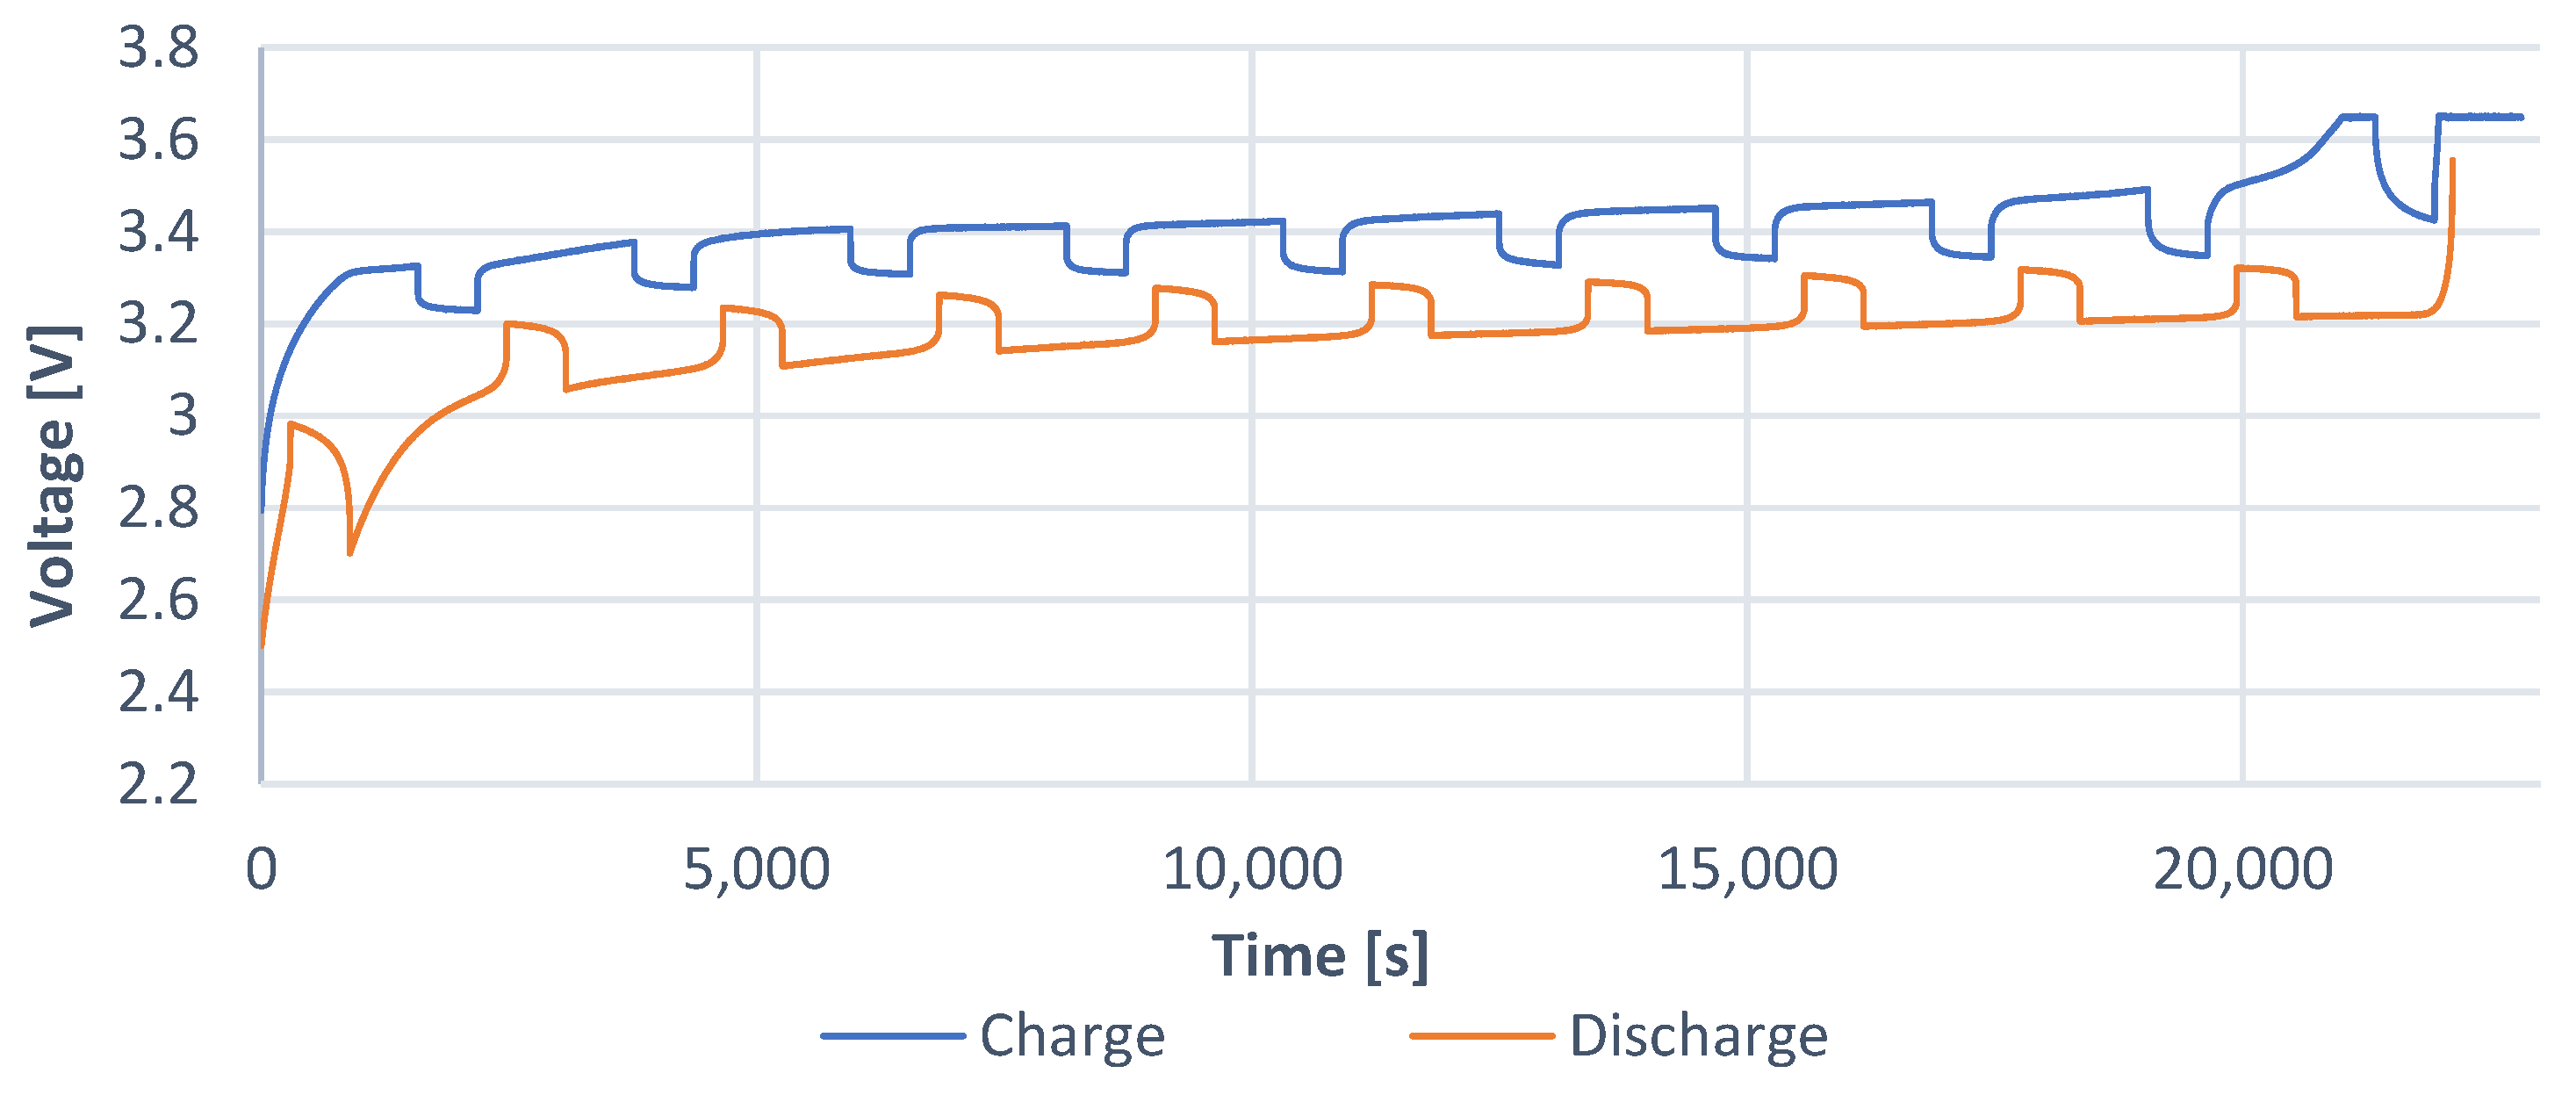
The time characteristic (
Figure 7) shows how long charging or discharging process lasts.
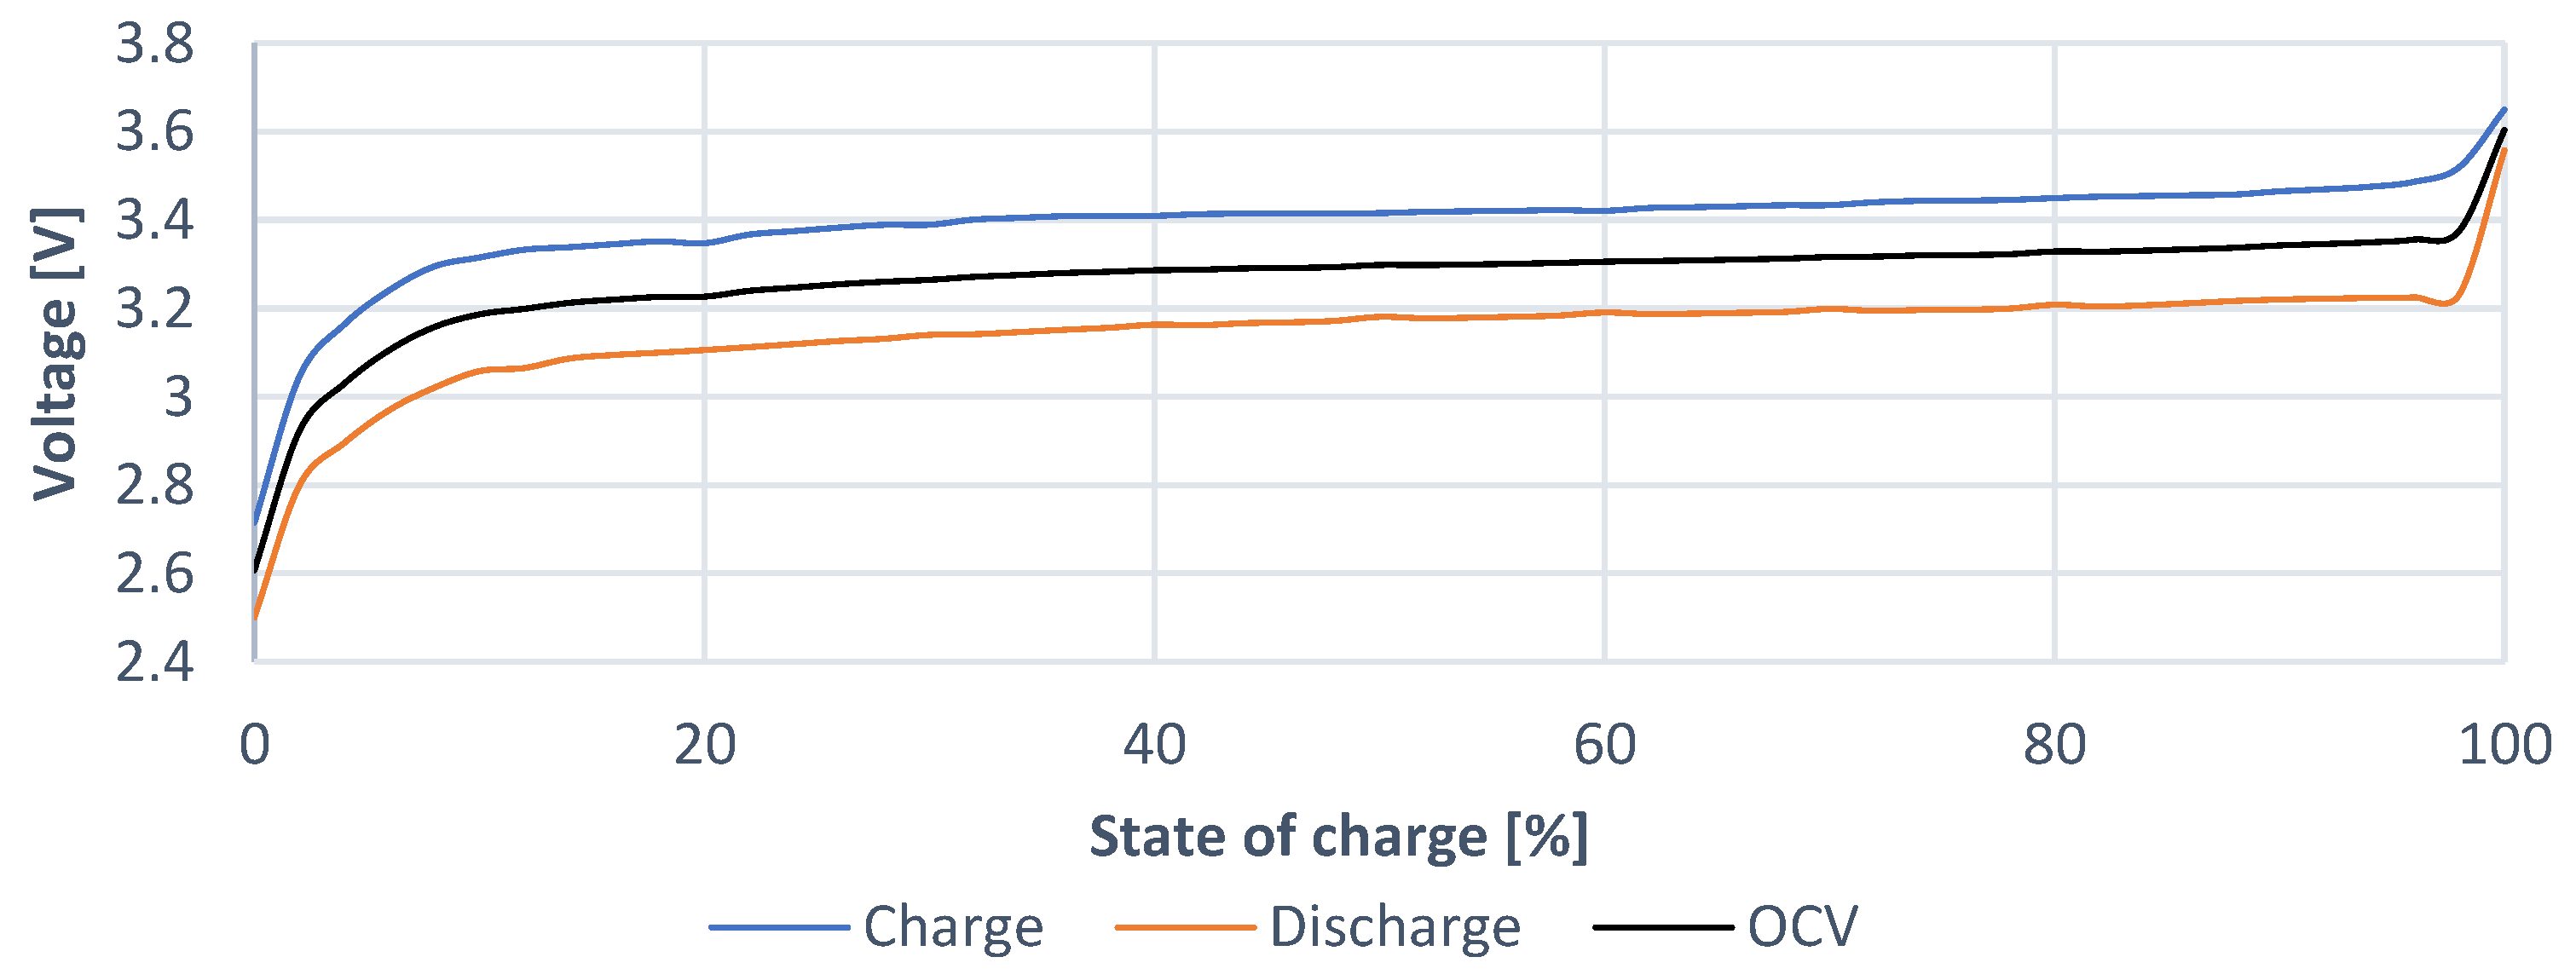
The
OCV characteristic of cell (
Figure 8) represents the voltage dependency of the cell voltage without the influence of its internal resistance. This voltage represents a DC source regarding the equivalent electrical circuit model.
4.2. NPB 60 AH
As for the case of previous cell,
Figure 9 represents the capacity characteristic of the second evaluated cell, i.e., it defines how much Ah can be sourced and need to be sunk for full charge of the battery:
The time characteristic (
Figure 10) shows how long the charging or discharging process lasts.
The
OCV characteristic (
Figure 11) represents the waveform of the cell voltage in the range from 0% to 100%. A higher order polynomial from this characteristic is also used within the design of EECM to represent this waveform. If compared to the waveform of previous cell, it is clear that the waveform of charging voltage characteristic and the waveform of discharging voltage characteristic is narrower. It is then clear that the internal resistance of this cell is smaller. This is further confirmed within next analyses.
4.3. Definition of the Values of Equivalent Electrical Schematic Model
The procedure of the identification of component values of the equivalent circuit schematic was addressed, as described above in paragraph II.B. Identification is closely related to analysis of the voltage waveforms during relaxation periods. From the first period, the first value is found, which is relevant for 0% to 10% of SOC. The analysis follows, until the last relaxation period is reached, which represents a value ranging for 90% to 100% of SOC. From these analyzes, the dependency of the values of RS, R1, R2, C1, and C2 on the SOC are obtained.
4.3.1. LFP040AHA
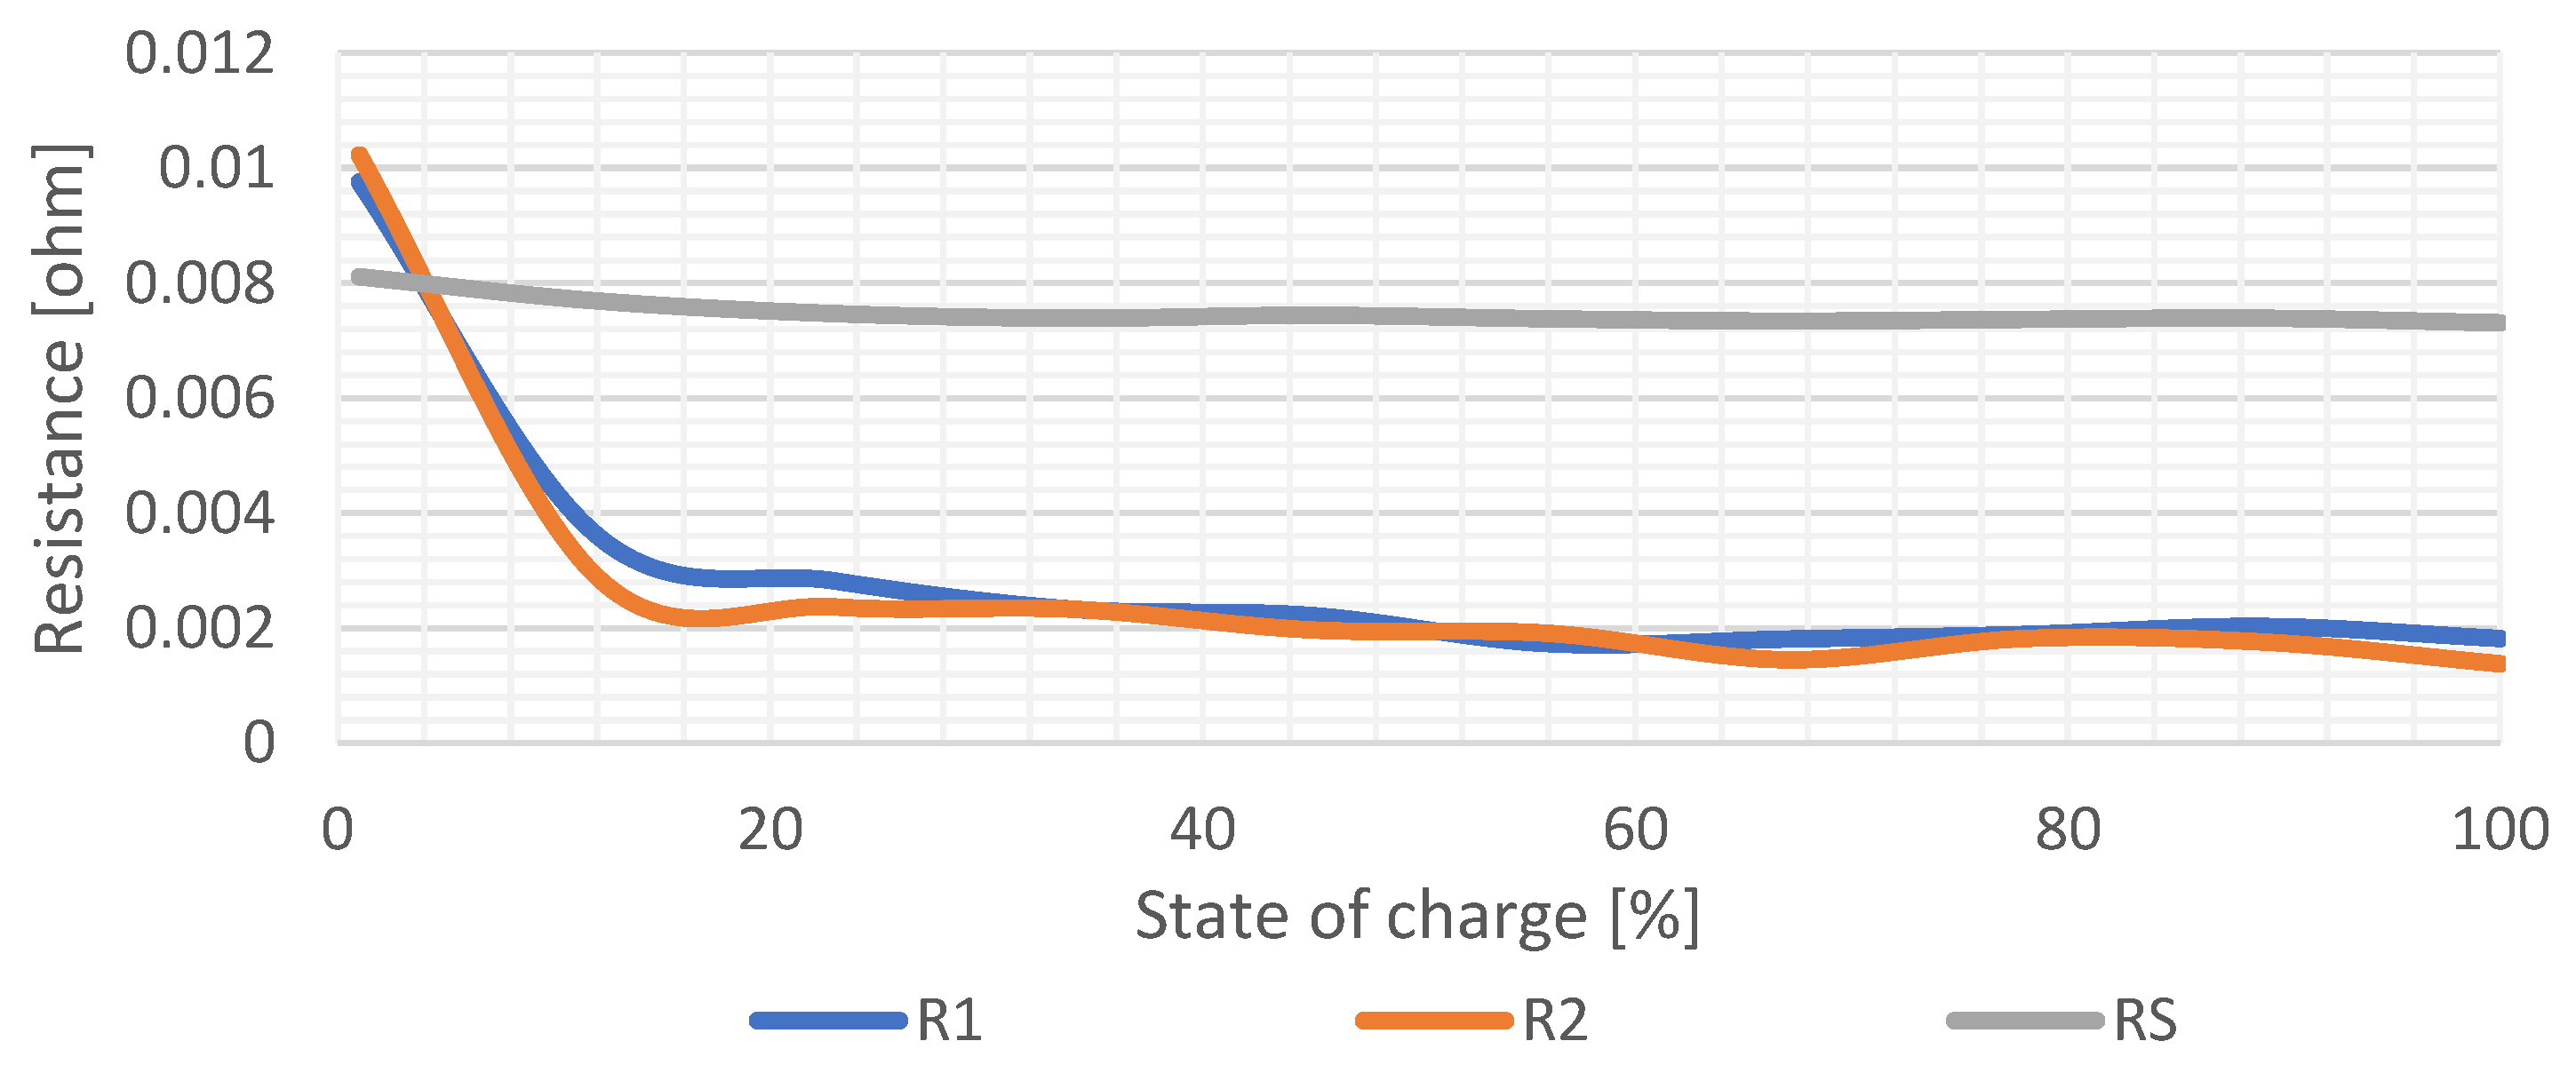
Figure 12 shows graphical dependency of the values of resistances on
SOC. It is seen that the change of
R1 and
R2 values is much higher compared to the value of
RS, which represents the internal resistance of the cell and is mostly constant within the whole range of
SOC. Specifically, the value of the series’ internal resistance is approximately
RS = 0.007489 Ω. Resistance values of
R1 and
R2 are a result of the relaxation period voltage waveform shape. Therefore, during charging or discharging, the pulse-step is higher in the range from 0% to 10% than within the range from 10% to 100%
SOC.
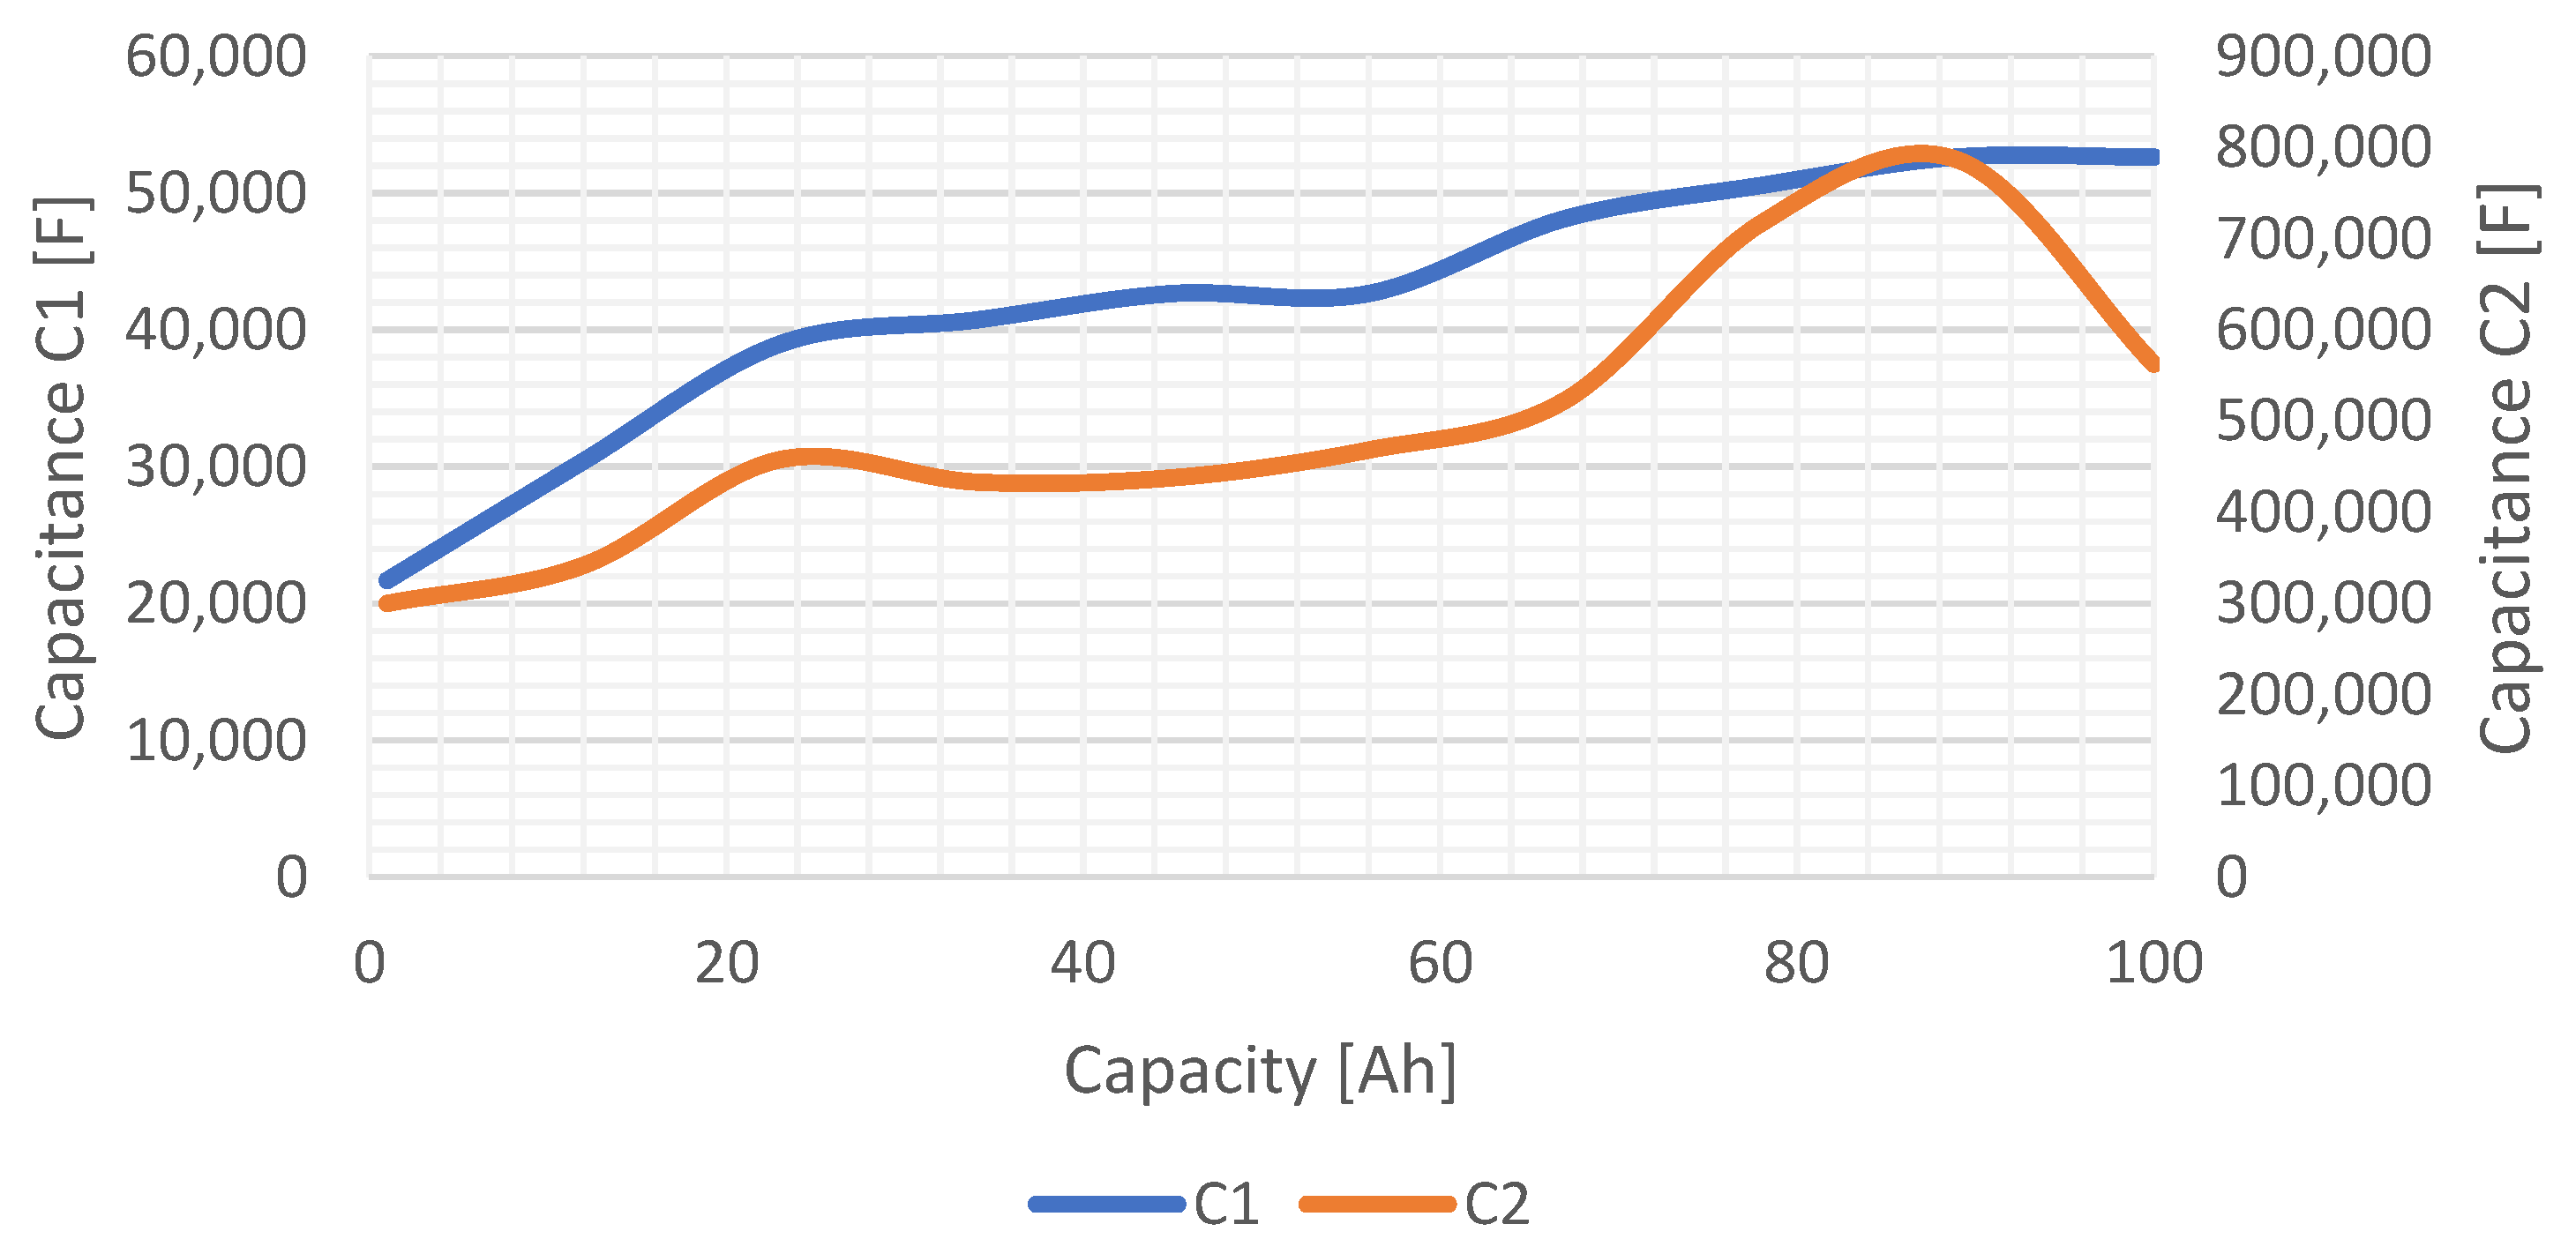
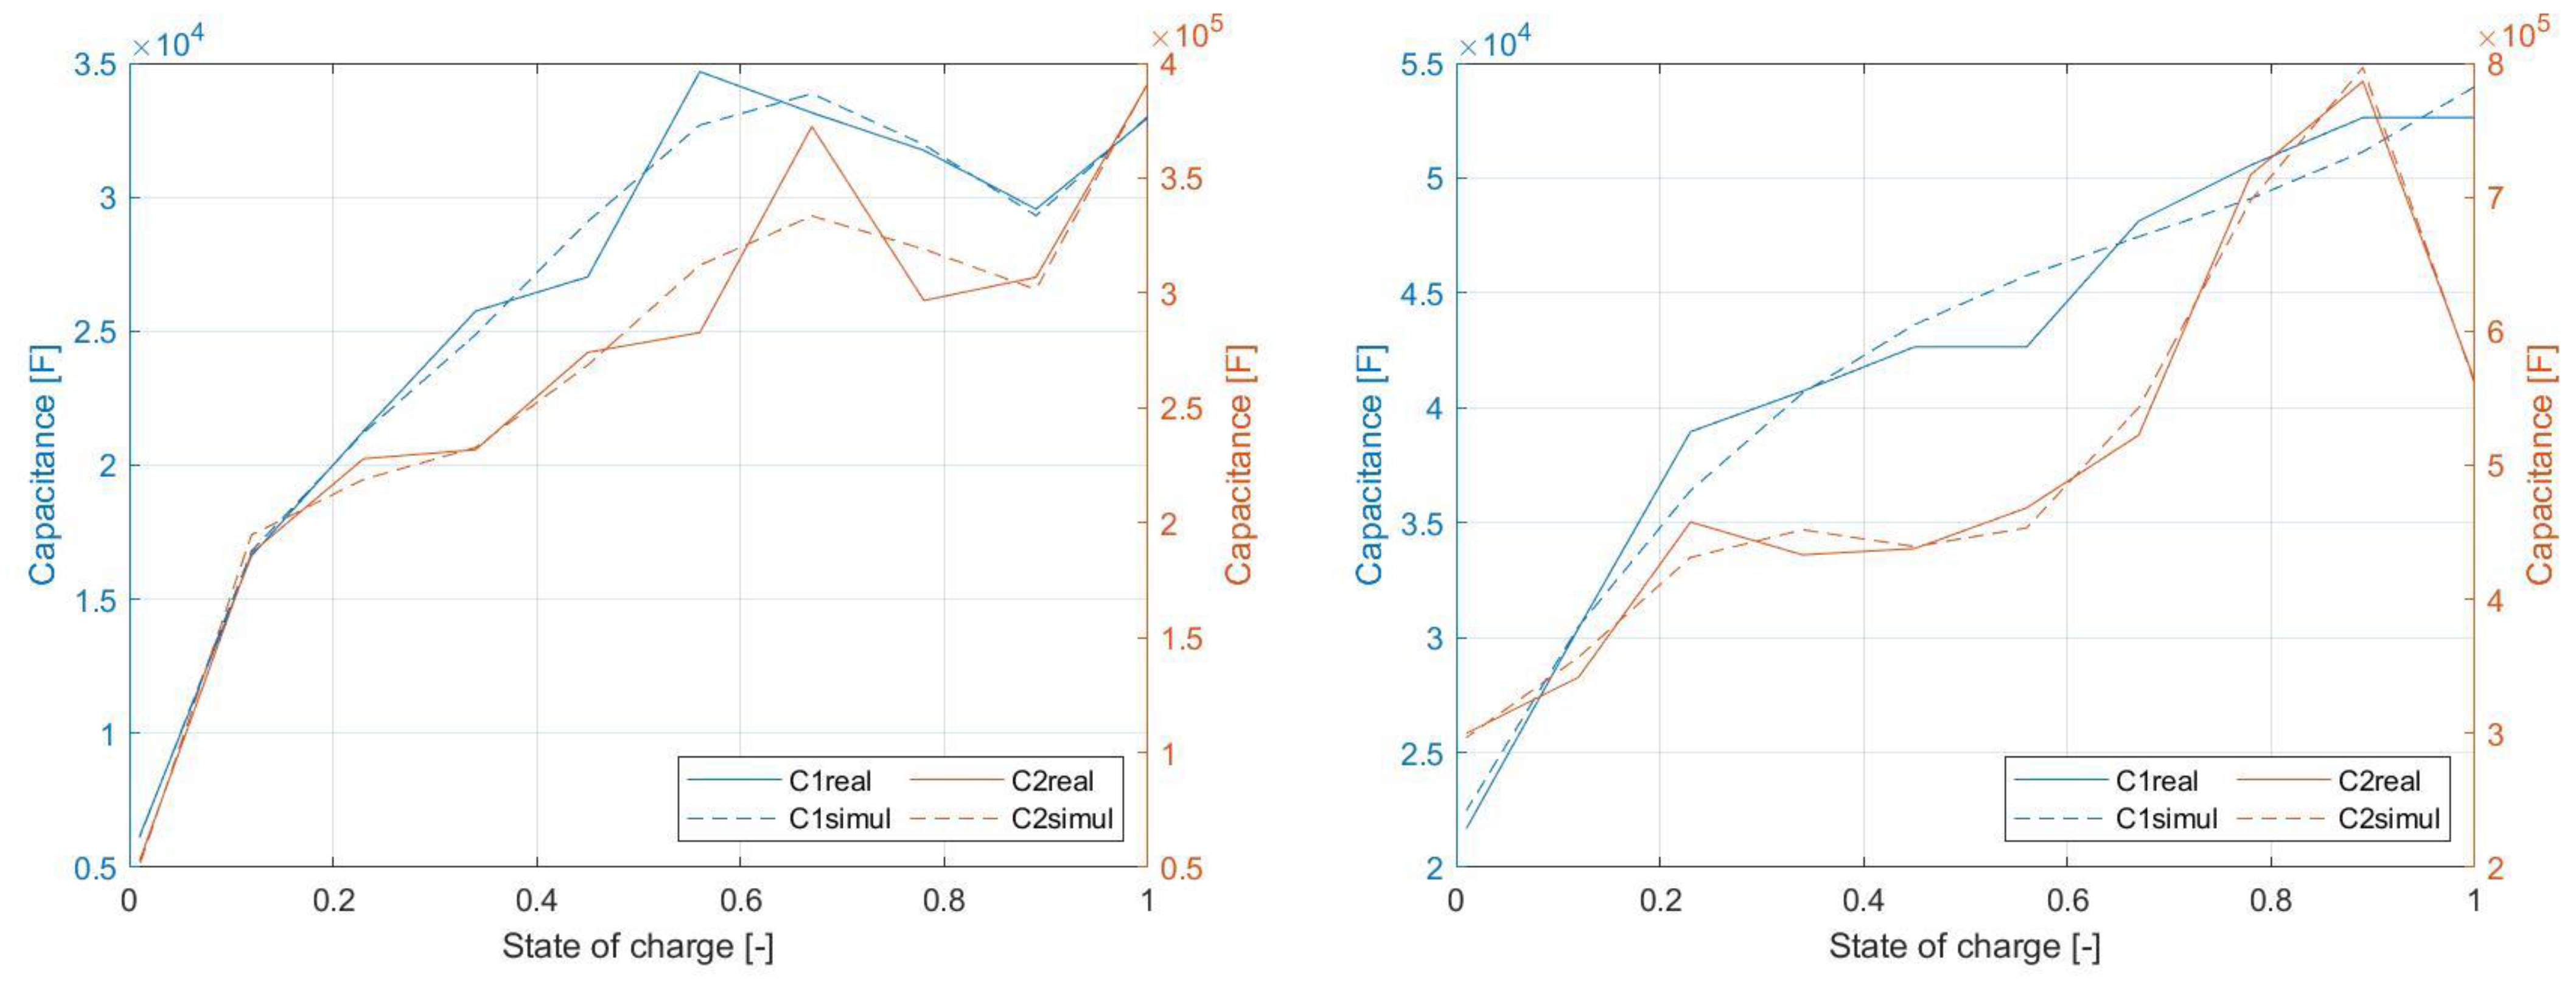
The change of the values of internal capacitive elements within the range from 0% to 100%
SOC is shown in
Figure 13. These capacitive elements are responsible for the relaxation durations of the voltage waveform until the
OCV level is achieved. Dependency of
C1 and
C2 is similar considering shape of the waveform, while
C1 achieves higher values within whole
SOC range.
4.3.2. NPB 60 AH
In the case of the NPB 60 AH cell, it can be said that the value of the internal resistance (
Figure 14) compared to the LFP040AHA cell is about one–half lower. The same situation could be observed for
SOC dependency of
R1 and
R2 values. From these results, it is visible that the resistive components of EECM of this cell have lower dependency on the
SOC.
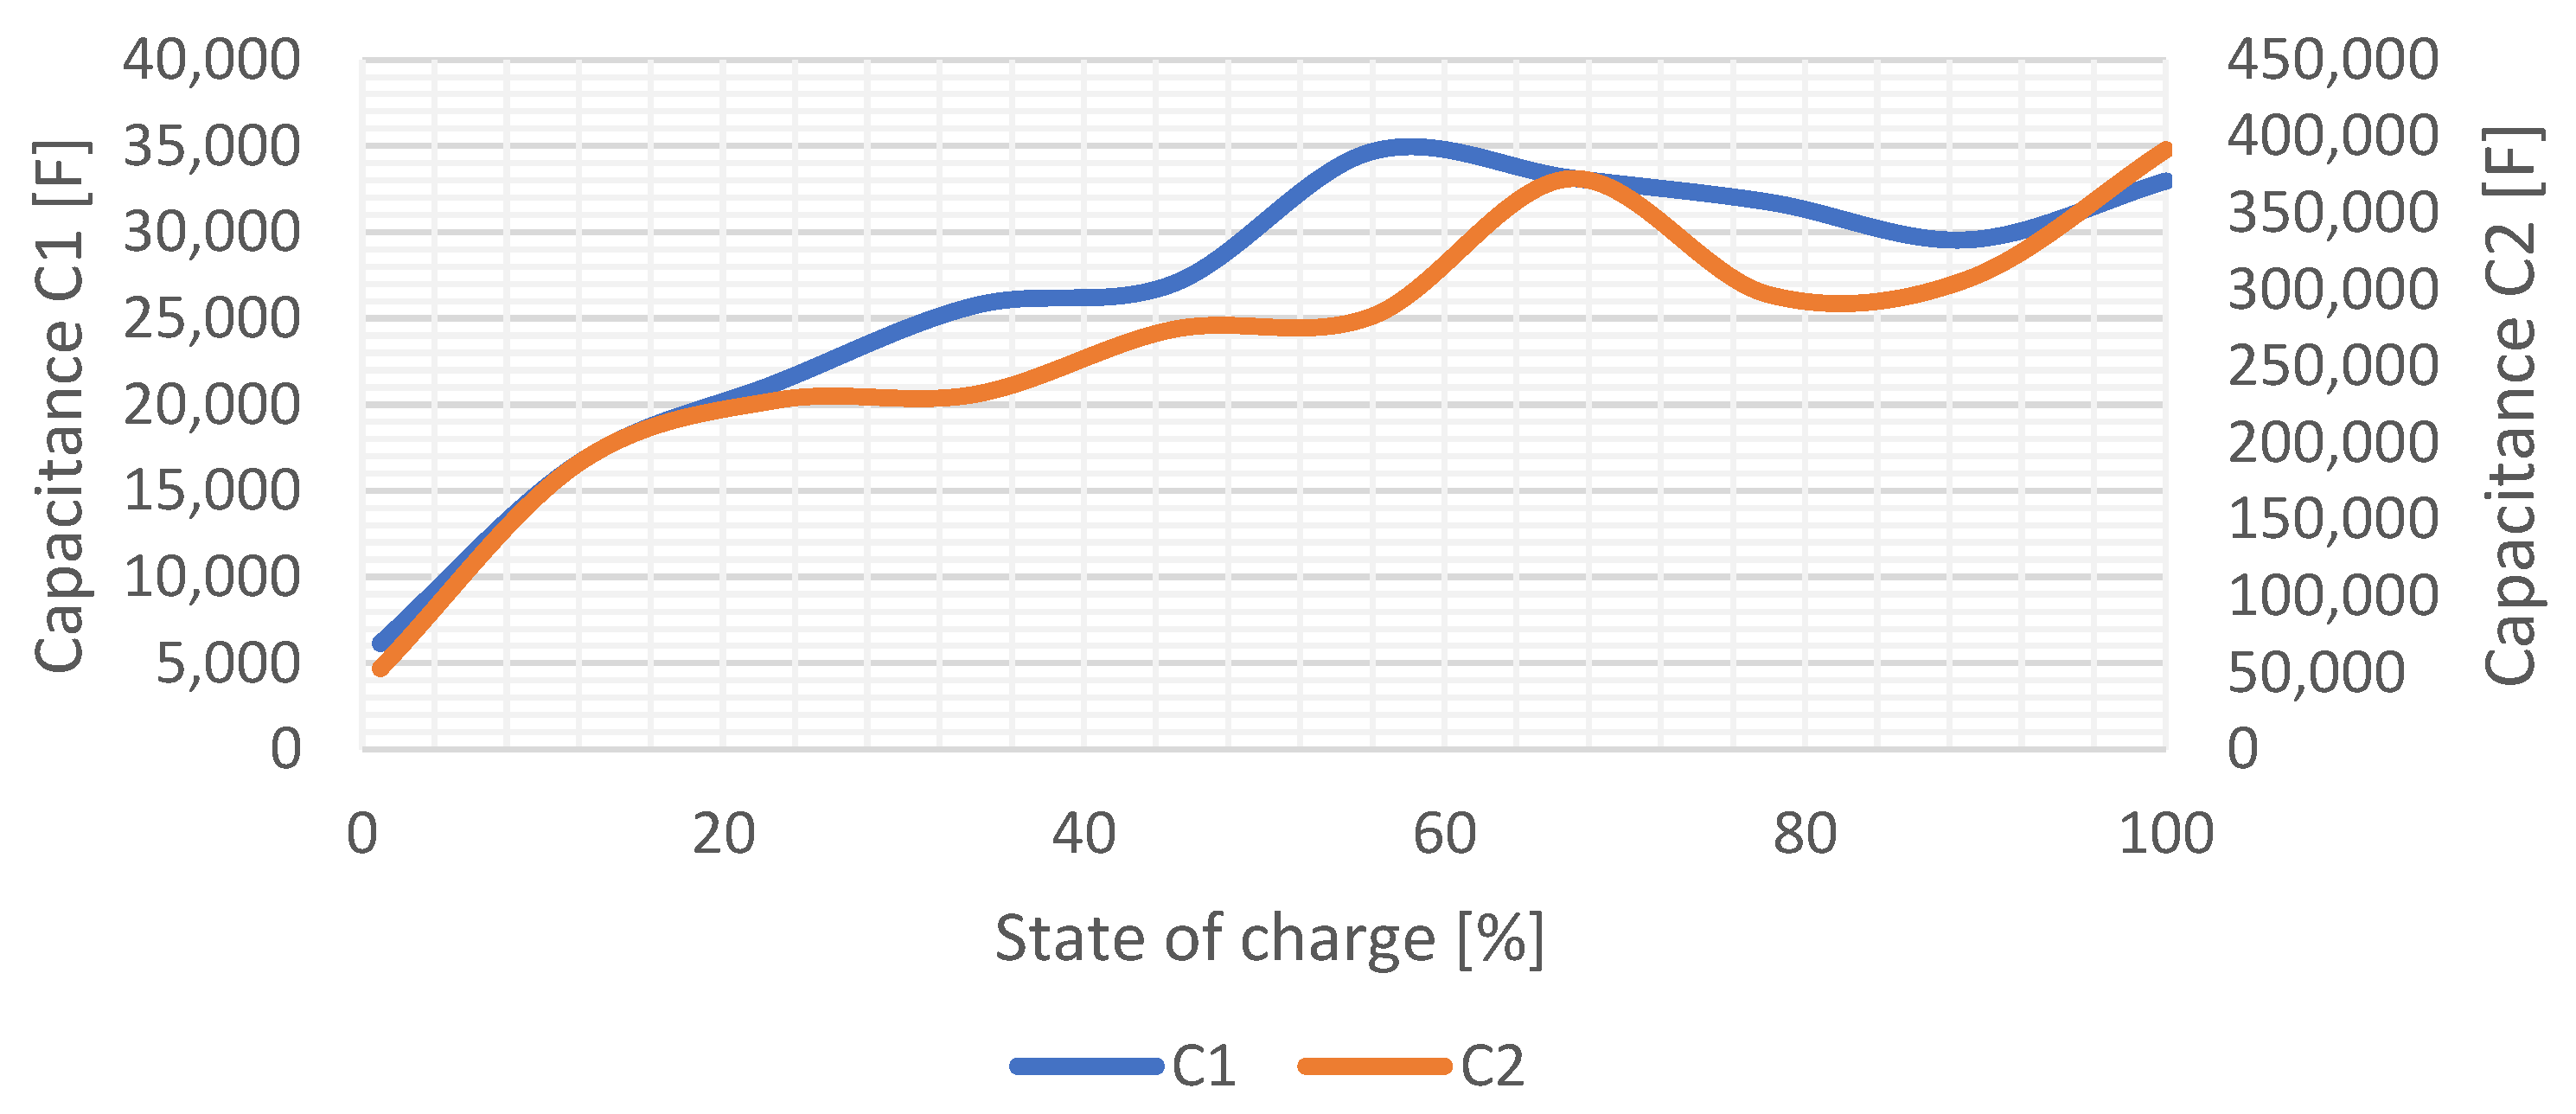
The
SOC dependency of the values of EECM capacitances of the NPB 60 AH cell is shown in
Figure 15. Based on the shape of this characteristic, it can be said that these waveforms are almost linear for a certain part of the
SOC. In the case of element
C1, the characteristic exhibits a linear shape from 21,000 F to 52,000 F, while in the case of
C2, a linear region can be detected from 300,000 F to about 600,000 F.
4.4. Simulation Model of the Investigated EECM of Selected Cells
4.4.1. Simulation Description
The simulation model was developed with the use of PLECS environment. This software is suitable for simulation analyses of high-performance electronic systems. Based on the previous measurements, a values of the EECM have been identified in dependency on
SOC (Equations (10)–(21)) and defined within simulation model (
Figure 16). The simulation model is divided into two basic parts: the power part (electrical) and the computational part. The power part consists of a controlled DC power supply, passive elements
RS,
R1,
R2,
C1, and
C2, and terminals + and −. This part represents the electrical parameters of the cell simulation model. The calculation part consists
SOC calculation of the cell from the current flowing through the cell. From the
SOC value, the values of components of EECM are determined. The
SOC calculation is realized with the use of the Coulomb method (9).
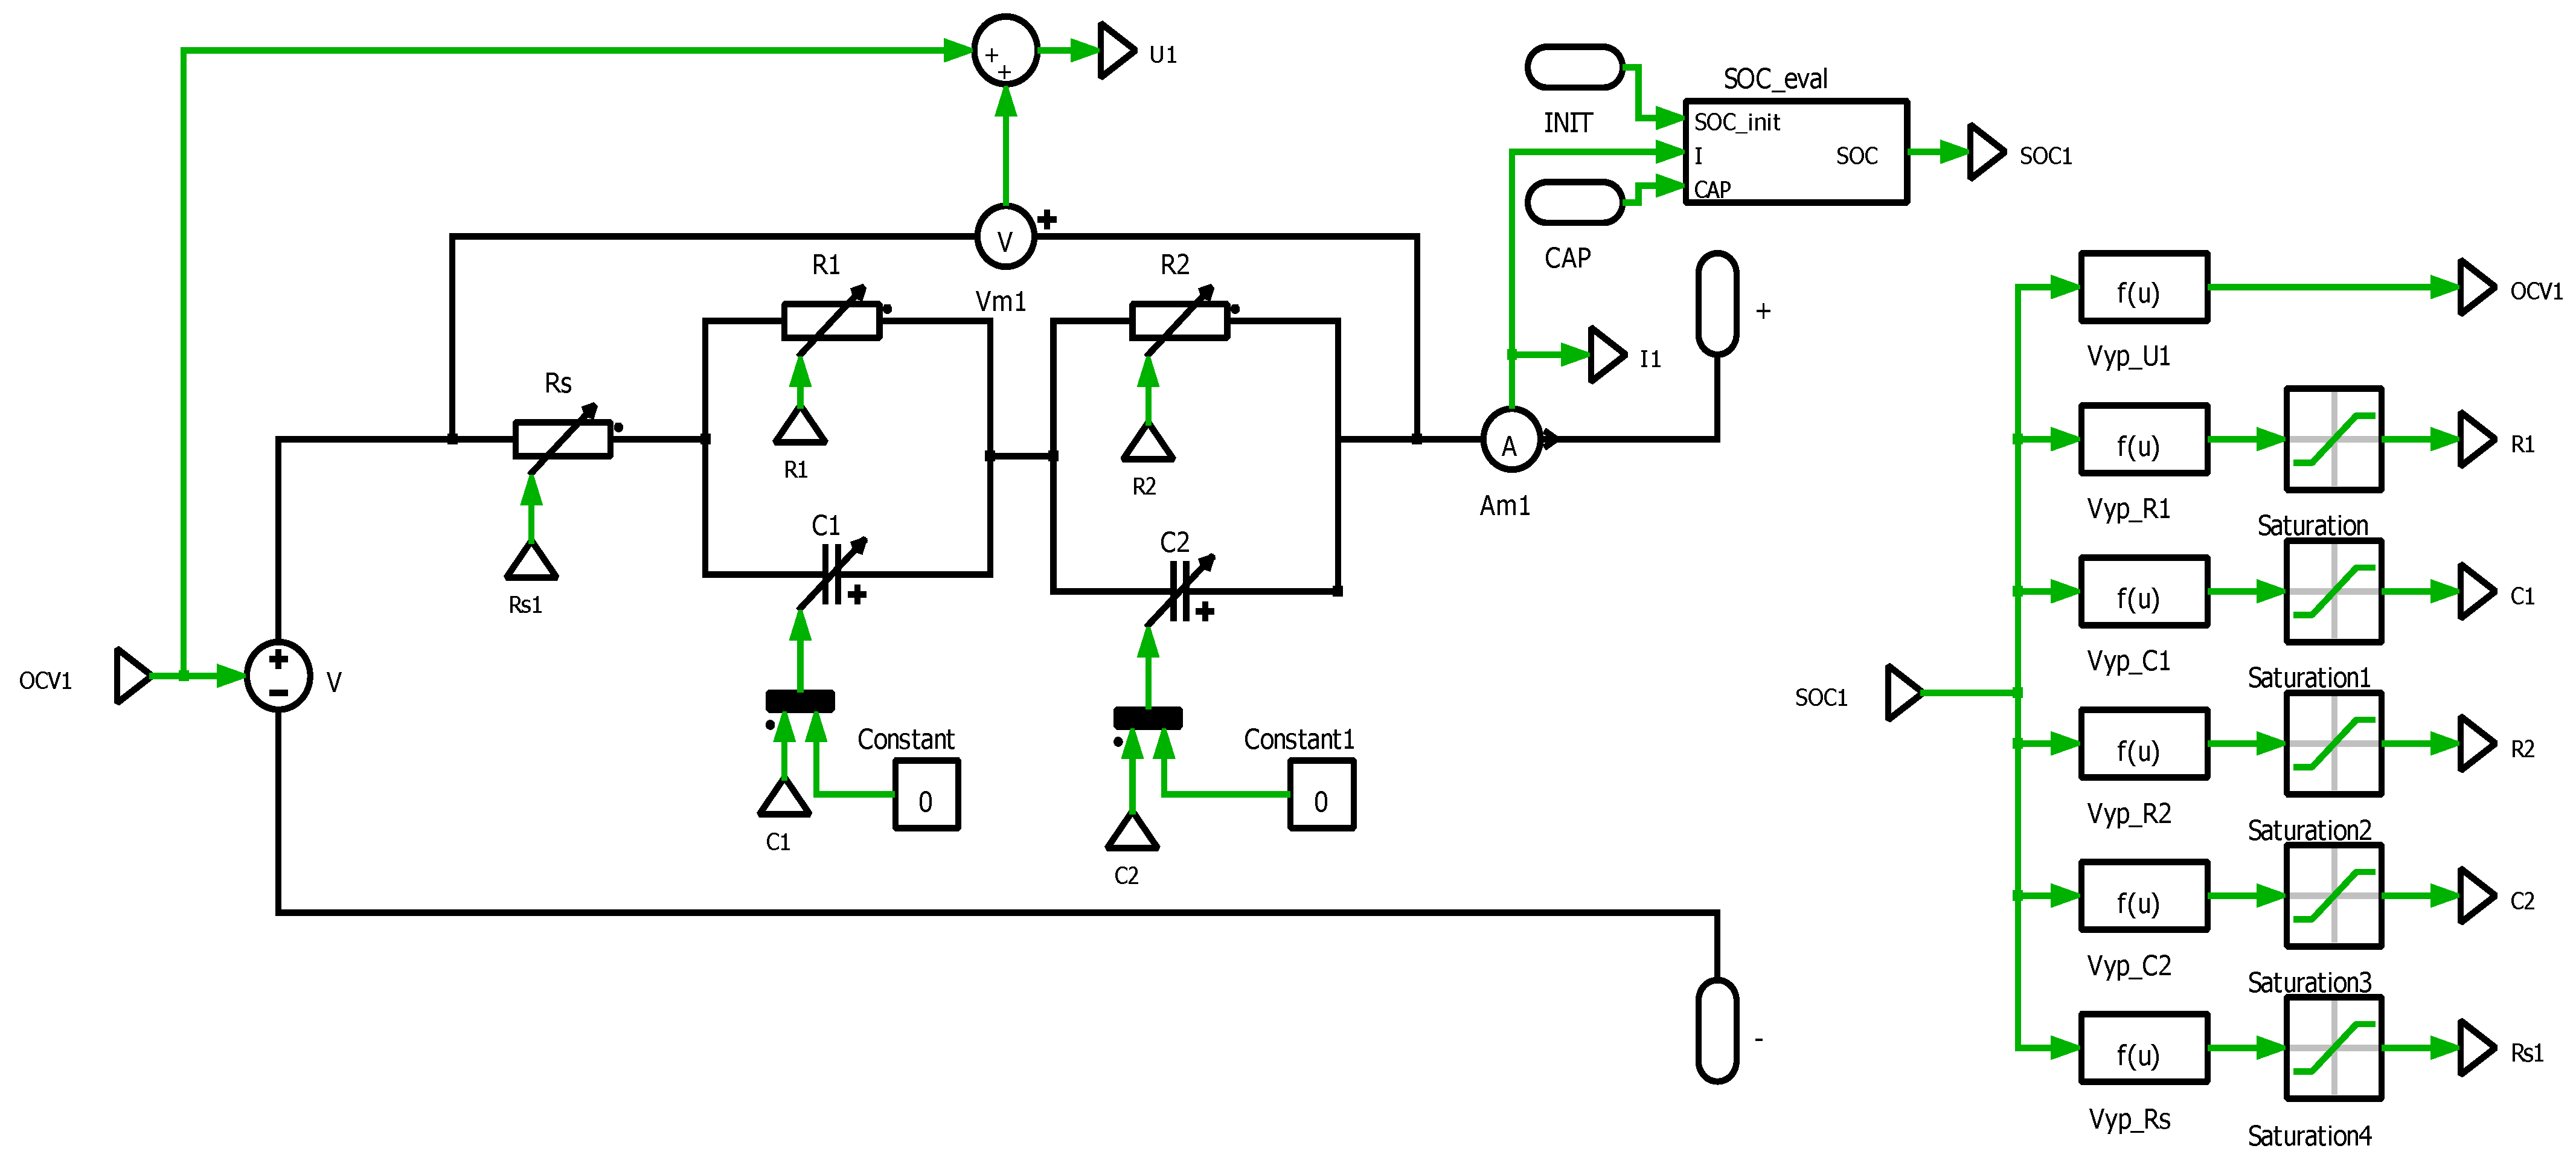
The PLECS environment allows the design of a simple subsystem. This cell subsystem looks like the one shown in
Figure 17. Two control values enter this system. One value represents the battery capacity, and the second the initial state of the charge reflecting the range from 0 to 1. Two terminals + and − come from this subsystem. These terminals represent cell terminals (anode and cathode of battery). By connecting more such cells in series-parallel, it is possible to evaluate more complex energy storage systems, i.e., high-voltage batteries.
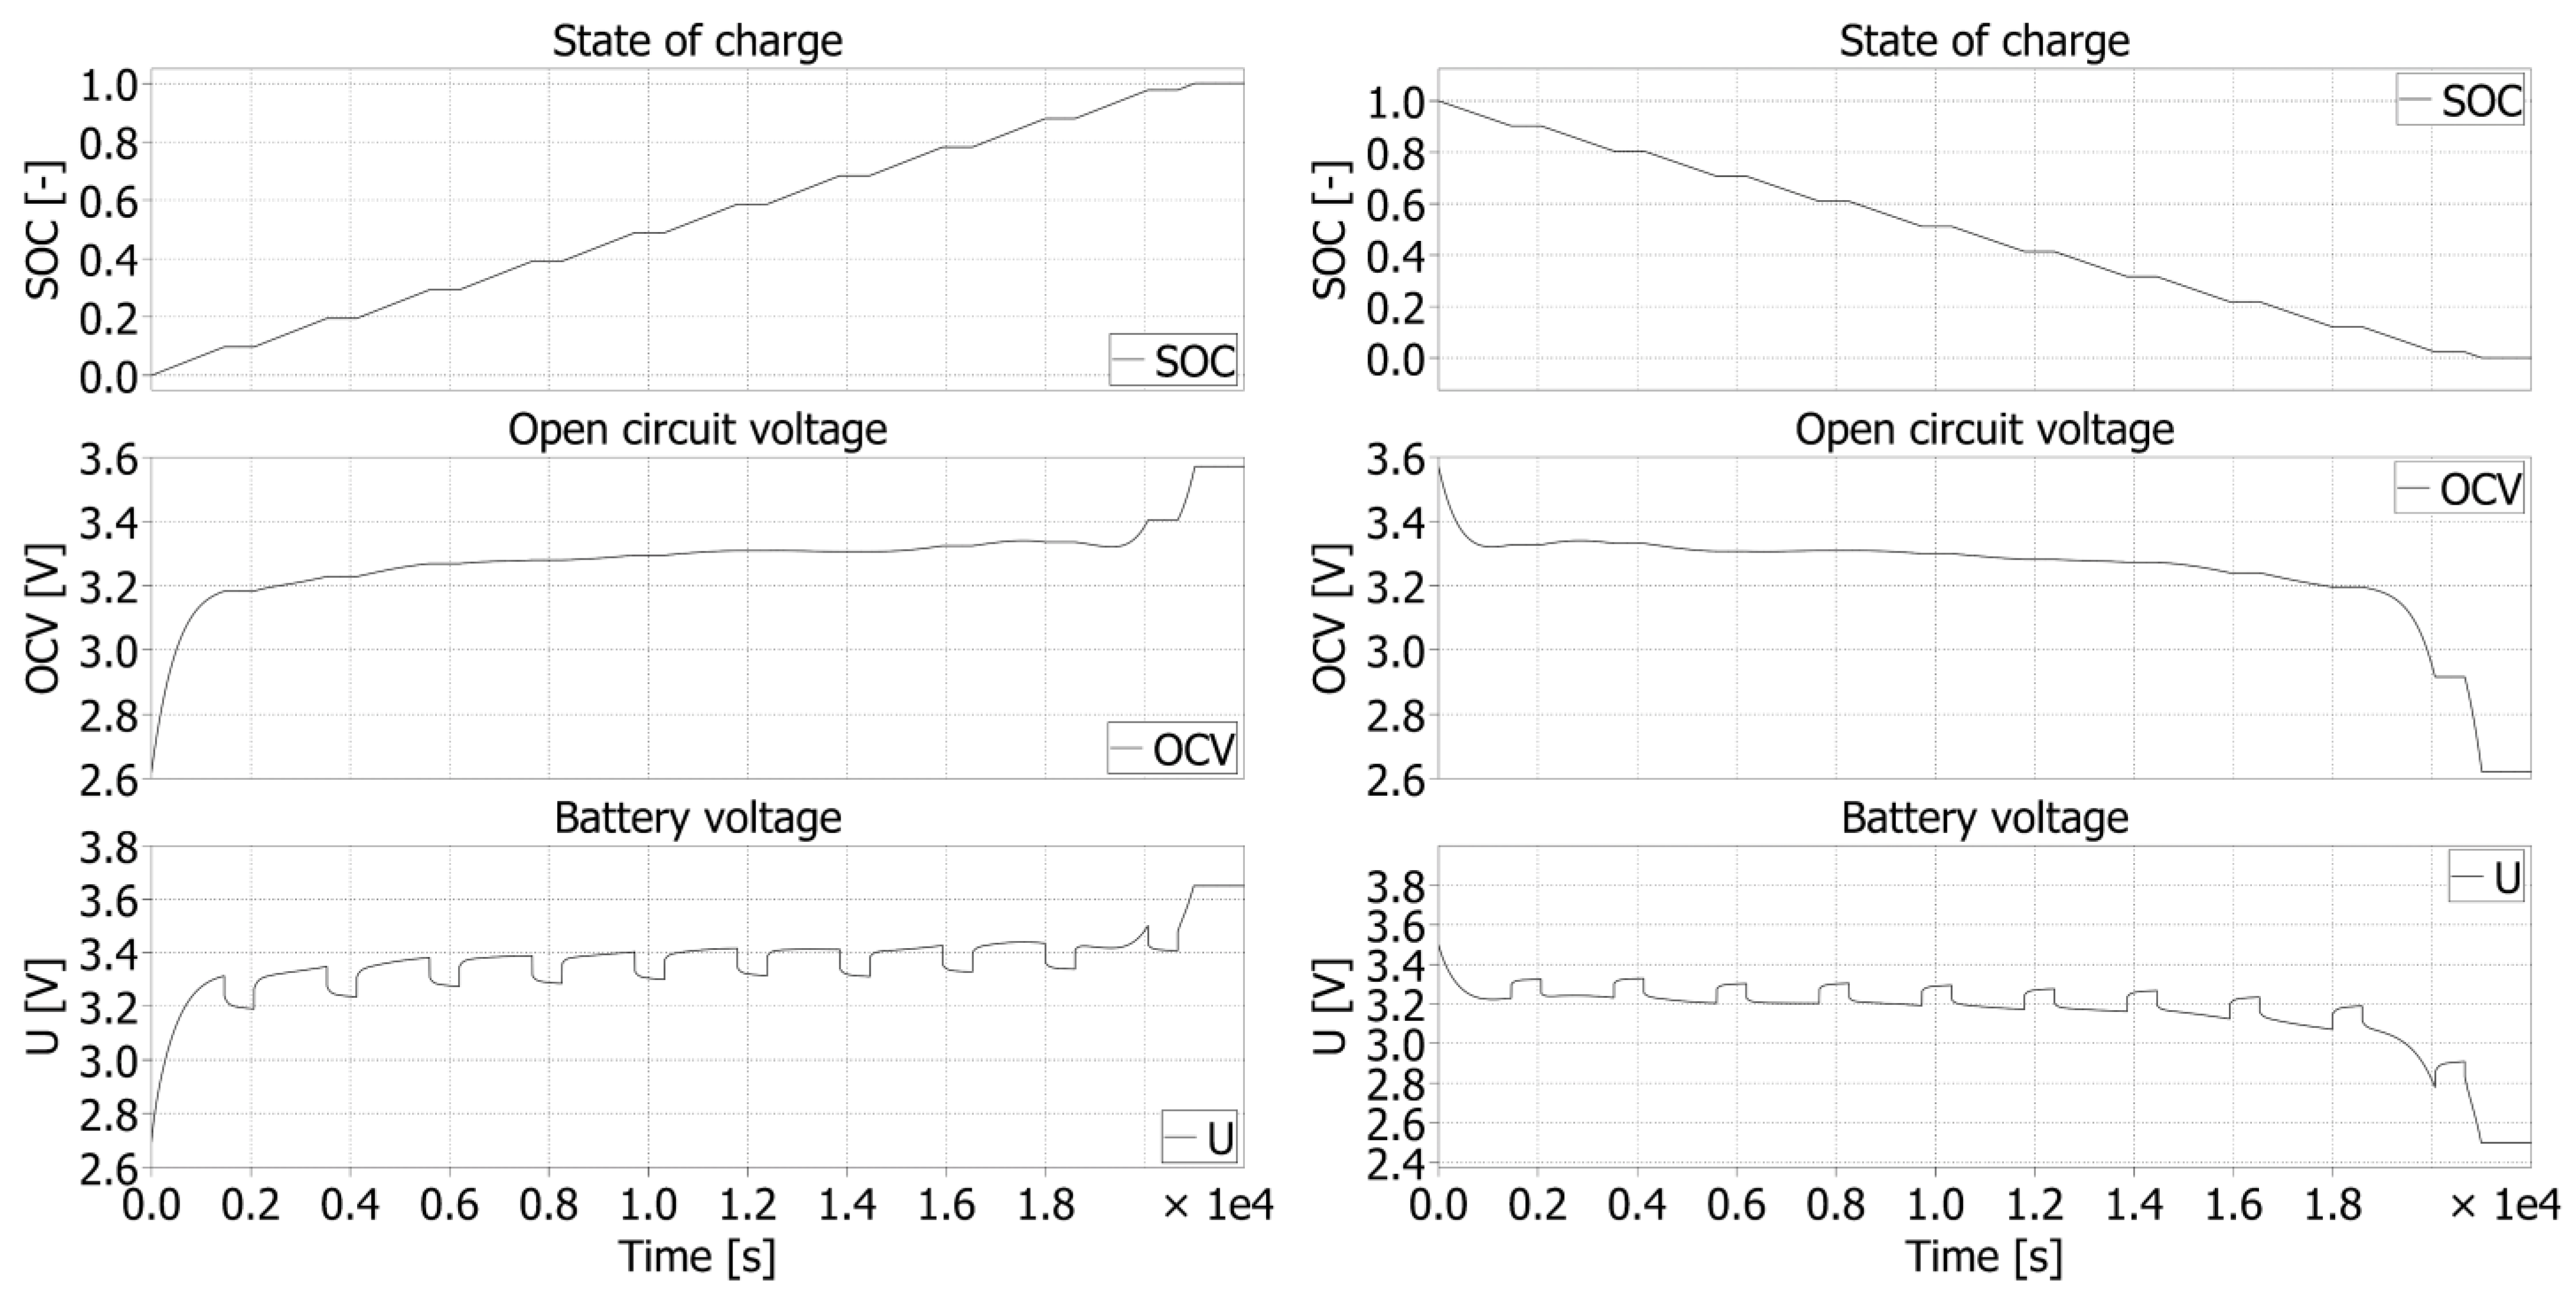
4.4.2. Simulation Results
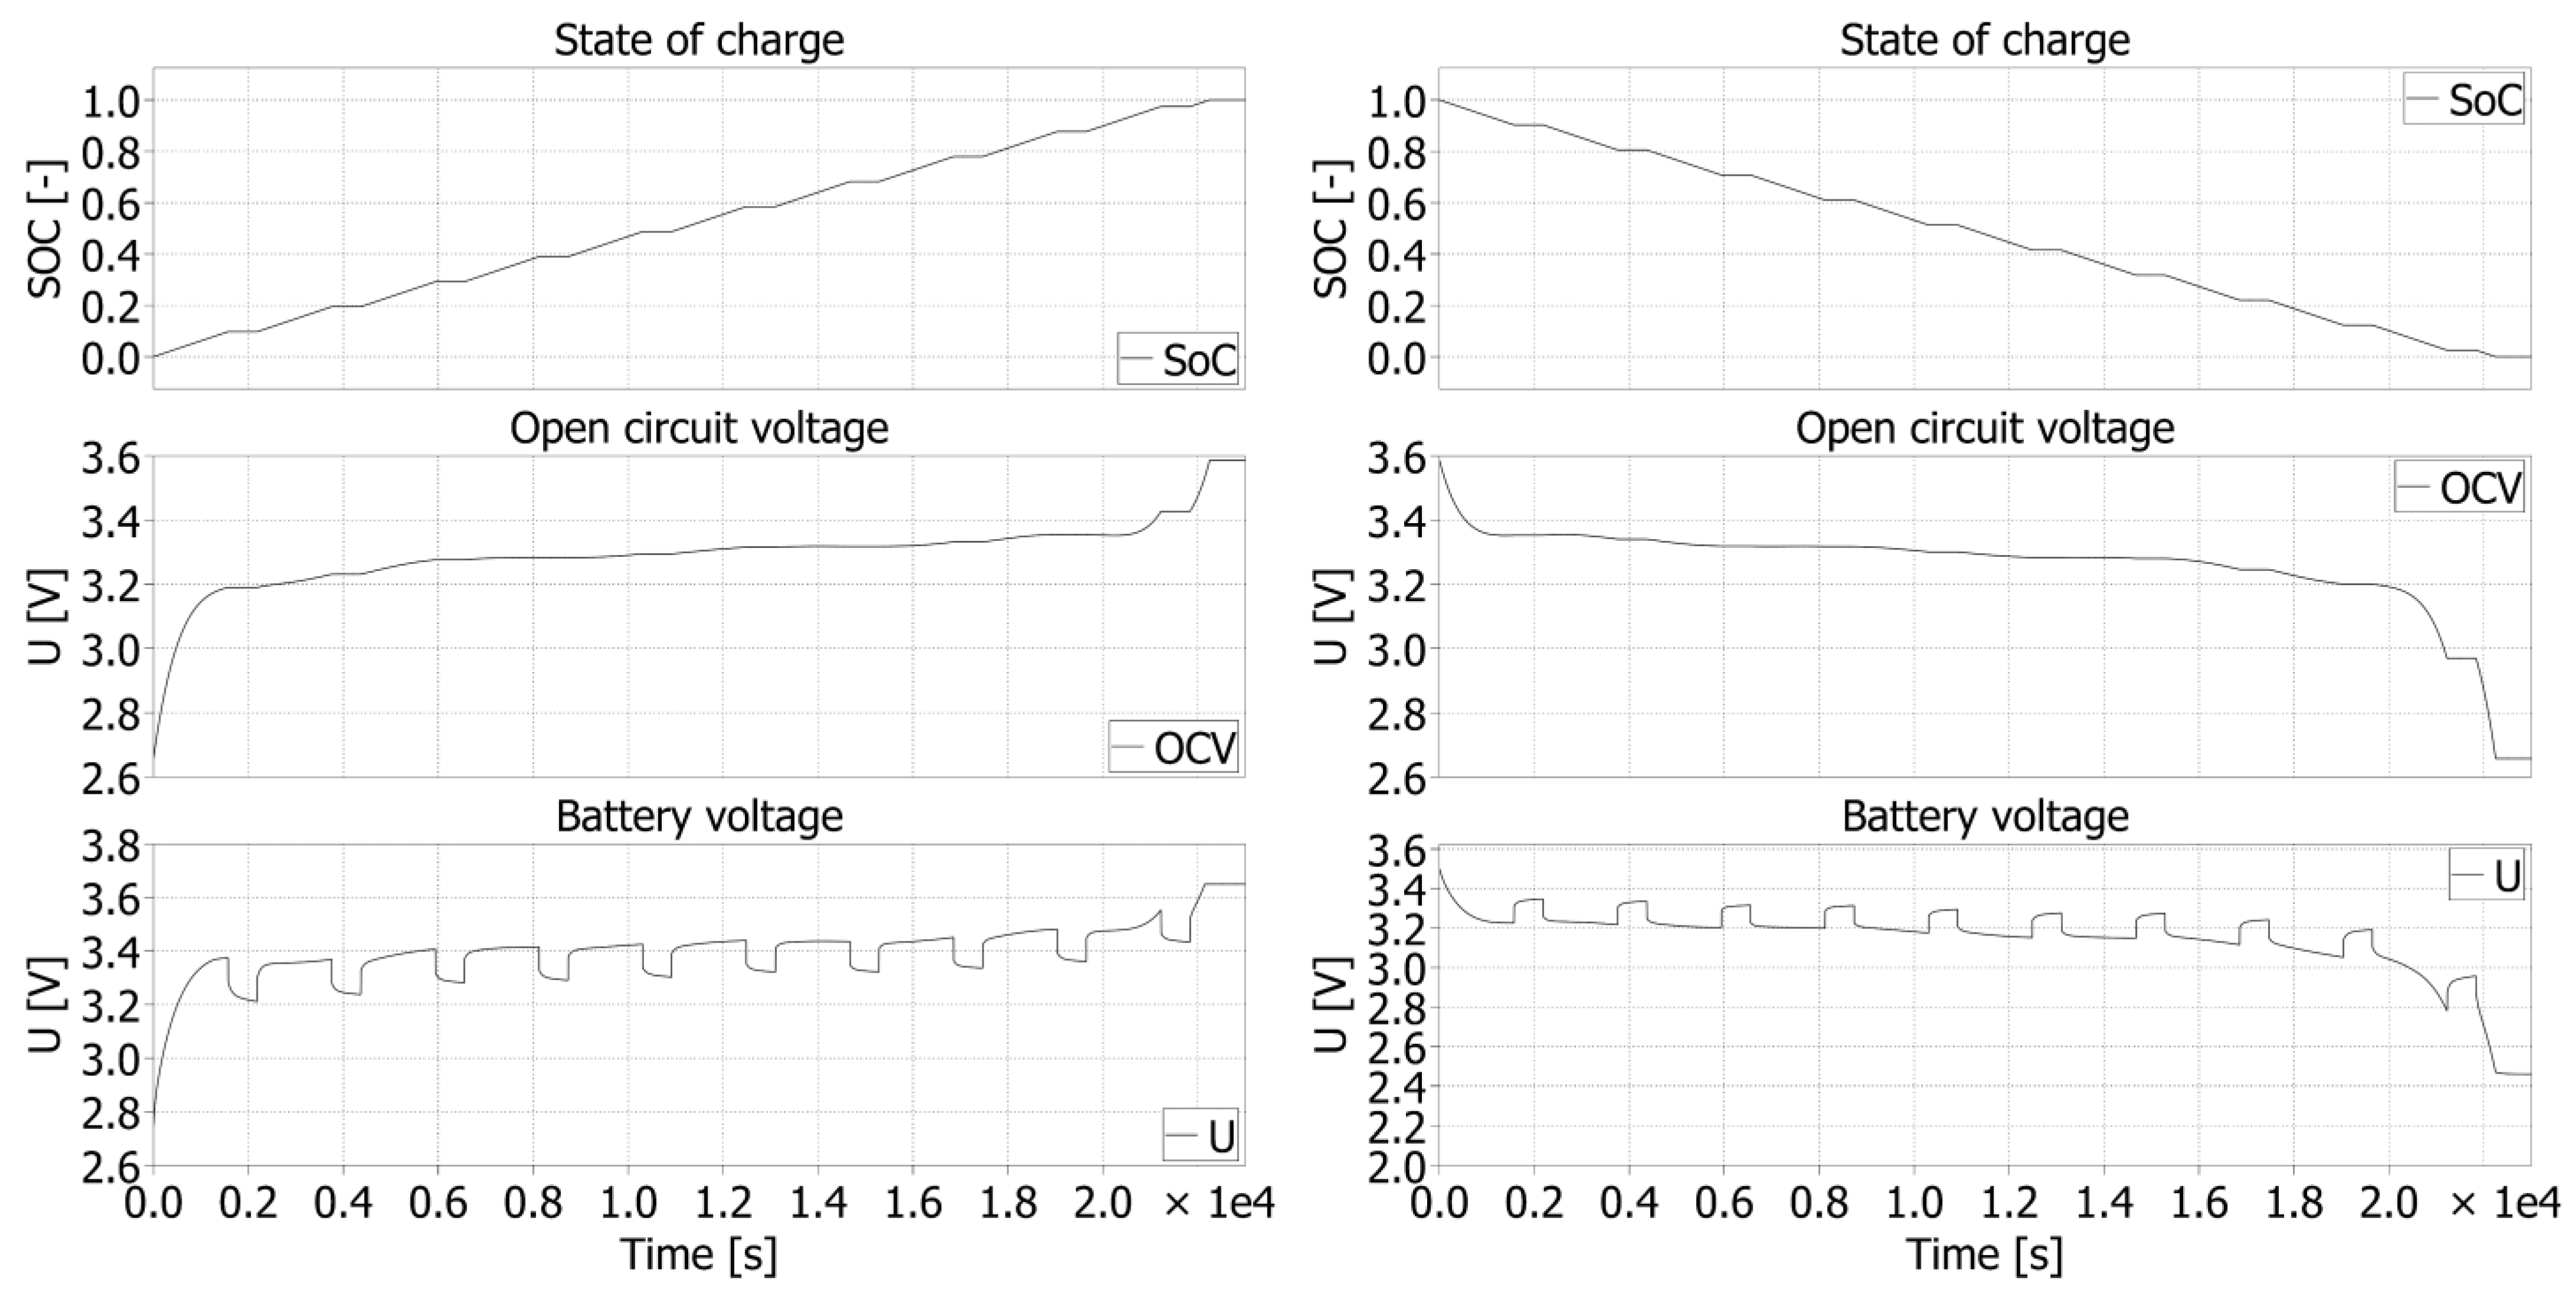
For the LFP040AHA cell, the simulation results of the charging process are shown in
Figure 18 together with the results of the discharging process. Pulse changes of
SOC are visible as well, which are used for the purposes of identification of the
OCV values. This value represents the real value of the voltage at the cell terminals. The internal resistance and parameters of the RC cell are reflected here.
Similar results are simulated for NPB 60 AH. The waveforms referring to the charging and discharging are shown in
Figure 19. Three variables are evaluated as in the previous case to determine
OCV waveform.
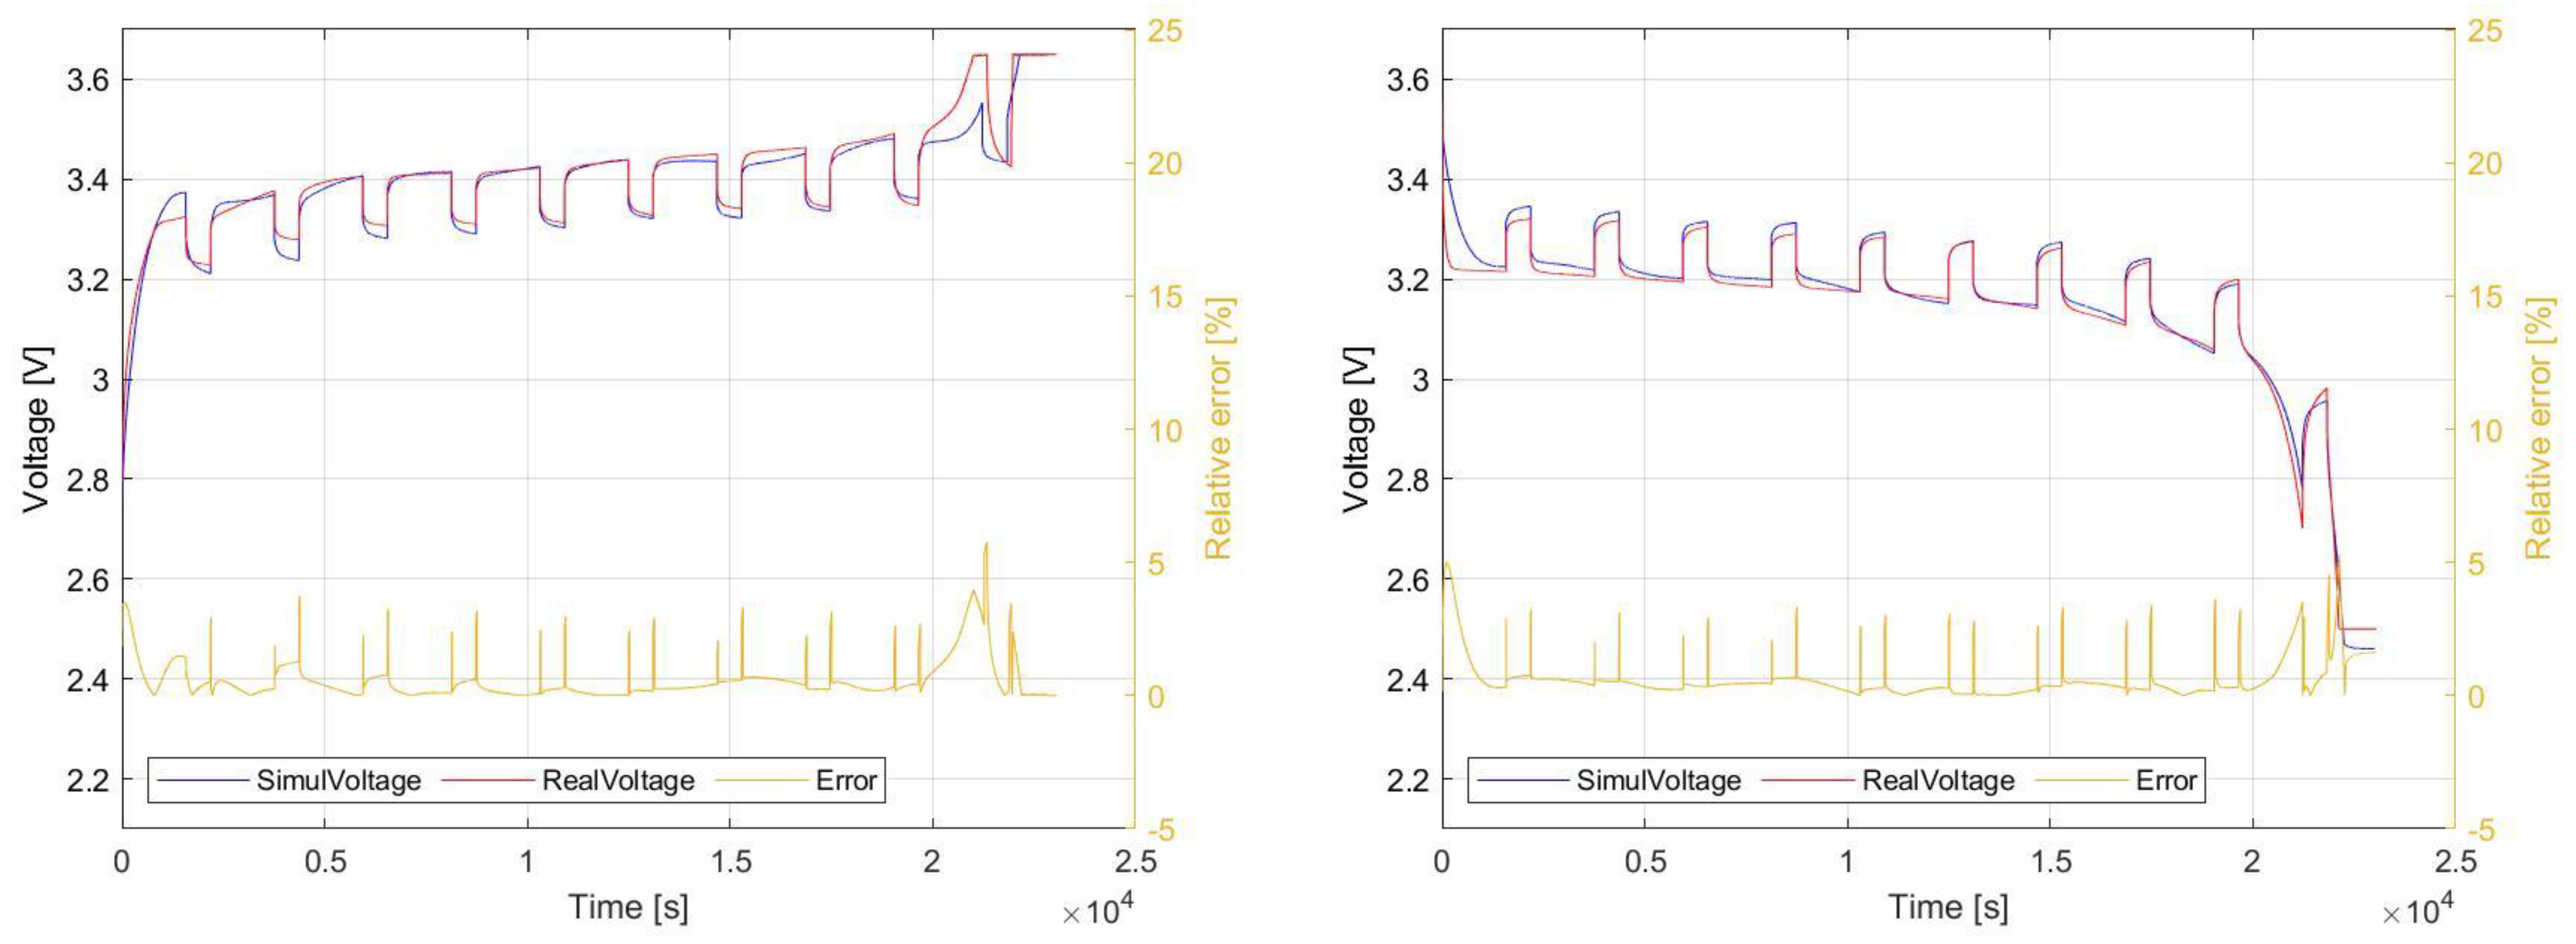
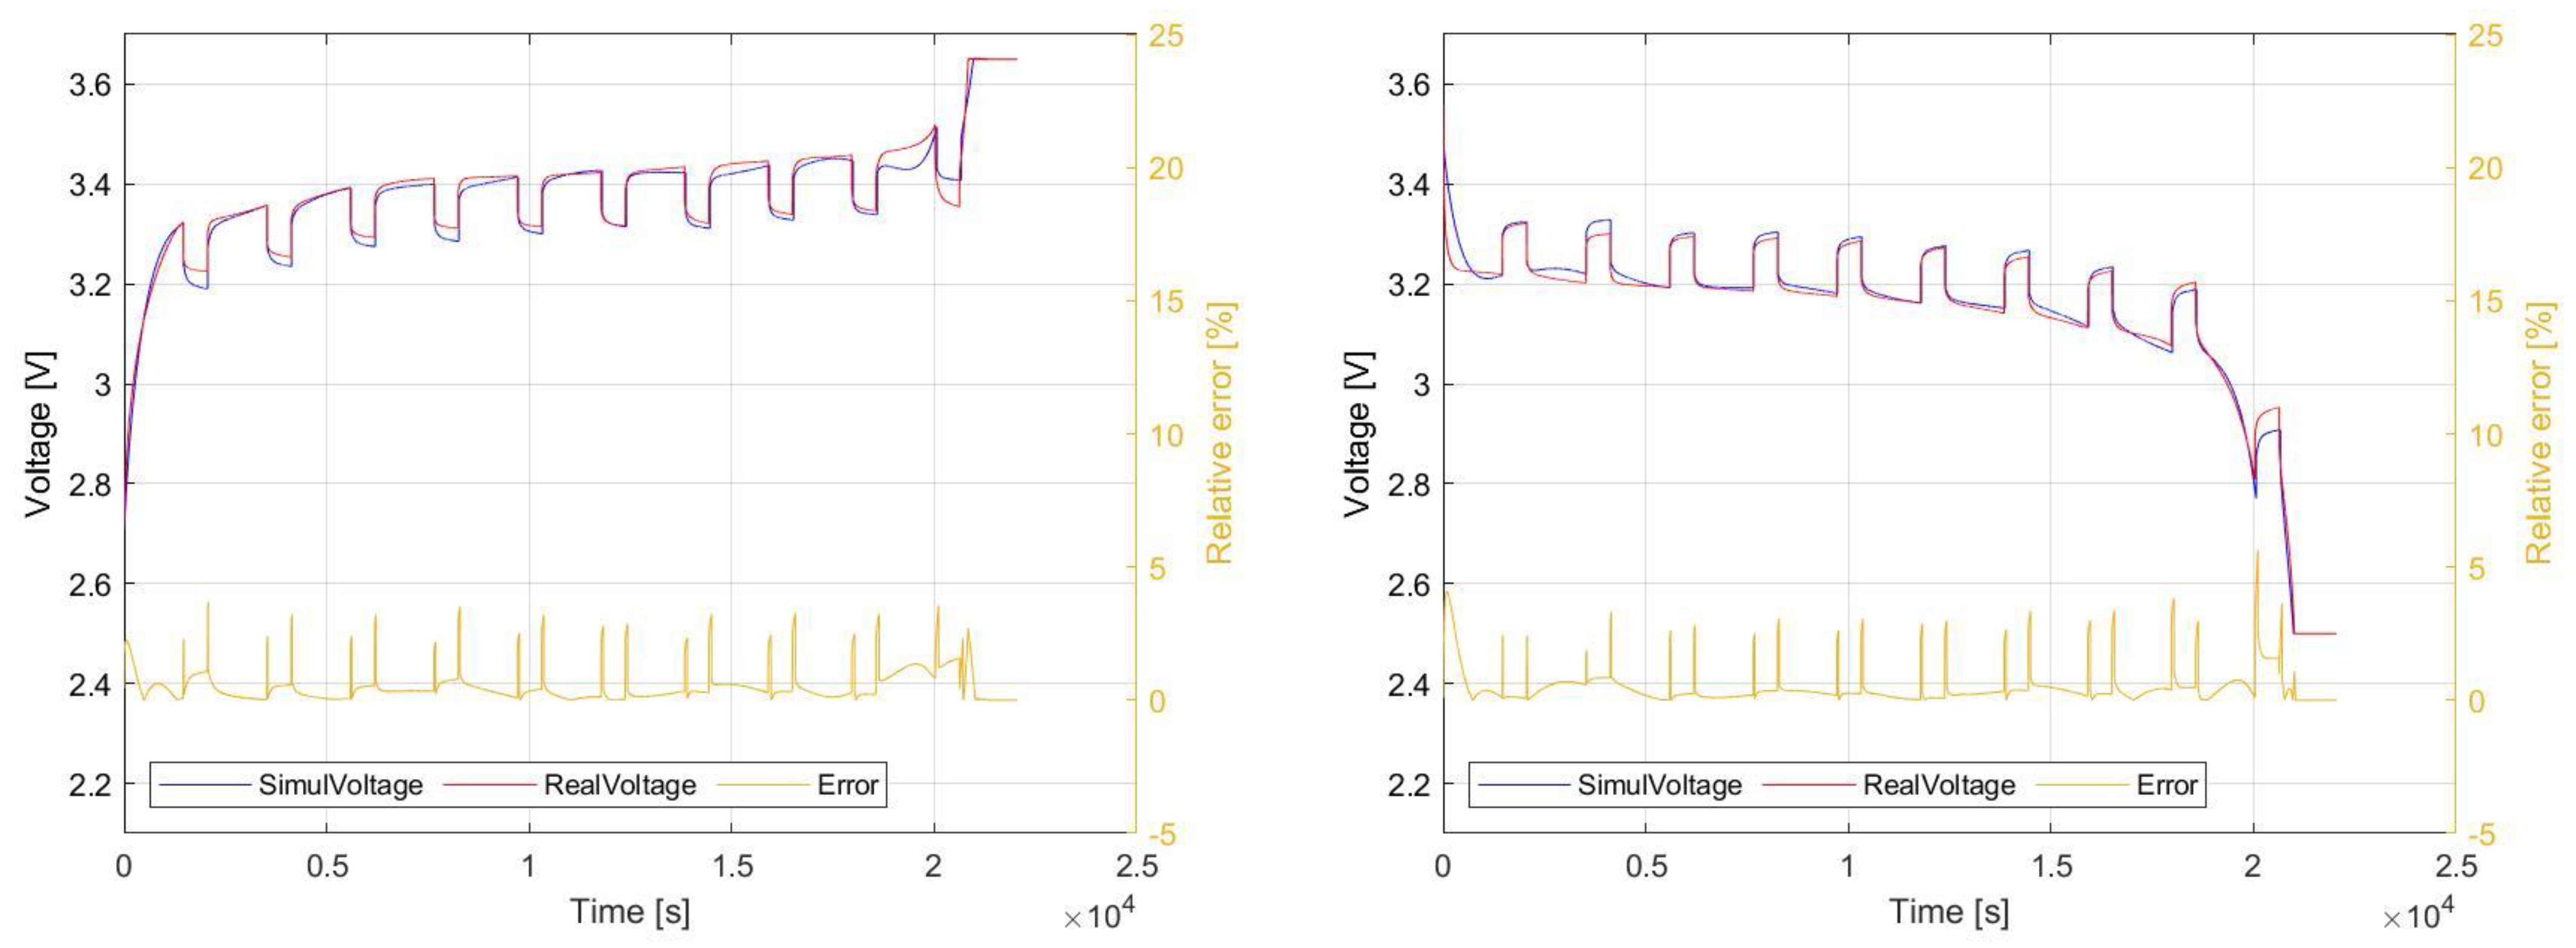
5. Comparison of the Simulation Results with Experimental Measurements
The resulting waveforms, which are mutually compared, refer to the charging and discharging process of selected cells. In order to evaluate the accuracy of the presented identification methodology and simulation modelling, the relative error between simulation and experimental measurement is evaluated. The value of relative error is higher at the beginning and at the end of these processes. Basically, the highest achieved value targets 5% of relative error for the regions is around 10% and 90% of SOC. Within the range of 20–80% of SOC, the error achieves approximately 2%.
5.1. Charging and Discharging Cells
5.1.1. LFP040AHA
In the first case, pulse charging and discharging of the LFP040AHA cell is displayed. These waveforms are shown in
Figure 20. The red waveform represents the real measured values, and the blue cell represents the result of the discharge simulation of the LFP040AHA cell. It is clear from the figure that this model is accurate enough for use in complex applications consisting of these articles.
5.1.2. NPB 60 AH
As in the previous case,
Figure 21 shows a comparison of the pulse charging and discharging waveforms of the NPB 60 AH. If we consider the evaluation of the relative error, comparing to previous case, a more stable accuracy and lower relative error values are achieved. For the most of the
SOC range, the relative error is no more than 1%.
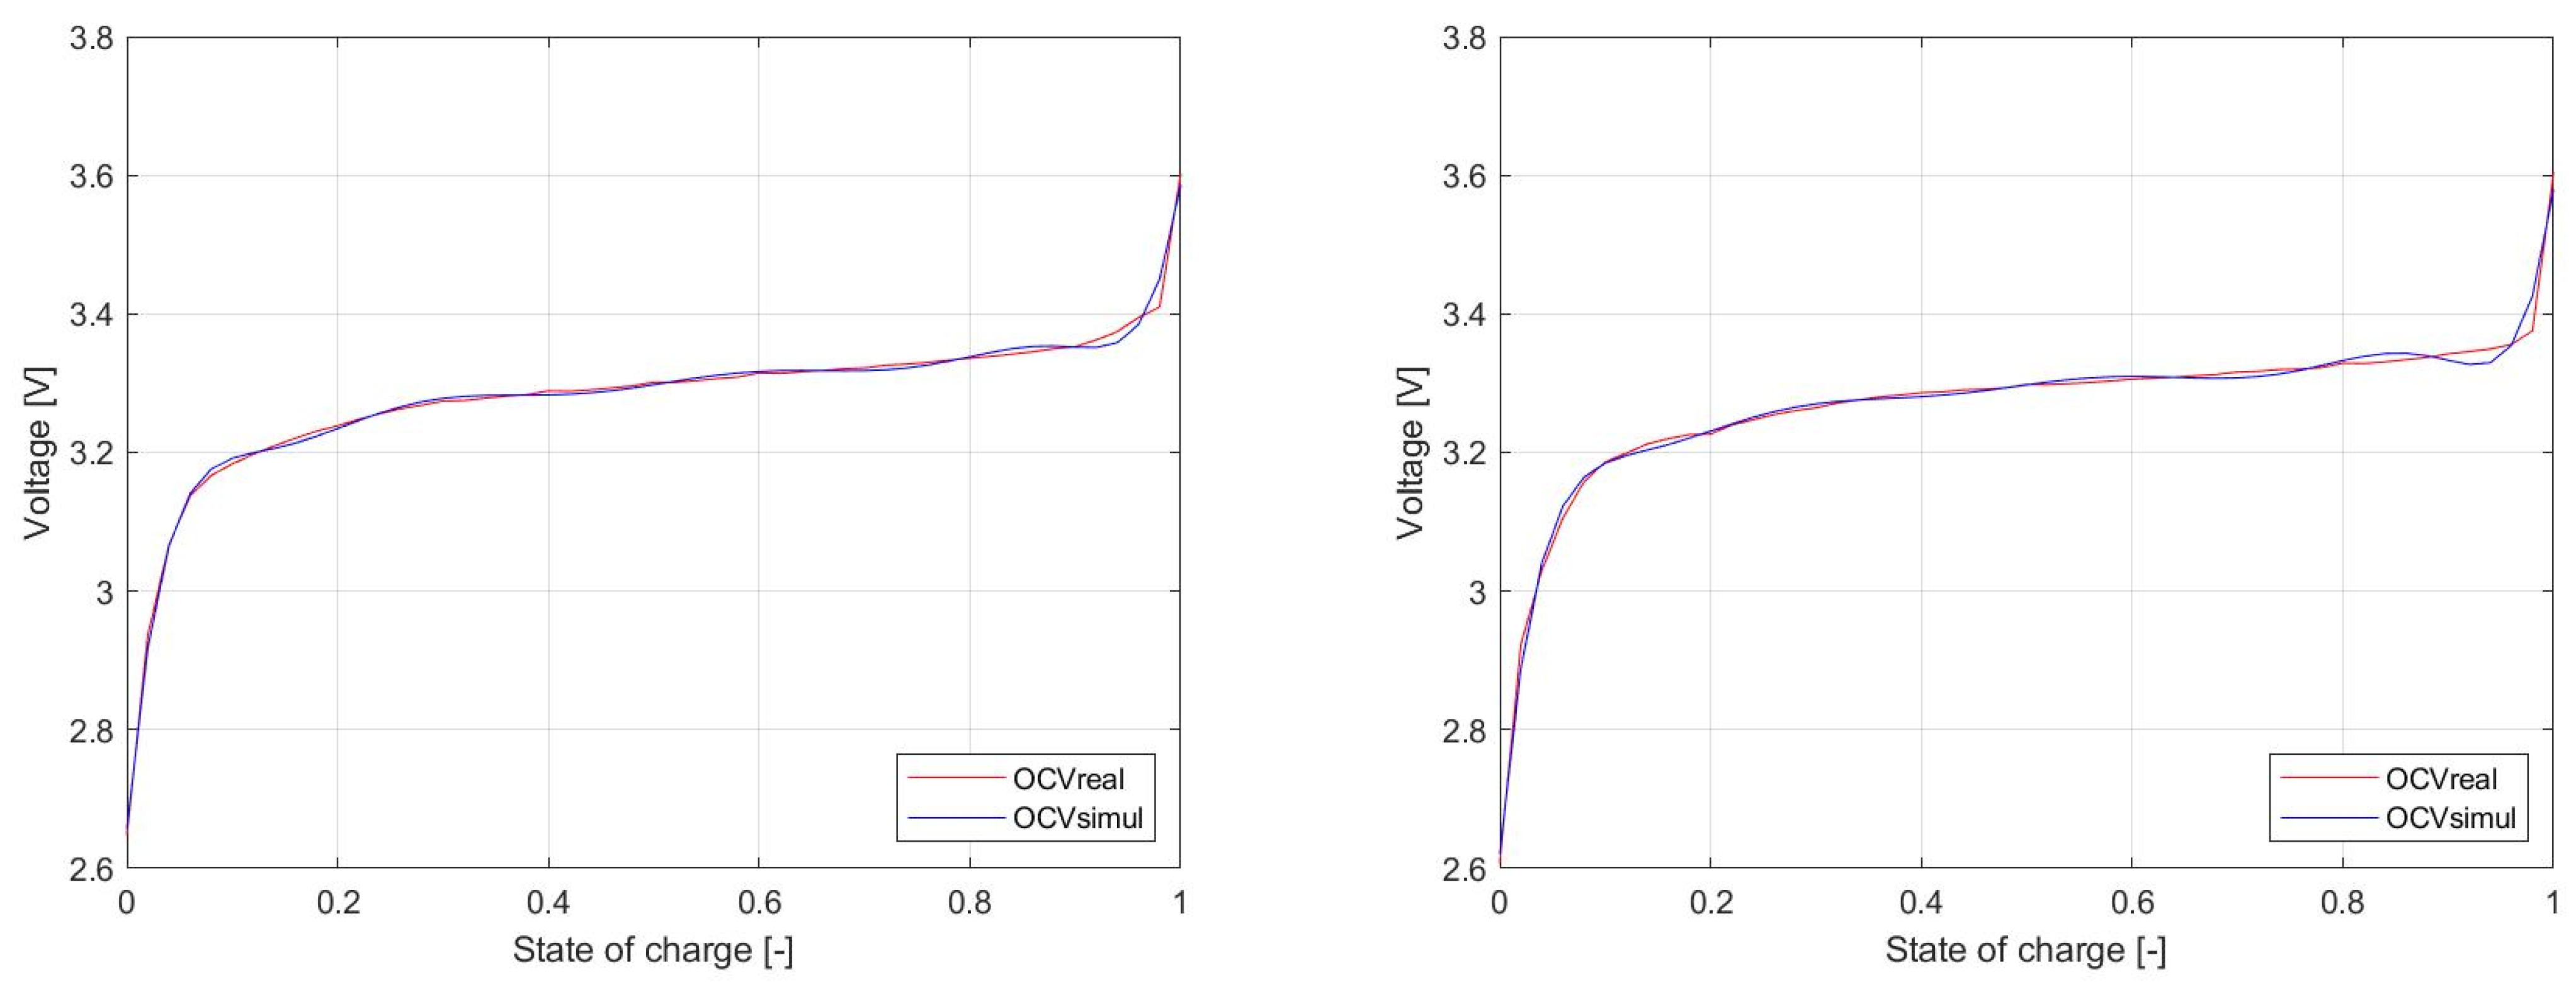
5.2. Comparissons of the Values of Components of EECM, Simulation vs. Measurements
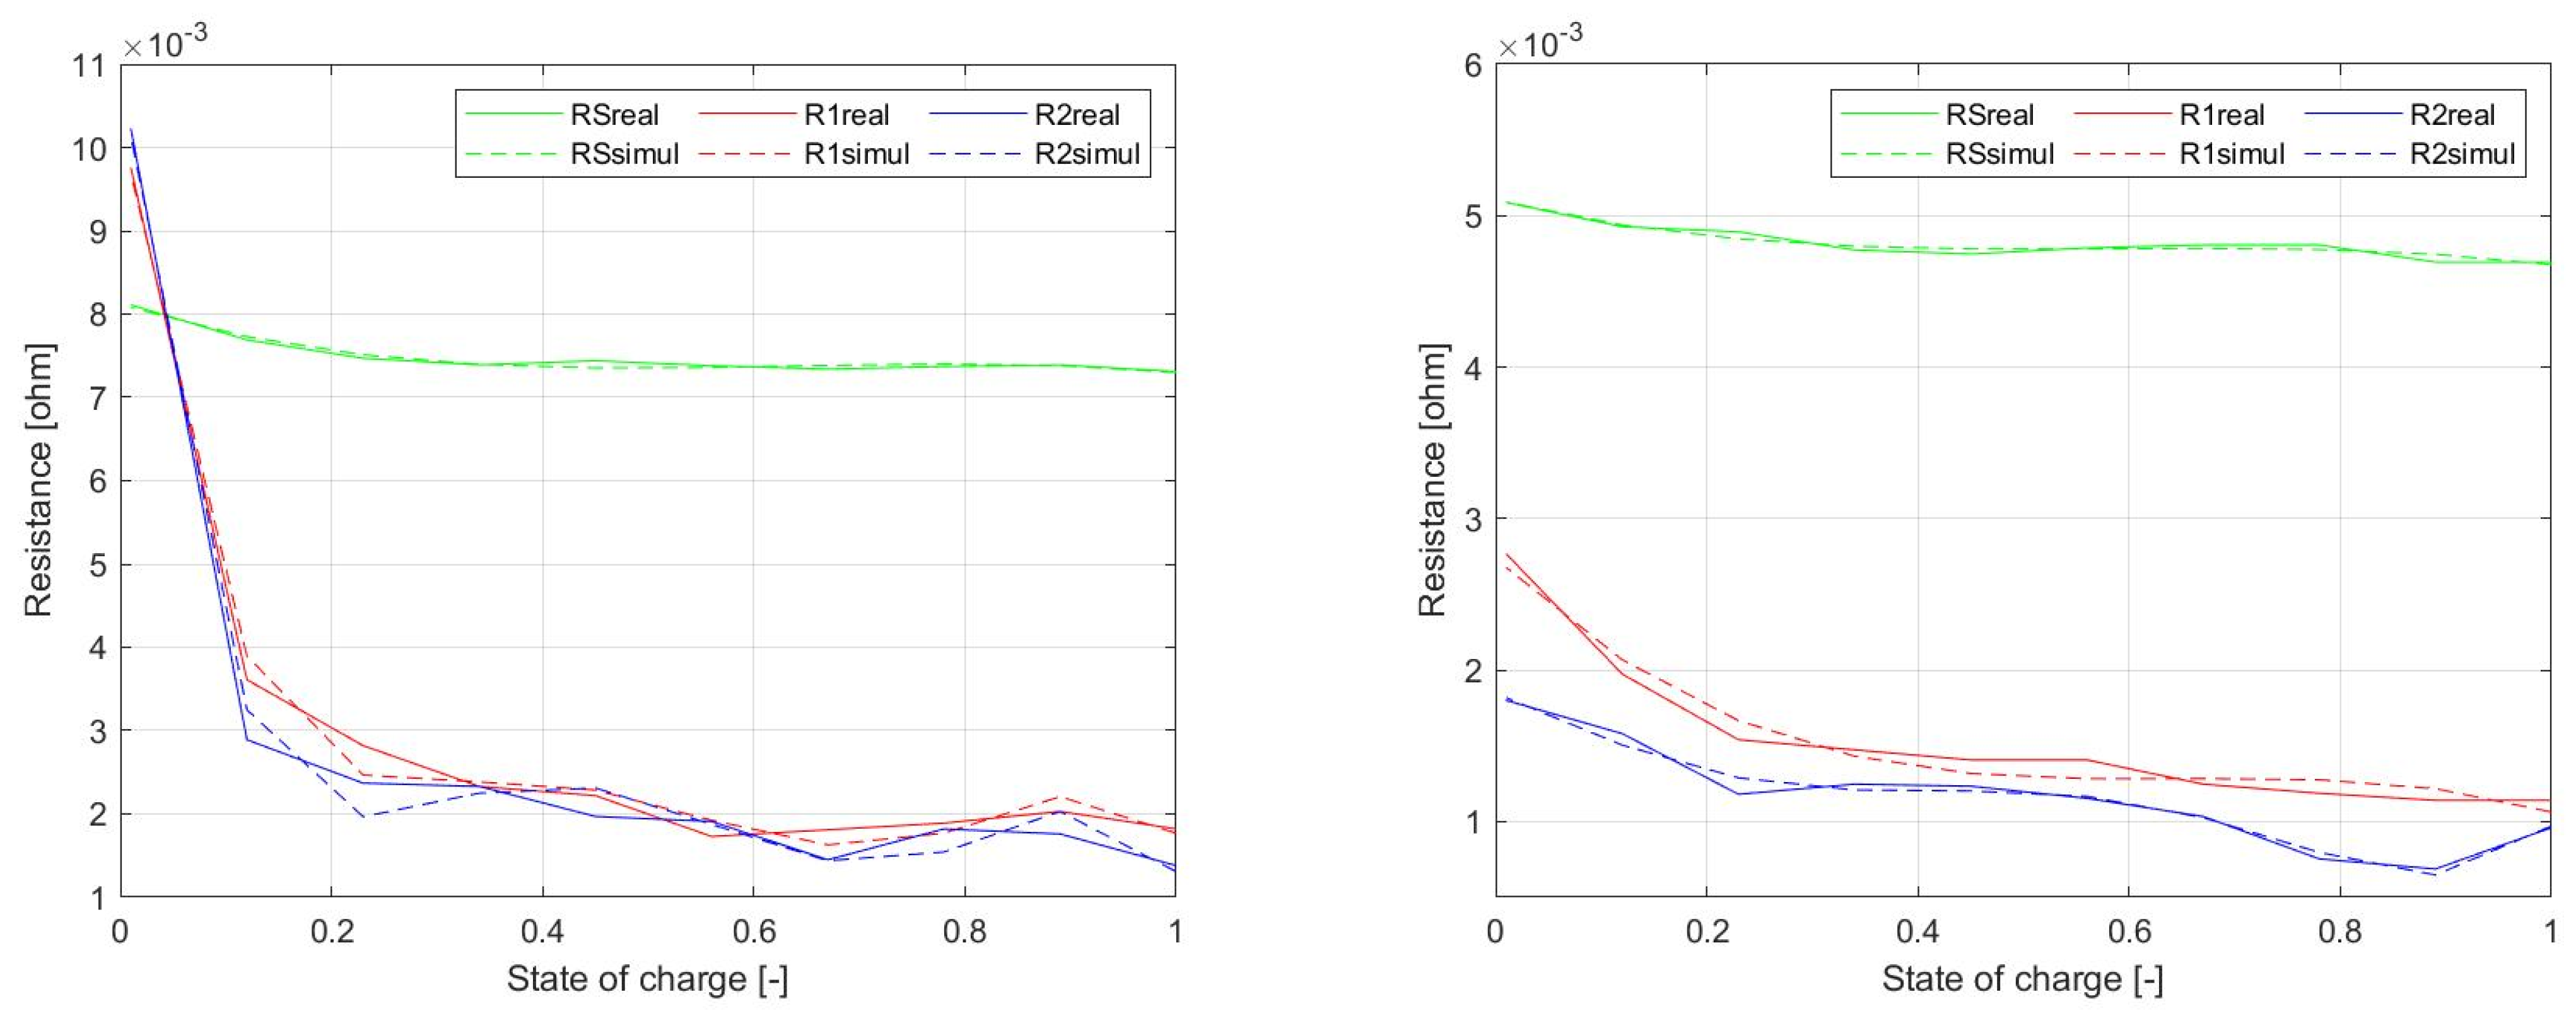
The comparison of the parameters of the equivalent replacement scheme of the cell was performed as a comparison of the waveforms of the measured parameters OCV, RS, R1, R2, C1, and C2 with the simulated results.
Figure 22 shows the
OCV waveform of the LFP040AHA and NPB 060AH cells from
Figure 8. The measured results are represented by red waveform, while blue refers to simulation results achieved as polynomial formula (2). This polynomial almost completely overlaps the measured waveform, so the model in terms of
OCV represents a highly accurate system.
Figure 23 shows comparisons of the dependency of resistive elements of EECM. Experimental waveforms were initially represented on
Figure 12, while here they are compared to simulation. Green waveforms refer to
RS, red waveforms represent dependency of
R1, and blue waveforms are related to
R2.
Figure 24 shows dependency of the values of capacitive elements of EECM. As in the previous case, the solid lines refer to the measured data, while dashed lines refer to the simulation results. It appears that simulation model reliably follows the behavior of the cell itself.
6. Conclusions
The article described the motivation for development of a system used for identification of the equivalent electrical schematic model of a battery. Insufficient descriptions of the parameters given by the manufacturers of electrochemical cells leads to the need for utilization of the presented methodology in order to be able to determine the values of components which are required for battery modeling. These are OCV, RS, R1, R2, C1, and C2 parameters and their dependency on the SOC. The presented modelling approach enables to identify the simulation model, which is capable of representing the dynamic performance of cells, while its complexity offers the possibility to model complex battery modules and battery packs. In this way, complex energy storage systems can be designed and investigated under the operation of various power electronic systems.
Using an algorithm in the LabVieW environment, a programmable load and a programmable source were controlled. The discharging/charging profile was set by this algorithm, and the parameters of the EESM were determined from the measurement results of these discharging/charging profiles. These elements are represented mathematically using higher order polynomials. The polynomials contain a dependency of these parameters on the change in the current SOC of the electrochemical cell. These changes range from 0 to 1 SOC.
From the measurements, it was found that the manufacturer produces two types of cells that are relatively the same. In the analysis of these cells, it was found that these cells have very different values of the internal elements EESM. Although these cells are of the same type of LiFePO4 cathode material, they are very different. This difference is not declared in any datasheet from the manufacturer. This difference in the internal parameters of the replacement equivalent scheme was demonstrated by the fact that these cells cannot be loaded with the same value of load current C. Due to the difference in these parameters, there was the problem that when discharging the NPB 60 AH cell with a value of 3 C (180 A) for the cell, the cell temperature reached 45–50 °C after termination. While in the case of the LFP040AHA cell, which was also loaded with a value of 3 C (120 A) for the given cell, the temperature after termination reached up to 60 °C. This small invisible difference in these cells could cause major system heat dissipation problems to system developers in sharp applications. This temperature difference at the same load is mainly due to the R parameters from the replacement equivalent cell scheme.
In terms of the simulation model, it can be said that the model shown above in the cell corresponds to real samples. Of course, the algorithm can set the measurement of any cell. It is enough to enter the parameters necessary for measuring different cells into the algorithm, and this can ensure the measurement of different types of cells. From these measurements, it is possible to determine any alternative equivalent scheme from the article. Based on the measurements and data analysis shown above, it is possible to construct a simulation model for different types of cells.
When comparing real and measured waveforms, this simulation model corresponds sufficiently to the real cell in both cases. This cell is suitable for more complex simulations in the field of smart grid, electromobility, testing of balancing systems, or renewable energy storage.


