Abstract
Circular business models for batteries have been revealed in earlier research to achieve economic viability while reducing total resource consumption of raw materials. The objective of this study is to measure the economic performance of the preferred business model by creating different scenarios comparing second life (spent) and new battery investment for seven different European regions and four energy management strategies. Findings reveal levels of economic ability for a total of 34 scenarios simulated, including direct savings per kWh, a total change in energy costs per year, battery charge/discharge cycles, and comparative breakeven analyses. Regional effects are also measured based on day-ahead electricity prices and solar irradiation. The minimum payback time is 7 years before battery system investment costs are covered. The most viable energy management strategies also had the highest number of charge/discharge cycles, which decreases battery lifetime. Investment in a second life battery compared to a new battery reduced the payback time by 0.5 to 2 years due to lower investment costs. However, the estimated lifetime range (3 to 10 years) is lower compared to a new battery (5 to 15 years), which questions the circular business model viability for the scenarios studied. Energy management strategies should be combined and customized to increase economic benefits.
1. Introduction
Grid connected battery energy storage systems (BESSs) linked to transient renewable energy sources, such as solar photovoltaic (PV) generation, contribute to the integration of renewable energy to the grid [1,2], which is important to Sustainable Development Goals (SDGs) [3]. By enabling to replace fossil fuels with renewable energy, also in mobile applications, political agendas are driving battery demand [4]. Batteries are an increasingly used storage technology due to their flexibility in placement, scalability, and maintenance-free operation [5,6]. Combined with energy management (EM) strategies, such as peak-shaving, load shifting, electricity arbitrage, and solar PV generation with self-consumption, BESSs also benefit the power system by contributing to sophistically balancing the demand and supply of electricity on the demand side [7]. BESSs can provide various services that achieve economic savings [5] and are currently becoming an increasingly profitable investment [6]. However, the potential economic benefits of BESS investment rely on several parameters connected to costs of investment, savings achieved through EM strategies, and end-of-life (EOL) management.
Research and industrial interest of repurposing batteries from electric vehicles (EVs) for, e.g., stationary energy storage [8,9,10,11] has recently increased. Such circular economy (CE) practice can benefit both the environment and economic viability of BESS investment [12]. Repurposing a battery can reduce investment costs when the battery price is lower and the quality is assured [9,13,14,15]. Circular business models (CBMs) map how to enable the commercial success of a product or service with an underlying CE strategy [16,17], e.g., by enabling a second life for batteries that will extend the lifetime before recycling and contribute to a CE for batteries by slowing the materials loop [18]. Wrålsen et al. [19] identified CBMs for lithium-ion batteries (LIBs), particularly those stemming from EVs, and found that the most critical barrier for these CBMs is financial. Thus, it is crucial to develop economically viable business models for the CE of batteries. To enhance economic savings, Braeuer et al. [20] explored BESS investment with peak-shaving, primary reserve control, and electricity arbitrage in Germany and found that the latter strategy led to the least income of the three. The reason for this could be a too low price spread in the German day-ahead and intraday continuous market used for electricity arbitrage. In contrast, Rallo et al. [11] found, by studying two real cases (a furniture factory and a hotel) in Spain, that arbitrage was the best strategy to obtain profitability as it indirectly also performed peak shaving. There is potential for profitable CBMs, however, BESS costs, and lack of awareness and use of EM strategies to enhance savings are barriers for businesses to invest [21,22]. Furthermore, battery ageing is a recognized important characteristic and depends on operation incentives, climate conditions, and other contextual factors.
Current research shows diverging profitability results from case-specific analyses and does not cover the role of regional conditions or assessments comparing investments in new and second life batteries. There is a research gap of measuring these crucial factors for successful battery system investment, which also can benefit environmental sustainability through circularity. CBMs aim to achieve both economic and environmental sustainability; however, these can experience trade-offs [23]. Therefore, it is important to measure CBMs in terms of both approaches [24,25]. CBMs for batteries and factors that are important to achieve economic viability need to be measured. EM strategies can contribute to enhance economic viability of CBMs while contributing to delicately balance the supply and demand of electricity. However, value generated from EM strategies can be challenging to quantify and such investments are complex to evaluate. Country specific characteristics, such as electricity prices and solar irradiation, are also important factors to consider, but studies simulating battery behavior and assessing economic viability in different European countries do not exist.
This paper develops multiple scenarios consisting of different combinations of the factors identified as important for economic viability of battery system investment: battery behavior (when it charges/discharges and how many cycles); EM strategies (including PV); different European regions; and investing in a second life versus a new battery. The objective of this study is to measure economic performance of the battery repurposing CBM [19] and assess other opportunities to lower BESS investment costs. Simulations were based on a battery optimization method [26] and performed for seven European countries investigating the economic potential of the battery storage to generate profit: (1) making use of energy price arbitrage; (2) using it to harvest photovoltaic energy; (3) performing load shifting from peak to low demand times; and (4) improving self-consumption by balancing demand and self-generated photovoltaic energy. Based on the different countries and strategies, 28 scenarios were designed. These scenarios have been applied in a simulation study to a case manufacturer (where real energy data was available) using a generic BESS. The case manufacturer operates in the food industry in southern Norway. Additionally, to test the CBM, six of the scenarios applied a second life battery. Thus, in total, 34 scenarios were designed and investigated. Based on the identified research gaps, this paper aims to answer the following research questions (RQs) through the multiple-scenario analysis:
RQ 1 What is the potential of the four energy management strategies to enhance economic viability of battery investment?
RQ 2 How does location affect economic viability in terms of electricity prices and solar irradiation?
RQ 3 How does the repurposing circular business model compare economically with investment in a new battery?
This study is particularly relevant for manufacturers and others considering BESS investment; the battery industry, both with CBMs (seeking profit while promoting a circular economy) and traditional business models (seeking profit) and policy makers working with regional, national, or international CE strategies. In addition, the work is relevant for researchers in the field of CE and CBMs as the performance of a recognized CBM [19] is measured quantitatively.
2. Economic and Environmental Sustainability
In addition to the increasing demand for stationary energy storage, the electrification of the transport sector enhances the use of battery-dependent mobile applications, such as EVs [27]. As production and consumption of batteries are expected to continue growing significantly [5,27,28,29], the European Union (EU) launched its battery regulation in late 2020 to motivate a CE for batteries. One of the encouragements is to repurpose batteries from EVs for stationary energy storage. LIBs are expected to reach EOL technically when the battery has 60% of the original capacity [15] and should then be ready for recycling the materials. However, depending on application, consumers may bring the battery to waste management earlier when, for example, reduced EV driving distance reaches an unsatisfactory level, when an accident occurs, or a vehicle swap is desired. In these cases, through CBMs, a second life can be enabled prior to recycling the materials by recapturing their remaining economic value after use in the EV [8,9]. CBMs are based on sustainable development principles and are recognized as a type of sustainable business model [30]. The aim is to retrieve the economic value of resources and intentionally reduce extraction of virgin materials (e.g., nickel for batteries). The principal techniques are to close, slow, or narrow material flows [16]. Several researchers have recently considered this opportunity and some particularly framed the research in a CBM context [8,19]. By applying the Delphi method, Wrålsen et al. [19] identified and ranked CBMs for LIBs based on their potential for success. An expert panel within the field constructed the results together. The highest ranked CBM included repurposing of a spent battery. Such CE efforts can also benefit environmental sustainability through reduced virgin battery material consumption [31] if the second life battery replaces a new. Adopting a pragmatic approach to the CBM, it should furthermore be measured in terms of economic performance, particularly as economic and environmental sustainability do not necessarily concur despite CBMs’ intention [32]. The cost and revenue models are vital elements of all business models [33] and can be quantitatively measured with business cases.
The prices of new batteries decrease; however, exact investment costs of BESS vary in existing literature [11,34]. What the prices consist of also differs, for example, between LIB technologies and applications (such as for stationary energy storage or electric vehicles) and when the price reflects the battery at a cell, module, or pack level. Additional costs from cell to pack can be 21% of total costs [35]. Mathews et al. [15] assumed the cost of a new battery module is 176 EUR/kWh based on research from 2018 concerning LIBs for utility-scale energy storage. Prices decrease rapidly, and the worldwide average battery pack prices for LIB technologies for e-buses, passenger, commercial electric vehicles, and stationary storage were 115 EUR/kWh in 2020, according to Bloomberg NEF’s annual battery price survey. This price is without taxes and includes multiple cells, modules, the battery management system, wiring, thermal management system, pack housing, and holding the cells and modules in place [36]. The price is expected to decrease to 84 EUR/kWh by 2023 and to 49 EUR/kWh in 2030 [35]. Upscaled mass production of battery packs leads to an expected battery price reduction of 50% by 2030 from 2018 prices, according to Tsiropoulos et al. [37]. Fundamental improvements to battery chemistry is another factor causing cost reductions and performance improvements (e.g., power and energy density and higher charge/discharge cycle stability) [38]. The new battery price could decrease by 70% from 2019 to 2040 [6].
The cost of the battery pack is one element of BESS initial investment costs; additionally, there is an 80 EUR/kW cost of power electronics, including inverter, 30 EUR/kW for electric materials, and 30 EUR/kW for labor, according to Rallo et al. [11]. Tools, such as identifying the breakeven points, can contribute to considering whether an investment is advisable [39]. The decreasing battery prices also enhance the investment interests as BESS investment costs are considerable [6,35]. Based on a number of studies, Rallo et al. [11] found that the expected price of a second life battery pack that has reached 80% of its original capacity is currently 50 EUR/kWh, about half the price of a new battery [35].
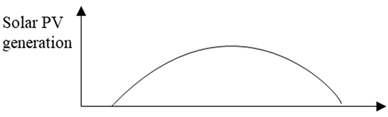
The transition from fossil fuel power to renewable energy sources is a global strategy driven by sustainability to reduce greenhouse gas emissions. Solar PV generation is expected to grow by 15% each year from 2021 to 2030 [40]. Due to natural fluctuations in intermittent energy sources, such as solar and wind, the need for energy storage is growing [41]. This trend is desired in terms of reaching several of the SDGs, particularly goal 7 (affordable and clean energy) and goal 13 (climate action) [3]. When integrating local solar PV generation to a BESS, solar irradiance (which naturally depends on location) largely determines the extent of power generation. Hence, it is an important factor to examine for potential economic benefits [42]. A solar PV system generates economic value throughout its lifetime due to either selling the power generated through the grid [15] or self-consumption and therefore reduction of electricity purchase. When PV is integrated in the BESS, one needs to consider the additional initial investment costs related to PV modules. Prices have decreased notably in the last 40 years. From 2010 to 2020, there was a price reduction of 89% [43]. Improved efficiency of modules, government incentives, research and development, and economics of scale have contributed to the cost reduction [44]. A common PV module with 60 multicrystalline cells cost 230 EUR/kWp in March 2021, according to pvXchange [45]. To complete an installation, additional initial investment costs include the inverter (110 EUR/kWp), electrical parts (110 EUR/kWp), and installation (120 EUR/kWp) [46].
Whether investing a new or a second life battery, its lifetime is important to account for, both in terms of environmental and economic sustainability. There are two common measures applied to estimate battery lifetime due to degradation (ageing): Cycle and calendar lifetime [9]. Battery cycle lifetime is the number of full charge/discharge cycles before it reaches EOL. The number depends on the characteristics of the battery and contextual factors. Jo et al. [47] estimated, for example, that a new 1000 kWh LIB with a depth of discharge of 95% can charge/discharge 3000 times. A second life battery study by Braco et al. [48] found that at least 2033 cycles should be expected before the battery reached a sudden nonlinear loss (ageing knee). The researchers tested different second life LIBs from Nissan Leaf EVs with an unknown user history. To grasp this important parameter, a multiple scenario analysis can account for both the number of cycles based on the specific operation and the potential economic benefits during the lifetime of the battery.
3. Research Methods
3.1. Study Scope
The multiple scenario analysis performed in this study consisted of 34 scenarios in total. These include four different EM strategies in seven countries located in different regions in Europe and investment in a new or second life battery. The purpose was to measure and compare the potential for economic viability with the battery repurpose CBM compared to new battery investment and examine the importance of different factors. To define a realistic scope of study, modelling choices were based on a case manufacturer in Europe. Both direct economic savings per kWh and annual change in energy costs were simulated. In addition, the number of full charge/discharge cycles were identified for the different scenarios as this is highly relevant for the results. These findings were combined with additional data and applied in comparative breakeven analyses. The scope of the study is illustrated in Figure 1 and is further detailed in this chapter.
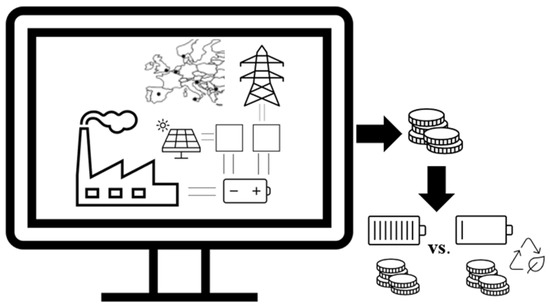
Figure 1.
Illustrated study scope.
Each EM strategy studied had an incentive for when the battery charges/discharges. These were simulated for seven European countries to consider country-specific and regional characteristics that can influence economic savings. The strategies applied are described and illustrated in Table 1.

Table 1.
The four energy management strategies and the European countries and regions covered in the multiple scenario analysis.
3.2. Research Process and Data
Firstly, an analysis of the electricity demand of the case manufacturer was performed. In this research stage, modelling choices, such as battery and solar PV sizes, started to form based on the typical daily demand profile. The maximum electricity consumption peak of the real case manufacturer within 2018 and 2019 was 185 kWh. Based on this, to compensate this demand with PV, the planned power for the solar PV system was 185 kWp. The battery capacity was chosen accordingly and was 185 kWh. Secondly, investment costs were investigated. Thirdly, the countries were selected based on the European Commission’s classification of regions. One country per region (seven in total) was chosen based on the highest average relative standard deviation of day-ahead electricity price for 2019 [4]. Due to incomplete day-ahead electricity price data for Romania and Ireland, these were replaced with United Kingdom and Slovenia, the next countries listed in the ranking in these regions. Because this study included several countries, the most profitable average capacity-to-power ratio for stationary battery storage system was applied (2.32) [26]. Thus, the battery power was assumed to be 79.7 kW. Furthermore, the solar PV power generated for the seven geographical locations was identified with PVSYST software [52] based on requested weather and solar irradiation data from Solargis [53]. The real day-ahead prices were accessed for the countries selected for 2018 and 2019. These historic prices do not show any clear price trend for two years [4]. All sources with specifications and modelling characteristics are collected in Table 2. When all data were collected and investigated, the scenarios were simulated. Lastly, simulation results and investment costs were applied in breakeven calculations.
Table 2.
Data specification and sources.
3.3. Calculations
An optimization method [26] developed in MATLAB [59] was applied in the simulations. The direct economic savings for the different scenarios were calculated by multiplying the total power consumed for each hour (minus for positive power and plus for negative power) with the day-ahead price at that time from the respective country. The specific power consumed in the different scenarios was based on the EM strategy and country. For example, with strategy number four (Table 1), the total power consumed and generated (from solar PV) in that country for each hour was multiplied with the day-ahead price at that time. This included the battery, solar PV generation, and the self-consumption. The direct savings showed the saving per kWh per year and did not account for the reduced grid draw. The change in energy costs showed total cost change per year and accounted for the reduced grid draw. The day-ahead price analysis was also performed using MATLAB [59].
The number of battery cycles were calculated based on the energy flowing in and out of the battery. One full charge/discharge cycle was done at any time the in- and output energy equaled 185 kWh, reflecting that the battery was once completely charged and discharged. The number of cycles was calculated for each year. Degradation was not included as this layer would only have minor effects on the results since a limited number of years were assessed. Based on these findings, new and second life lifetimes were calculated based on the number of charge/discharge cycles identified in this study (Figure 2) and cycle lifetimes of a new [47] and second life battery [48] (results in Section 4.4).
The estimated battery lifetimes were applied in breakeven analyses (Equation (1)) to measure the economic potential of the CBM. The analyses identify points in future time (e.g., in years) when the expense of a financial investment is covered by the economic value generated, i.e., when costs = revenue. Using Excel [60], initial investment costs were summarized and the change in energy cost was then subtracted each year.
total costs of investment − ((yearly revenue) − (yearly value loss)) = years before breakeven
Interest rates and costs associated with EOL were outside the scope of this research. Taxes and costs that may occur due to power fed to the grid from solar PV generation at the plant rooftop were not included as regulations and practice vary by country. To compare new and second life battery investments, the battery pack cost parameter was adjusted as the price was estimated to be lower for the latter battery [11]. The following parameters are not expected to change significantly over the next years: Electricity demand profile of the case manufacturer, day-ahead price fluctuations, and the weather and solar irradiation in the different countries. The parameters and values applied are specified in Table 2.
The results and discussion of this study represent findings based on the day-ahead electricity prices, which were central in the calculations. Hence, the results indicate participation in the day-ahead stock market. Additionally, the authors want to highlight the significant influence that the algorithm applied and the modelling choices (e.g., battery price) had on the results.
4. Results and Discussion
The results reveal battery performance, energy cost savings, and the number of charge/discharge cycles to estimate battery lifetime. These results were applied in an economic model, including investment costs to estimate breakeven points and lifetime range for the different scenarios of a new or second life battery system. The following chapters answer in detail the three RQs: Section 4.1, Section 4.2 and Section 4.3. answers RQ 1 and RQ 2 and Section 4.4. answers RQ 3. The simulation results are presented in Figure 2.
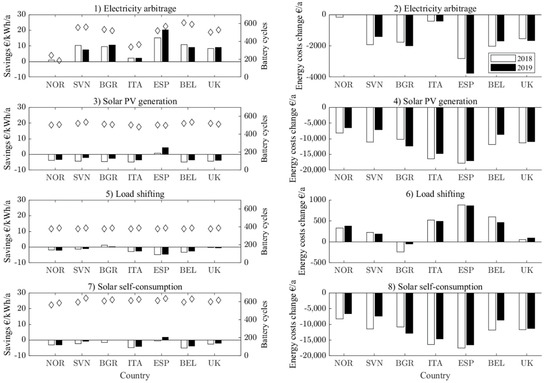
Figure 2.
Direct economic savings due to the battery system and number of battery cycles (diamond shape) to the left, and the total changes in energy costs per year to the right for each scenario for year 2018 (white) and 2019 (black).
The changes in energy costs on the right side in Figure 2 were multiplied by minus one to visualize the costs saved. Results reveal that the case manufacturer would gain the most economic benefit in Spain for all four EM strategies. Overall, the manufacturing company gains the least if located in Norway, except for load shifting.
Figure 2 shows that each strategy contributes to energy cost reductions. This illustrates potential benefits for businesses to operate several strategies for the investment to become economically viable. However, more EM strategies lead to more frequent consumption of the battery in the system, resulting in a shorter lifetime.
4.1. Electricity Arbitrage
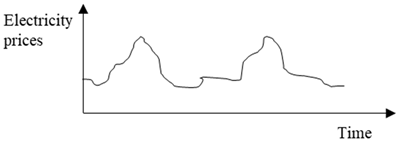
The incentive for the electricity arbitrage strategy is the day-ahead price, which reflects the results of trading hourly electricity prices for the day ahead per region. During the trading, the generators’ offers are matched with the bid from consumers, based on the supply and demand balance in the market. The day-ahead market is part of a larger system that determines the final price. The different regional wholesale markets in Europe experience different electricity prices and fluctuations. These prices are, for example, affected by the share of renewable and carbon-intensive sources. The latter must pay fees due to CO2 emissions released. Markets relying on imports or experiencing limited capacity to transfer electricity across borders also face higher prices [4]. Thus, electricity prices are influenced by several factors, including climate and weather, generation costs, market competition and integration, regulatory costs, and consumer patterns [61].
Zhang et al. [13] found that regional electricity prices are important when considering the value of battery energy storages. Table 3 presents characteristics of the day-ahead electricity prices in euros per MWh and year for the seven countries studied to consider correlation between prices, fluctuations, and economic savings. The mean value of the daily standard deviations considers fluctuations in prices and shows large variations among the European countries. Electricity prices are expected to fluctuate more in the future due to renewable sources, and energy storage technology will be used to manage this change in the electricity market [4]. Electricity prices reaching zero or below, also observed in Table 3, occur more frequently due to renewable energy growth, which causes a destabilizing effect. This phenomenon can occur when the supply is greater than the demand, or in case of link malfunction [62,63].
Table 3.
Maximum, minimum, average value, and mean value of the daily standard deviations of historic day-ahead electricity prices in euros per MWh and year for each country in 2018 and 2019.
For some strategies, including arbitrage, high fluctuations in electricity prices can potentially benefit economic earnings because of the greater opportunities for activity in trading electricity with larger variations in price. For example, the United Kingdom had more fluctuations in electricity prices compared to Norway, with a standard deviation of 3 and 2 in 2018 and 2019 for Norway and 12 and 10 in the United Kingdom, identified in the day-ahead electricity price analysis (Table 3). The United Kingdom battery was therefore more active in electricity arbitrage where power from the battery was used when prices from the grid were high. While in the Norwegian case, the battery was not used as frequently, as prices have a flatter curve.
Figure 2(1,2) shows results with electricity arbitrage. With this EM strategy, all countries except for Norway in 2019 show direct savings per kWh with a battery. If the case manufacturer has a higher demand when the battery discharges, the demand is reduced in that hour and economic savings are achieved. The inferior economic results for electricity arbitrage in Norway can at least partly be explained with the low energy prices, and fluctuations in these prices leads to a less active battery, reflected in the diamond shaped marks in Figure 2. Nevertheless, the battery cycle lifetime in Norway will be longer. Furthermore, it is not intuitive why Spain is the location with the most economic benefits as this country does not have the highest fluctuations in electricity prices. This example illustrates the complexity of such techno-economic assessments.
4.2. Load Shifting
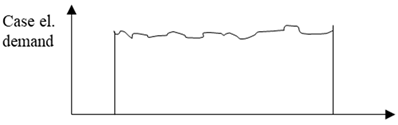
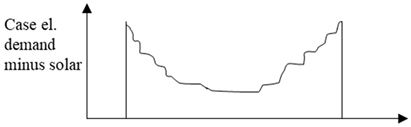
The electricity demand profile of the case manufacturer contributed to defining the research scope and is integrated in the scenarios. Figure 3 presents the typical case’s daily current profile. There are no distinct peaks in the demand pattern. The demand is lower during the night and is higher from 04:00 until 22:00 As a result, the battery has limited time to charge during these hours and limited opportunities to generate direct economic savings with a battery system for this case. Load shifting is a relevant EM strategy to shift the demand from one time to another, from times of high demand during the day to valleys during the night, thus reducing the energy costs since the energy is mostly cheaper during the night when demand is lower. This will flatten the demand curve. Findings reveal that load shifting is not considered an appropriate strategy for the case manufacturer electricity profile due to the low demand fluctuations (illustrated in Figure 3).
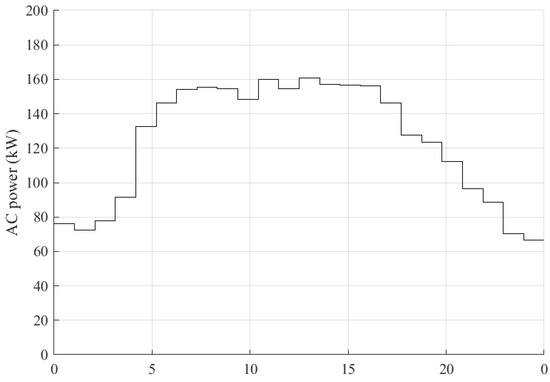
Figure 3.
Typical daily case manufacturer electricity demand profile.
4.3. Solar Photovoltaic Generation and Self-Consumption
Findings reveal that Spain and Italy achieve the most economic benefits in the EM strategies involving solar PV generation. The data Solargis [53] provided show that these countries also have the highest solar irradiation of the seven countries. For solar PV generation and self-consumption, Norway has the lowest solar irradiation of the countries assessed and the least change in energy costs (Figure 2). These results illustrate the correlation between economic benefits and solar irradiation, which confirms Kamath et al.’s [42] finding. Businesses planning EM operations should consider this in decision-making processes.
The results for Figure 2(4,8) show the same values because the electricity produced from the local solar power generated is multiplied with the day-ahead prices in both cases. Nevertheless, Figure 2(8) does not reflect the reduced grid draw. Furthermore, this strategy includes the option to sell surplus electricity to the grid instead of self-consumption. To consider this alternative, the business firstly must be located with access to the applicable grid infrastructure. Secondly, businesses must pay a fee to feed into the grid, which can challenge profitability depending on regional regulations. Thirdly, savings may be lost compared to self-consumption where the battery can, in combination with electricity arbitrage, exploit fluctuations in electricity prices to a greater extent.
4.4. Breakeven Analyses
Breakeven point analyses were performed comparing the best-case scenarios in terms of EM strategies (electricity arbitrage and local solar PV generation with self-consumption) and years within the study scope (either 2018 or 2019). Thus, the best-case scenarios for the three countries with the lowest (Norway), mid (Belgium), and highest (Spain) profitability potential are illustrated in Figure 4. Furthermore, the analyses compare investments in a new battery versus a second life battery and the range of estimated battery cycle lifetimes. The parameters are specified in Table 2.
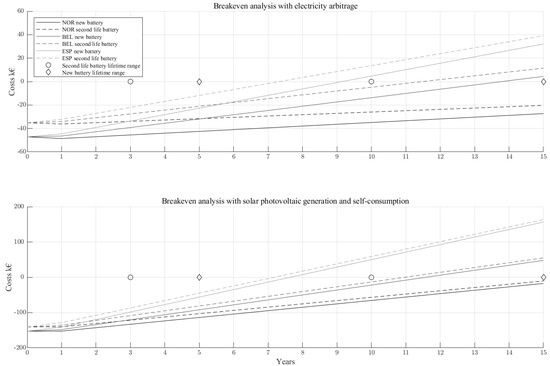
Figure 4.
Breakeven points for battery investment scenarios for Norway (NOR), Belgium (BEL), and Spain (ESP), and estimated cycle lifetime range for a new and second life battery.
Figure 4 shows how the battery CBM was measured in terms of practicality and economic viability. These findings reveal that applying the repurpose CBM (i.e., the second life battery) reduces the price, which results in a decreased payback time of 0.5 to 2 years. However, the second life battery lifetime range is estimated to be lower (3 to 10 years) for second life batteries than for new batteries (5 to 15 years). Table 4 presents the calculations for the estimated battery cycle lifetime ranges.
Table 4.
Calculation for expected battery cycle lifetime ranges.
The lowest payback time on BESS investment for EM strategy purposes is 7 years. This was found for solar PV generation with self-consumption with a second life or a new battery (lower graph in Figure 4) and electricity arbitrage with a second life battery (upper graph) in Spain. The most viable scenarios also showed the highest number of charge/discharge cycles and thus the shortest battery lifetime. These findings indicate that the battery lifetime of the most profitable scenarios can be less than 7 years. In such a case, a battery system investment is not recommended as costs will not be covered before the battery reaches EOL. Thus, the number of years before the manufacturer reaches profit of the BESS investment is high in relation to the estimated battery lifetime range.
As part of the breakeven analyses, the 2020 battery price parameter was exchanged with the future predicted 2030 price. The calculation model revealed that the number of years before reaching breakeven was not reduced. This indicates that the annual revenue is insignificant compared to the battery investment costs. Thus, the battery price reduction is not necessarily crucial for businesses when deciding whether to invest in a BESS. However, firstly, the minimum payback time may be reduced in scenarios with a larger battery. Secondly, the battery price reduction does reduce the payback years in some scenarios in this study, but not for the most economic viable shown in Figure 4.
As indicated, the larger battery equates to a higher price. Therefore, the battery size should not exceed the BESS’s needs. Size and capacity-to-power ratio should be thoroughly optimized for the BESS. If the battery does not have a sufficient capacity for the system, there will not be enough time to charge before the battery is in use again. For example, in an electricity arbitrage scenario when electricity prices are low over a certain period and the battery cannot store the available energy, economic savings might be hindered. Similarly, with local solar PV generation, the battery should have sufficient capacity to store the on-site generated energy.
Whether or not businesses invest in new or second life batteries can be determined by price [64], and this parameter can be crucial to outcompete new batteries [15]. Mathews et al. [15] found that the cost of a second life battery must be <60% of new batteries to achieve profitability. Despite that second life batteries are estimated to cost about half the price of a new battery [11], they do not ensure a profit, as illustrated in this study. Furthermore, future prices are uncertain and rely on several factors within technology, policy (societal and environmental), and economy. Technologically, it depends on (1) the primary consumption patterns (cycle lifetime), (2) requirements for the second life consumption, and (3) the number of years before the application (for example, EV) reaches EOL (calendar lifetime) [9]. Legislative incentives can stimulate a second life market [13]; however, the most recent EU battery regulation implies that market mechanisms shall determine commercial activities for second life batteries [65]. Large volumes of spent batteries from mobile applications due to strategic electrification of the transport sector are expected to reduce battery prices [66] and boost competitiveness for batteries for stationary storage [7]. Hence, the processed volumes will grow, and prices can decrease [11] due to reduced costs of refurbishing, as an example. However, the large volumes of LIBs in EVs are still in use on the road and it is currently challenging to predict future prices and the size of the second life market [9]. Additionally, affecting timing, there is a frequent assumption that a battery reaches first EOL when an EV battery reaches 80%; however, a remainder of 60% to 80% capacity is sufficient for most drivers [67,68]. Nevertheless, for second life batteries to outcompete new batteries, there needs to be an efficient quality system, including a regional collection system [69,70]. This is crucial for all CBMs for batteries [19]. Although such practice increases the selling price, it is vital to assure predictable, secure, and operational second life batteries.
5. Conclusions
In this work, the repurpose circular business model based on previous work is measured in terms of economic performance through a multiple scenario analysis with a case manufacturer as the basis for comparison. The battery simulation and economic analysis measured factors related to economic and circular viability of battery system investments for the business case. The simulation study was limited to seven European countries using four different strategies for the years 2018 and 2019. A breakeven-point assessment was chosen as a data analysis method to evaluate economic viability. Findings reveal diverging results for the different scenarios, and many are not economically viable. The results vary depending on if a new or second life battery is purchased, the battery system location, and the energy management strategies applied.
The breakeven analyses revealed that the shortest payback time among all scenarios is 7 years. This was revealed for solar PV generation with self-consumption (same for second life or new battery investment) and electricity arbitrage (with a second life battery) in Spain. The lifetime range based on estimated charge/discharge cycles was 5 to 15 years for a new battery and 3 to 10 years for a second life battery. The most profitable scenarios also showed the highest number of cycles, which indicates a lifetime potentially less than 7 years, thus no economic benefits, especially for the second life battery scenarios. The results reflect 2020 battery prices, but for comparison, the estimated 2030 battery prices did not reduce the minimum years of payback time. However, for other circumstances, this will be dependent on the battery size as total investment costs increase with size. For system operators and grid developers, some energy management strategies with battery energy storage system investments can potentially displace other costs, such as power plants, given that the systems contribute to balance demand and supply. This can economically encourage offering of incentives for businesses investing in battery energy storage systems connected to the grid but requires further investigation. The battery industry applying circular business models should be aware of the customer market connected to energy management strategies, such as the case manufacturer in this study.
To maximize economic benefits, it is recommended to combine several energy management strategies, and a manufacturer’s electricity profile should be matched with the appropriate strategies. For example, load shifting is not considered valuable for manufacturers with low demand fluctuations during operation hours. Both load shifting and electricity arbitrage can be more beneficial for profiles experiencing peaks. With electricity arbitrage, lower regional electricity prices and fluctuations decreased battery activity and economic benefits. For businesses in regions with lower prices and fluctuations, there is not as much economic value to trade compared to regions with large variations during a day. For solar photovoltaic generation with self-consumption, a correlation between solar irradiation and economic savings was found. Thus, location is crucial for economic viability: High solar irradiation is beneficial for solar PV generation with self-consumption, and high electricity price and fluctuations is beneficial for the arbitrage strategy. Nevertheless, unidentifiable factors also affected the results for the different regions, illustrating the complexity of such techno-economic assessments.
The battery lifetime is an important parameter that will be shorter when the battery is more active per year. As illustrated in the breakeven analyses, the years of payback time must be lower than battery lifetime to reach economic viability, which this study shows is not always the case. It is therefore important to account for potential trade-offs between an active battery and its lifetime and years before reaching profit on the investment.
Investing in a second life battery reduced the payback time from 0.5 to 2 years due to lower investment cost. However, the battery needs quality assurance that includes a minimum battery lifetime that is longer than the years of payback time on the investment. This was not evident in all scenarios, and circular business models for batteries are not considered particularly more economic viable compared to new battery investment. Furthermore, most of the batteries stemming from electric vehicles are still in use on the road, the future second life battery market size is uncertain, and the price must be lower than for a new battery. The recent EU battery regulation did not allocate resources to enhance this market. Despite that, it may be environmentally preferable if second life batteries displace new batteries. Nevertheless, relevant policy makers should notice the potential of circular economy practice for batteries combined with energy management strategies. Through comparing a second life and a new battery investment, this study illustrates how a circular business model can be measured in terms of economic potential and compared to a traditional business model. Having assessed the economic potential, the environmental impact and consequences will be assessed next. Future research will use appropriate methodology to quantify and compare environmental consequences of the circular business model in multiple scenarios.
Author Contributions
B.W. and B.F. contributed equally to this work. All authors have read and agreed to the published version of the manuscript.
Funding
This research received no external funding.
Acknowledgments
The authors gratefully acknowledge the case manufacturer who provided valuable data and information. Solargis provided weather data for the seven countries, which is appreciated. The authors also thank Anne Gerd Imenes from the University of Agder for her advice on integration of local solar generation. The study is partly based on research done in the BATMAN project (Lithium ion batteries—Norwegian opportunities within sustainable end-of-life management, reuse, and new material streams) funded by the Norwegian Research Council and partners (NFR: BATMAN—299334). Furthermore, this work was supported by the Regionale Forskningsfond Agder (Ref. 321111, ELAG project). This research did not receive any specific grant from funding agencies in the public, commercial, or not-for-profit sectors.
Conflicts of Interest
The authors declare no conflict of interest. The supporting research projects had no role in the design of the study; in the collection, analyses, or interpretation of data; in the writing of the manuscript, or in the decision to publish the results.
References
- Finn, P.; Fitzpatrick, C. Demand side management of industrial electricity consumption: Promoting the use of renewable energy through real-time pricing. Appl. Energy 2014, 113, 11–21. [Google Scholar] [CrossRef]
- Moura, P.S.; de Almeida, A.T. The role of demand-side management in the grid integration of wind power. Appl. Energy 2010, 87, 2581–2588. [Google Scholar] [CrossRef]
- United Nations. Transforming Our World: The 2030 Agenda for Sustainable Development; United Nations: New York, NY, USA, 2015. [Google Scholar] [CrossRef]
- European Commission. Quarterly Report on European Electricity Markets with Focus on Energy Storage and 2019 Wholesale Prices; European Commission: Brussel, Belgium, 2019. [Google Scholar]
- Ericson, S.; Statwick, P. Opportunities for Battery Storage Technologies in Mexico. 2018. Available online: www.nrel.gov/publications (accessed on 14 December 2020).
- IEA. Battery Storage Is (Almost) Ready to Play the Flexibility Game; IEA: Paris, France, 2019. [Google Scholar]
- Khripko, D.; Morioka, S.N.; Evans, S.; Hesselbach, J.; de Carvalho, M.M. Demand Side Management within Industry: A Case Study for Sustainable Business Models. Procedia Manuf. 2017, 8, 270–277. [Google Scholar] [CrossRef]
- Olsson, L.; Fallahi, S.; Schnurr, M.; Diener, D.; Van Loon, P. Circular business models for extended EV battery life. Batteries 2018, 4, 57. [Google Scholar] [CrossRef] [Green Version]
- Martinez-Laserna, E.; Gandiaga, I.; Sarasketa-Zabala, E.; Badeda, J.; Stroe, D.I.; Swierczynski, M.; Goikoetxea, A. Battery second life: Hype, hope or reality? A critical review of the state of the art. Renew. Sustain. Energy Rev. 2018, 93, 701–718. [Google Scholar] [CrossRef]
- Jiao, N.; Evans, S. Secondary use of Electric Vehicle Batteries and Potential Impacts on Business Models. J. Ind. Prod. Eng. 2016, 33, 348–354. [Google Scholar] [CrossRef]
- Rallo, H.; Canals Casals, L.; De La Torre, D.; Reinhardt, R.; Marchante, C.; Amante, B. Lithium-ion battery 2nd life used as a stationary energy storage system: Ageing and economic analysis in two real cases. J. Clean. Prod. 2020, 272, 122584. [Google Scholar] [CrossRef]
- Yu, M.; Bai, B.; Xiong, S.; Liao, X. Evaluating environmental impacts and economic performance of remanufacturing electric vehicle lithium-ion batteries. J. Clean. Prod. 2021, 321, 128935. [Google Scholar] [CrossRef]
- Zhang, L.; Liu, Y.; Pang, B.; Sun, B.; Kokko, A. Second Use Value of China’s New Energy Vehicle Battery: A View Based on Multi-Scenario Simulation. Sustainability 2020, 12, 341. [Google Scholar] [CrossRef] [Green Version]
- Kamath, D.; Arsenault, R.; Kim, H.C.; Anctil, A. Economic and Environmental Feasibility of Second-Life Lithium-Ion Batteries as Fast-Charging Energy Storage. Environ. Sci. Technol. 2020, 54, 6878–6887. [Google Scholar] [CrossRef]
- Mathews, I.; Xu, B.; He, W.; Barreto, V.; Buonassisi, T.; Peters, I.M. Technoeconomic model of second-life batteries for utility-scale solar considering calendar and cycle aging. Appl. Energy 2020, 269, 115127. [Google Scholar] [CrossRef]
- Lüdeke-Freund, F.; Gold, S.; Bocken, N.M.P. A Review and Typology of Circular Economy Business Model Patterns. J. Ind. Ecol. 2019, 23, 36–61. [Google Scholar] [CrossRef] [Green Version]
- Bocken, N.; Miller, K.; Evans, S. Assessing the environmental impact of new Circular business models. In Proceedings of the Conference “New Business Models”—Exploring a Changing View on Organizing Value Creation, Toulouse, France, 16–17 June 2016; p. 17. [Google Scholar]
- Geissdoerfer, M.; Morioka, S.N.; de Carvalho, M.M.; Evans, S. Business models and supply chains for the circular economy. J. Clean. Prod. 2018, 190, 712–721. [Google Scholar] [CrossRef]
- Wrålsen, B.; Prieto-Sandoval, V.; Mejia-Villa, A.; O’Born, R.; Hellström, M.; Faessler, B. Circular business models for lithium-ion batteries—Stakeholders, barriers, and drivers. J. Clean. Prod. 2021, 317, 128393. [Google Scholar] [CrossRef]
- Braeuer, F.; Rominger, J.; McKenna, R.; Fichtner, W. Battery storage systems: An economic model-based analysis of parallel revenue streams and general implications for industry. Appl. Energy 2019, 239, 1424–1440. [Google Scholar] [CrossRef]
- Xu, B.; Nayak, A.; Gray, D.; Ouenniche, J. Assessing energy business cases implemented in the North Sea Region and strategy recommendations. Appl. Energy 2016, 172, 360–371. [Google Scholar] [CrossRef]
- Lombardi, P.; Schwabe, F. Sharing economy as a new business model for energy storage systems. Appl. Energy 2017, 188, 485–496. [Google Scholar] [CrossRef]
- Zink, T.; Geyer, R. Circular Economy Rebound. J. Ind. Ecol. 2017, 21, 593–602. [Google Scholar] [CrossRef]
- Saidani, M.; Yannou, B.; Leroy, Y.; Cluzel, F.; Kendall, A. A taxonomy of circular economy indicators. J. Clean. Prod. 2019, 207, 542–559. [Google Scholar] [CrossRef] [Green Version]
- Rossi, E.; Bertassini, A.C.; dos Santos Ferreira, C.; do Amaral, W.A.N.; Ometto, A.R. Circular economy indicators for organizations considering sustainability and business models: Plastic, textile and electro-electronic cases. J. Clean. Prod. 2020, 247, 119137. [Google Scholar] [CrossRef]
- Faessler, B.; Bogunović Jakobsen, A. Autonomous Operation of Stationary Battery Energy Storage Systems—Optimal Storage Design and Economic Potential. Energies 2021, 14, 1333. [Google Scholar] [CrossRef]
- Winslow, K.M.; Laux, S.J.; Townsend, T.G. A review on the growing concern and potential management strategies of waste lithium-ion batteries. Resour. Conserv. Recycl. 2018, 129, 263–277. [Google Scholar] [CrossRef]
- Cazzola, P.; Gorner, M.; Schuitmaker, R.; Maroney, E. Global EV Outlook 2020; IEA: Paris, France, 2020. [Google Scholar]
- Alliance, G.B. A Vision for a Sustainable Battery Value Chain in 2030 Unlocking the Full Potential to Power Sustainable Development and Climate Change Mitigation; World Economic Forum: Geneva, Switzerland, 2019. [Google Scholar]
- Bocken, N.M.P.; Short, S.W.; Rana, P.; Evans, S. A literature and practice review to develop sustainable business model archetypes. J. Clean. Prod. 2014, 65, 42–56. [Google Scholar] [CrossRef] [Green Version]
- Ahmadi, L.; Yip, A.; Fowler, M.; Young, S.B.; Fraser, R.A. Environmental feasibility of re-use of electric vehicle batteries. Sustain. Energy Technol. Assess. 2014, 6, 64–74. [Google Scholar] [CrossRef]
- Guldmann, E.; Huulgaard, R.D. Barriers to circular business model innovation: A multiple-case study. J. Clean. Prod. 2020, 243, 118160. [Google Scholar] [CrossRef]
- Shafer, S.M.; Smith, H.J.; Linder, J.C. The power of business models. Bus. Horiz. 2005, 48, 199–207. [Google Scholar] [CrossRef]
- Zakeri, B.; Syri, S. Electrical energy storage systems: A comparative life cycle cost analysis. Renew. Sustain. Energy Rev. 2015, 42, 569–596. [Google Scholar] [CrossRef]
- Henz, V. Battery Pack Prices Cited Below $100/kWh for the First Time in 2020, While Market Average Sits at $137/kWh; BloombergNEF: New York, NY, USA, 2020. [Google Scholar]
- BloombergNEF. Hitting the EV Inflection Point. 2021. Available online: https://www.transportenvironment.org/publications/hitting-ev-inflection-point (accessed on 10 June 2021).
- Tsiropoulos, I.; Tarvydas, D.; Lebedeva, N. Li-Ion Batteries for Mobility and Stationary Storage Applications—Scenarios for Costs and Market Growth; European Commission: Brussels, Belgium; Luxembourg, 2018; ISBN 9789279972546. [Google Scholar]
- Few, S.; Schmidt, O.; Offer, G.J.; Brandon, N.; Nelson, J.; Gambhir, A. Prospective improvements in cost and cycle life of off-grid lithium-ion battery packs: An analysis informed by expert elicitations. Energy Policy 2018, 114, 578–590. [Google Scholar] [CrossRef]
- Ekren, O.; Ekren, B.Y.; Ozerdem, B. Break-even analysis and size optimization of a PV/wind hybrid energy conversion system with battery storage—A case study. Appl. Energy 2009, 86, 1043–1054. [Google Scholar] [CrossRef] [Green Version]
- IEA. Solar PV. 2020. Available online: https://www.iea.org/reports/solar-pv (accessed on 10 November 2020).
- IRENA. Electricity Storage and Renewables: Costs and Markets to 2030. 2017. Available online: https://www.irena.org/-/media/Files/IRENA/Agency/Publication/2017/Oct/IRENA_Electricity_Storage_Costs_2017_Summary.pdf (accessed on 10 November 2020).
- Kamath, D.; Shukla, S.; Arsenault, R.; Kim, H.C.; Anctil, A. Evaluating the cost and carbon footprint of second-life electric vehicle batteries in residential and utility-level applications. Waste Manag. 2020, 113, 497–507. [Google Scholar] [CrossRef]
- BloombergNEF. New Energy Outlook 2020. 2020. Available online: https://www.statkraft.com/globalassets/0/.com/newsroom/2020/new-energy-outlook-2020.pdf (accessed on 4 March 2021).
- Kavlak, G.; McNerney, J.; Trancik, J.E. Evaluating the causes of cost reduction in photovoltaic modules. Energy Policy 2018, 123, 700–710. [Google Scholar] [CrossRef] [Green Version]
- pvXchange Market Analysis: March 2021—The Ideal Solar Panel Format. Available online: https://www.pvxchange.com/Market-Analysis-March-2021-The-ideal-solar-panel-format (accessed on 10 March 2021).
- Abu-Rumman, A.K.; Muslih, I.; Barghash, M.A. Life Cycle Costing of PV Generation System. J. Appl. Res. Ind. Eng. 2017, 4, 252–258. [Google Scholar] [CrossRef]
- Jo, B.-K.; Jung, S.; Jang, G. Feasibility Analysis of Behind-the-Meter Energy Storage System According to Public Policy on an Electricity Charge Discount Program. Sustainability 2019, 11, 186. [Google Scholar] [CrossRef] [Green Version]
- Braco, E.; San Martín, I.; Berrueta, A.; Sanchis, P.; Ursúa, A. Experimental assessment of cycling ageing of lithium-ion second-life batteries from electric vehicles. J. Energy Storage 2020, 32, 101695. [Google Scholar] [CrossRef]
- Dufo-López, R.; Bernal-Agustín, J.L. Techno-economic analysis of grid-connected battery storage. Energy Convers. Manag. 2015, 91, 394–404. [Google Scholar] [CrossRef]
- IEA. Renewables. Paris. 2020. Available online: https://www.iea.org/reports/renewables-2020 (accessed on 2 February 2021).
- Tong, S.; Fung, T.; Klein, M.P.; Weisbach, D.A.; Park, J.W. Demonstration of reusing electric vehicle battery for solar energy storage and demand side management. J. Energy Storage 2017, 11, 200–210. [Google Scholar] [CrossRef]
- PVsyst, “PVsyst 7.0.” PVsyst, Satigny. 2020. Available online: https://www.pvsyst.com/ (accessed on 3 October 2020).
- Solargis. Weather data. 2020. Available online: https://solargis.info/ (accessed on 6 October 2020).
- Case, Electricity Profile. 2020. Available online: https://www.energinet.net/site/login (accessed on 20 February 2020).
- Kay, G. E-mail communication Bloomberg: Battery pack scope. 2021. [Google Scholar]
- Lugo-Laguna, D.; Arcos-Vargas, A.; Nuñez-Hernandez, F. A European Assessment of the Solar Energy Cost: Key Factors and Optimal Technology. Sustainability 2021, 13, 3238. [Google Scholar] [CrossRef]
- ENTSO-E. Entsoe Transparancy Platform. Day-Ahead Electricity Prices in Europe. 2019. Available online: https://transparency.entsoe.eu/dashboard/show (accessed on 7 September 2020).
- Morningstar. Google Currency Converter. 2021. Available online: https://www.google.com/finance/quote/MORN:NASDAQ?hl=en (accessed on 5 March 2021).
- MATLAB. MATLAB 2020a; The MathWorks Inc.: Natick, MA, USA, 2020. [Google Scholar]
- Microsoft. Microsoft Excel Spreadsheet Software; Microsoft: Washington, DC, USA, 2021. [Google Scholar]
- European Commission. Energy Prices and Costs in Europe; European Commission: Brussel, Belgium, 2020; Available online: https://eur-lex.europa.eu/legal-content/EN/TXT/?qid=1602774170631&uri=CELEX:52020DC0951 (accessed on 8 March 2021).
- Amelang, S.; Appunn, K. The Causes and Effects of Negative Power Prices. Clean Energy Wire. 2018. Available online: https://www.cleanenergywire.org/factsheets/why-power-prices-turn-negative (accessed on 20 March 2021).
- Fanone, E.; Gamba, A.; Prokopczuk, M. The case of negative day-ahead electricity prices. Energy Econ. 2013, 35, 22–34. [Google Scholar] [CrossRef]
- Song, Z.; Feng, S.; Zhang, L.; Hu, Z.; Hu, X.; Yao, R. Economy analysis of second-life battery in wind power systems considering battery degradation in dynamic processes: Real case scenarios. Appl. Energy 2019, 251, 113411. [Google Scholar] [CrossRef]
- European Commission. Commission Staff Working Document on the Evaluation of the Directive 2006/66/EC on Batteries and Accumulators and Waste Batteries and Accumulators and Repealing Directive 91/157/EEC; European Commission, Ed.; European Commission: Brussels, Belgium; Luxembourg, 2019. [Google Scholar]
- Drabik, E.; Rizos, V. Prospects for Electric Vehicle Batteries in a Circular Economy; Centre for European Policy Studies: Brussels, Belgium, 2018; Available online: https://www.ceps.eu/ceps-publications/prospects-end-life-electric-vehicle-batteries-circular-economy/ (accessed on 20 March 2021).
- Hossain, E.; Murtaugh, D.; Mody, J.; Faruque, H.M.R.; Sunny, M.S.H.; Mohammad, N. A Comprehensive Review on Second-Life Batteries: Current State, Manufacturing Considerations, Applications, Impacts, Barriers Potential Solutions, Business Strategies, and Policies; IEEE: Piscataway, NJ, USA, 2019; Volume 7, pp. 73215–73252. [Google Scholar]
- Xu, C.; Dai, Q.; Gaines, L.; Hu, M.; Tukker, A.; Steubing, B. Future material demand for automotive lithium-based batteries. Commun. Mater. 2020, 1, 99. [Google Scholar] [CrossRef]
- Hellström, M.; Wrålsen, B. Modeling Business Ecosystems for Spent Lithium-Ion Batteries; University of Agder: Grimstad, Norway, 2020. [Google Scholar]
- Silvia, B.; Andreas, P.; DI Persio, F.; Maarten, M.; Paolo, T.; Cusenza, M.; Umberto, E.; Fabrice, M. Sustainability Assessment of Second Life Application of Automotive Batteries (SASLAB): JRC Exploratory Research (2016–2017): Final Technical Report: August 2018; European Commission: Brussels, Belgium; Luxembourg, 2018. [Google Scholar]
Publisher’s Note: MDPI stays neutral with regard to jurisdictional claims in published maps and institutional affiliations. |
© 2022 by the authors. Licensee MDPI, Basel, Switzerland. This article is an open access article distributed under the terms and conditions of the Creative Commons Attribution (CC BY) license (https://creativecommons.org/licenses/by/4.0/).