1. Introduction
Lithium-based rechargeable intercalation compounds have dominated commercial rechargeable batteries for decades [
1,
2]; however, the fast capacity fading caused by irreversible phase transitions in the cathode has been one of the key obstacles for further developing advanced rechargeable batteries [
3,
4]. The irreversible phase transitions, induced by the insertion/de-insertion of lithium ions, will permanently destroy the insertion host [
5,
6], leading to a severe restriction on the commercialization of many promising electrode materials, especially for high energy density multi-electron intercalation compounds cathodes, such as MoO
3, V
2O
5 and CuF
2 with reactions of more than one lithium per transition metal (Li/TM > 1, TM represents the transition metal) [
7,
8,
9]. To achieve long cycling, many strategies have been applied [
10,
11,
12]. The most straightforward solution is battery operation under limited voltage in the reversible region. For example, the reversible capacity is limited to 140 mAh/g, only half of the theoretical capacity, where the LiCoO
2 operates between 3.0 V and 4.2 V, corresponding to the insertion and de-insertion of about 0.5 Li per LiCoO
2 [
13]. Similarly, the Li/TM ratio is limited to 1.0 or 0.5 at voltage windows of 2.0–4.0 or 2.8–4.0 V in V
2O
5, due to the irreversible phase transitions within the potential window of 1.5–4.0 V with a ratio of 1.5 [
14,
15]. However, this approach does not fundamentally resolve the irreversible phase transitions and leads to large sacrifice of capacity. Moreover, capacity fading could also be observed even under limited voltage windows in the reversible region in some cathodes, which indicates that potential lattice damages may occur even under reversible intercalation/deintercalation reactions by other underlying mechanisms [
16,
17]. Thus, it is urgent not only to reveal the capacity fading mechanisms but also to find out the strategy to fundamentally solve this obstruction, while simultaneously maintaining long cycling and high energy density.
To achieve this, ion or molecule intercalation is proposed as an optimization strategy [
18,
19]. For example, researchers demonstrated that V
2O
5·
nH
2O xerogel exhibits enhanced capacity retention compared to pure V
2O
5, due to the enlarged expansion of the V-O interlayer spacing by the structural water [
20]. Cu or Li ions could also be pre-inserted into V
2O
5 or MoO
3 to improve the cycling stability [
21,
22]. Recently, the Zhao et al. and Xu et al. extended the pre-intercalation species from lithium ions to alkali metal and alkali-earth metal ions [
23,
24]. These studies show that the modified layered materials with ion or molecule pre-intercalation maintained better electrochemical properties compared with their original forms. The pre-intercalated materials own nearly 95% of their original capacity compared to 37.6% for pristine V
2O
5 after 100 cycles at 0.1 A/g. Different from the conventional two-phase reaction and solid-state reaction in LIBs, the discontinuous or continuous change in lattice parameters may be good for batteries. Although crystal characterization and modeling has revealed that appropriate pre-intercalation yields a stable interlayer expansion at the sample’s initial state, which may restrain an intrinsic irreversible phase transition via facilitating a smooth structure change, a dynamic analysis of the structure–property relationship is still required for understanding the complete optimization mechanism.
In this work, vanadium pentoxide and its alkali ion-stabilized intercalation compounds (A-V-O, A = Li, Na, K, Li
0.33V
2O
5, Na
0.33V
2O
5 and K
0.33V
2O
5) are selected as prototypes. To provide direct dynamic evidence with high spatio-temporal resolution, operando characterization techniques are used. With the help of in situ X-ray diffraction (XRD) and in situ Raman spectroscopy, the phase transitions, volume change of the lattice and chemical bond vibrations can be observed directly in the electrochemical process to reveal the underlying mechanism (
Figure S1, Supporting Information).
3. Results and Discussion
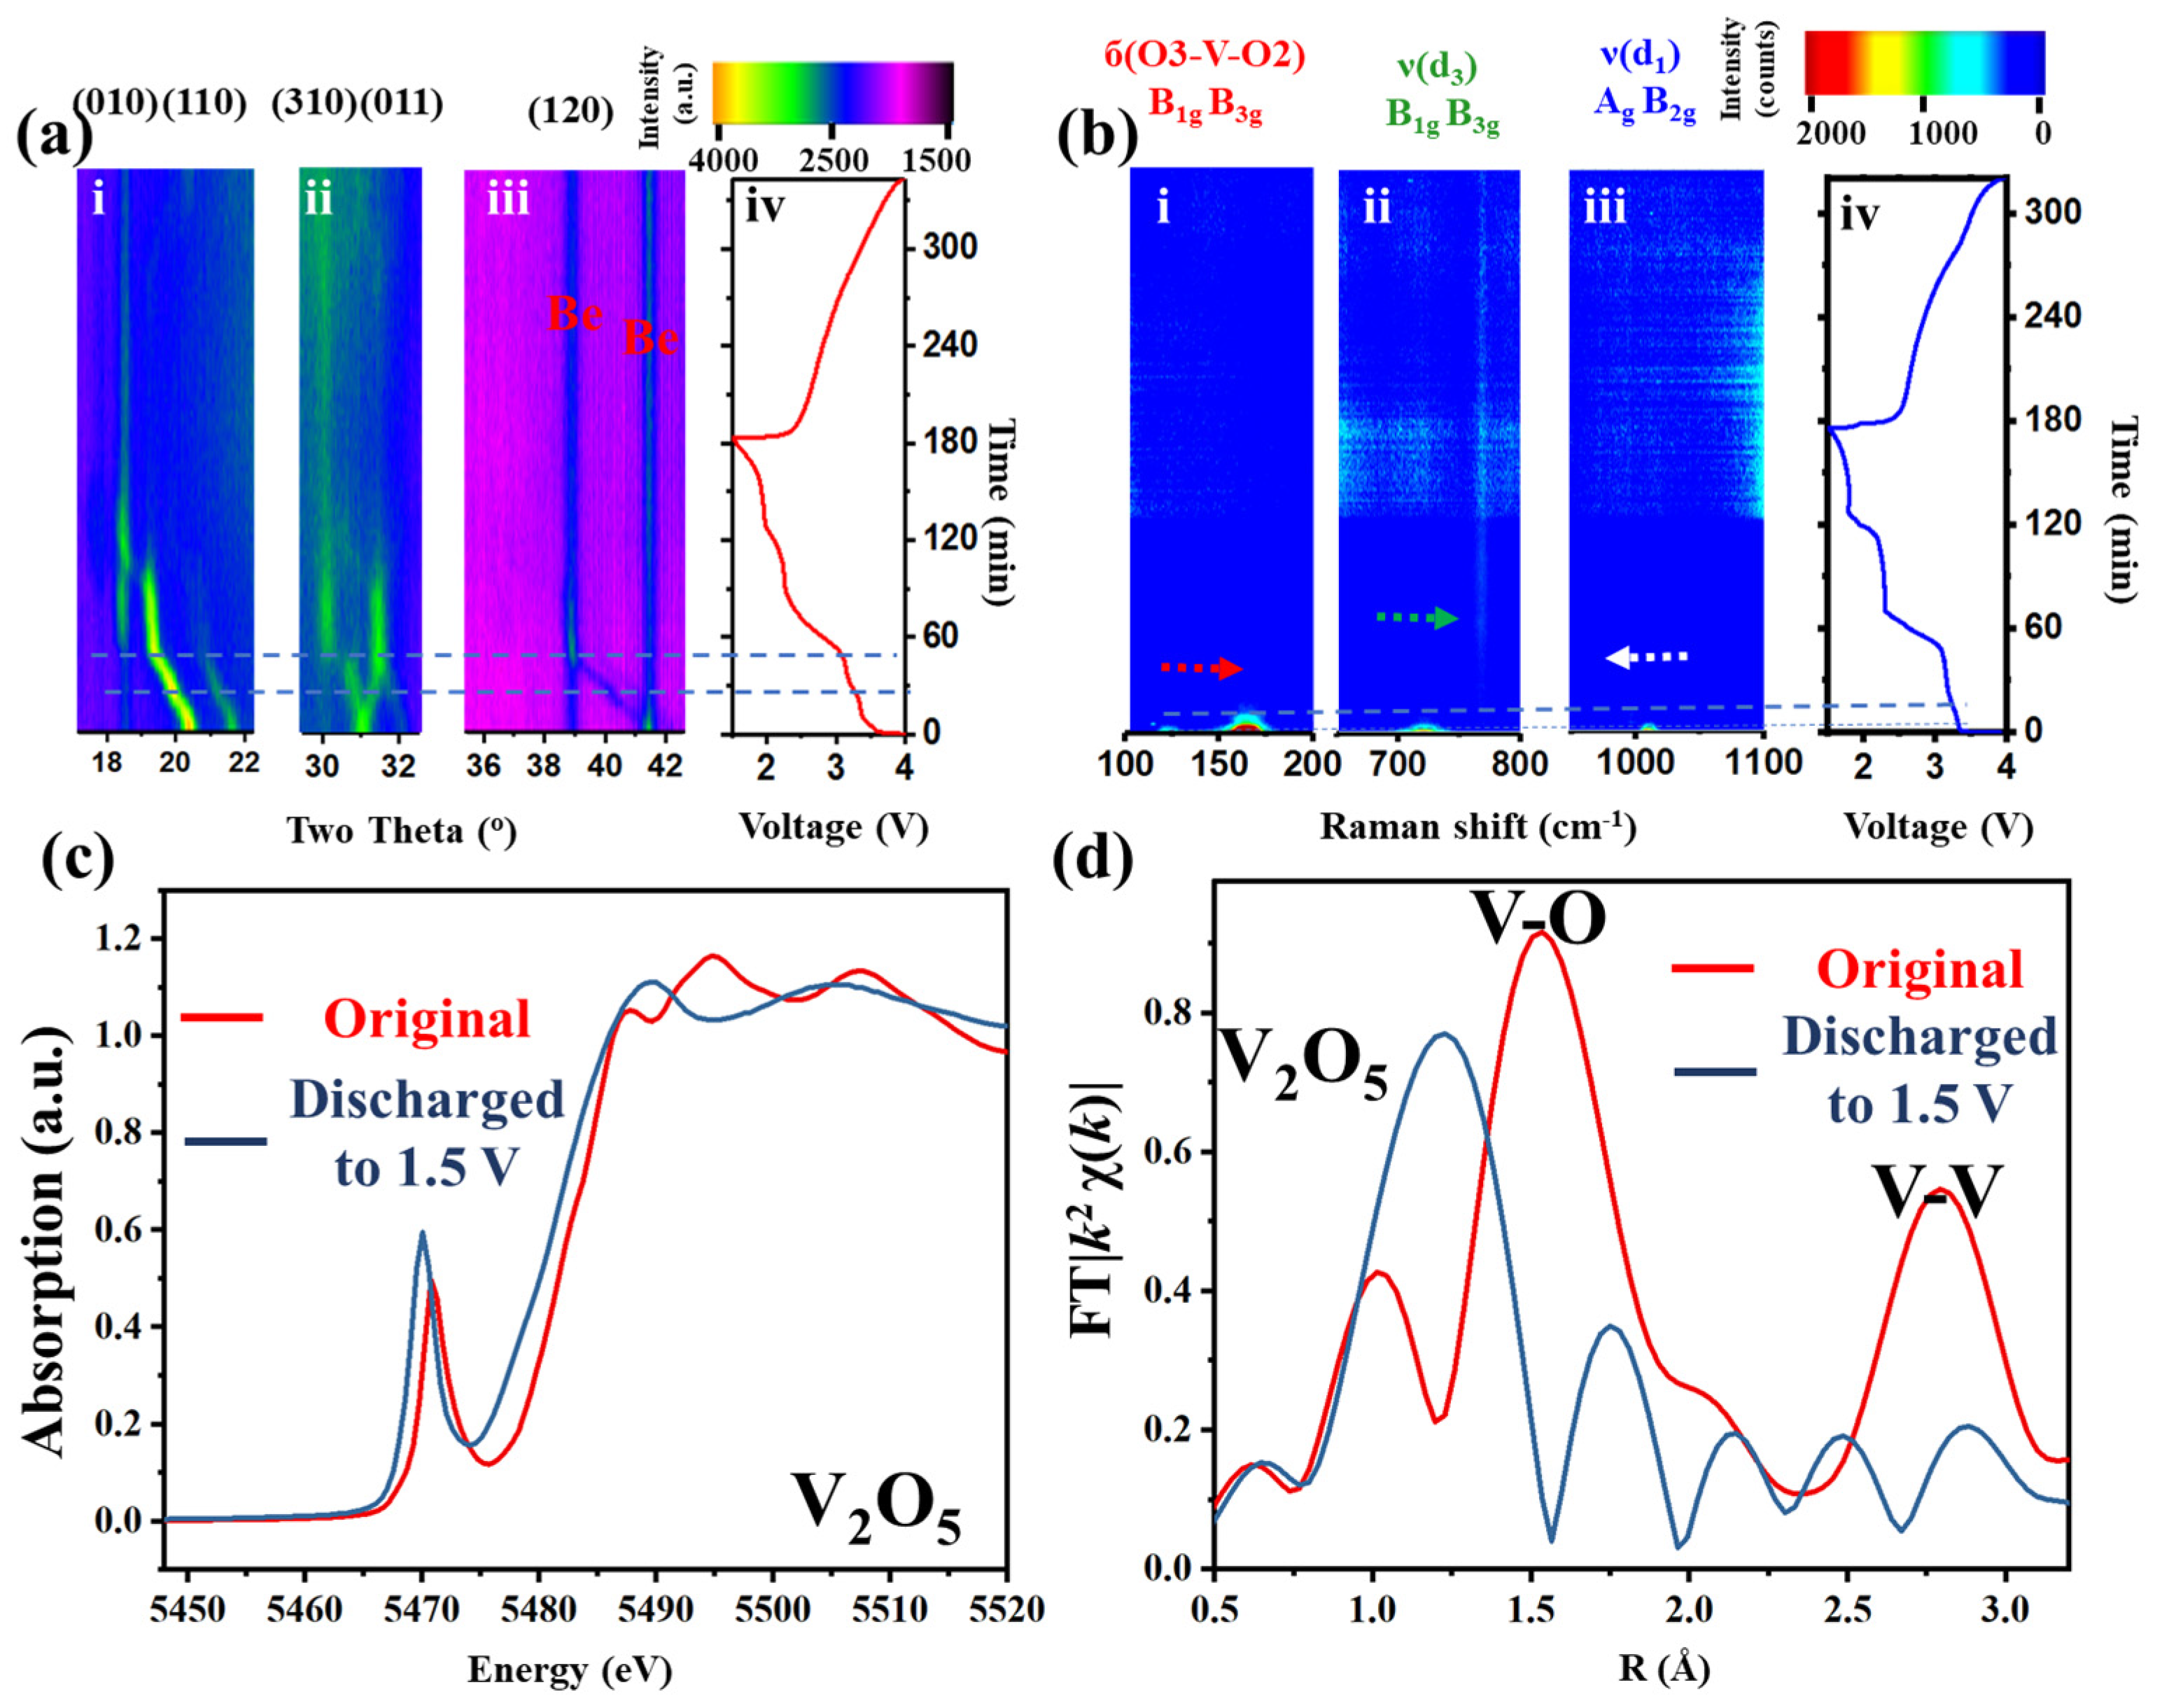
V
2O
5 was first synthesized and characterized by both ex situ and in situ methods (
Figure 1 and
Figures S2 and S3, Supporting Information). The original and refined XRD patterns (
Figure S2) show a typical triclinic V
2O
5 with lattice parameters of a, b, and c being 11.5, 4.37, and 3.56 Å, respectively. To acquire the relationship between the electrochemical properties and the structure, lithium ion batteries with the synthesized V
2O
5 as the cathode were assembled in a homemade in situ test cell. In situ XRD was employed during the discharge–charge process within the voltage window of 1.5–4.0 V under a current density of 100 mA g
−1 (
Figure 1a). Three prominent regions (010, 110; 310, 011; and 120 lattice planes,
Figure 1(a-i–iii), respectively) are selected in the two-dimensional (2D) XRD patterns to track the lattice changes or phase transitions. During the first discharge or lithium insertion process (0–180 min,
Figure 1(a-i–iii)), a continuous left shift of all peaks (except for a right shift at 31°) can be observed (ca. 0–55 min), followed by a continuous vertical plateau (at 19°, 32° and 39°, ca. 55–90 min,) and additional discontinuous plateau (18°, 30°, ca. 55–90 min). During the charge/lithium desertion process (180–340 min), all peaks blur without obvious transitions. Similar phenomena can also be observed in the in situ cyclic voltammetry (CV)–XRD measurement (
Figure S4, Supporting Information). These results indicate that lithium insertion into the intralayer and interlayer of the crystal structure has damaged the long-range order, resulting in the absence of diffraction peaks.
In situ Raman tests were further conducted to acquire the short-range order change during charge–discharge (633 nm wavelength laser) (
Figure 1(b-i–iv)). Three characteristic vibration bands, at 150, 700 and 1000 cm
−1, highlighted in
Figure S3, were selected to represent the vibration changes. At the beginning of lithium insertion, the Raman bands of б(O3-V-O2) and ν(d
3) yield a blue shift, while ν(d
1) shows a red shift (0–10 min) [
25]. The intensity then declines to very blur (ca. 10–20 min). Finally, no intensity can be observed in the spectrum until the accomplishment of the whole cycle. The loss of the XRD signal implies the loss of the long-range order. The disappearance of the Raman signals indicates a different V-O structure.
However, the local structure variations of the V-O pyramid and the oxidation state of the transition metal are not clearly interpreted. To achieve this, X-ray absorption fine structure (XAFS), including X-ray absorption near edge structure (XANES,
Figure 1c) and extended XAFS (EXAFS,
Figure 1d), was conducted to enquire the local electronic structure and atomic geometry changes around the V atoms. The pre-edge peak at ca. 5471.2 eV (
Figure 1c), which is dominated by the 1s
→ εp dipole and 1s
→ 3d quadrupole transitions of vanadium [
26], shifts to a lower energy after lithium insertion. The number of peaks after edge (5485–5515 eV) changes from 3 to 2. These indicate changes of the spatial symmetry in the crystal and the reduction of V to a lower oxidation state, associated with the distortion of the coordinating polyhedron. The EXAFS (
Figure 1d) shows the intensity and distance changes of peaks at around 1.5 and 2.8 Å, which correspond to the distance and strength changes of the V-O and V-V bond, respectively [
27]. After discharge, the V-O distance and intensity show a longer and weaker trend, while the V-V distance and intensity tend to be shorter and weaker. This means that after discharge, the V-O bond-based intralayer structure becomes more disordered with a more expanded VO
6 pyramid and the V-V bond, as a conjunction or ladder of each polyhedron or layer-based interlayer structure, gets more puckered.
Combining these techniques, it can be concluded that excess lithium ions inserted into both the interlayer and intralayer of V
2O
5 cause the highly ordered crystal of V
2O
5 to irreversibly transfer to disordered in both short- and long-range. This structure degradation will result in the loss of stable cyclability and high specific capacity [
13].
To overcome the above issues, different alkali ions A
+ (A = Li, Na, K) were intercalated into the V-O skeleton to form the thermodynamically stable A-V-O. The as-synthesized A-V-O owns the same space group of C 2/m and nearly the same crystal parameters of
a,
b,
c and
β, which is concluded from the refined XRD patterns (
Figure 2a,c,e). The refined XRD patterns, together with the high-resolution transmission electron microscopy (HRTEM) images and modeling (
Figure S5, Supporting Information), reveal that alkali ion intercalation yields a clear interlayer expansion at the sample’s initial state. In addition, during the anodic process, the A-V-O presents negligible formation of the irreversible phase (the
ɷ phase) based on the CV curves of V
2O
5 and A-V-O (
Figure S6, Supporting Information). Different from rapid capacity fading of V
2O
5, the alkali ion-stabilized intercalation compounds (A-V-O, A = Li, Na, K) yield a dramatic enhancement in cyclability (
Figure S7d, Supporting Information). This indicates that the ion-stabilized A-V-O owns a better reversibility and prevents the formation of the
ɷ phase. To understand the phase transitions, an in situ CV–XRD measurement (
Figure 2b,d,f) and in situ galvanostatic charge/discharge (
Figure S8, Supporting Information) were conducted first. Three prominent regions of 11–13°, 27.5–31° and 40–43°, corresponding to the diffraction planes of (200), (401) and (40
), and (601), respectively, are selected particularly because of the relatively high intensity and the reflective function of lattice variations. For the three cathodes, there are three types of sites that Li ions can occupy, named M1, M2, and M3 (
Figure S9, Supporting Information) [
28,
29]. In every unit cell, ions are located at four interstitial sites inside the tunnels along the b-axis, occupying half of the M1 sites. Additionally, the tunnel structure holds two other sites: four eight-coordinated sites (M2) and four tetrahedral sites (M3).
Li-V-O (
Figure 2(b-iv)) and Na-V-O (
Figure 2(d-iv)) present nearly the same in situ CV curves compared with K-V-O (
Figure 2(f-iv)), where there are several pairs of obvious redox peaks compared with the inconspicuous ones. The 2D XRD patterns of Li-V-O (
Figure 2(b-i–iii)) and Na-V-O (
Figure 2(d-i–iii)) show nearly the same variation trend in contrast with that of K-V-O (
Figure 2(f-i–iii)). Here, the phase transitions of Li-V-O and Na-V-O are discussed first.
In the CV curves of Li-V-O and Na-V-O, four distinct cathodic peaks, located at about 3.2, 2.8, 2.3 and 1.9 V (
Figure 2(b-iv,d-iv) and
Figure S6b,c), corresponding to four electrochemical reactions, are observed. Firstly, as the anodic process occurs, when the voltage reaches 3.2 V (
Figure S6), all the selected XRD peaks (
Figure 2(b-i–iii,f-i–iii)) of Li-V-O and Na-V-O continuously shift to lower two theta angles. It can be concluded that the four diffraction planes (200), (401), (403) and (601) present a slight expansion of the interlayer and intralayer spacing. Further analysis proves that half of the M3 sites are occupied preferentially with 0 < x < 0.33 to form Li
xLi
0.33V
2O
5 and Li
xNa
0.33V
2O
5 (
Figures S10 and S11, Supporting Information). The formed Li
0.33V
2O
5 during lithium intercalation is not a very stable phase, and it forms under a specific current and potential. As for Li-V-O, during preparation, the Li-V-O is sintered, thus, making it a very stable phase. Secondly, with more Li ions intercalated (0.33 < x < 0.66), the abovementioned peaks undergo an abrupt or discontinuous shift to a higher angle until about 2.8 V, indicating a significant contraction of the interlayer and intralayer spacing, probably generated by the Columbic force between O and Li, which is called the lattice breathing [
30]. The lithium-ion insertion into the crystal will enlarge the layer. However, owing to the electron and ion in the layer that are not well paired, when guest ion insertion occurs, the electrons and ions will restack, thus causing the abnormal volume change. At this state, the inserted lithium occupies half of the M2 sites to form a more condense state. Thirdly, for the largest CV peak located at 2.3 V, all the XRD peaks shift to lower two theta angles with a descent of the peak intensities, which corresponds to the filling of all remaining sites in M2, and M3, with 0.66 < x < 1.67 in Li
xLi
0.33V
2O
5 and Li
xNa
0.33V
2O
5. Previous work [
28,
29] proves that M1 site is also filled during this period. Here, with such a large number of Li ions in the host structure, repulsive force dominates and the interlayer spacing expands. In the last intercalation part, a relatively small cathodic peak appears at 1.9 V, and the (200) peak shifts to a lower angle. For Li/Na-V-O, lithium ions replace sodium ions in this process (1.67 < x < 2) and are insert into the not inserted sites, which leads to contraction along the a-axis. For the following anodic scanning, four peaks at 2.6, 3.0, 3.1 and 3.4 V are observed, all related to the de-intercalation of lithium ions [
31].
For K-V-O, during cathodic scanning (
Figure 2(f-iv)), two distinct peaks, located at 2.2 V and 2.6 V, and two broad peaks can be observed. For anodic scanning, one broad peak, which represents the four reactions, occupies this voltage region in the CV curves, which are much different from those of Na-V-O and Li-V-O. As for the 2D XRD of K-V-O during the anodic and cathodic process, the diffraction peak of (200) (
Figure 2(f-i)) shows a discontinuous transition, which is nearly the same with Na-V-O and Li-V-O. The (601) plane (
Figure 2(f-iii)) shows a nearly discontinuous shift trend. However, the peak around 29°, representing the diffraction plane (401), presents a continuous transition (
Figure 2(f-ii)) with the least amplitude and position variations compared with Na-V-O and Li-V-O during the cathodic and anodic process. Thus, the continuous–discontinuous lattice transition was first observed via in situ CV–XRD tests in K-V-O. All these imply a different reaction mechanism of K-V-O. As in K-V-O, the different K:V ratios show an impact on the structure and the performance in batteries. K will form connections either with the terminal or skeleton oxygen in the layers, which may introduce the synergistic effect [
32].
To analyze these phase transitions in detail, Total Pattern Solution (TOPAS) was introduced to achieve Rietveld XRD refinement and determine the structure evolutions of Li-V-O (
Figure S10, Supporting Information), Na-V-O (
Figure S11, Supporting Information) and K-V-O (
Figure 3). In the discharge process, four prominent phase transformations can be obtained with different lithium insertion amounts. The original phase can be assigned to K
0.33V
2O
5 (
Figure 3(a-i)) without lithium insertion. With the insertion of lithium ions, the two peaks around 20 and 36° shift to lower angles with little lattice expansion in the a-axis and the phase transforms to Li
0.44K
0.33V
2O
5 (
Figure 3(a-ii)). Moreover, the intensity of the diffraction peaks becomes less strong, with about another 0.2 lithium ion inserted to form Li
0.81K
0.33V
2O
5 (
Figure 3(a-iii)). In the meantime, the main V-O skeleton structure is still maintained, although with little structure shrink, which is due to the lattice breathing phenomenon. However, as more lithium enters the host crystal, the peaks around 20 and 40° split, leading to a structure with larger variation. As for the deeper lithium insertion at 1.5 V (at which the Li:V is higher than 1.5), the main peaks in the XRD patterns still have a relatively high intensity, which means that the final product is still crystallized. The XRD refinement and tests prove that Li
1.41K
0.33V
2O
5 (
Figure 3(a-iv)) transforms to Li
2.24K
0.33V
2O
5 (
Figure 3(a-v)) at this period. In addition, the XRD refinement proves that the de-lithiation process in K-V-O shows little migration of the K ions, which can be treated as self-adaption of the distinguished structure.
To estimate the fluctuation of phase transitions, the cell volume changes over the lithium-intercalation process are summarized, and the maximum changes are 15% for Li-V-O, 11% for Na-V-O and 5% for K-V-O (
Figure 3b). This result indicates that during lithium insertion/de-insertion, K-V-O undergoes the least volume change, which is beneficial for a better cyclability. The above proves that A-V-O, especially K-V-O, obtains a more stable structure during the electrochemical process, which indicates that the pre-intercalation compounds hinder the irreversible phase transition, as well as maintain long-cycle performance.
It should be noted that, different from the previous study, the K-ion-stabilized vanadium pentoxide shows a continuous lattice transition with a smooth lattice change (the (401) lattice plane,
Figure 3c) during lithium intercalation/deintercalation, while Na/Li-ion pre-intercalated compounds yield continuous lattice transitions. As for the (200) lattice plane of the ladder layer, it transforms discontinuously. The discontinuous transition usually originates from the fast diffusion channel. It can be concluded that K-V-O can diffuse lithium ions as quickly as Na-V-O and Li-V-O in the interlayer. The (401) lattice plane that goes through the nearest V-O skeleton that can represent the variations of the stability of the structure host, undergoes a continuous lattice transition process. The continuous transition usually originates from a sluggish transition, which implies that K-V-O prevents lithium ions from being quickly inserted into the intralayer. The insertion of lithium ions into the intralayer will damage the V-O skeleton, which may further destroy the battery life. The capturing of the coupled discontinuous-continuous phase transitions in K-V-O indicates that the compounds can store the lithium ions, and also reserve a relatively more stable host structure.
This kind of layer structure can store about 1.5 lithium per vanadium. However, when the amount of stored lithium is over 1.5, vanadium oxide will serve as an anode, like the Cu or Fe based materials [
33,
34]. The pre-insertion strategy in this paper aims to store about 1 lithium per vanadium, which is a very good choice considering the capacity loss. In addition, when the discharge voltage is limited to 2.0, the capacity fading will be alleviated to a certain degree; however, this kind of material also suffers from low weight density due to the low charge–discharge plateau, which may be improved by doping F.
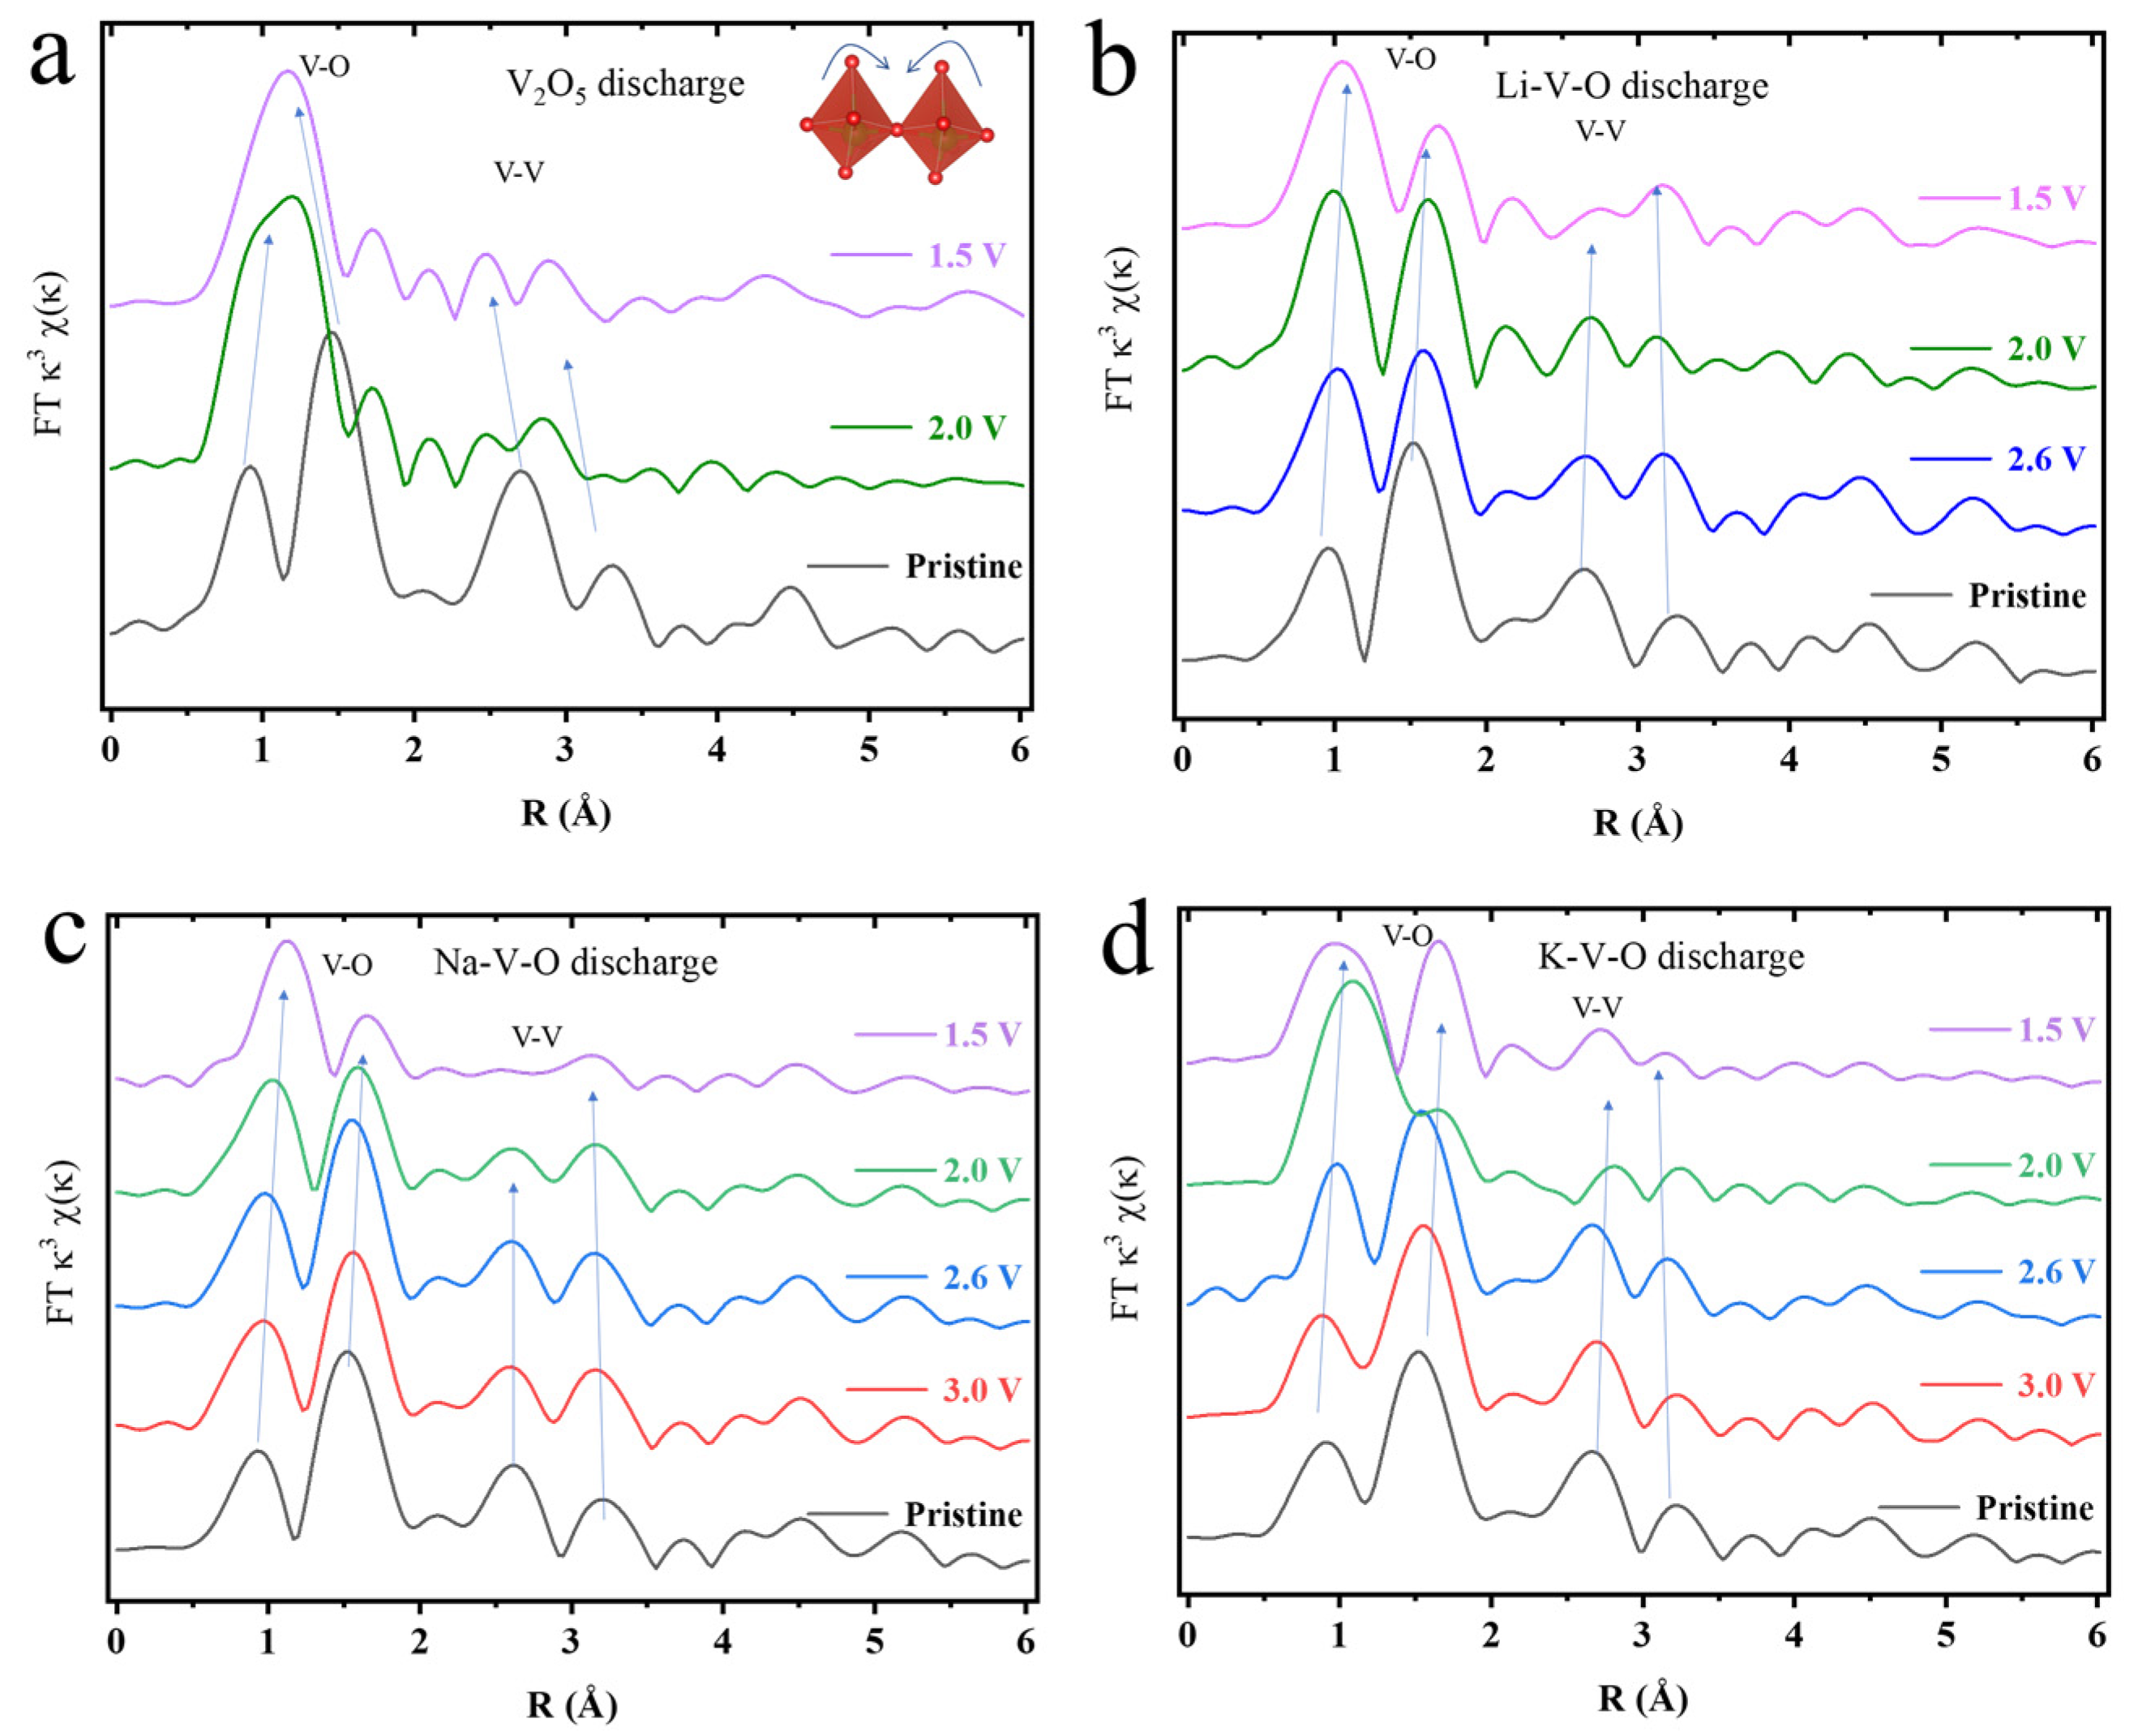
Moreover, the EXAFS spectra of the Fourier transform (FT) curves and the wavelet transformed EXAFS (
Figure S12) are characterized by two main types of peaks (not phase corrected) within 1.0–3.5 Å, corresponding to the nearest V-O and the next nearest V-V coordination (
Figure 4). The EXAFS spectra of the original Li-V-O, Na-V-O, and K-V-O are nearly the same due to the similarity of these structures (
Figure 4b–d). The V-O coordination is the same, while the peak around 2.7 Å (the V-V coordination) splits into two, compared with V
2O
5. After discharge, the peaks around 1.1 and 1.7 Å slightly shift to a lower R-value and very small intensity changes for A-V-O. Furthermore, after discharge, the two split peaks do not disappear or lower the intensity, as is the case for V
2O
5 (~0.2 Å variations V
2O
5 for in V-V distance). Finally, the four prominent peaks change the least in terms of peak position and intensity of V-O and V-V coordination. By comparing the four-peak difference between discharged and original states, K-V-O owns the least variations (~0.1 Å variations for K-V-O in V-V distance) in terms of intensity and position, implying that the V-centered polyhedrons and V-V connection structure in K-V-O are the most stable during the charge–discharge process. In summary, both XANES and EXAFS indicate that ion pre-intercalation, especially for K
+, is a quite an efficient strategy for stabilizing the V
2O
5 layered structure in lithium storage.
The experimental results are consistent with the DFT calculations. Changes of the key length and bond angle are listed in
Table S1. In the intercalated structure, each alkali ion was coordinated with four oxygen atoms. As shown in the
Figure 5, different alkali atom insertion induced a distortion of the key angle and bond at different levels. The maximum angle of O1-V1-O3 in K-V-O is 107.7°, which is larger than 105.1° in N-V-O and 104.0° in Li-V-O, while it is 104.4
o in V
2O
5, which indicated that the insertion of the K ion induced large distortion of vanadium symmetry away from the octahedral. In addition, the band lengths of O1-V1 and O3-V2 are still enlarged after intercalation. The maximum bond length of O1-V1 is 1.62 Å in Li-V-O, which is longer than 1.61 Å in Na-V-O and 1.6 Å in K-V-O, which may result from the smaller diameter of the Li ion, providing more space for oxygen to rearrange. The increase of the O1-V1 length demonstrates the local reduction of the vanadium valence state from +5 to +4. The orbital-projected density of state (PDOS) of Li-V-O, Na-V-O and K-V-O is shown in
Figure 5d. For pristine V
2O
5, the Fermi level is forbidden, while the total DOS shifts down with alkali ion insertion. The O state contributes predominantly to valance while the V state makes up the conduction band. The overlap of DOS between O and V indicates hybridization between V 3d and O 2p states. The conduction band mainly contains two sets of states, including the lower energy t2g states (V 3dxy, 3dxz, and 3dyz) and the higher energy eg* states (V 3dz2 and 3dx2-y2). As described in
Figure S1c, the V-dxy and V-dyz orbitals are degenerate at the Fermi level, and the midgap states consist of V 3dxy and 3dyz orbitals hybridized with an O 2py orbital, demonstrating the reduction of vanadium centers by the insertion of alkali ions. Compared with the DOS of V
2O
5 the DOS of K-V-O shows that a new peak appears below the Fermi level after Li and Na insertion,, indicating the further degeneration of V 3dxy and V 3dyz bands, which may result from the further distortion of the vanadium symmetry away from octahedral thereby further increasing the splitting of the t2g states.


 ,
, 


