Article

Case Study of Repeatability, Different Speeds, and Different SOCs on Battery Squeeze Test

1
School of Automotive Engineering, Harbin Institute of Technology, Weihai 264209, China
2
School of Energy Science and Engineering, Harbin Institute of Technology, Harbin 150001, China
*
Author to whom correspondence should be addressed.
Batteries 2022, 8(11), 243; https://doi.org/10.3390/batteries8110243
Submission received: 6 October 2022 / Revised: 7 November 2022 / Accepted: 14 November 2022 / Published: 17 November 2022
(This article belongs to the Topic Battery Design and Management)

Abstract

:
This study aimed to achieve a clear understanding of the response characteristics of soft pack battery extrusion conditions under various situations. In this study, we chose a LiCoO2 battery as the research object of the extrusion experiment. First, the repeatability of the extrusion test on the battery was verified. A quasi-static extrusion test was conducted on three groups of batteries in the same state, and the load-displacement curves of the three groups of experimental batteries were almost the same. Then, the influence of the extrusion speed on the battery thermal runaway was studied. The results show that a different extrusion speed has a certain impact on the thermal runaway performance of the battery. The peak load of the battery is lower at a lower speed. Finally, the study found that every 20% change in SOC has a greater impact on the battery response under a squeeze. The larger the SOC, the more severe the battery thermal runaway. Through an analysis of multiple experimental cases, it is possible to have a deeper understanding of the temperature and voltage characteristics of lithium batteries when a thermal runaway occurs, which provides ideas for monitoring the trend of the thermal runaway of electric vehicles.

Graphical Abstract

1. Introduction

With a scarcity of non-renewable resources such as petroleum and the development of new energy technologies, the number of electric vehicles is increasing. Lithium–ion batteries have also been widely used in commercial electric vehicles (EV) [1,2,3,4]. In recent years, there have been many EV accidents both at home and abroad. In electric vehicle fire and explosion accidents caused by collisions, more serious personal and property losses often occur, the reason for which is the battery inside the electric vehicle losing thermal control [5,6]. Therefore, research on battery safety at the element scale is extremely important.
In the case of thermal runaway, lithium–ion batteries will release a large amount of energy, high temperature flame and toxic fumes in a short time [7]. Scholars have extensively studied the triggering conditions and characteristics of lithium–ion batteries thermal runaway [8,9]. In order to study the triggering conditions and thermal runaway characteristics of batteries, Zhu et al. conducted a battery thermal runaway experiment induced by overcharge conditions on large-sized lithium–ion batteries [10,11]. The results show that the main causes of thermal runaway can be divided into electrical abuse, thermal abuse and mechanical abuse [12,13,14,15,16,17,18,19,20].
In recent years, there have been many studies on lithium–ion batteries’ abuse [21,22,23,24,25]. In general, the four most common methods used to simulate battery failure include metal particle insertion [26], use of phase change materials [27,28], nailing [29], and indentation [30,31]. Among them, mechanical abuse is the most effective method. Common mechanical abuse includes nail penetration and extrusion. In reference [32], the propagation characteristics of thermal runaway were studied based on the nail penetration test. Hsin Wang of the Oak Ridge National Laboratory of the United States Department of Energy believes that the squeeze test is suitable for square lithium–ion battery testing. By applying a torsion force on the negative tab, damage to the battery during the squeeze test is reduced. Therefore, the experiment can more accurately evaluate the safety of different types of batteries [26].
The team led by Elham Sahraei from the Massachusetts Institute of Technology successively studied the thermal runaway of 18,650 [30], square type [33] and soft pack [34] batteries. In addition, with the help of high-speed CT, X-ray, and other technologies to observe the internal structure of lithium–ion batteries, a relatively complete understanding of the thermal runaway response process of various types of lithium–ion batteries has significance for subsequent scholars. Jinlong Bai et al. heated 100% SOC lithium–ion batteries under extrusion until thermal runaway occurred. The parameters during thermal runaway were recorded, but they only performed the 100% SOC state and did not analyze the other battery states [35]. Xiaoqing Zhu et al. analyzed the mechanism of battery failure under mechanical abuse conditions, but did not conduct repeatability experiments to eliminate the differences between cells [36].
Finegan of University College London has studied the changes in the structure and morphology of the thermal runaway material of lithium cobalt oxide batteries caused by over-charging. At high temperatures, lithium cobalt oxide will react with the electrolyte to produce a large amount of gas, which will cause the battery to deform, and the reaction will also cause the lithium cobalt oxide material particles to break, aggravating the reaction [37]. Srinivasan of the John Pukins Applied Physics Laboratory in the United States attributed the thermal runaway of lithium–ion batteries to two major categories: external and internal. External causes include an external short circuit, an overcharge, and thermal and mechanical abuse. The internal cause is the internal defects of the battery, such as internal metal impurities, and the attenuation of the positive and negative materials during the cycle [38]. Yaohua Liang et al. found that the construction of lithium-philic phase is an effective method to inhibit the growth of lithium dendrites, and carried out a cycle experiment with a lithium iron phosphate battery with good results [39].
In recent years, with Ouyang Minggao from Tsinghua University [32,40] and Xu Jun from Beijing University of Aeronautics and Astronautics Automotive Energy and Safety Labor-atory (VESL) as representatives, Ouyang Minggao’s team dealt with the problem of thermal runaway in the battery pack. The diffusion process was researched, and a flame-retardant insulation layer was innovatively designed to study the battery safety at the level of the battery module. Xu Jun conducted quasi-static extrusion and drop hammer tests on a soft pack battery [41,42,43] and studied the thermal runaway changes of the battery under high-precision tests [44,45].
Through a review of the published literature on the subject of lithium battery safety, it was found that the mechanism of cylindrical battery failure under a radial load has been understood in greater detail. However, cylindrical, soft-packed, and square-shaped batteries are not only different in their external shape, they also have a variety of options for the cathode materials, and the safety performance will thus also be different. Therefore, in this study, the lithium cobalt oxide soft pack battery, which has been studied by fewer scholars, was selected as the research object. In addition, radial loading experiments on a battery were conducted, with the temperature of the battery surface and the positive and negative electrode tabs detected. Considering that there are differences even among different cells produced in the same batch, we analyzed the repeatability and differences of the battery extrusion test in detail. After that, we analyzed the influence of different loading speeds on battery failure, and took the influence of SOC into account to analyze the changes of battery peak load, temperature and other parameters in more detail under different SOCs. More in-depth research on the thermal runaway characteristics of the battery under a squeeze has also provided ideas for detecting the thermal runaway of the battery.

2. Experiments and Methods

2.1. Research Subjects

At present, most common passenger vehicle battery packs on the market use soft pack battery cells with a capacity of more than 10 Ah. In this article, this battery is used for racing. Compared with common passenger cars on the market, the battery capacity is smaller, and the amount of energy inside the battery cell with a smaller capacity is also smaller. When a single battery is thermally out of control, the severity is lower, and we can observe and photograph the runaway battery phenomenon more closely.
A LiCoO2 battery is one of the most widely used batteries in the current automotive power lithium battery market owing to its good cycle performance, relatively high specific capacity, and excellent material processing. In this study, a LiCoO2 soft pack battery was selected, the battery specifications and parameters of which are shown in Table 1.

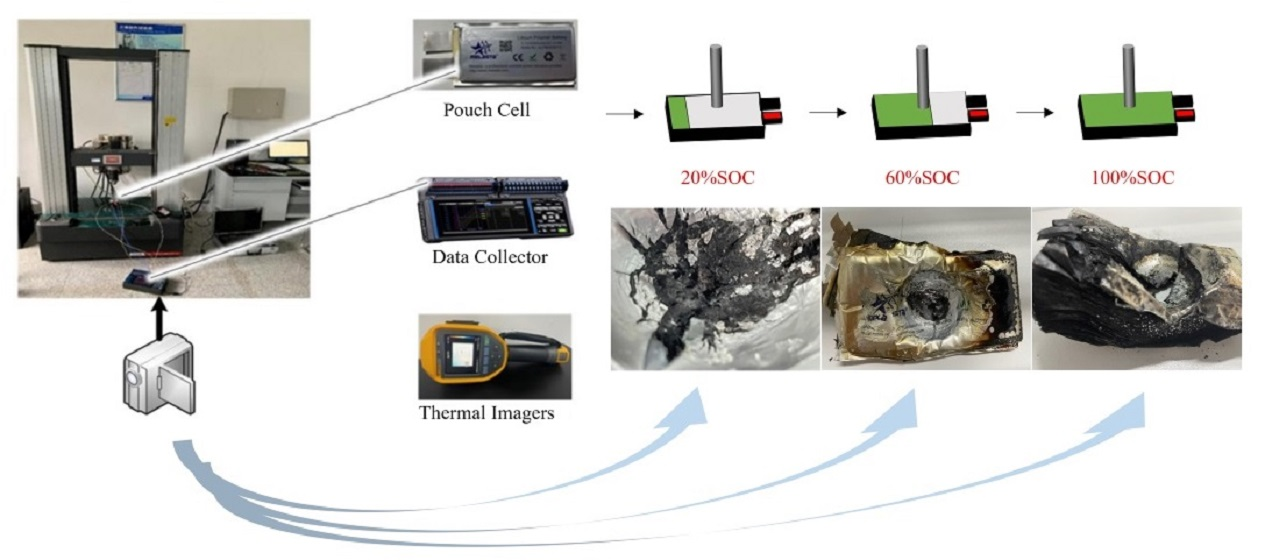
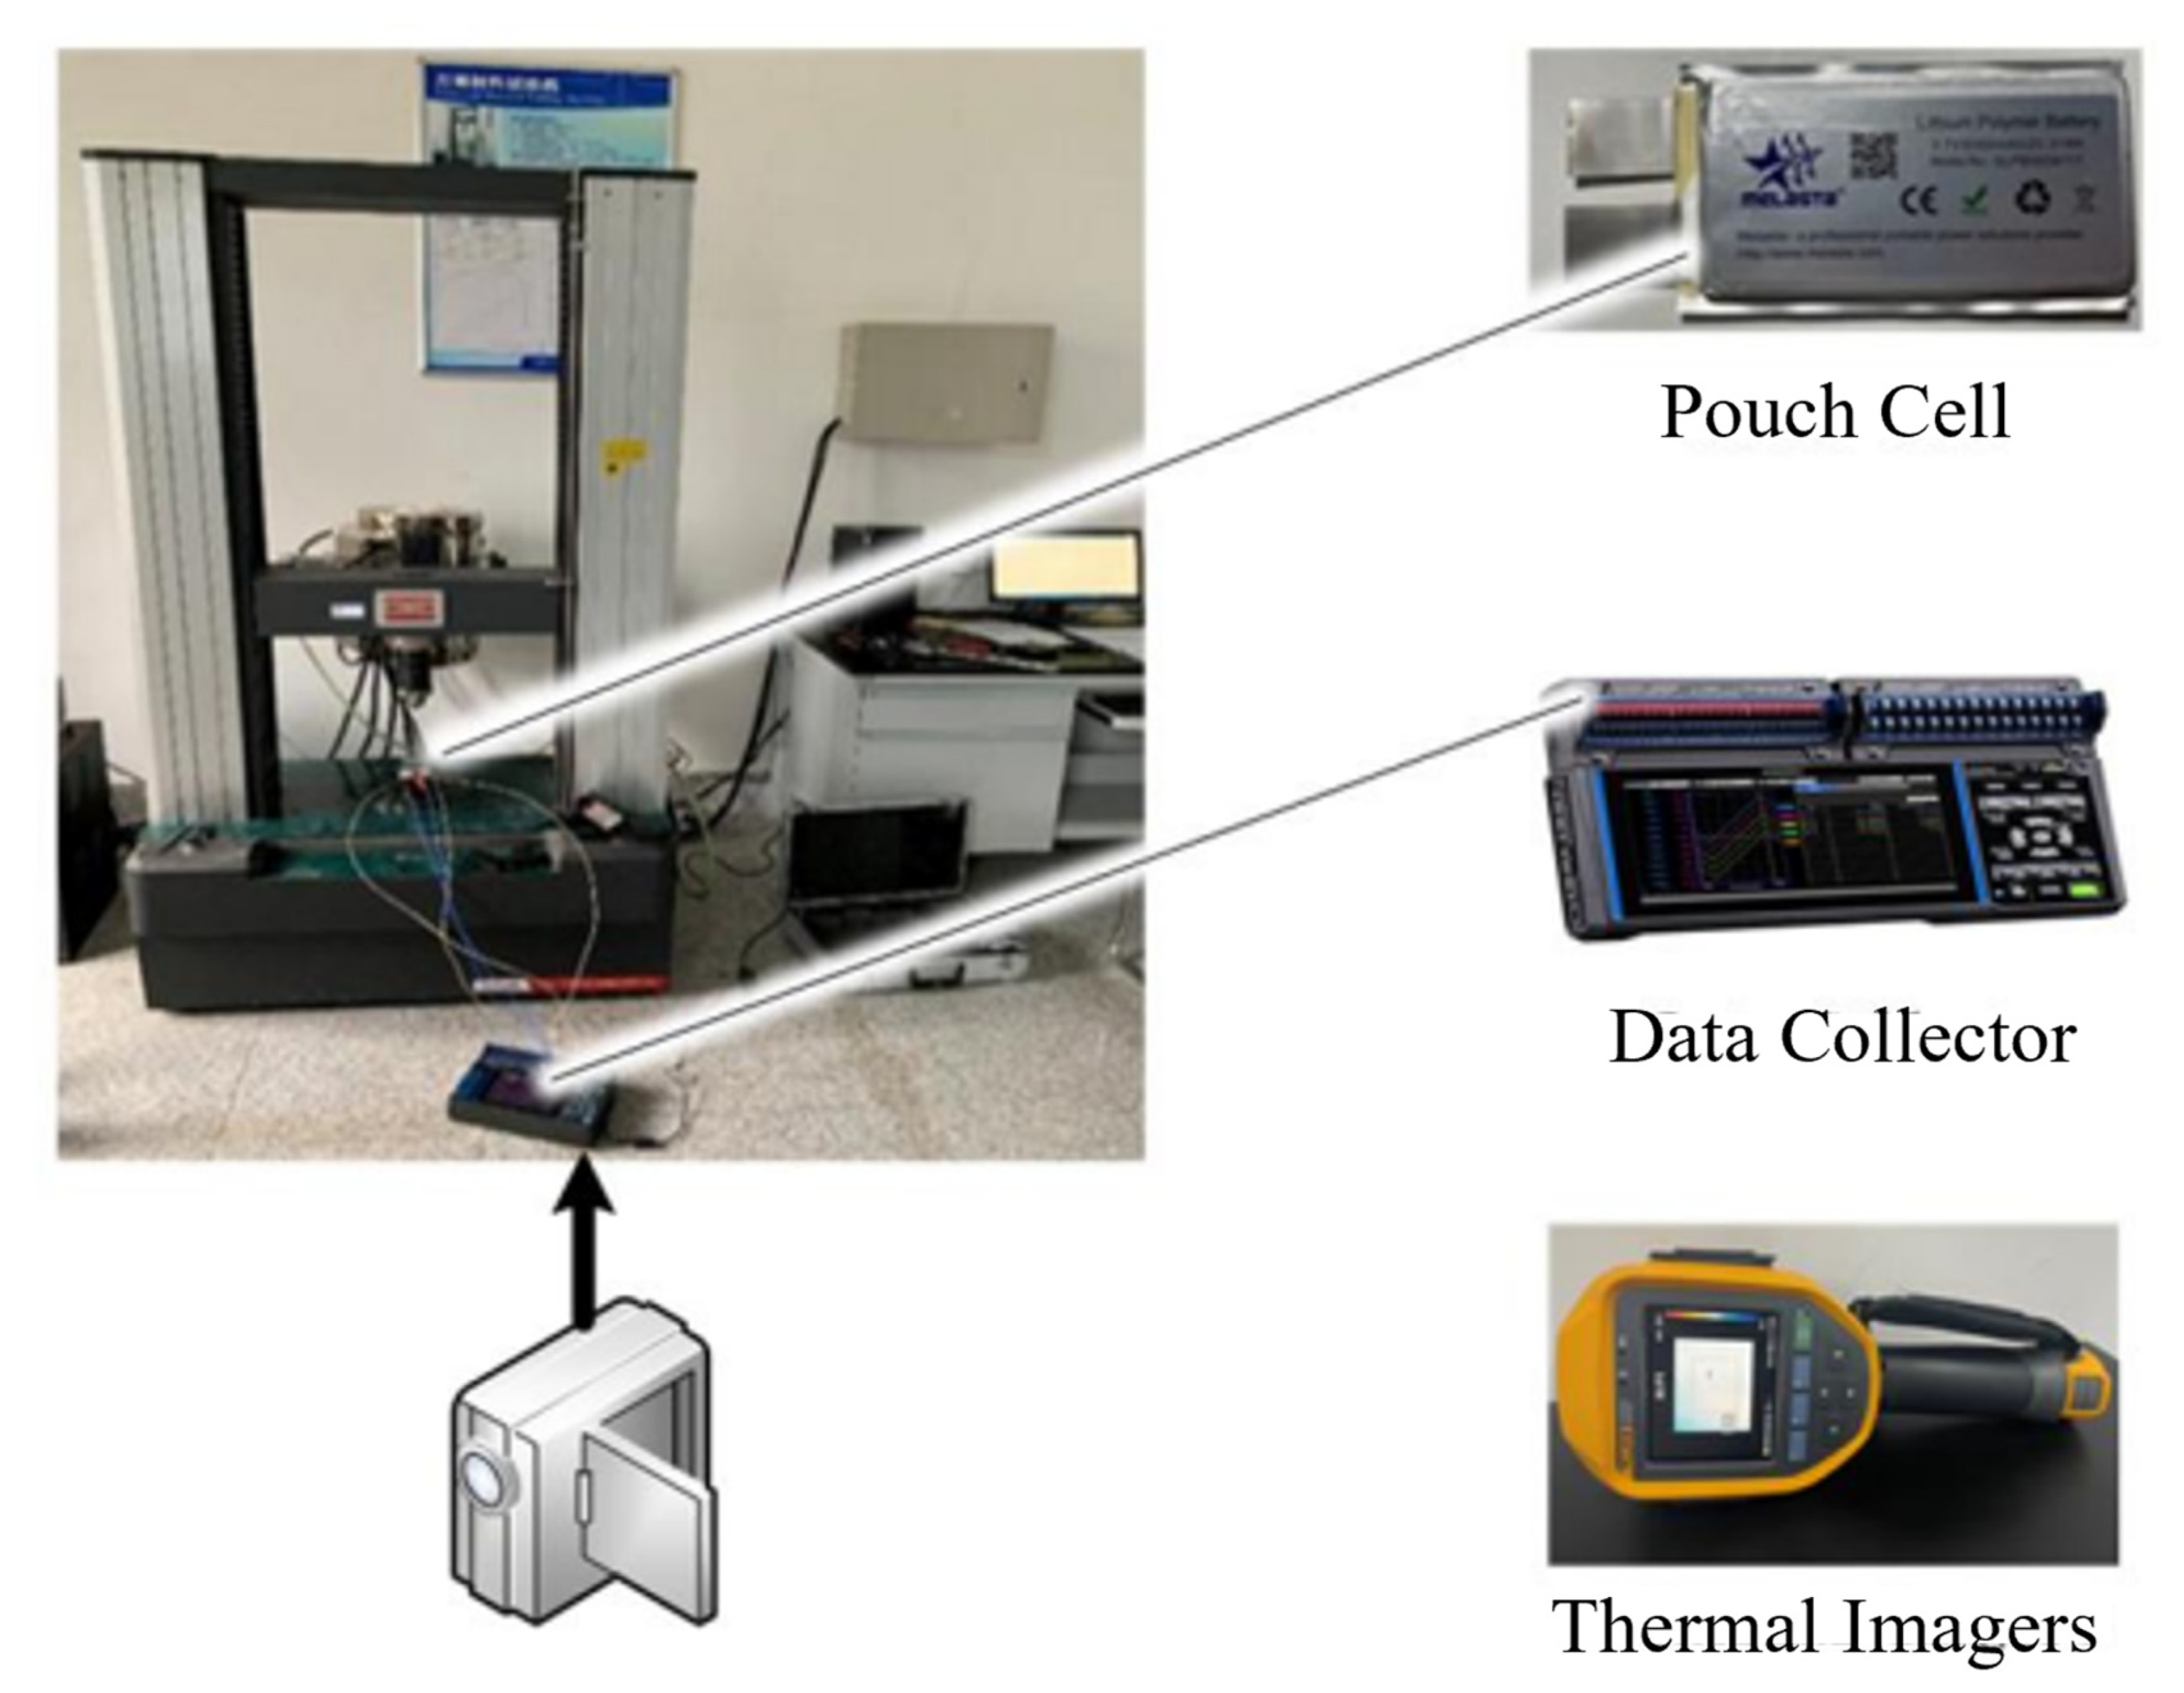
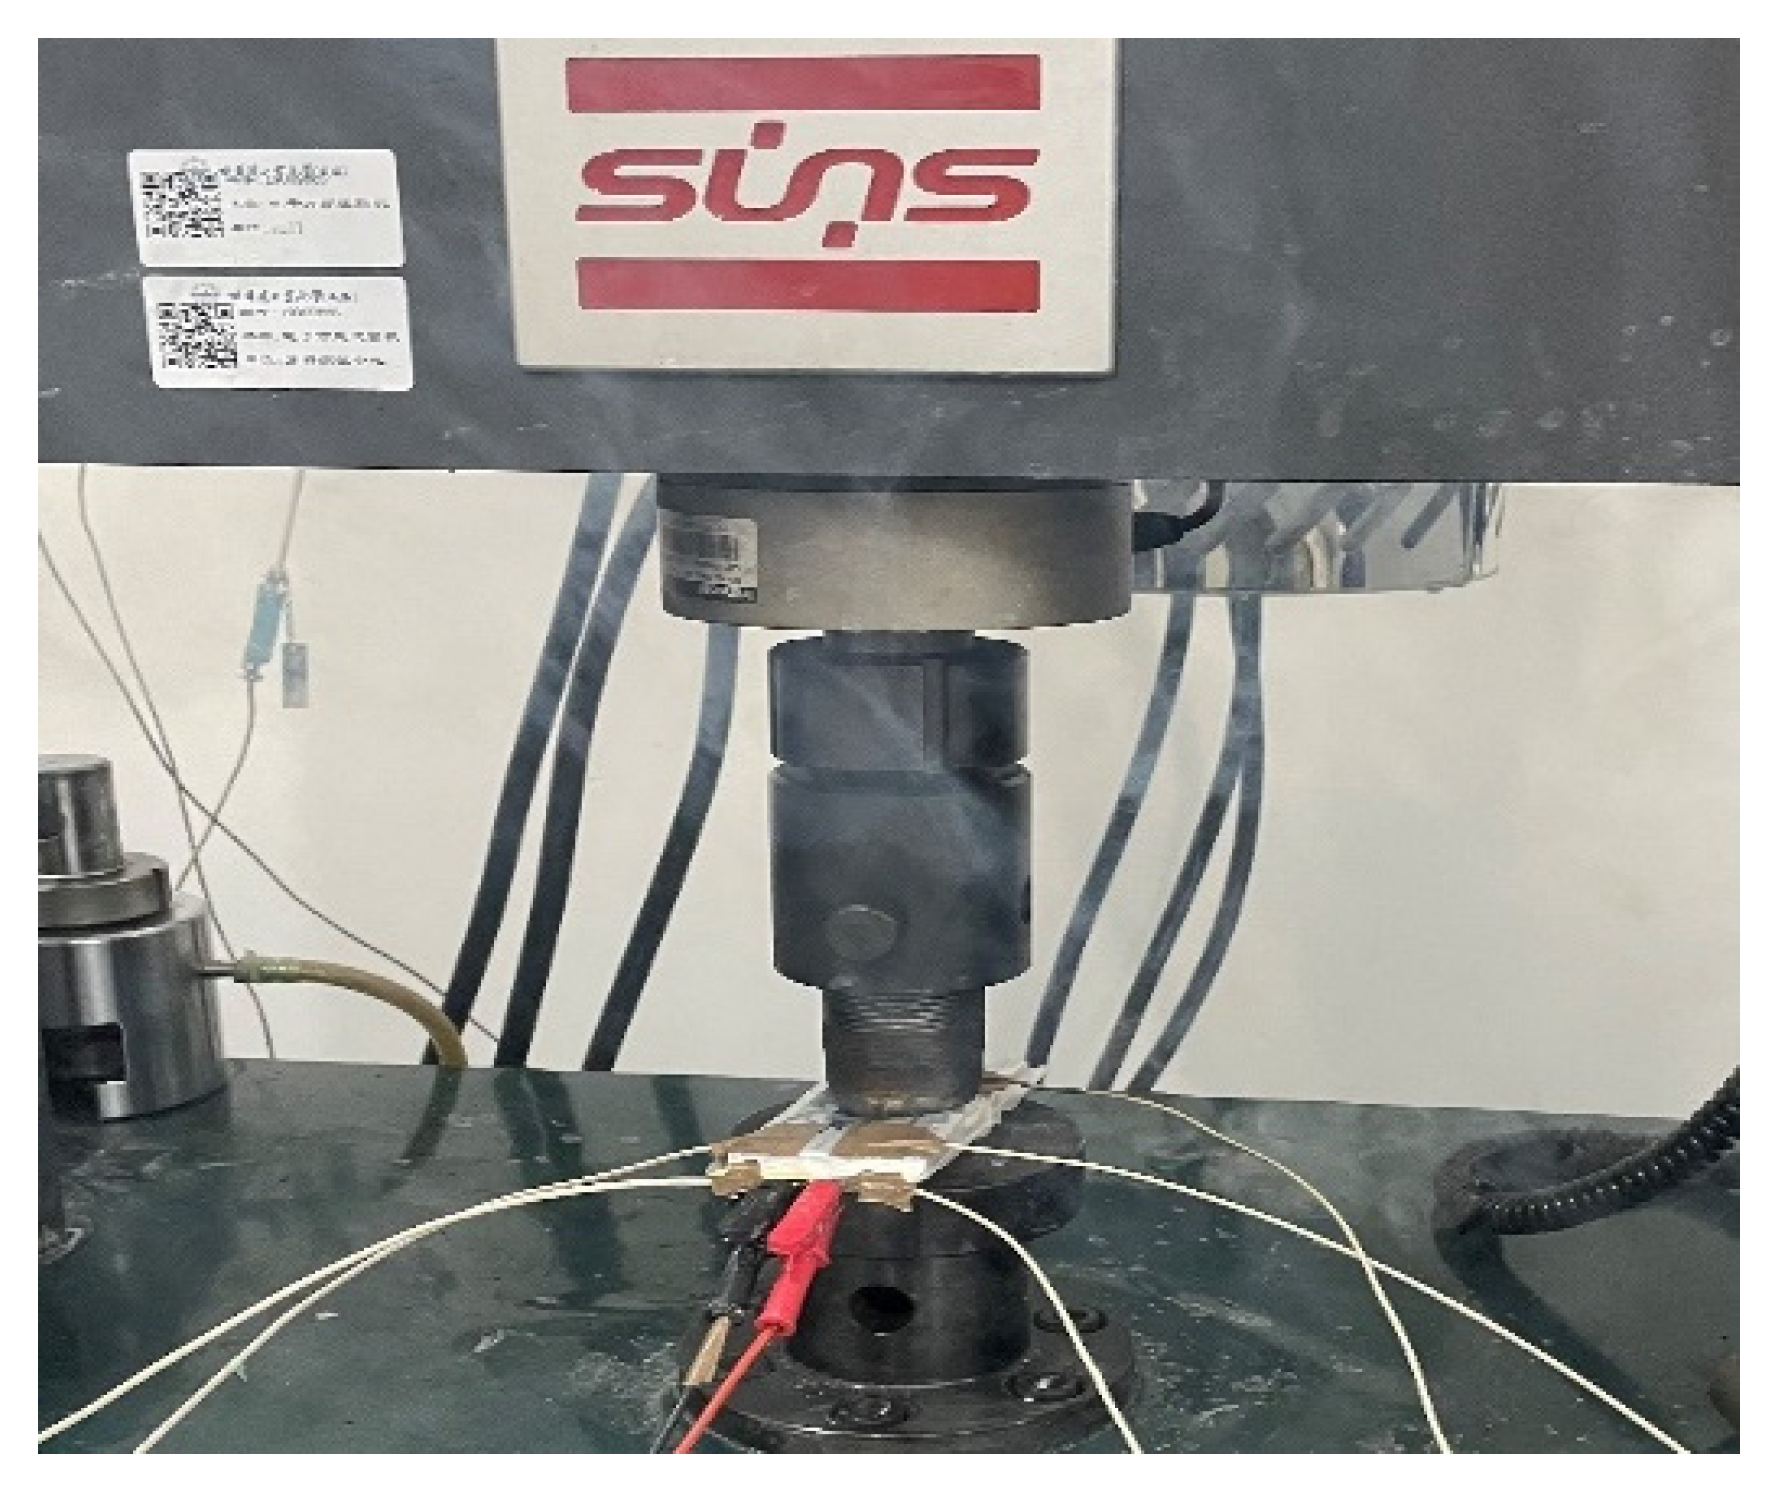
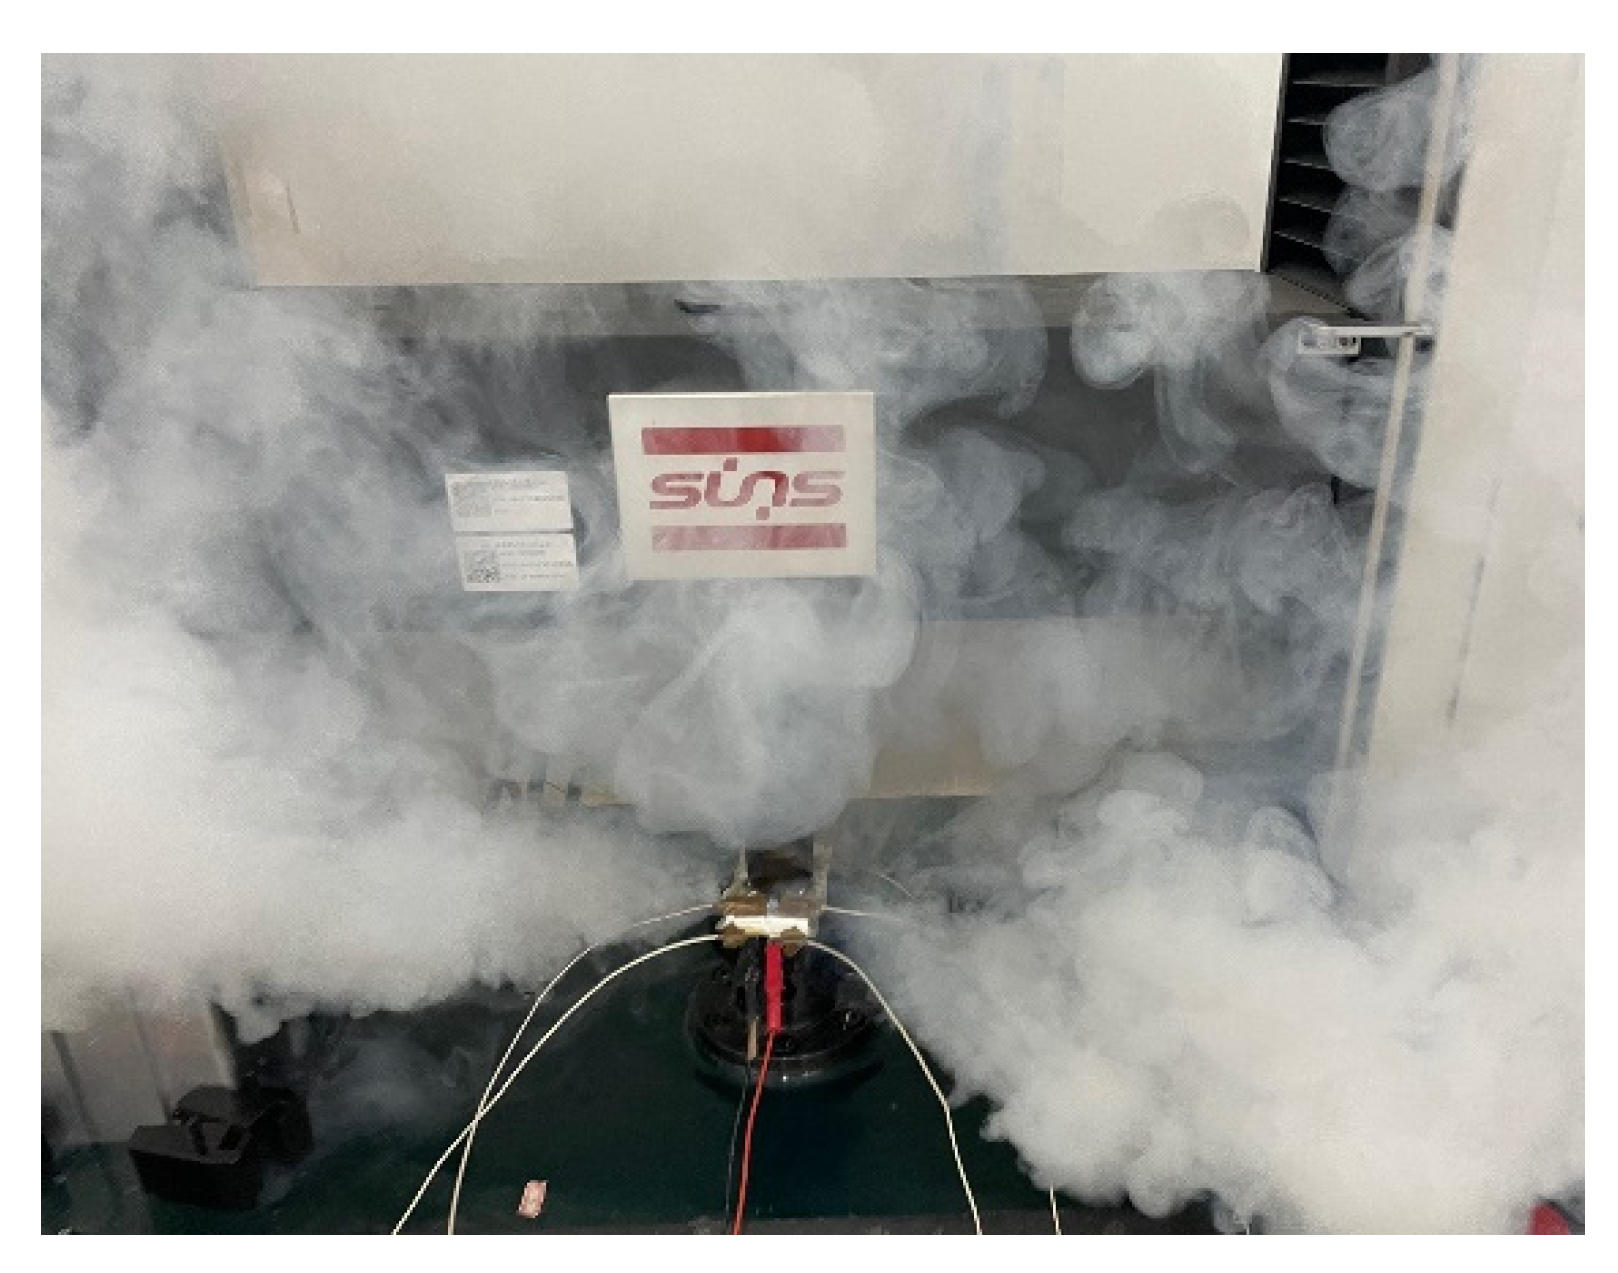
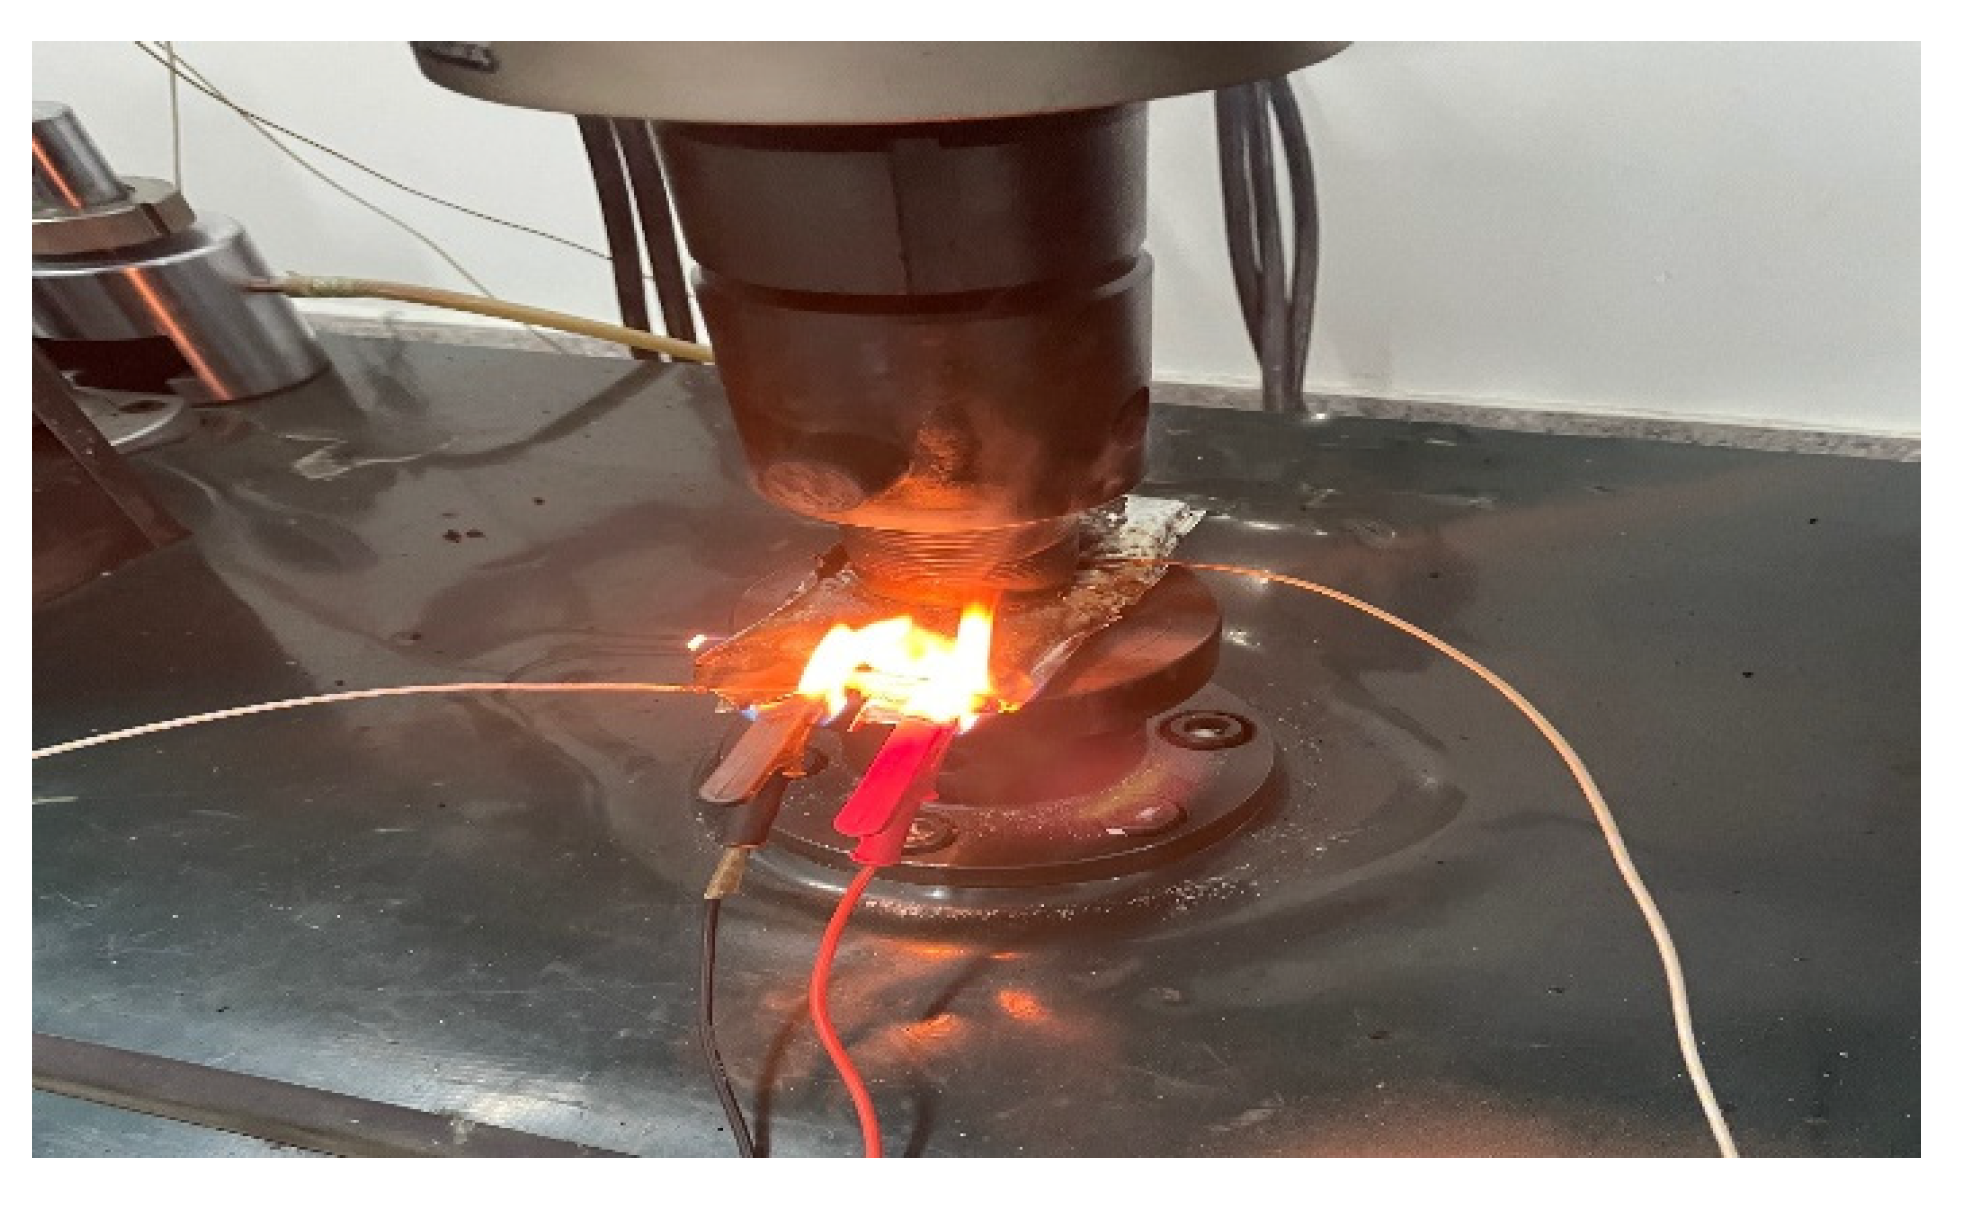
2.2. Experiment Equipment

The UTM5105X electronic universal testing machine made in Sunstest, Shenzhen, China, with a load capacity of 100 kN and a speed range of 0.1–1000 mm/min was used for loading, and a hemispherical extrusion device adapted to the testing machine was installed. During the process, the battery temperature and voltage changes were monitored, and the temperatures at the positive and negative electrode tabs and at the battery surface were monitored. The sampling frequency was 10 ms, and because the battery was thermally out of control, the voltage decreased quickly, and the voltage sampling frequency was 1 ms. A K-type thermocouple wire with a high-temperature glass fiber was used as the insulating layer, the temperature range of which was −73 °C to 700 °C. The load displacement data were recorded and processed using the testing machine, and the voltage and temperature data were recorded using a HIOKI LR8450 data acquisition instrument made in Shanghai, China. A FLUKE TI400 made in America was used for thermal imaging of the battery during failure. The temperature measurement range of the instrument was −20 °C to 1200 °C, and the error was within ±2 °C. A schematic diagram of the specific experimental equipment is shown in Figure 1.

2.3. Experiment Steps

(1)
Charge and discharge the battery through a tester, and set the battery to an SOC of 0%, 20%, 40%, 60%, 80%, or 100%.
(2)
Connect the electric and thermocouple wires using the HIOKI data acquisition instrument to collect the battery electrodes, surface temperature, and voltage.
(3)
Start the experiment machine and data acquisition instrument, set the loading speed and termination displacement conditions. Place the battery under test on the base, and control the pressure head to reach the position where it will be in contact with the battery.
(4)
Conduct the same test three times, and apply an extrusion test to verify the repeatability of the same SOC of the battery.
(5)
Use 0.1, 1, and 5 mm/min loading speeds to squeeze the battery in the same SOC and study the influence of the squeeze speed on the battery response characteristics.
(6)
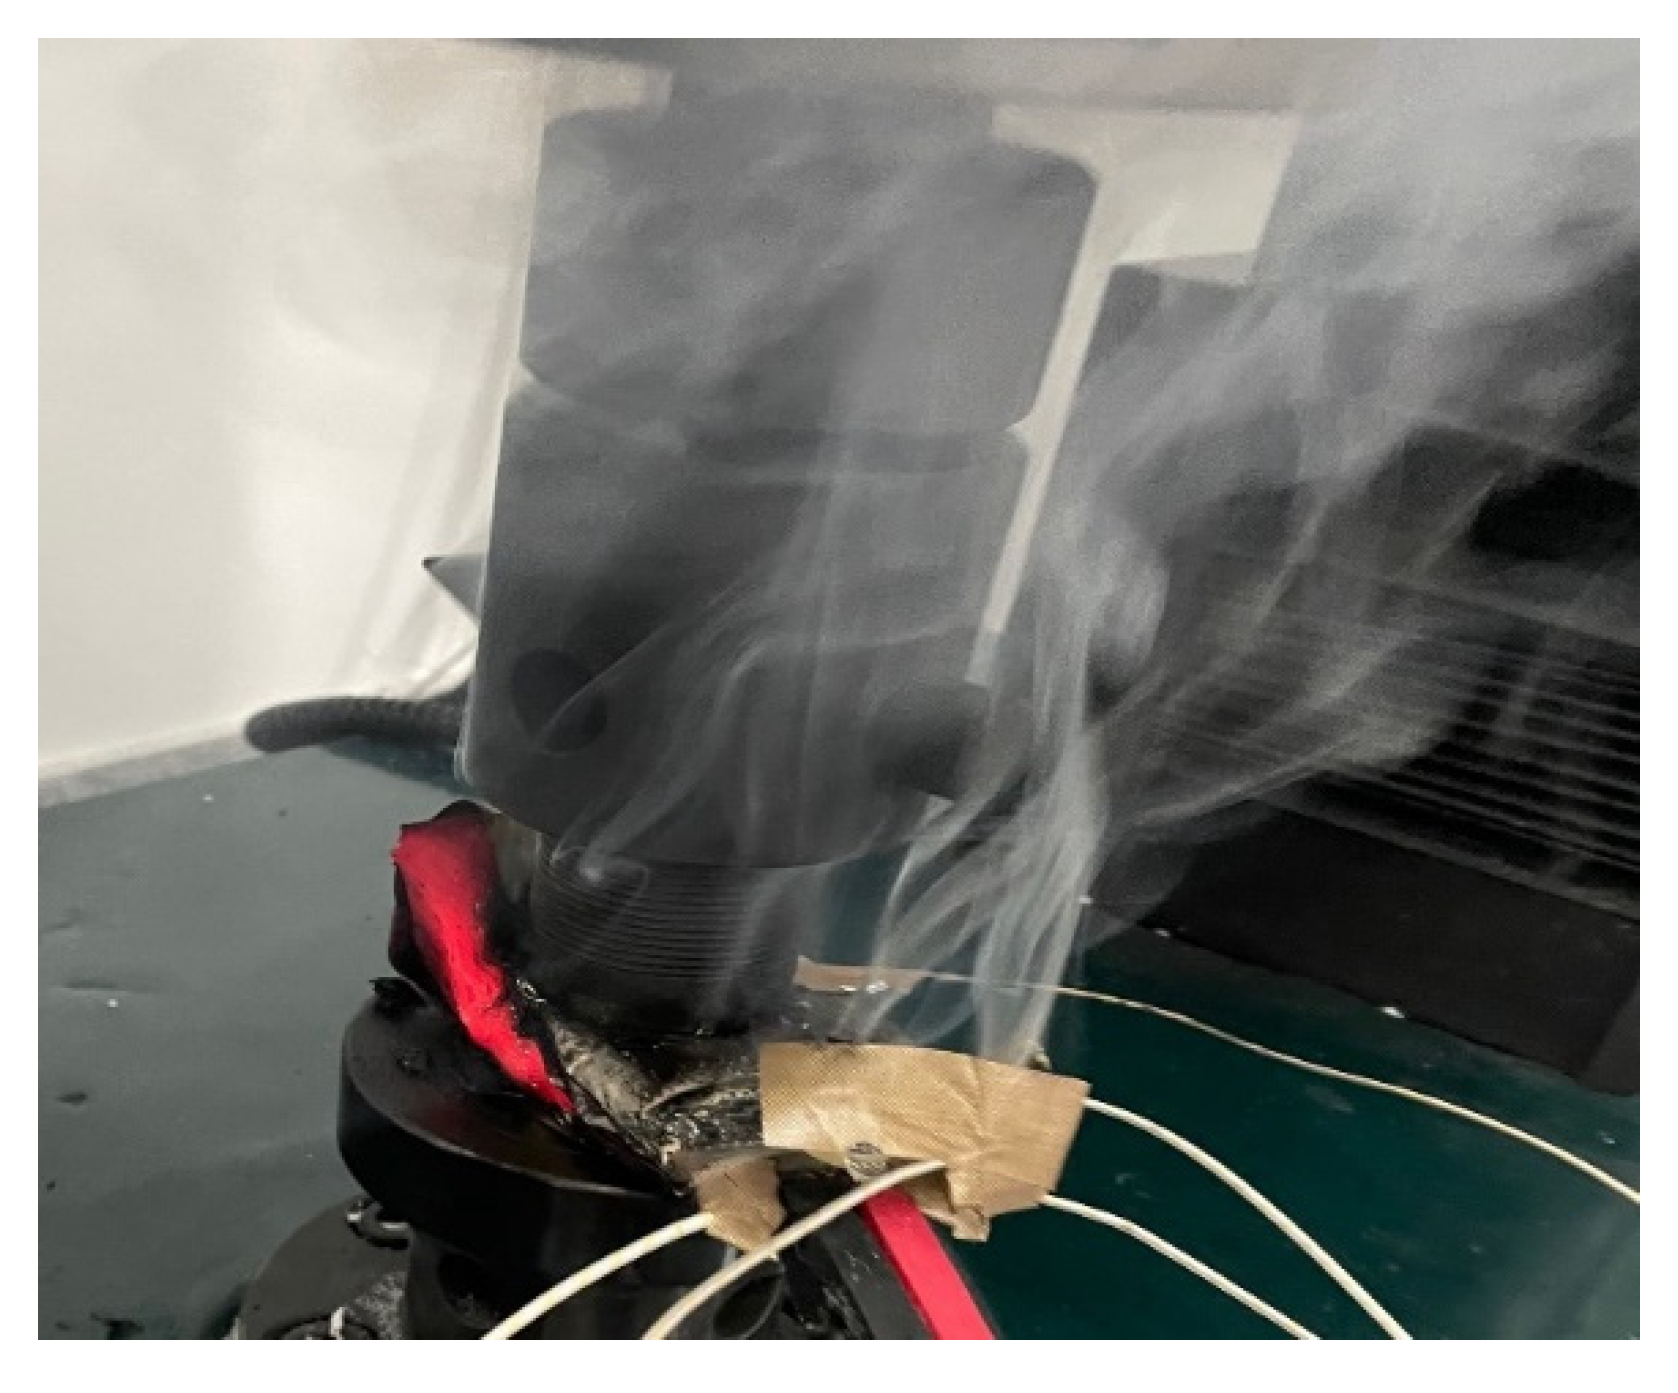
Conduct an extrusion test of different SOCs of the battery and battery thermal runaway and study the response characteristics in a different SOC, i.e., a Fluke thermal imager thermography photographed cell image, when a thermal runaway occurs.

3. Battery Squeeze Experiment

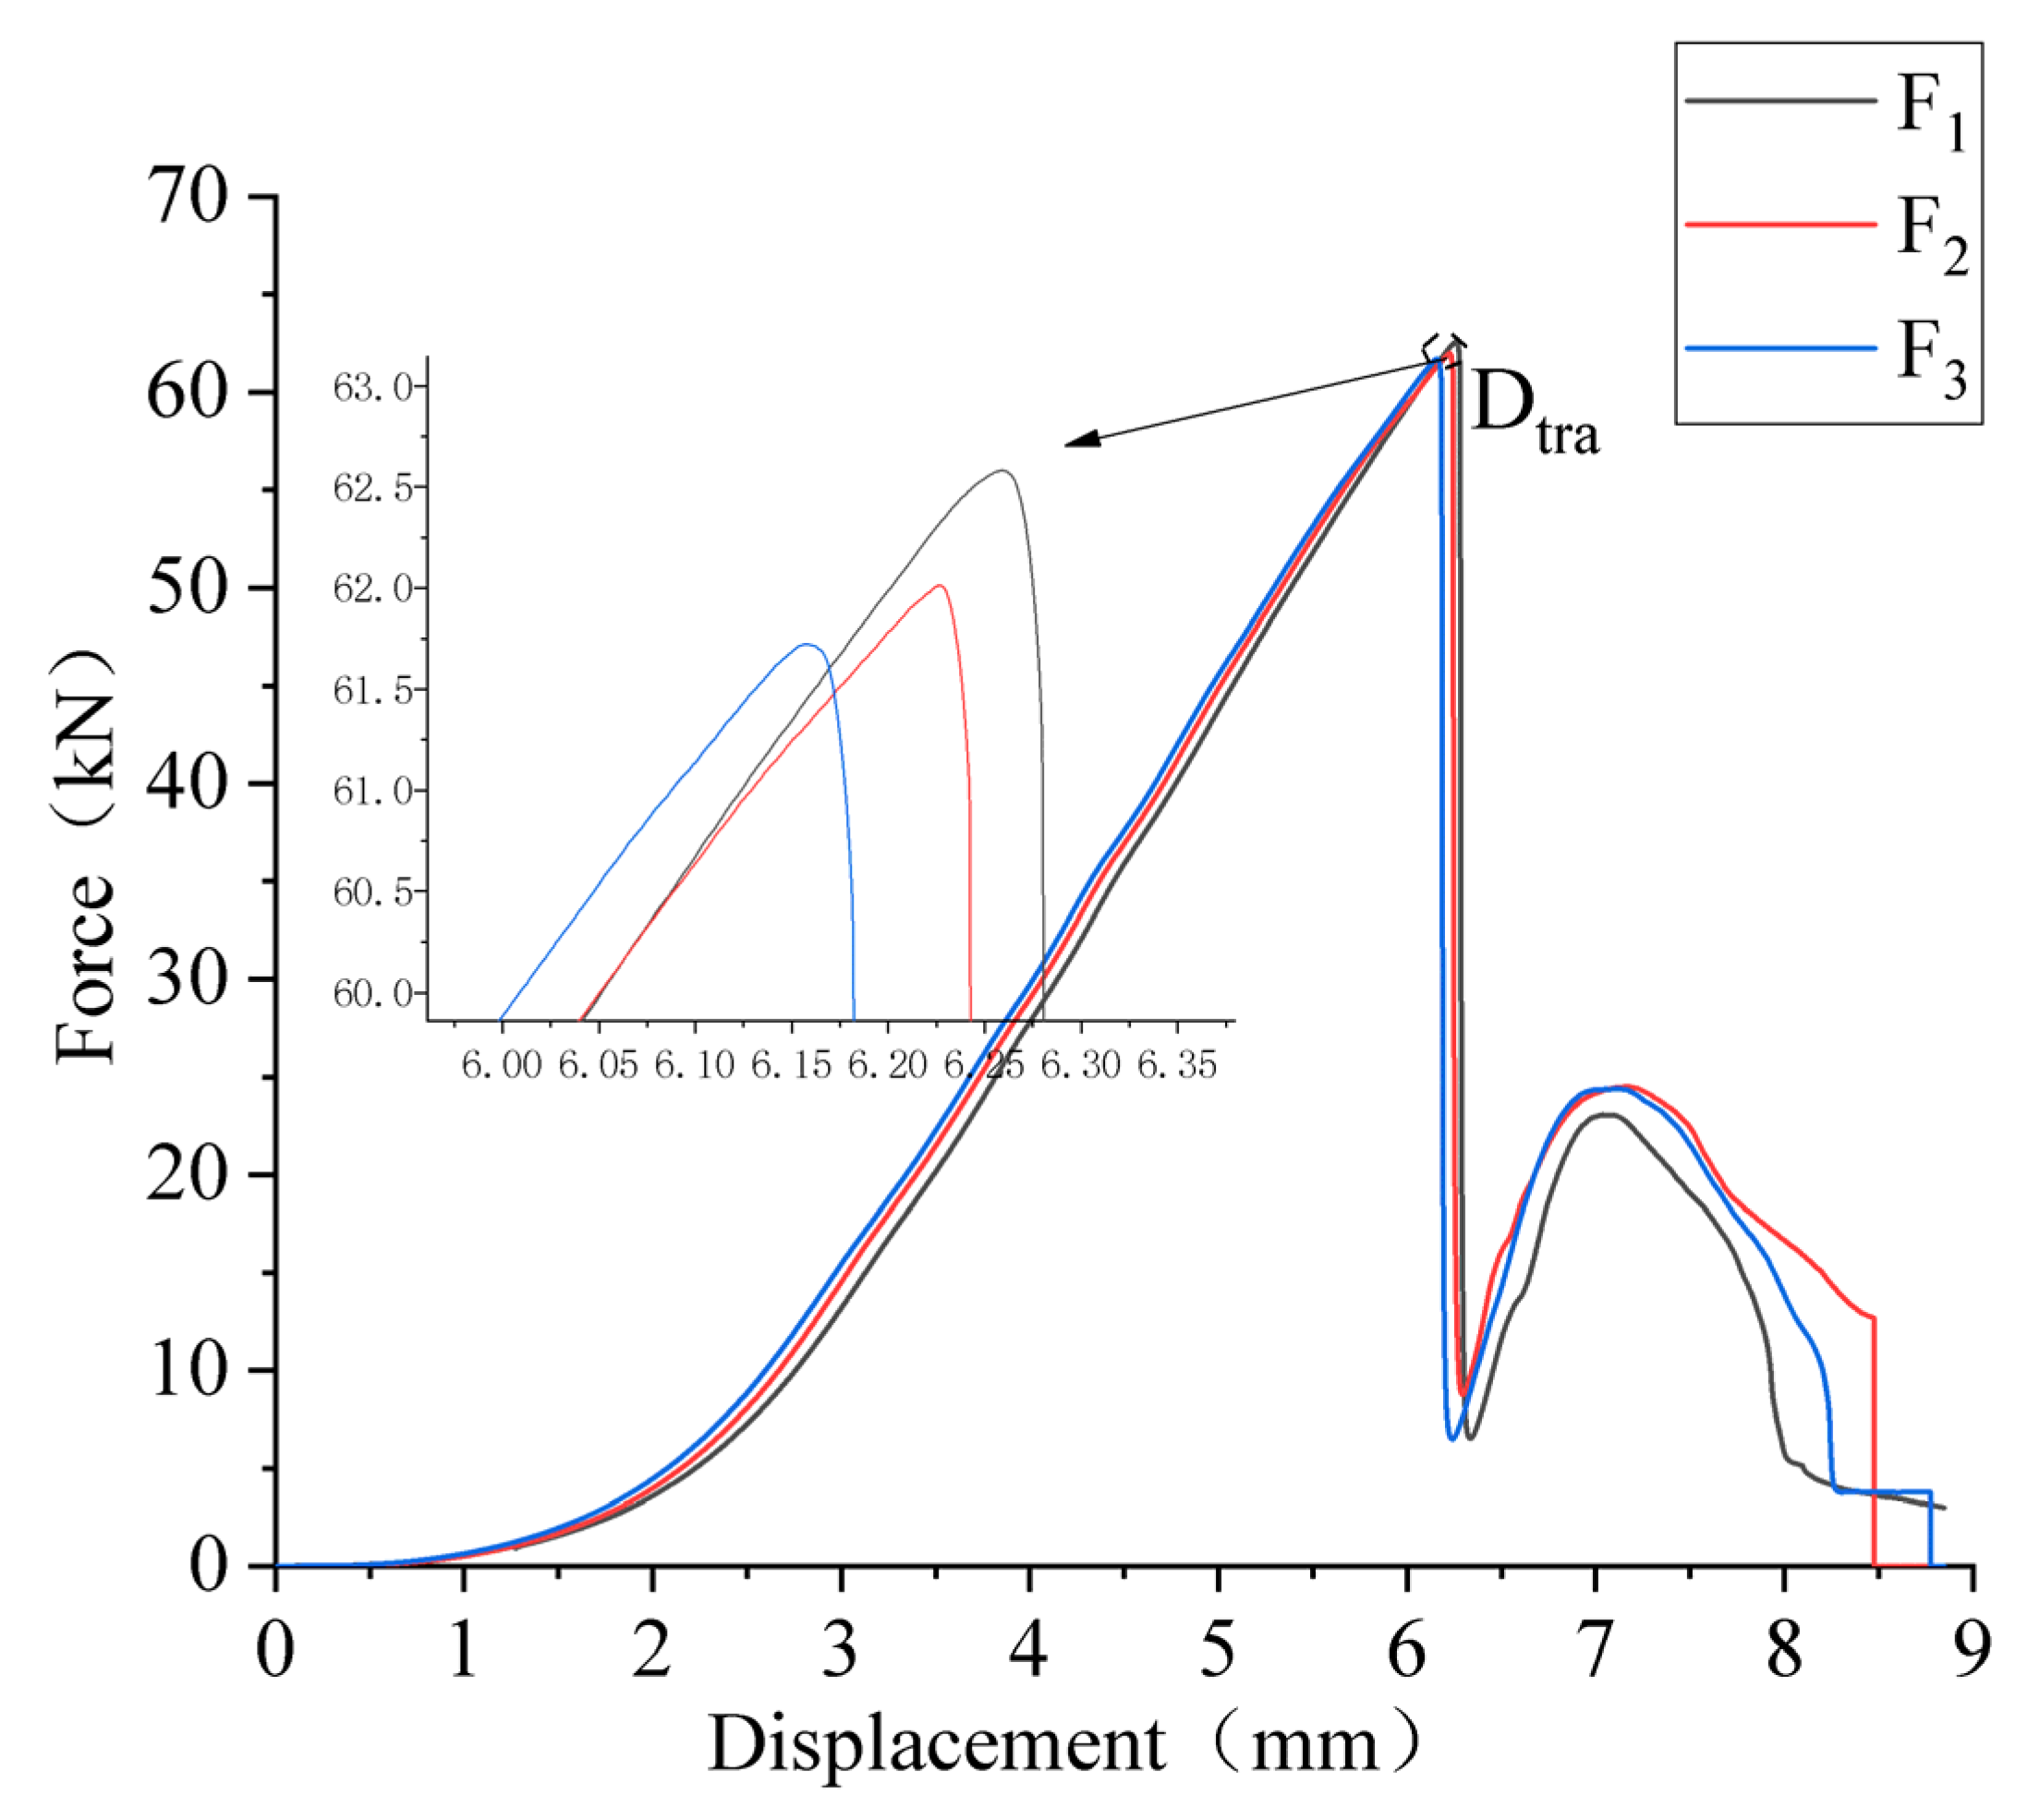
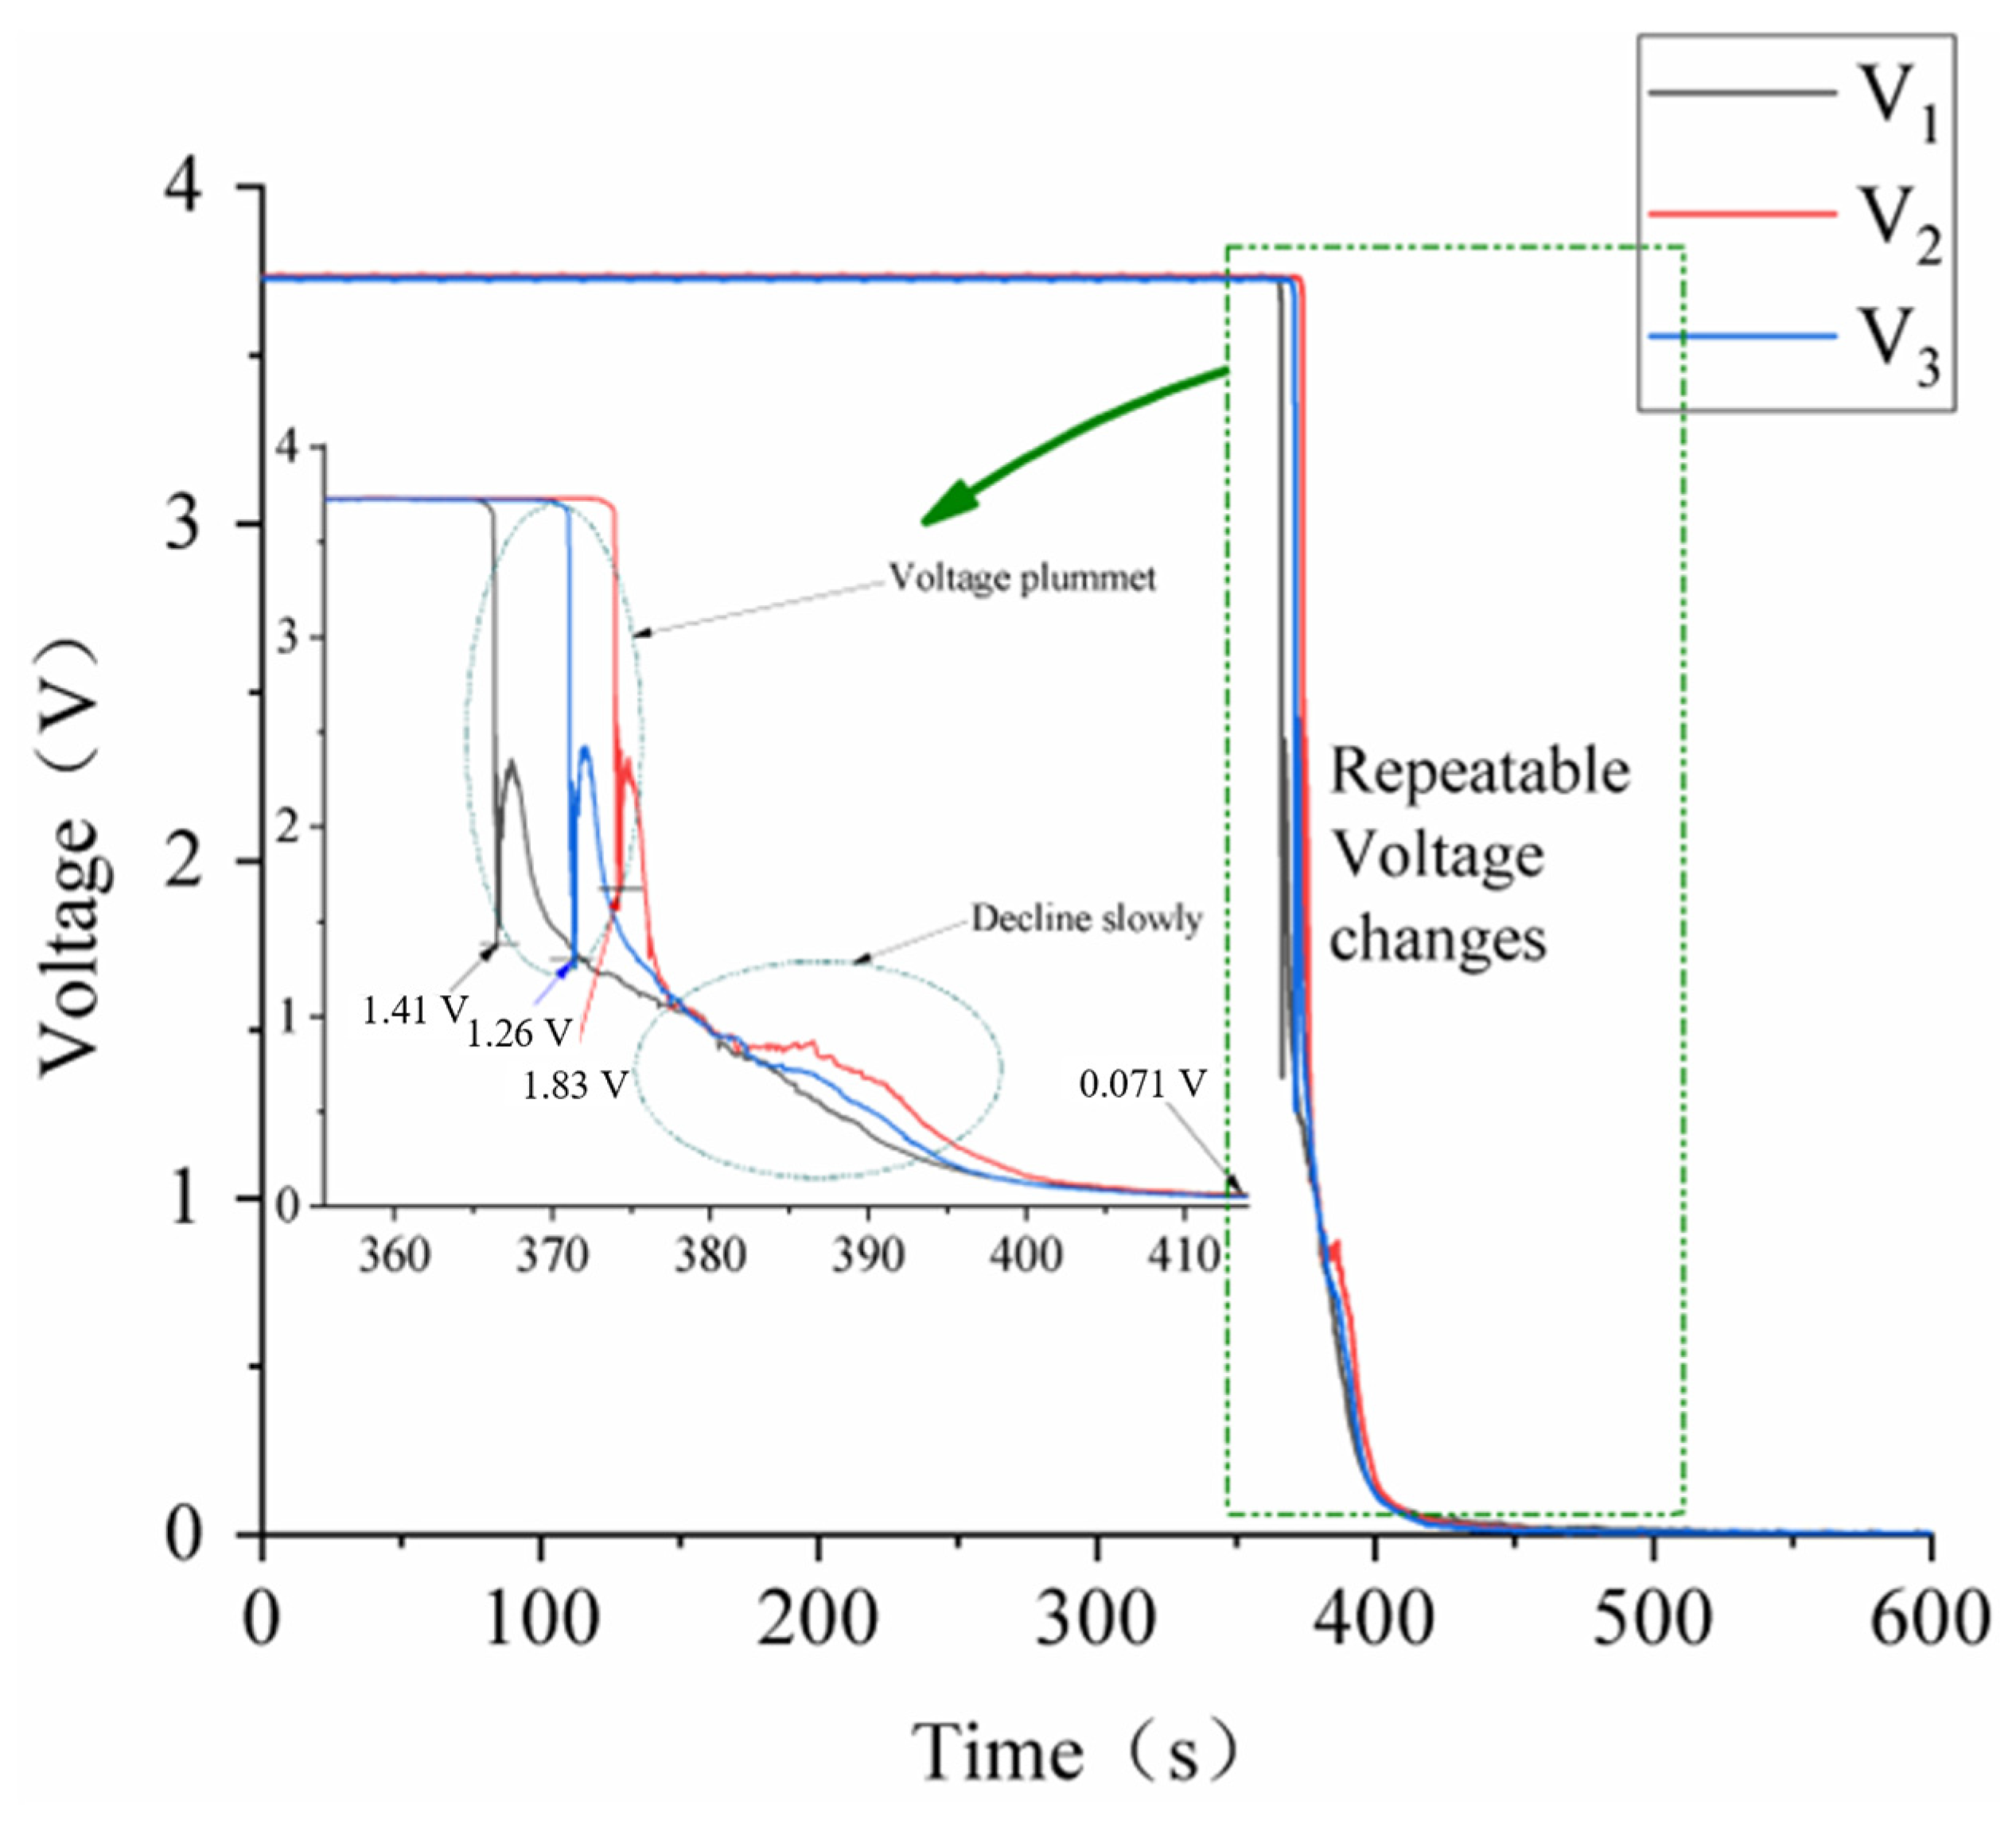
3.1. Test Repeatability Verification

Because the mechanical abuse test is extremely destructive to a Li–ion battery compared with other tests, the battery components could not be used again after the test. In addition, even for the same batch of batteries, there are slight differences in internal resistance, capacity, and other parameters between different batteries. Therefore, it was necessary to test the repeatability of the squeeze test to verify that the slight differences of some parameters had little effect on the response characteristics of the battery under a squeeze, and that the safety of the battery could be represented based on the squeeze test for certain batteries.
The higher the SOC of the battery, the more internal the energy is, and the higher degree of thermal runaway. Because a battery under a high power state is more destructive when a thermal runaway occurs, the thermocouple wire easily falls off when the battery bulges and expands, and the success rate of the data acquisition is low; thus, a battery with a 20% charge state was used to verify the repeatability of the experiment. A constant loading rate of 1 mm/min was set, and as the termination condition, the test stopped when the displacement distance was the thickness of the battery after contacting it. The moment of a sudden drop of battery load was the point of battery failure.
Figure 2 shows the load-displacement curves of three Li–ion batteries with 20% SOC at an extrusion speed of 1 mm/min, and Dtra was the displacement boundary at which a thermal runaway occurred among the three groups. F1, F2 and F3 were the load information corresponding to the three batteries respectively. Before reaching Dtra, the load-displacement curves of the three groups were extremely repeatable, and the maximum load was almost the same for the three groups with an error of within 1.3%. After the battery thermal runaway occurred, the battery expanded owing to a large amount of internal gas generation, and the load on the battery decreased rapidly from internal expansion; however, the specific expansion volume of the battery was influenced by extremely complex factors, which were affected by the battery process, electrode liquid swelling, adhesive, and other factors, and the repeatability of the load displacement curve after Dtra was not as high as in the previous section, but the curve trend was the same.
Figure 3 shows the time–temperature curves of the three groups of batteries. When the indenter touched the battery, it was denoted as time 0. Ttra was the temperature boundary at which a thermal runaway occurred among the three groups of batteries; T1, T2 and T3 were the temperature information corresponding to the three batteries respectively. All three groups of batteries were in about 370 s after the indenter touched the battery, that is, the extrusion displacement was 6.16 mm near the battery surface where the temperature increased rapidly. The maximum Ttra temperature of the three groups of batteries was 82 °C, 82.6 °C and 83.6 °C, respectively, and the error was all within 2%.
Figure 4 shows the time–voltage curves of the three groups of cells. V1, V2 and V3 were the voltage information corresponding to the three batteries respectively. Because the SOC was the same, the voltage change curves of the three groups of cells from the beginning to the termination moment were highly repeatable, and the voltage of all three groups of cells underwent the process of a “sudden drop, recovery increase and slow drop” at approximately 370 s.
Combining the three images, the load-displacement curves, temperature, and voltage curves of the three groups of cells are almost the same, i.e., the influence of manufacturing errors between different cells on this cell under the squeeze test can be excluded. This illustrates the high repeatability of the response characteristics of this cell under an extrusion speed of 1 mm/min, which can represent the safety of the same type of cell through the study of a single cell.

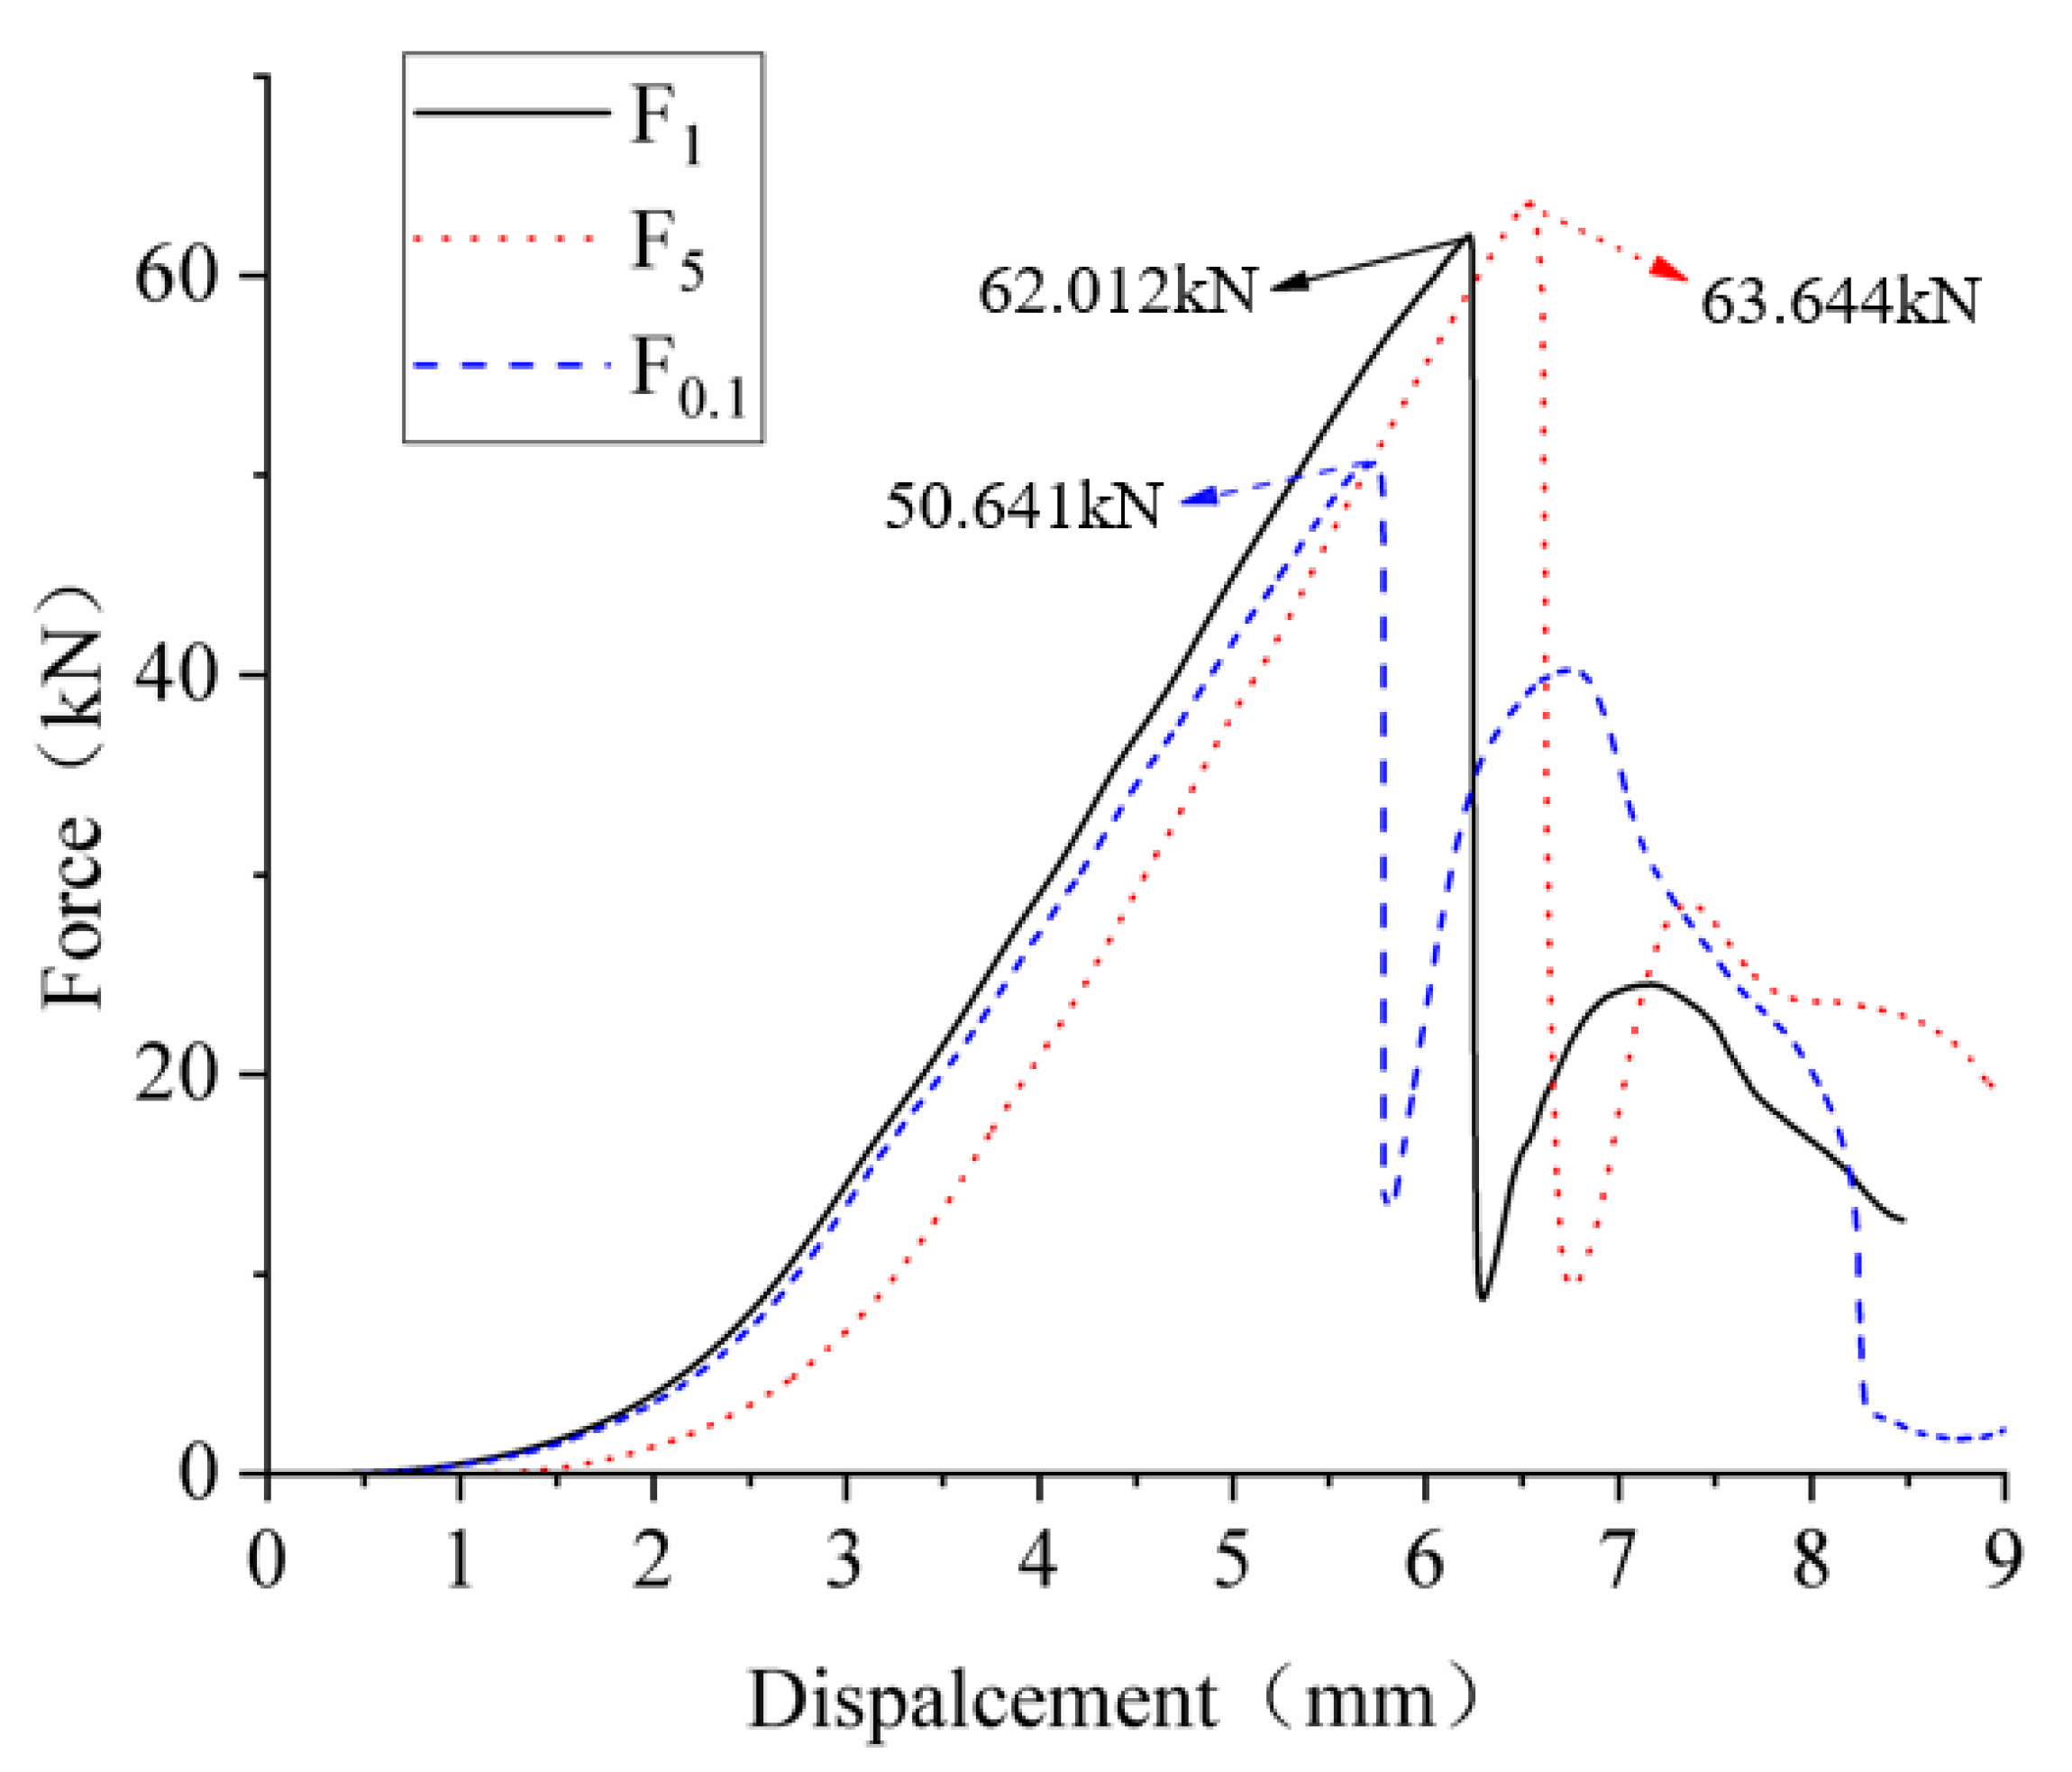
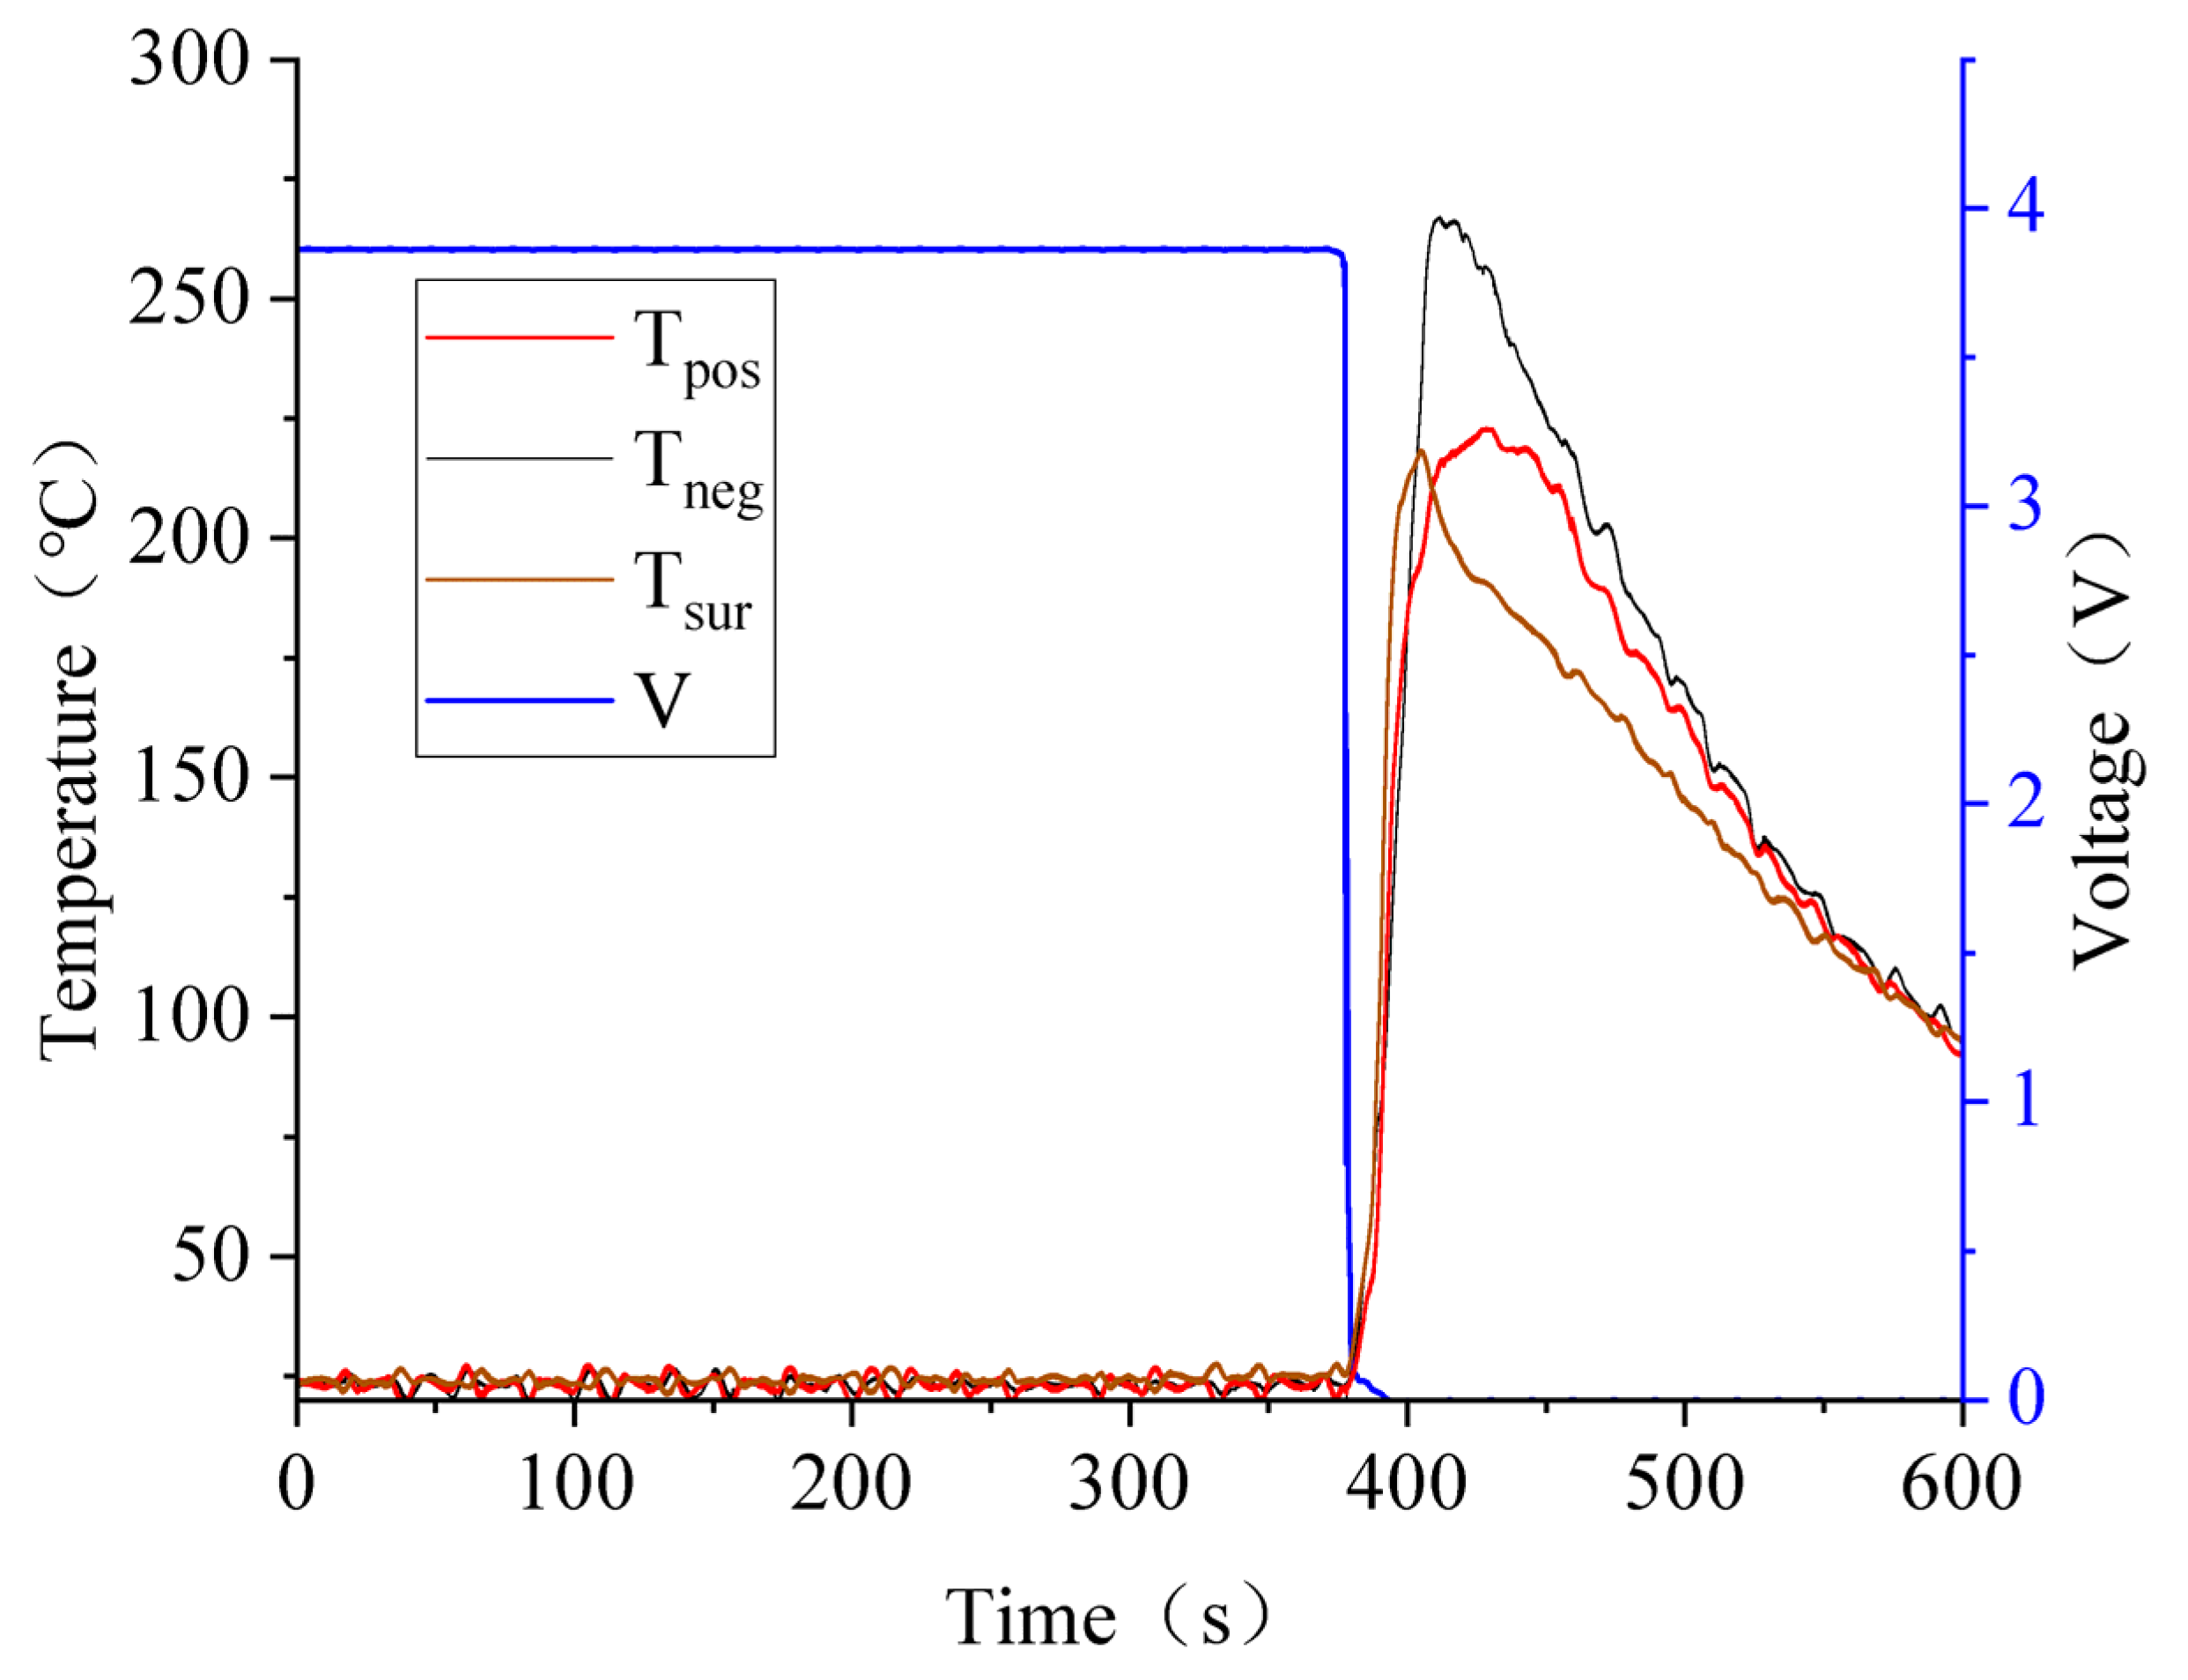
3.2. Battery Extrusion Experiments under Different Loading Speeds

Considering that the speed of the mechanical damage suffered by the battery during actual use is not uniform, the response characteristics of the battery when a thermal runaway occurs are caused when the different extrusion speeds are not the same. In this chapter, we set values of 0.1 mm/min, 1 mm/min, and 5 mm/min to radially load the soft pack battery and study the effect of different loading speeds on the thermal runaway response characteristics of this battery.
Figure 5 shows the load displacement curves of three groups of identical SOC cells under different extrusion speeds of the universal testing machine. F1 is the force generated at the extrusion speed of 1 mm/min, F5 is the force generated at the extrusion speed of 5 mm/min, and F0.1 is the force generated at the extrusion speed of 0.1 mm/min. The extrusion speed of 1 mm/min and 5 mm/min is the same order of magnitude, so the two curves are close. At the extrusion speed of 1 mm/min, the battery reaches the peak load of 62.012 kN at an extrusion displacement of 6.22 mm; in addition, at an extrusion speed of 5 mm/min, the peak load of 63.644 kN was reached at a displacement of 6.38 mm. The load–displacement curve of the battery at 0.1 mm/min was different more from the other two sets of tests, reaching a peak load of 50.641 kN at a displacement of 5.52 mm. From these three curves, it can be seen that, although the two curves are similar at an extrusion speeds of 1 and 5 mm/min, it is easy to conclude that the cell failure displacement and peak load will increase with the faster extrusion speed by combining the curves at the 0.1 mm/min extrusion speed. In addition, the curve at the 0.1 mm/min speed is higher in the secondary peak after a battery failure, presumably owing to the small loading speed and low destruction of the battery, and there is still some energy inside the battery after a single failure.
Different extrusion speeds of the tester mainly have a more obvious effect on the load–displacement curve of the battery, and little effect on the voltage and temperature of the battery. The highest temperature of the battery at under an extrusion speed of 0.1 mm/min is 74.6 °C, whereas 71.4 °C is the highest temperature of the surface of the battery under a 5 mm/min extrusion speed, and the specific effect of the extrusion speed on the temperature of the battery cannot be inferred when comparing with the 1 mm/min curve.

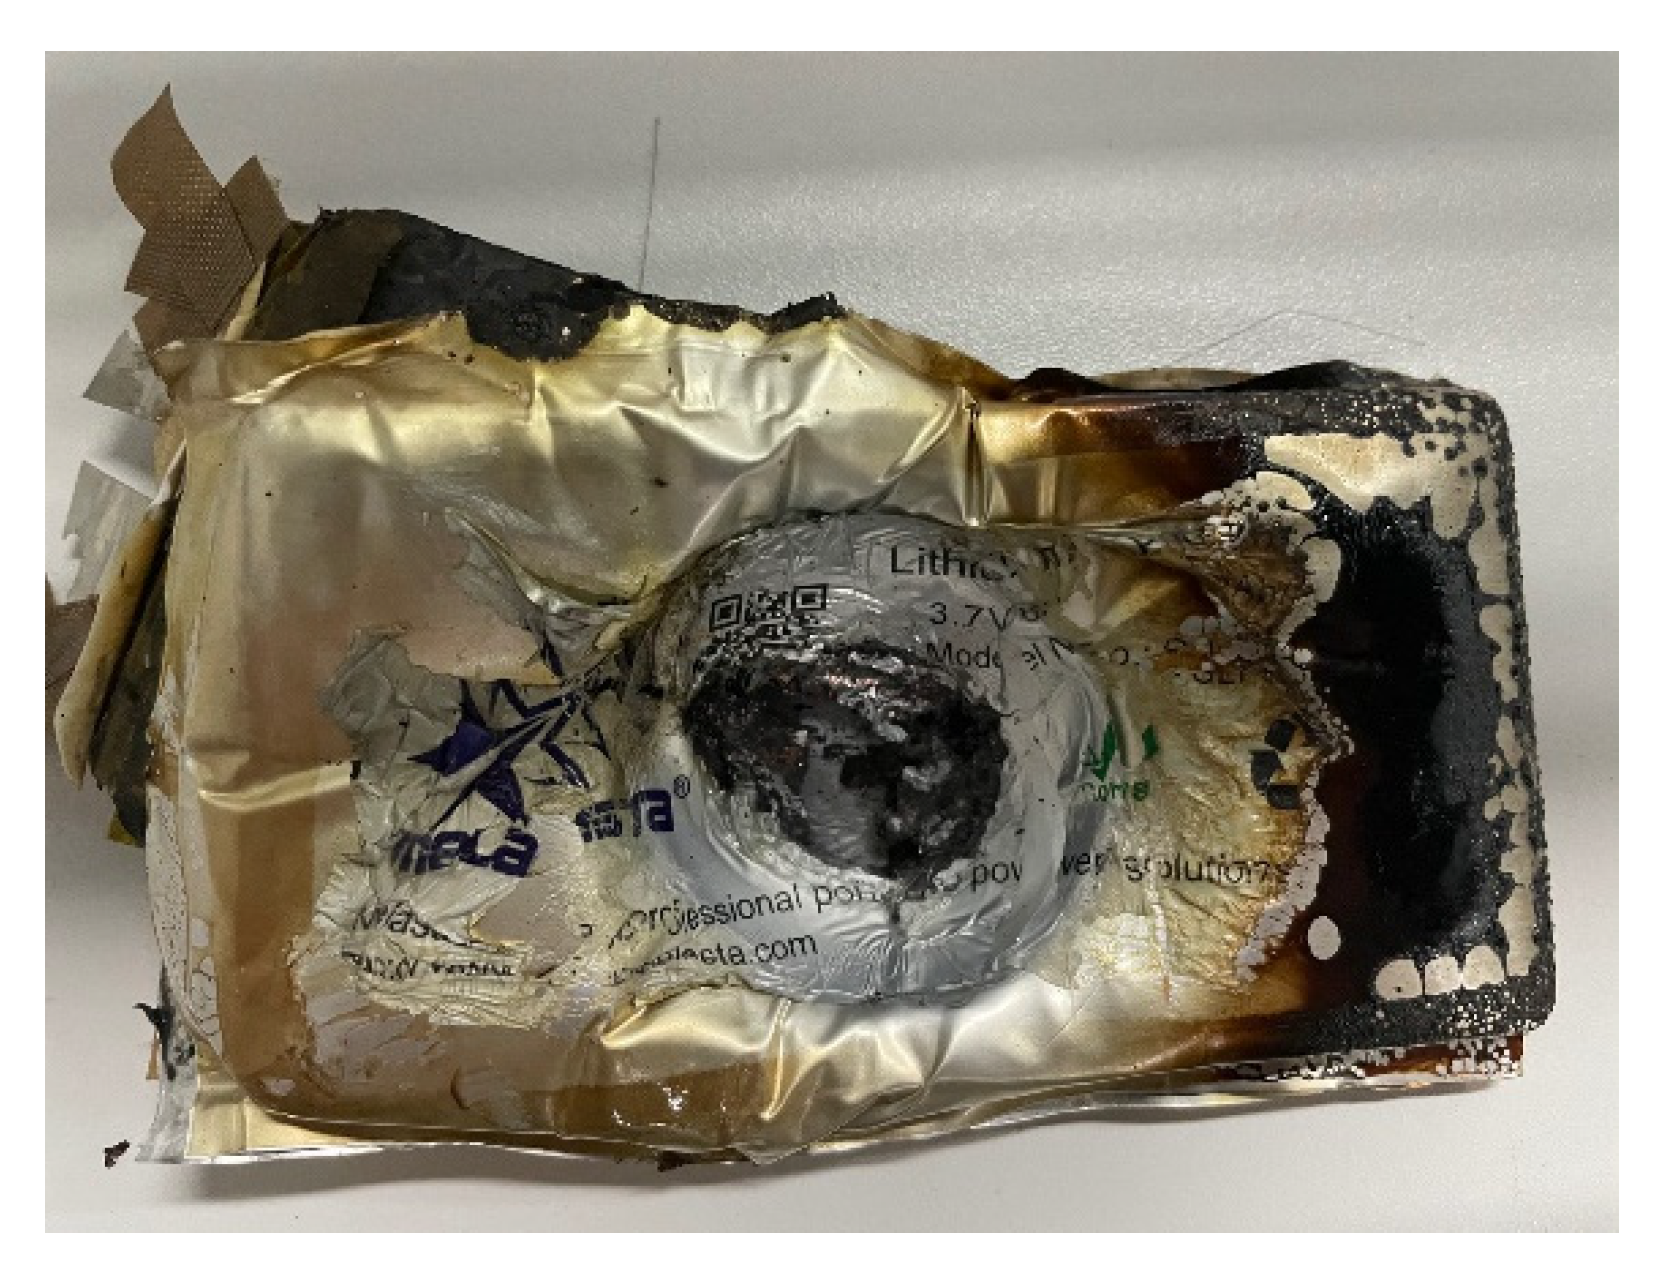
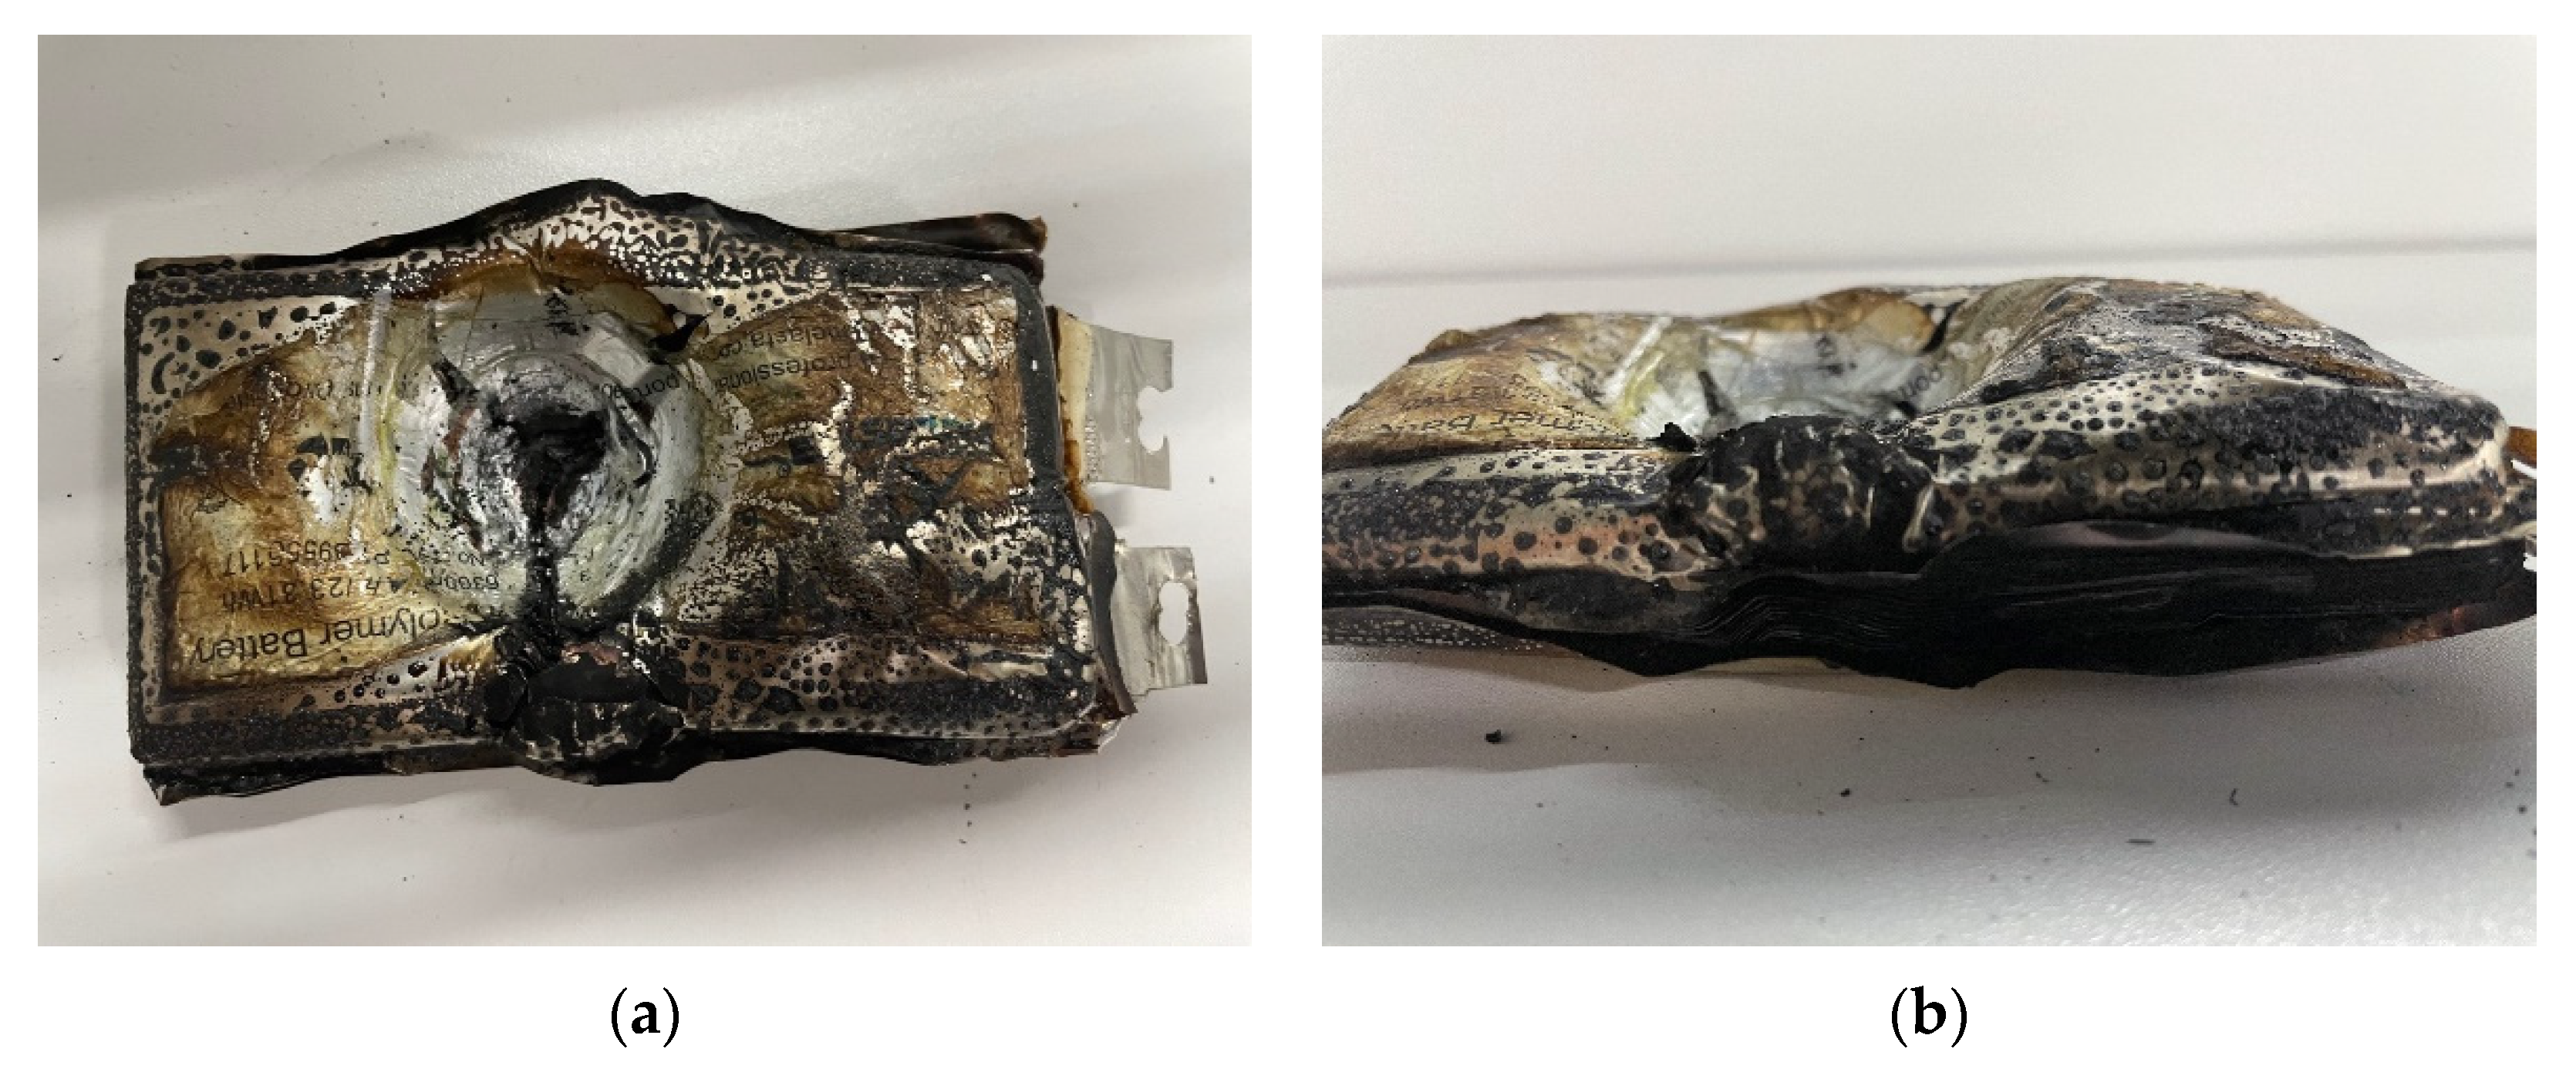
3.3. Battery Squeezing Experiment with Different SOCs

The battery charge state changes during use, and thus research into battery safety should not only test the battery in a certain state, but also consider experiments on the complete cycle of the battery. Six types of lithium soft pack batteries with charge states of 0%, 20%, 40%, 60%, 80% and 100% were set up and radially loaded with a loading speed of 1 mm/min to study the influence of different SOCs on the mechanical and electrochemical properties of the battery, and thus analyze the battery safety from two dimensions: displacement and maximum temperature at the moment of a thermal runaway. Combined with the thermal imaging map of the surface temperature taken by a thermal imager at the moment of battery failure, the battery extrusion process under each SOC was analyzed and studied.
(1)
Battery SOC = 0%.
Figure 6 shows the voltage and temperature curves of the 0% SOC battery under extrusion. V is the voltage of the battery, Tpos is the temperature at the positive terminal, Tneg is the temperature at the negative terminal, and Tsur is the temperature at the center surface. The voltage of the battery decreases extremely quickly at 330 s (5.5 mm), and the temperature of the lugs and the surface of the battery increase rapidly. At 360 s (6 mm) the temperature of the lugs and the surface of the battery reach the peak; in addition, the maximum temperature of the negative terminal is 48.2 °C, the maximum temperature of the positive terminal is 48.1 °C, and the maximum temperature of the surface is 43.2 °C. The battery did not catch fire or generate smoke throughout the entire process, and reached the failure boundary when the external surface of the soft pack battery aluminum plastic film ruptured with a sound. After the test, the battery was completely penetrated, and some of the internal components of the battery were observed to have not burned, as shown in Figure 7 below.
(2)
Battery SOC = 20%.
Figure 8 shows the voltage and temperature curves of the 20% SOC state battery under an extrusion, which is quite different from the 0% SOC state battery. V is the voltage of the battery, Tpos is the temperature at the positive terminal, Tneg is the temperature at the negative terminal, and Tsur is the temperature at the center surface. The cell voltage decreases extremely quickly at 360 s (6 mm), and the temperature of the lug and surface rises rapidly. At 410 s (6.83 mm) the peak temperature of the lug and surface is shown, with the highest temperature of the negative lug reaching 86.5 °C, the highest temperature of the surface reaching 82.6 °C, and the highest temperature of the positive pole reaching 80.5 °C. Compared with the 0% SOC state battery, the battery failure displacement under 20% SOC is greater, which means that the 20% SOC battery has more difficulty reaching the thermal runaway boundary, although the maximum temperature at the time of battery failure is greater, which means more destruction. At the moment of battery failure, compared to the 0% SOC state battery, the battery surface temperature is no longer the lowest among the three, and the difference with the positive pole lug temperature is insignificant, probably because the internal temperature of the battery exceeds 80 °C. In addition, some of the SEI film underwent a decomposition reaction, and the graphite had a better thermal conductivity at room temperature. Fire and smoke were avoided throughout the complete process of the battery, and the failure boundary was reached when the external surface of the soft pack battery aluminum plastic film rupture sound was larger. After the test, the battery was completely penetrated and some components inside the battery were observed to have undergone severe shrinkage but were not completely burned, as shown in Figure 9 below.
(3)
Battery SOC = 40%.
Figure 10 shows the voltage and temperature curves of the 40% SOC battery under extrusion, and the curves follow a similar trend as those of the 20% SOC battery. V is the voltage of the battery, Tpos is the temperature at the positive terminal, Tneg is the temperature at the negative terminal, and Tsur is the temperature at the center surface. The voltage of the battery decreases extremely quickly at 370 s (6.17 mm), and the temperature of the lug and the surface of the battery increases rapidly. At 420 s (7 mm), the temperature of the lug and the surface of the battery reach the peak, and the temperature of the negative lug is the highest at 95.6 °C, the highest temperature of the positive pole is 90.2 °C, and the highest temperature of the surface is 88 °C. The 40% SOC battery curve was compared with the 20% SOC battery curve. In the case of the 40% SOC battery curve in comparison with the 20% SOC battery curve, the failure displacement was greater, the maximum temperature of the battery was elevated after failure, and the negative terminal temperature was still the highest of the three. During this process, the battery did not catch fire, but there was smoke, and the overall performance was similar to that of the 20% SOC battery. Experiments using a thermal imager were conducted to take thermal imaging photographs of a moment of the battery surface extrusion, as shown in Figure 11. During the extrusion process, the battery surface temperature was more uniform, the highest temperature reached 83.2 °C, and because the thermal imager collection range could not completely fit the shape of the battery, the lowest temperature and average temperature values are inaccurate. However, it can be observed that the battery surface temperature was lower near the indentation head. There was smoke when the battery failed during the test, as shown in Figure 12.
(4)
Battery SOC = 60%.
Figure 13 shows the voltage and temperature profiles of the 60% SOC cell under extrusion, which starts to differ dramatically from the other SOC cells. V is the voltage of the battery, Tpos is the temperature at the positive terminal, Tneg is the temperature at the negative terminal, and Tsur is the temperature at the center surface. The battery voltage decreases extremely quickly at 375 s (6.25 mm) and the temperature of the lugs and the surface of the battery increase rapidly. At 415 s (6.92 mm) the peak temperature of the battery lugs and the surface is shown, with the highest temperature of the negative lugs at 267.1 °C, the highest temperature of the positive pole at 222.9 °C, and the highest temperature of the surface at 218.3 °C. The curve of the 60% SOC battery is compared with other SOC state battery curves, the maximum temperature of the battery after failure increases significantly, the maximum temperature at all three temperature collection points exceeds 200 °C, and the temperature difference between the negative pole and the other two locations increases significantly. The battery did not catch fire during the extrusion process, but there was a large amount of smoke, as shown in Figure 14. After the test, the battery was completely penetrated and there were some burning traces on the surface of the battery, but the outer surface of the battery aluminum plastic film was not completely burned, as shown in Figure 15.
(5)
Battery SOC = 80%.
Figure 16 shows the voltage and temperature profiles of the 80% SOC cell under extrusion, which are similar to those of the 60% SOC cell. V is the voltage of the battery, Tpos is the temperature at the positive terminal, Tneg is the temperature at the negative terminal, and Tsur is the temperature at the center surface. The cell voltage decreases extremely quickly at 380 s (6.33 mm), and the temperature of the lugs and the cell surface increases rapidly. At 430 s (7.17 mm) the cell lug and surface temperatures reach their peak, with the highest negative lug temperature at 311.5 °C, the highest positive temperature at 251 °C, and the highest surface temperature at 204.1 °C. Compared with the 60% SOC battery, the highest temperature of the negative electrode reached more than 300 °C, and there was a big difference in the temperature at all three locations. During the extrusion process, the battery cracked from the side with a bang, and the internal battery electrode was red and smoldering under a high temperature, as shown in Figure 17. After the test, there were signs of burning on the surface of the battery, and the aluminum film on the surface of the battery completely burned, although the appearance of the burning was relatively intact and not broken, and the battery was cracked around the side, as shown in Figure 18.
(6)
Battery SOC = 100%.
Figure 19 shows the voltage and temperature curves of the 100% SOC battery under extrusion, which is the most unique among the SOC extrusion tests for each state. V is the voltage of the battery, Tpos is the temperature at the positive terminal, Tneg is the temperature at the negative terminal, and Tsur is the temperature at the center surface. The cell voltage drops extremely quickly at 345 s (5.75 mm), and the temperature of the lugs and the cell surface increases rapidly. At 350 s (5.83 mm) the cell lug and surface temperatures reach their peak and the cell surface temperature is the highest at 660.5 °C; in addition, the highest temperature of the negative terminal is 353 °C and the highest surface temperature is 339.7 °C. During the violent combustion that occurred in the 100% SOC, the aluminum-plastic film on the cell surface and the other materials reacted, generating a lot of heat and resulting in the surface temperature of the battery being more than 300 °C higher than that of the other two batteries. In addition, the battery made a loud noise and an open fire began when the test failed, as shown in Figure 20. After the test, we could see substances precipitated inside the battery and attached to the side of the electrode sheet, likely small particles ejected from the melted aluminum foil, as shown in Figure 21.

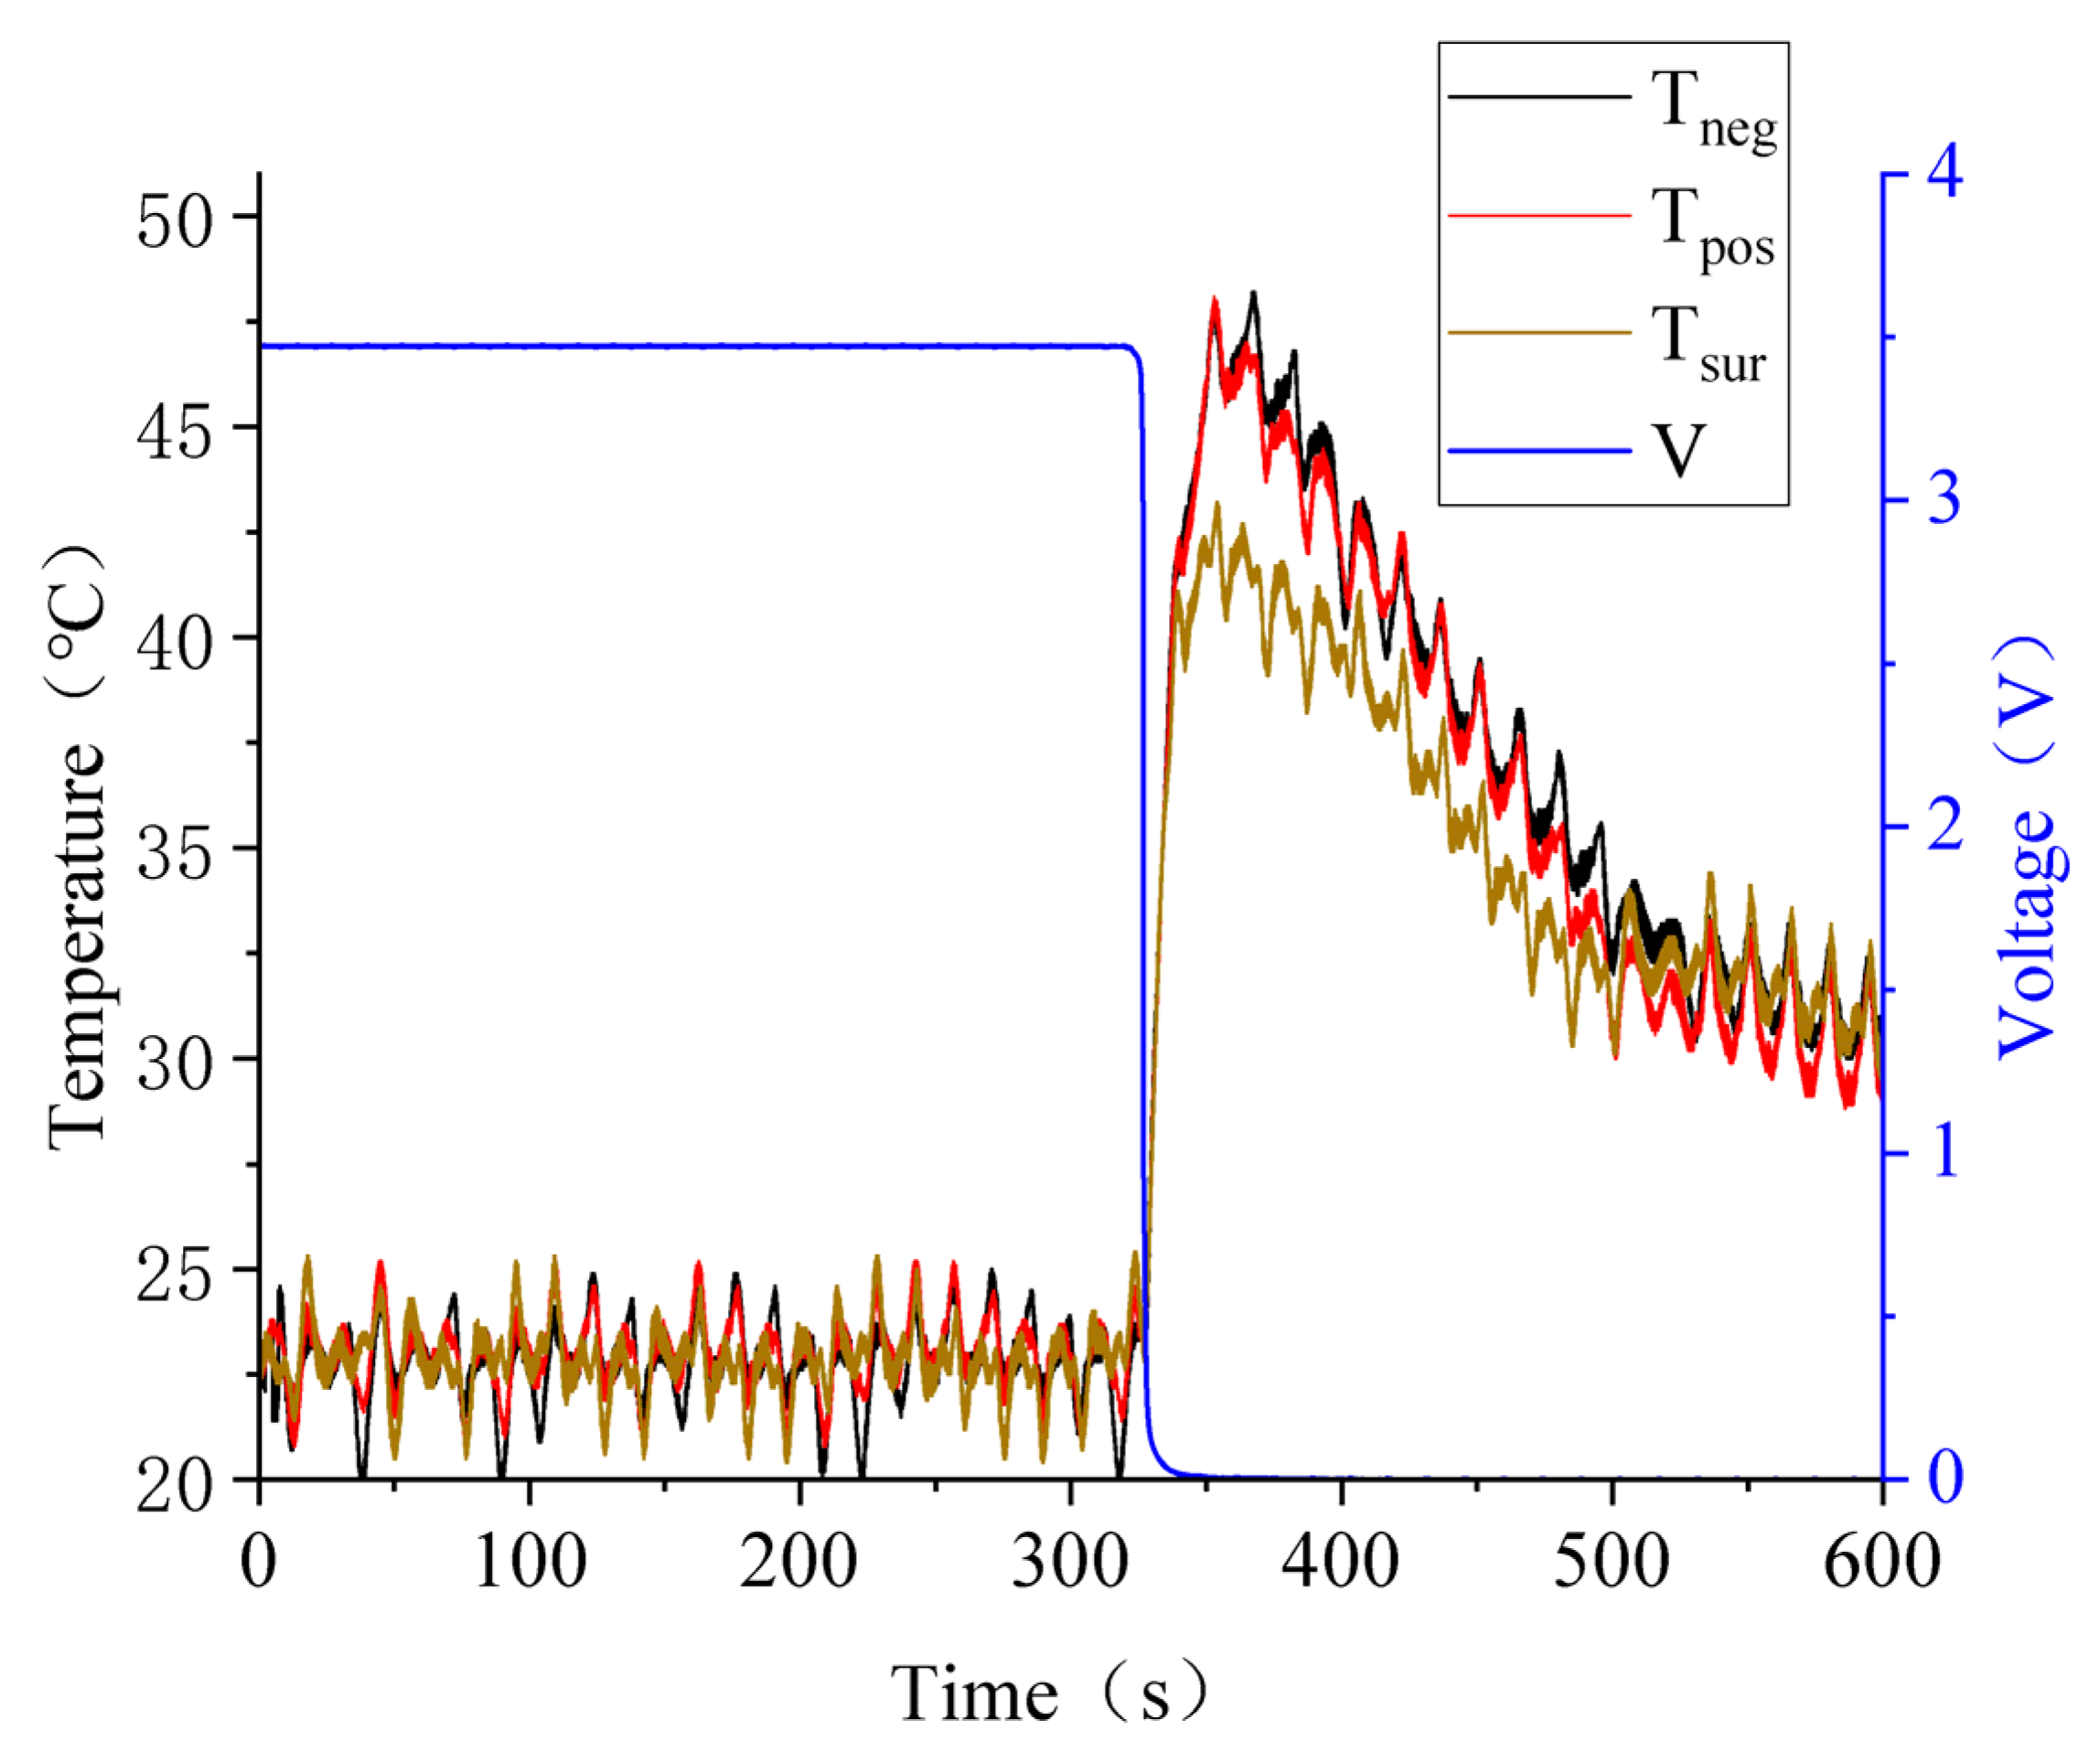
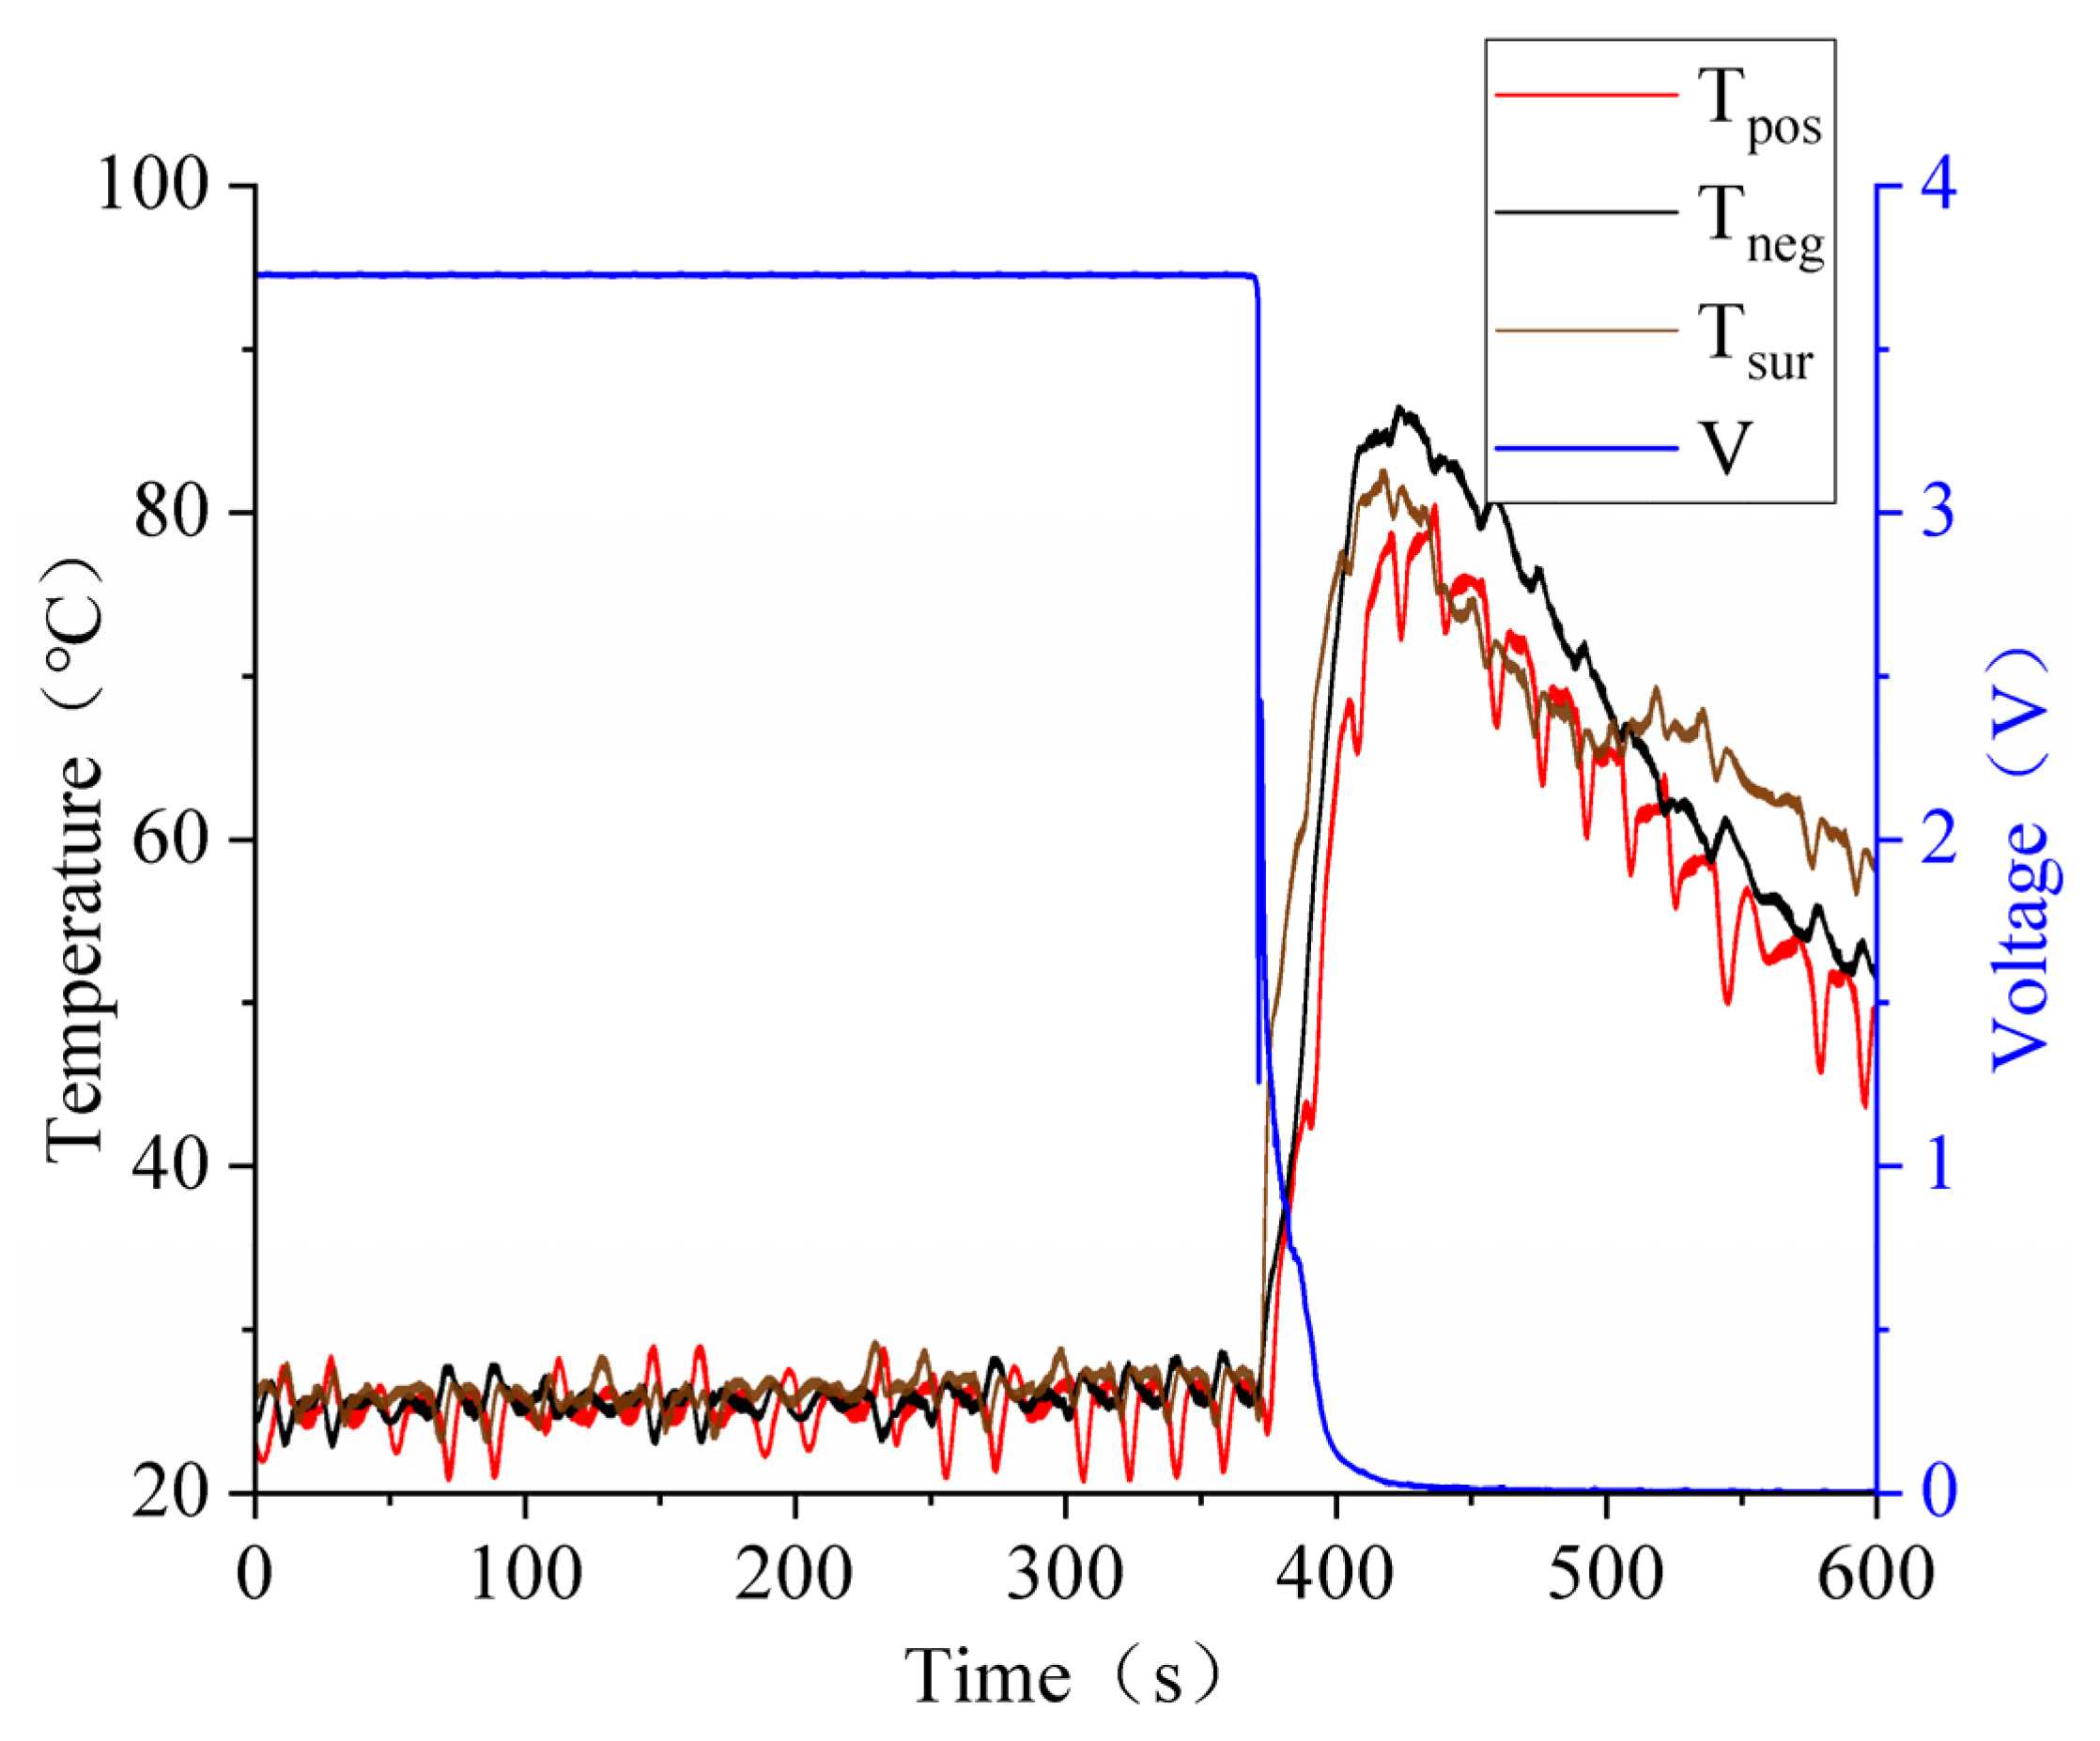
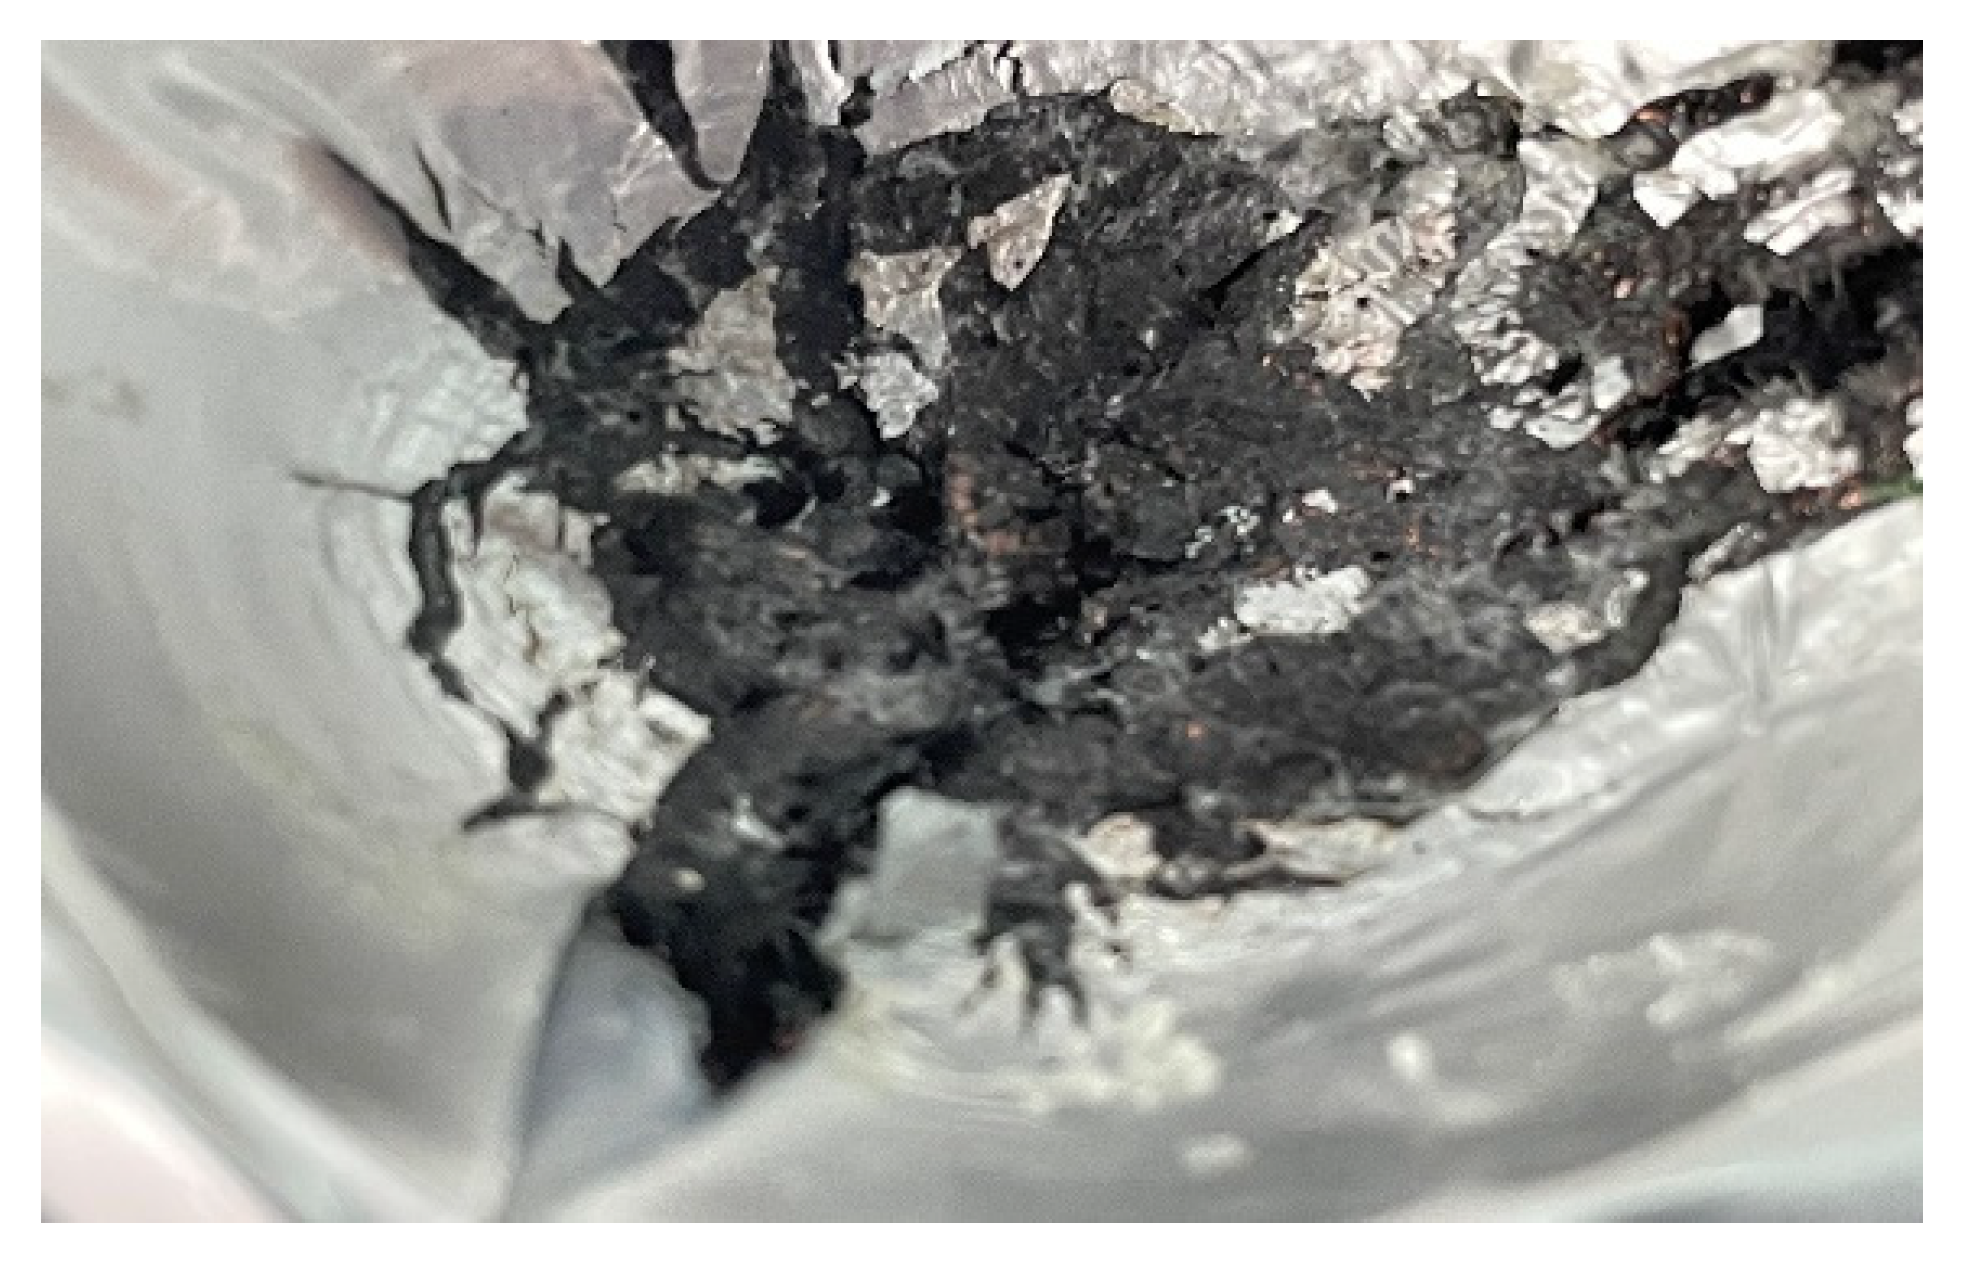
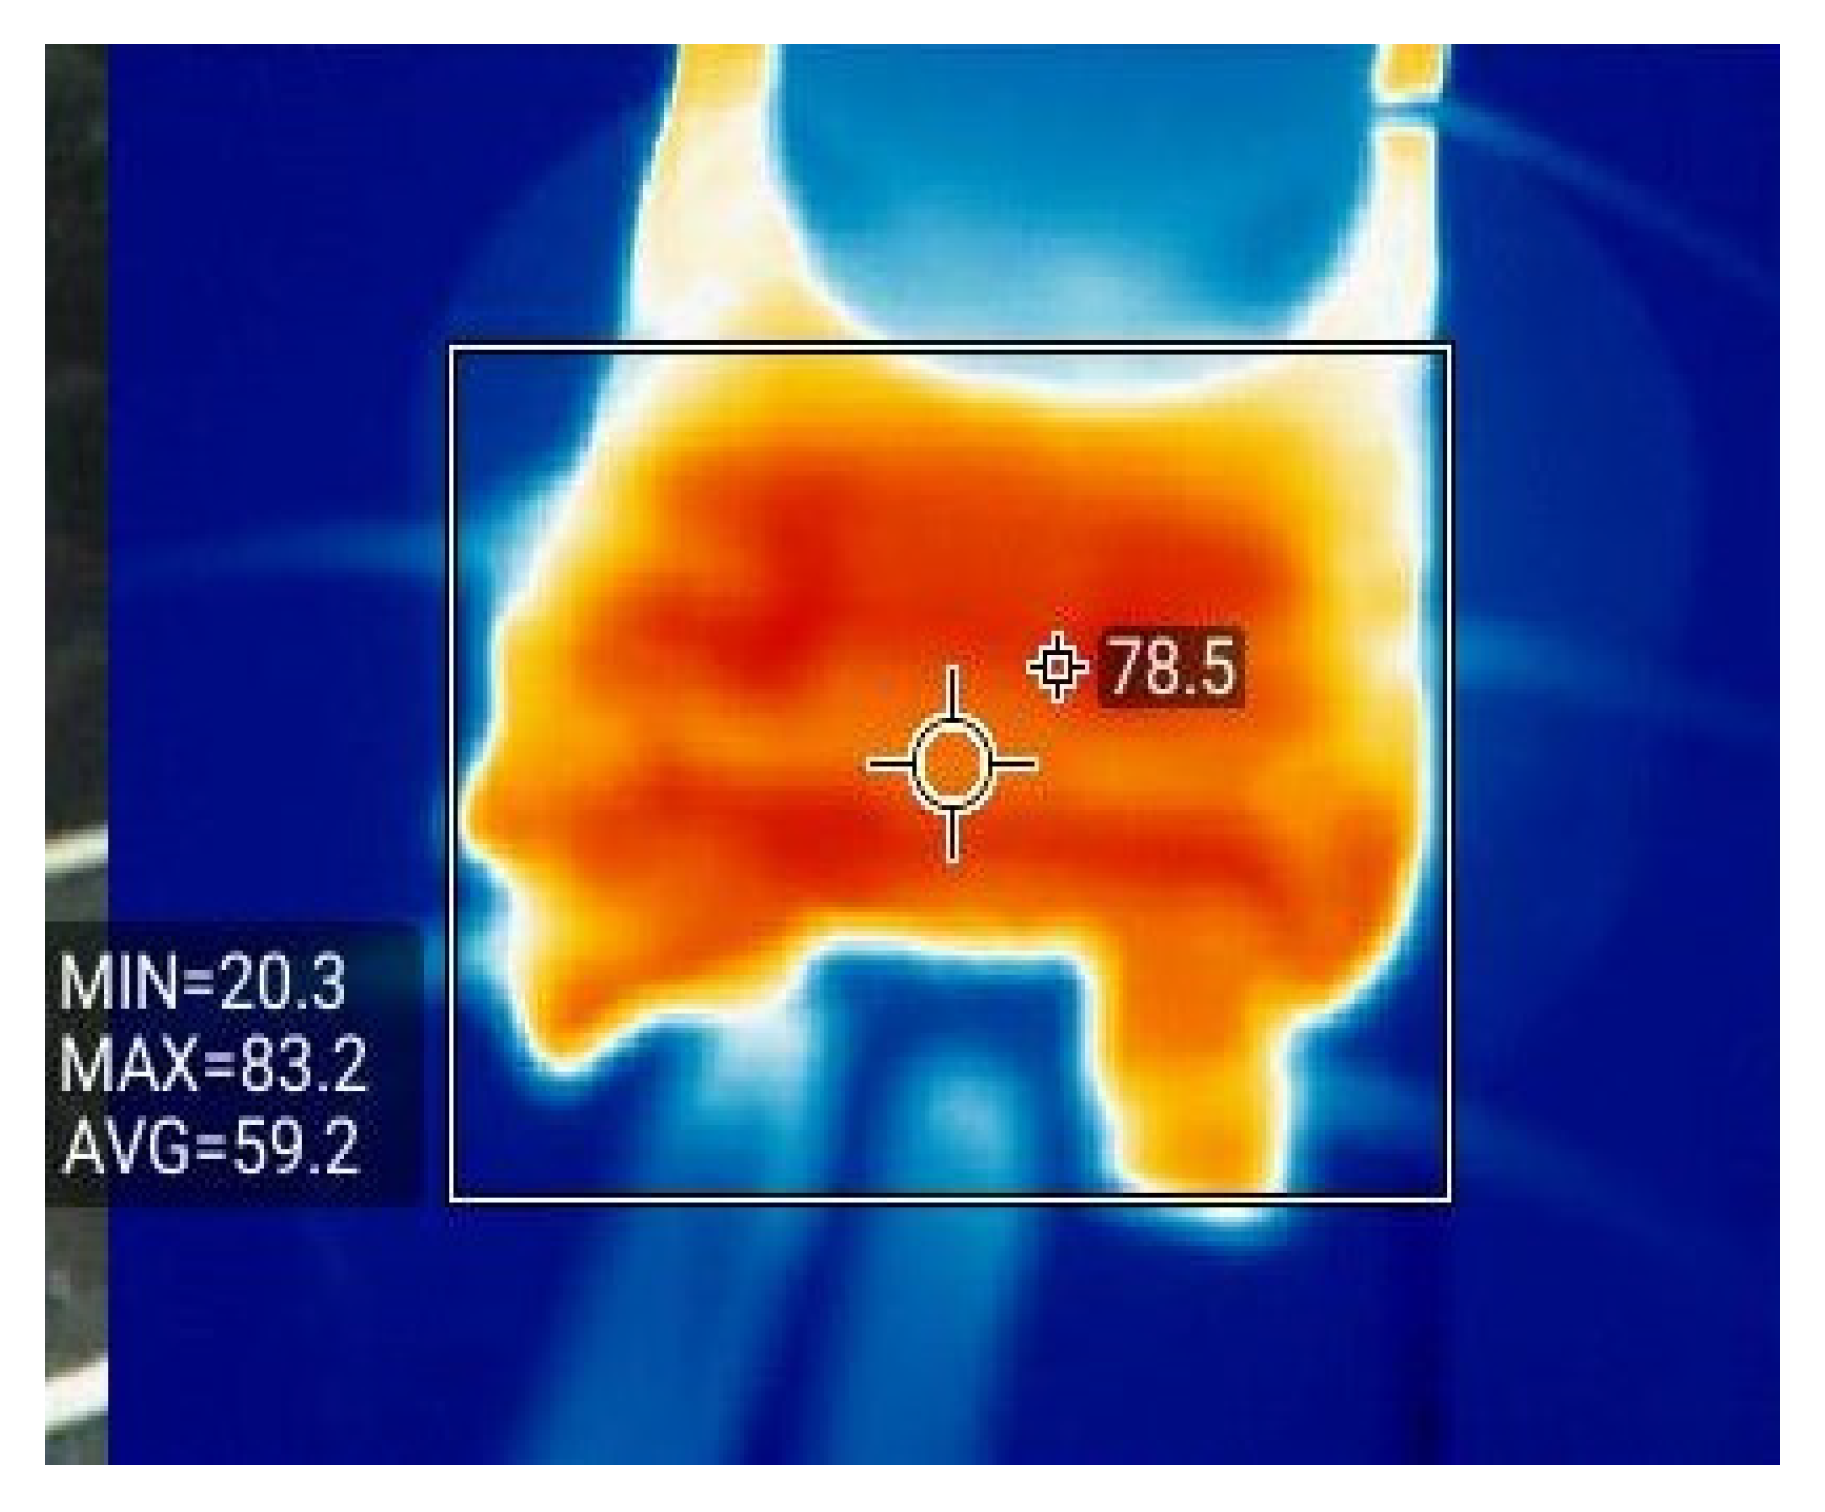
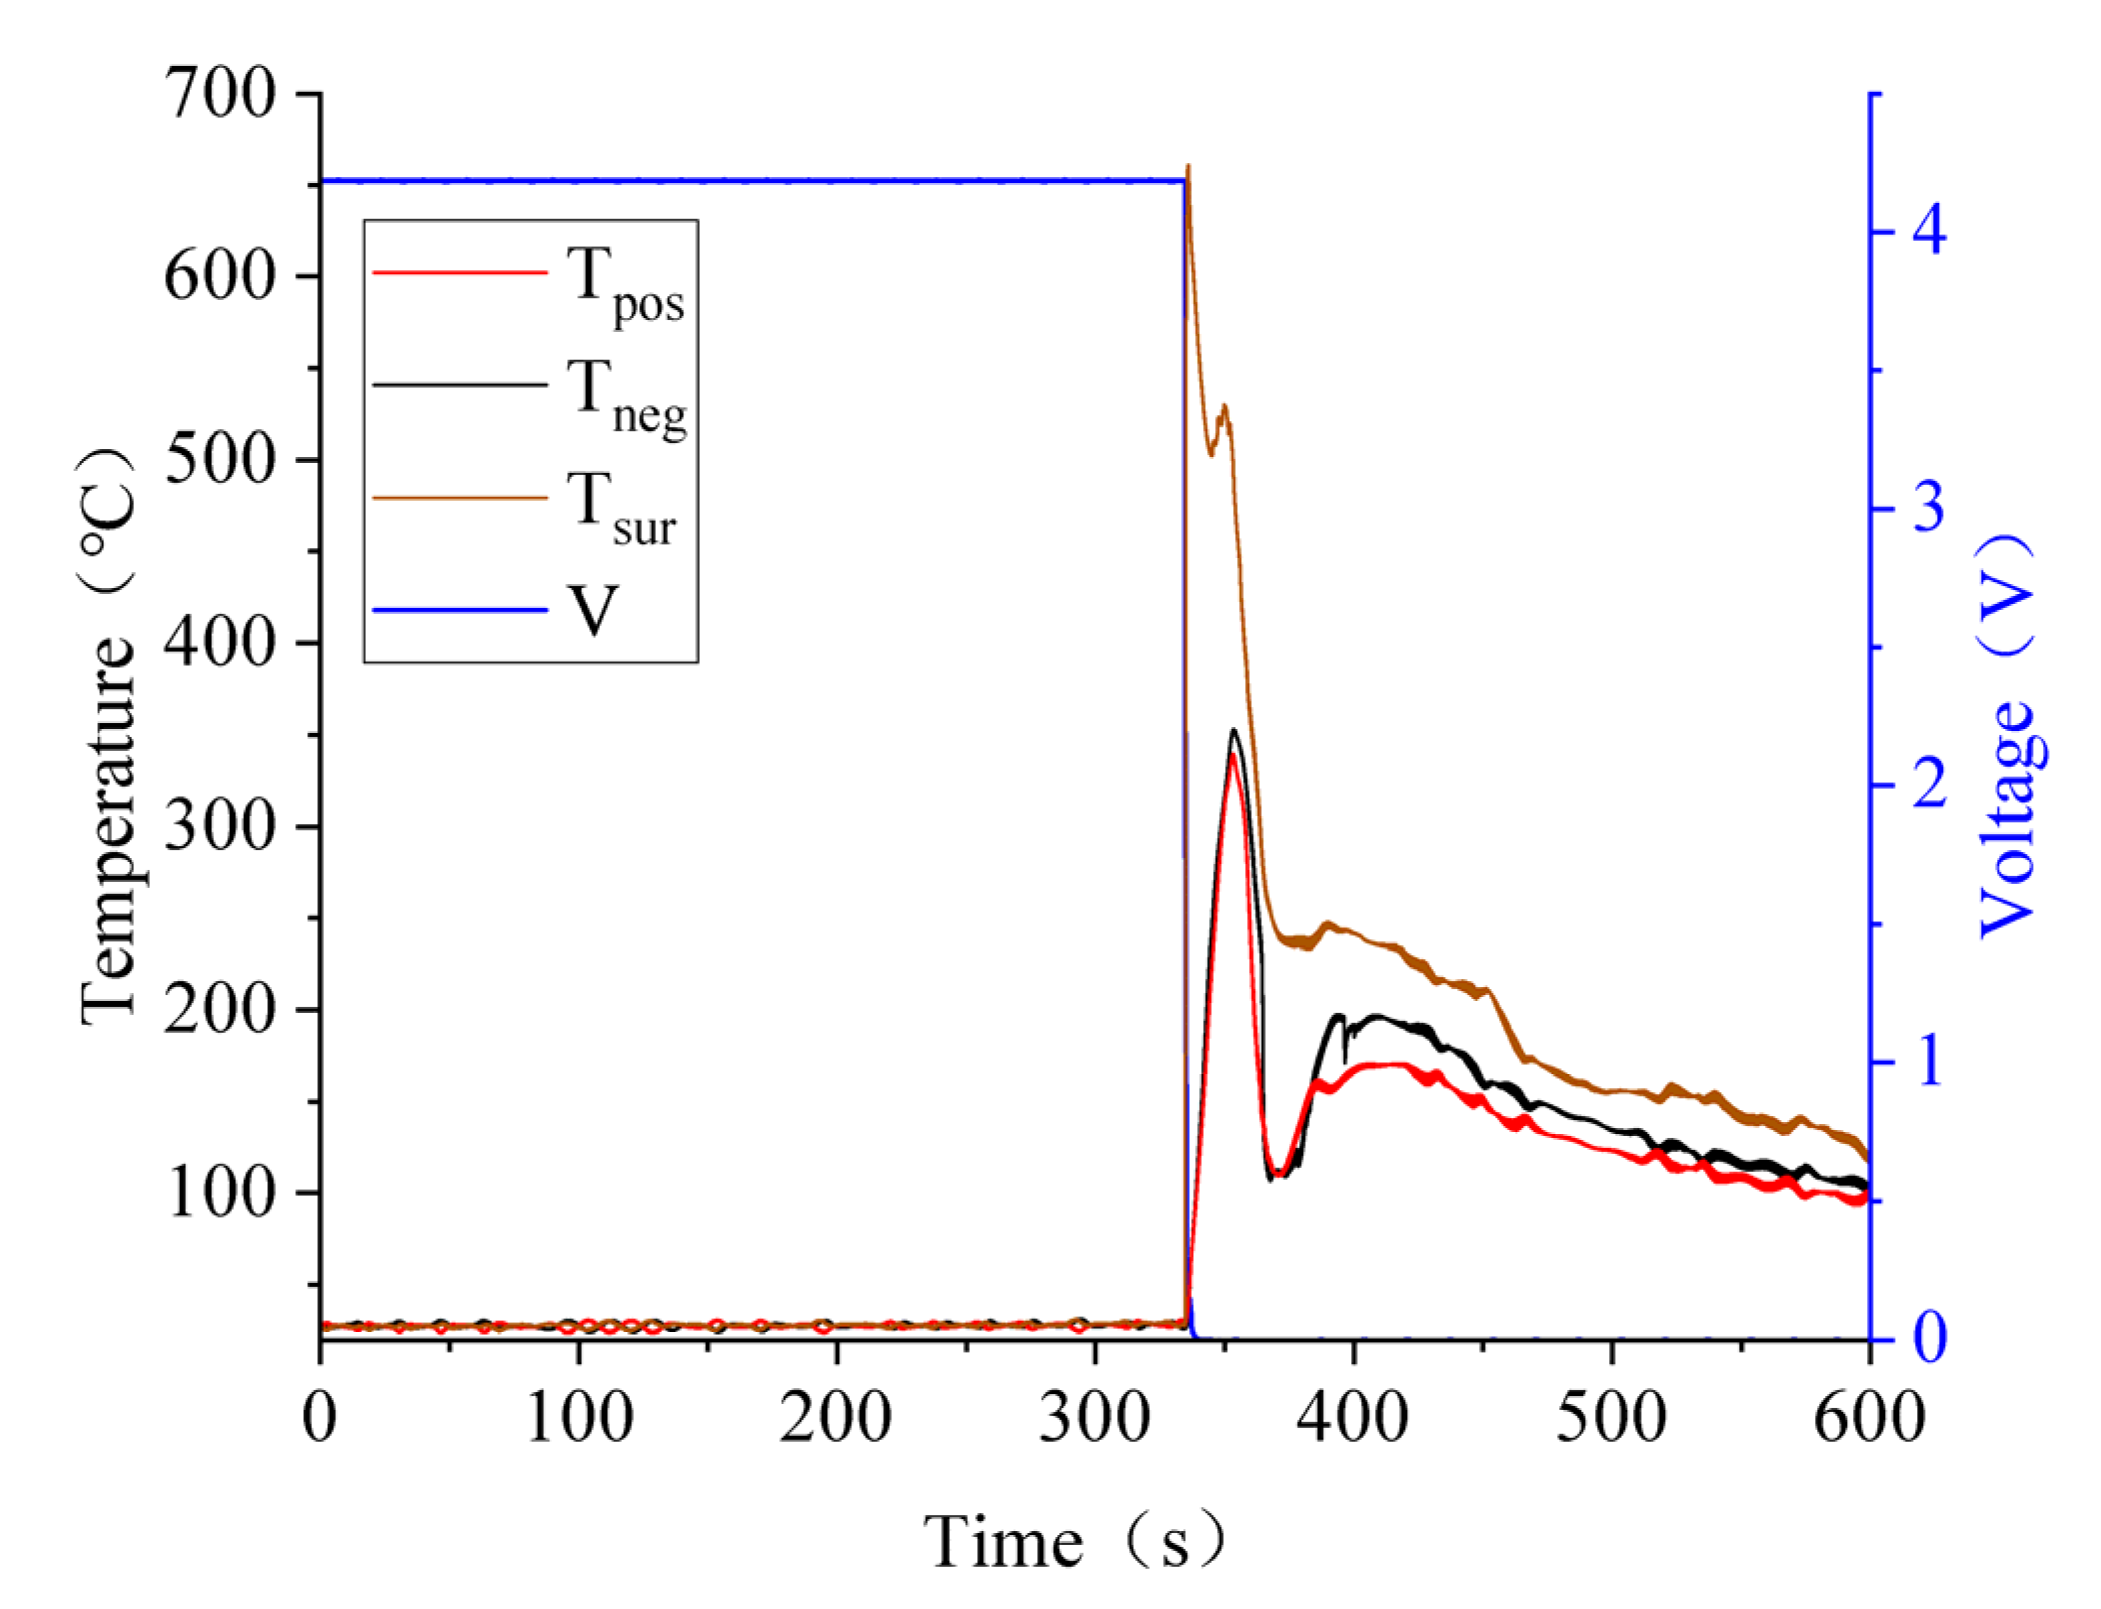
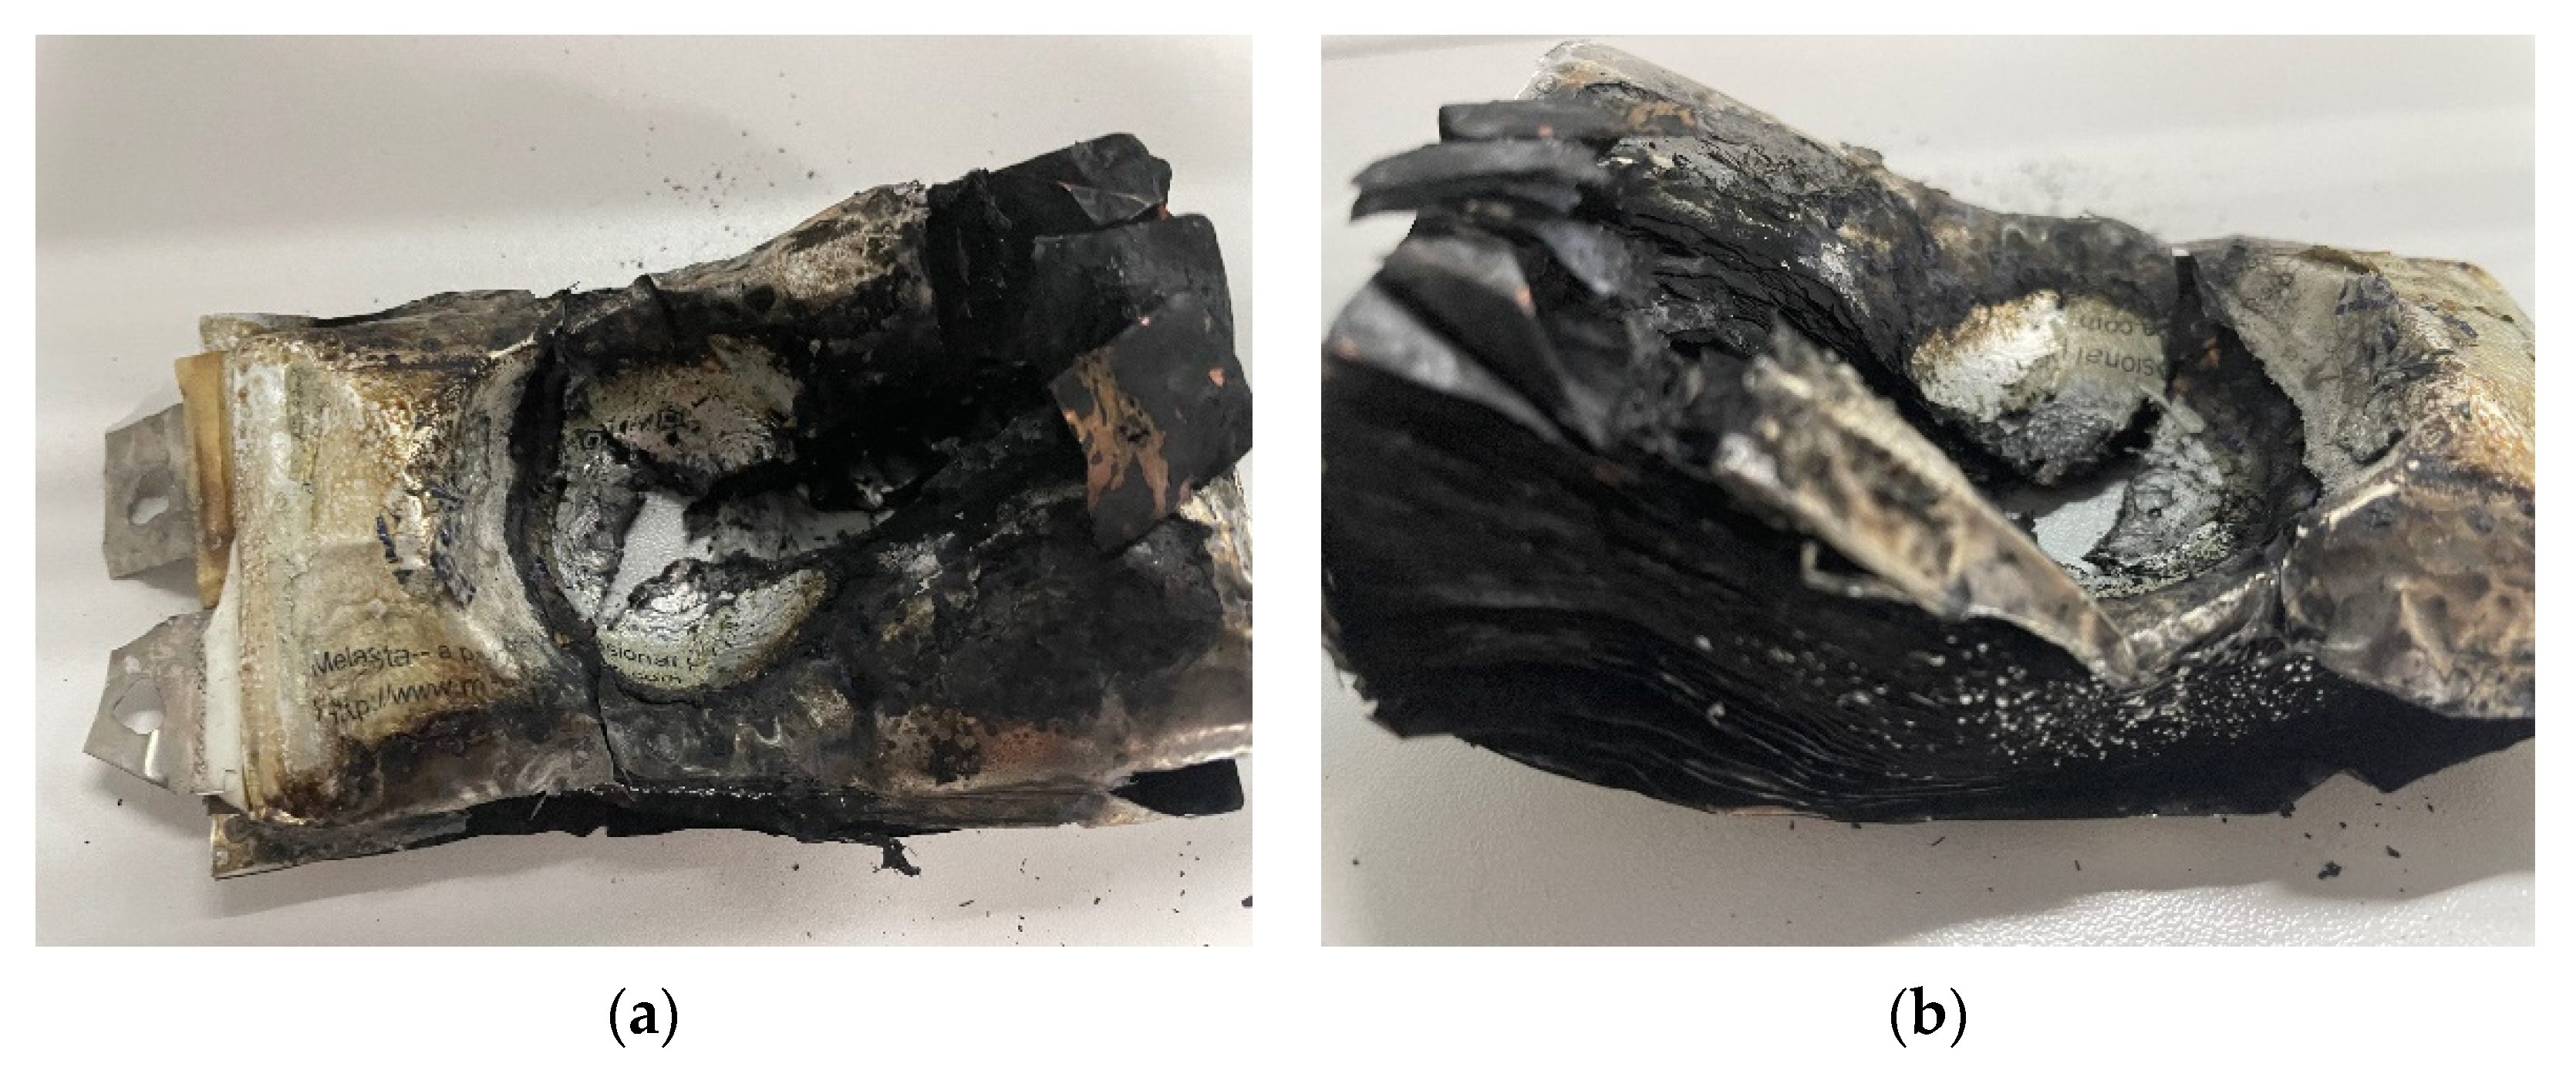
3.4. Effect of SOC Variation on Battery Thermal Runaway Response

From above, it can be obtained from the experiments that the higher the battery SOC state, the more destructive the battery failure and the higher the peak temperature when thermal runaway is higher. However, the peak load when battery thermal runaway occurs is not simply increased with the increase of SOC, so the peak temperature or the thermal stability of the peak load cannot be used as an indicator. According to the research of other scholars on the thermal stability of batteries, the maximum load and peak temperature in the case of thermal runaway of batteries are also important factors to evaluate the thermal stability of batteries [46]. Figure 22 shows the peak load and failure temperature under different SOCs. In the figure, Fmax is the maximum load, Tp is the peak temperature at the positive terminal, Tn is the peak temperature at the negative terminal, and Tsur is the peak temperature at the center surface.
For the maximum load, 60% SOC is a turning point. Before 60% SOC, the maximum load of the battery increases with the increase of SOC. In other words, the battery with higher SOC will fail under a greater load, which means that the battery in this state is less likely to fail, that is, safer. However, when the SOC state of the battery is greater than 60%, the load required to trigger failure becomes smaller and smaller due to the excessive internal energy of the battery, and thermal runaway is more easily triggered, that is, more dangerous. For the failure temperature, the higher the SOC state, the more reactive materials in the battery, the more energy stored in the battery, the more full and violent the reaction will be in the event of failure, and the temperature trend of the battery failure will also increase. As can be seen from the figure, the peak load of battery failure at 80% and 20% SOC state is 53,430 N and 53,852 N respectively, with a difference of 1%, that is, the thermal runaway boundary of the battery at the 80% and 20% SOC states is almost the same. However, the maximum load of battery failure under the 100% SOC state is 48,669 N, which means that the battery under the 100% SOC state is the most prone to thermal runaway as well as the most destructive among the six groups of batteries.

4. Conclusions

The differences between different batteries may have an impact on subsequent research, so we designed and conducted experiments to verify the repeatability of the battery extrusion test. Considering that the mechanical damage speed of the battery is not uniform in the actual use process, when the extrusion speed is different, it may cause the response characteristic of the battery when the thermal runaway occurs. Therefore, different extrusion speeds of 0.1 mm /min, 1 mm /min and 5 mm /min were set respectively for radial loading of the soft-pack battery. The effects of different loading speeds on thermal runaway response characteristics of soft-pack batteries were studied. In addition, considering that the SOC of the battery will change during use, research on battery safety should not only test the battery in a certain state, but also consider the complete cycle of the battery. Therefore, six kinds of SOC experiments of 0%, 20%, 40%, 60%, 80% and 100% were set up. Loading tests were conducted on different SOC state batteries using a 1 mm/min extrusion speed, and the load, temperature, and voltage changes of this high-rate lithium LiCoO2 soft pack battery were measured during the extrusion process, and the influence of SOC on the response characteristics of the battery under extrusion was analyzed.
By comparing the battery images after the test and referring to previous studies [40], it is found that the battery before 60% SOC is tested, was completely penetrated, although the expansion volume was not obvious, which was due to the peak temperature of the runaway battery not reaching the trigger temperature of the cathode decomposition reaction, and the cathode not decomposing inside the battery to generate oxygen. After 60% SOC, the peak temperature of the battery surface is greater than 200 °C, which exceeds the 180 °C triggered by the decomposition reaction of LiCoO2 lithium cathode. Therefore, during the internal decomposition of the battery, the cathode generated oxygen, resulting in an expansion of the battery’s surface.
The study found that the higher the SOC inside the battery—which means more energy inside the battery—the higher the peak temperature of the battery during thermal runaway. Within a certain range of state of charge, with the increase of SOC, the higher the peak load of the battery, the larger the battery failure displacement boundary, and it is more difficult for the battery to reach the thermal runaway boundary. Thus, to the extent that higher SOC makes it harder for a battery to experience thermal runaway, which in turn means it is safer, so the effect of SOC on battery safety is not simply a monotonous relationship. In addition, it is found in the above research that the batteries with more than 60% SOC state all have destructive phenomena in the extrusion test, such as smoke and open flame. This phenomenon may trigger the thermal runaway of other battery cells in the battery pack, resulting in a safety accident of the whole vehicle. Therefore, on the premise that other conditions remain unchanged, maintaining the battery at 60% SOC as far as possible will be relatively safe in case of collision, which provides a new idea for battery management and safety management.

Author Contributions

Conceptualization, F.W.; Validation, M.S.; Resources, N.Y.; Data curation, F.L.; Writing–original draft, X.R.; Supervision, J.W. All authors have read and agreed to the published version of the manuscript.

Funding

This research was funded by the Natural Science Foundation of Shandong Province grant number ZR2020ME129 and the National Natural Science Foundation of China grant number 51905121.

Conflicts of Interest

The authors declare no conflict of interest.

References

  1. Wang, Q.; Ping, P.; Zhao, X.; Chu, G.; Sun, J.; Chen, C. Thermal runaway caused fire and explosion of lithium ion battery. J. Power Sources 2012, 208, 210–224. [Google Scholar] [CrossRef]
  2. Huang, L.; Zhang, Z.; Wang, Z.; Zhang, L.; Zhu, X.; Dorrellc, D.D. TR behavior during overcharge for large-format Lithium-ion batteries with different packaging patterns. J. Energy Storage 2019, 25, 100811. [Google Scholar] [CrossRef]
  3. Feng, X.; Xu, C.; He, X.; Wang, L.; Zhang, G.; Ouyang, M. Mechanisms for the evolution of cell variations within a LiNixCoyMnzO2/graphite lithium-ion battery pack caused by temperature non-uniformity. J. Clean. Prod. 2018, 205, 447–462. [Google Scholar] [CrossRef]
  4. Feng, X.; Ouyang, M.; Liu, X.; Lu, L.; Xia, Y.; He, X. TR mechanism of lithium ion battery for electric vehicles: A review. Energy Storage Mater. 2018, 20, 246–267. [Google Scholar] [CrossRef]
  5. Liu, X.; Ren, D.; Hsu, H.; Feng, X.; Xu, G.L.; Zhuang, M.; Han, G.; Lu, L.; Han, X.; Chu, Z.; et al. TR of lithium-ion batteries without internal short circuit. Joule 2 2018, 10, 2047–2064. [Google Scholar] [CrossRef] [Green Version]
  6. Liu, P.; Sun, Z.; Wang, Z.; Zhang, J. Entropy-based voltage fault diagnosis of battery systems for electric vehicles. Energies 2018, 11, 136. [Google Scholar] [CrossRef] [Green Version]
  7. Lee, J.H.; Lee, H.M.; Ahn, S. Battery dimensional changes occurring during charge/discharge cycles—Thin rectangular lithium ion and polymer cells. J. Power Source 2003, 119, 833–837. [Google Scholar] [CrossRef]
  8. Lyu, P.; Liu, X.; Qu, J.; Zhao, J.; Huo, Y.; Qu, Z.; Rao, Z. Recent advances of thermal safety of lithium ion battery for energy storage. Energy Storage Mater. 2020, 31, 195–220. [Google Scholar] [CrossRef]
  9. Chen, S.; Wang, Z.; Yan, W. Identification and characteristic analysis of powder ejected from a lithium ion battery during thermal runaway at elevated temperatures. J. Hazard. Mater. 2020, 400, 123169. [Google Scholar] [CrossRef]
  10. Zhu, X.; Wang, Z.; Wang, C.; Huang, L. Overcharge investigation of large format lithium-ion pouch cells with Li (Ni0.6Co0.2Mn0.2)O2 cathode for electric vehicles: Degradation and failure mechanisms. J. Electrochem. Soc. 2018, 165, A3613–A3629. [Google Scholar] [CrossRef]
  11. Zhu, X.; Wang, Z.; Wang, Y.; Wang, H.; Wang, C.; Tong, L.; Yi, M. Overcharge investigation of large format lithium-ion pouch cells with Li (Ni0.6Co0.2Mn0.2) O2 cathode for electric vehicles: TR features and safety management method. Energy 2019, 169, 868–880. [Google Scholar] [CrossRef]
  12. Jiang, F.; Liu, K.; Wang, Z.; Tong, X.; Guo, L. Theoretical analysis of lithium-ion battery failure characteristics under different states of charge. Fire Mater. 2018, 42, 680–686. [Google Scholar] [CrossRef]
  13. Yang, R.; Xiong, R.; Shen, W.; Lin, X. Extreme Learning Machine-Based Thermal Model for Lithium-Ion Batteries of Electric Vehicles under External Short Circuit. Engineering 2020, 7, 395–405. [Google Scholar] [CrossRef]
  14. Chen, Z.; Xiong, R.; Lu, J.; Li, X. Temperature rise prediction of lithium-ion battery suffering external short circuit for all-climate electric vehicles application. Appl. Energy 2018, 213, 375–383. [Google Scholar] [CrossRef]
  15. Meng, J.; Boukhnifer, M.; Delpha, C.; Diallo, D. Incipient short-circuit fault diagnosis of lithium-ion batteries. J. Energy Storage 2020, 31, 101658. [Google Scholar] [CrossRef]
  16. Mao, N.; Wang, Z.-R.; Chung, Y.-H.; Shu, C.-M. Overcharge cycling effect on the thermal behavior, structure, and material of lithium-ion batteries. Appl. Therm. Eng. 2019, 163, 114147. [Google Scholar] [CrossRef]
  17. Ren, D.; Feng, X.; Lu, L.; He, X.; Ouyang, M. Overcharge behaviors and failure mechanism of lithium-ion batteries under different test conditions. Appl. Energy 2019, 250, 323–332. [Google Scholar] [CrossRef]
  18. Maleki, H.; Howard, J.N. Effects of overdischarge on performance and thermal stability of a Li-ion cell. J. Power Source 2006, 160, 1395–1402. [Google Scholar] [CrossRef]
  19. Dong, T.; Peng, P.; Jiang, F. Numerical modeling and analysis of the thermal behavior of NCM lithium-ion batteries subjected to very high C-rate discharge/ charge operations. Int. J. Heat Mass Tran. 2018, 117, 261–272. [Google Scholar] [CrossRef]
  20. Guo, R.; Lu, L.; Ouyang, M.; Feng, X. Mechanism of the entire overdischarge process and overdischarge-induced internal short circuit in lithium-ion batteries. Sci. Rep. 2016, 6, 30248. [Google Scholar] [CrossRef]
  21. Liu, B.; Zhang, J.; Zhang, C.; Xu, J. Mechanical integrity of 18650 lithium-ion battery module: Packing density and packing mode. Eng. Fail. Anal. 2018, 91, 315–326. [Google Scholar] [CrossRef] [Green Version]
  22. Larsson, F.; Mellander, B.-E. Abuse by External Heating, Overcharge and Short Circuiting of Commercial Lithium-Ion Battery Cells. J. Electrochem. Soc. 2014, 161, A1611–A1617. [Google Scholar] [CrossRef]
  23. Mao, B.; Chen, H.; Cui, Z.; Wu, T.; Wang, Q. Failure mechanism of the lithium ion battery during nail penetration. Int. J. Heat Mass Transf. 2018, 122, 1103–1115. [Google Scholar] [CrossRef]
  24. Wang, Q.; Mao, B.; Stoliarov, S.I.; Sun, J. A review of lithium ion battery failure mechanisms and fire prevention strategies. Prog. Energy Combust. Sci. 2019, 73, 95–131. [Google Scholar] [CrossRef]
  25. Feng, X.; Fang, M.; He, X.; Ouyang, M.; Lu, L.; Wang, H.; Zhang, M. TR features of large format prismatic lithium ion battery using extended volume accelerating rate calorimetry. J. Power Sources 2014, 255, 294–301. [Google Scholar] [CrossRef]
  26. Wang, H.; Lara-Curzio, E.; Rule, E.T.; Winchester, C.S. Mechanical abuse simulation and TR risks of large-format Li-ion batteries. J. Power Source 2017, 342, 913–920. [Google Scholar] [CrossRef] [Green Version]
  27. Kim, G.H. Numerical and Experimental Investigation of Internal Short Circuits in a Li-Ion Cell (Presentation), National Renewable Energy Lab. Available online: https://www.nrel.gov/transportation/assets/pdfs/50917.pdf (accessed on 18 May 2022).
  28. Keyser, M.; Long, D.; Jung, Y.S.; Pesaran, A.; Darcy, E.; McCarthy, B.; Patrick, L.; Kruger, C. Development of a novel test method for on-demand internal short circuit in a Li-ion cell. In Proceedings of the Large Lithium Ion Battery Technology and Application Symposium—Advanced Automotive Battery Conference, Pasadena, CA, USA, 8 June 2011; Available online: https://www.osti.gov/servlets/purl/1021805 (accessed on 19 May 2022).
  29. Maleki, H.; Howard, J.N. Internal short circuit in Li-ion cells. J. Power Source 2009, 191, 568–574. [Google Scholar] [CrossRef]
  30. Sahraei, E.; Campbell, J.; Wierzbicki, T. Modeling and short circuit detection of 18650 Li-ion cells under mechanical abuse conditions. J. Power Source 2012, 220, 360–372. [Google Scholar] [CrossRef]
  31. Cai, W.; Wang, H.; Maleki, H.; Howard, J.; Lara-Curzio, E. Experimental simulation of internal short circuit in Li-ion and Li-ion-polymer cells. J. Power Source 2011, 196, 7779–7783. [Google Scholar] [CrossRef]
  32. Feng, X.; Sun, J.; Ouyang, M.; Wang, F.; He, X.; Lu, L.; Peng, H. Characterization of penetration induced TR propagation process within a large format lithium ion battery module. J. Power Source 2015, 275, 261–273. [Google Scholar] [CrossRef]
  33. Sahraei, E.; Kahn, M.; Meier, J.; Wierzbicki, T. Modelling of cracks developed in lithium-ion cells under mechanical loading. RSC Adv. 2015, 5, 80369–80380. [Google Scholar] [CrossRef]
  34. Sahraei, E.; Meier, J.; Wierzbicki, T. Characterizing and modeling mechanical properties and onset of short circuit for three types of lithium-ion pouch cells. J. Power Source 2014, 247, 503–516. [Google Scholar] [CrossRef]
  35. Bai, J.; Wang, Z.; Gao, T.; Bai, W.; Wang, J. Effect of mechanical extrusion force on thermal runaway of lithium-ion batteries caused by flat heating. J. Power Source 2021, 507, 230305. [Google Scholar] [CrossRef]
  36. Zhu, X.; Wang, H.; Wang, X.; Gao, Y.; Allu, S.; Cakmak, E.; Wang, Z. Internal short circuit and failure mechanisms of lithium-ion pouch cells under mechanical indentation abuse conditions: An experimental study. J. Power Source 2020, 455, 227939. [Google Scholar] [CrossRef]
  37. Finegan, D.P.; Scheel, M.; Robinson, J.B.; Tjaden, B.; di Michiel, M.; Hinds, G.; Brett, D.J.L.; Shearing, P.R. Investigating lithium-ion battery materials during overcharge-induced thermal runaway: An operando and multi-scale X-ray CT study. Phys. Chem. Chem. Phys. 2016, 18, 30912–30919. [Google Scholar] [CrossRef] [Green Version]
  38. Srinivasan, R.; Demirev, P.A.; Carkhuff, B.G. Rapid monitoring of impedance phase shifts in lithium-ion batteries for hazard prevention. J. Power Source 2018, 405, 30–36. [Google Scholar] [CrossRef]
  39. Liang, Y.; Chen, Y.; Ke, X.; Zhang, Z.; Wu, W.; Lin, G.; Zhou, Z.; Shi, Z. Coupling of triporosity and strong Au–Li interaction to enable dendrite-free lithium plating/stripping for long-life lithium metal anodes. J. Mater. Chem. A 2020, 8, 18094–18105. [Google Scholar] [CrossRef]
  40. Han, X.; Ouyang, M.; Lu, L.; Li, J.; Zheng, Y.; Li, Z. A comparative study of commercial lithium ion battery cycle life in electrical vehicle: Aging mechanism identification. J. Power Source 2014, 251, 38–54. [Google Scholar] [CrossRef]
  41. Liu, B.; Zhao, H.; Yu, H.; Li, J.; Xu, J. Multiphysics computational framework for cylindrical lithium-ion batteries under mechanical abusive loading. Electrochim. Acta 2017, 256, 172–184. [Google Scholar] [CrossRef]
  42. Jia, Y.; Liu, B.; Hong, Z.; Yin, S.; Finegan, D.P.; Xu, J. Safety issues of defective lithium-ion batteries: Identification and risk evaluation. J. Mater. Chem. A 2020, 8, 12472–12484. [Google Scholar] [CrossRef]
  43. Wang, L.; Duan, X.; Liu, B.; Li, Q.M.; Yin, S.; Xu, J. Deformation and failure behaviors of anode in lithium-ion batteries: Model and mechanism. J. Power Source 2019, 448, 227468. [Google Scholar] [CrossRef]
  44. Liu, B.; Jia, Y.; Li, J.; Yin, S.; Yuan, C.; Hu, Z.; Wang, L.; Li, Y.; Xu, J. Safety issues caused by internal short circuits in lithium-ion batteries. J. Mater. Chem. A 2018, 6, 21475–21484. [Google Scholar] [CrossRef]
  45. Liu, B.; Yin, S.; Xu, J. Integrated computation model of lithium-ion battery subject to nail penetration. Appl. Energy 2016, 183, 278–289. [Google Scholar] [CrossRef] [Green Version]
  46. Bugryniec, P.J.; Davidson, J.N.; Cumming, D.J.; Brown, S.F. Pursuing safer batteries: Thermal abuse of LiFePO4 cells. J. Power Source 2019, 414, 557–568. [Google Scholar] [CrossRef]
Figure 1. Experimental arrangement.
Batteries 08 00243 g001
Figure 2. Same SOC cell load-displacement curve.
Batteries 08 00243 g002
Figure 3. Same SOC battery time temperature curve.
Batteries 08 00243 g003
Figure 4. Same SOC battery time voltage curve.
Batteries 08 00243 g004
Figure 5. Battery load displacement curve under different extrusion speeds.
Batteries 08 00243 g005
Figure 6. 0% SOC state battery curve.
Batteries 08 00243 g006
Figure 7. Post-experimental battery.
Batteries 08 00243 g007
Figure 8. Twenty percent SOC state battery curve.
Batteries 08 00243 g008
Figure 9. Internal details of the battery after the experiment.
Batteries 08 00243 g009
Figure 10. Forty percent SOC state battery curve.
Batteries 08 00243 g010
Figure 11. Thermal imaging images.
Batteries 08 00243 g011
Figure 12. Smoke when the battery fails.
Batteries 08 00243 g012
Figure 13. 60% SOC state battery curve.
Batteries 08 00243 g013
Figure 14. Smoke from the battery.
Batteries 08 00243 g014
Figure 15. Post-experiment battery.
Batteries 08 00243 g015
Figure 16. Eighty percent SOC state battery curve.
Batteries 08 00243 g016
Figure 17. Side cracking of the cell during extrusion.
Batteries 08 00243 g017
Figure 18. Photograph of battery after testing. (a) Front; (b) Side.
Batteries 08 00243 g018
Figure 19. One hundred percent SOC state battery curve.
Batteries 08 00243 g019
Figure 20. Battery fire during crash test.
Batteries 08 00243 g020
Figure 21. Post-test battery picture. (a) Post-test battery; (b) Precipitation of metallic substances.
Batteries 08 00243 g021
Figure 22. Different SOC peak loads and peak temperatures.
Batteries 08 00243 g022
Table 1. Battery characteristic parameter table.
Battery Characteristic Parameter Table
Battery cathode materialLiCoO2
Nominal capacity6.3 Ah
Nominal voltage3.7 V
AC resistance (mΩ)<2.0
weight (g)127 ± 3.0
Charging conditionsMaximum current12.6 A
Peak charge25.2 A
Voltage4.15 V ± 0.03 V
Discharge conditionMaximum current94.5 A
Peak discharge126 A
Cutoff voltage3.0 V
Cell sizethickness (mm)8.7 ± 0.3
width (mm)56.0 ± 0.5
length (mm)116.5 ± 0.5
Tab spacing (mm)28 ± 1.5
Tab sizeTab materialcopper
Lug width (mm)20
Publisher’s Note: MDPI stays neutral with regard to jurisdictional claims in published maps and institutional affiliations.

