Article

Study on Thermal Runaway Behavior of Li-Ion Batteries Using Different Abuse Methods

1
GAC AION New Energy Automobile Co., Ltd., Guangzhou 511434, China
2
State Key Laboratory of Automotive Safety and Energy, Tsinghua University, Beijing 100084, China
*
Author to whom correspondence should be addressed.
These authors contributed equally to this work.
Batteries 2022, 8(11), 201; https://doi.org/10.3390/batteries8110201
Submission received: 15 September 2022 / Revised: 13 October 2022 / Accepted: 25 October 2022 / Published: 31 October 2022
(This article belongs to the Collection Advances in Battery Energy Storage and Applications)

Abstract

:
Thermal runaway (TR) and the thermal runaway propagation (TRP) of Li-ion batteries can lead to safety incidents and cause explosion or fire accidents. Therefore, TR is a critical issue for the thermal safety of Li-ion batteries. In this study, the TR and TRP behavior of Li-ion batteries using different abuse methods (nail penetration, side heating, and overcharge) was investigated experimentally. First, the Extended Volume Accelerating Rate Calorimetry (EV-ARC) test was performed using the cell with an internal implantation thermocouple for a comparative study. Three abuse methods were used to induce TR and TRP for the cells and modules. At the cell level, the maximum temperature inside the cell under the EV-ARC test, nail penetration, and side-heating abuse was 994.8 °C, 964.3 °C, and 1020 °C, respectively. The thermocouple inside the cell under the overcharge abuse test was broken, and the experimental phenomenon indicated that the cell was most severely damaged under the overcharging abuse test. At the module level, the TRP behavior using the three abuse methods was different than in the first two TR cells, while the behavior of the other cells was similar. It was evidenced that TRP triggered by the overcharge abuse was the most hazardous, followed by the side-heating abuse, and lastly, the nail-penetration abuse was the least.

1. Introduction

The energy crisis and environmental pollution are critical all over the world. Therefore, energy saving and environmental protection have become priorities in the development of various products [1,2,3,4]. As an efficient energy storage device, Li-ion batteries are widely used because of their high energy and power density, long cycle life, and high environmental friendliness [5,6,7]. However, in recent years, cases of explosion or fire due to li-ion batteries have commonly occurred in cell phones, laptops, electric vehicles, energy storage plants, and airplanes worldwide. These battery accidents are always caused by the thermal runaway (TR) of Li-ion batteries [8,9]. TR will propagate to the adjacent cell in a battery system. TR and TR propagation (TRP) has attracted worldwide attention [10].
The TR of Li-ion batteries can be triggered by mechanical abuse [11,12], thermal abuse [13,14], or electrical abuse [15,16]. These abuses lead to a series of chemical reactions inside the battery and release a large amount of energy. The critical reactions that trigger TR are usually associated with the following failure processes: internal short-circuiting after the collapse of the separator [8,17], oxygen re-release by cathode decomposition [18], and interactions between the lithiated anode and electrolyte [19,20].
There are relevant regulations for the thermal safety testing of Li-ion batteries, including mechanical, temperature, and electrical performance tests. One of the most commonly used battery testing regulations is GB/T 38031, which recommends three methods of thermal safety testing, nail penetration, side heating, and overcharge [21]. The mechanical tests are mainly the penetration test and the drop test of the battery. Zhang et al. [22] conducted a test study on the penetration-triggered TR of long flexible Li-ion batteries and found that the different positions and depths of the triggered place had significant effects on the TR characteristics of the battery, the temperature test is mainly the high-temperature durability test of the battery. Wang et al. [23] conducted a study on the heating-triggered TR of Li-ion batteries with different nickel contents. The results showed that the higher the nickel content of the battery, the higher the risk of TR. The electrical performance test mainly includes the short-circuit test, overcharge test, and over-discharge test. Ren et al. [24] analyzed the effect of the overcharge rate on the battery, and the results show that overcharging leads to a continuous increase in the voltage and temperature of the battery, which eventually leads to TR, but the overcharge rate had almost no effect on the thermal runaway characteristics of the battery. It can be seen that different trigger methods can lead to different TR behaviors of Li-ion batteries. Meanwhile, most of the current studies focus on the TR characteristics by a single abuse method with a single Li-ion battery cell, and there are few comprehensive analyses of various abuse methods at the cell and module levels. Therefore, it is necessary to investigate the different TR behaviors triggered by different trigger methods.
In this study, the behavior of different abuse methods on the TR and TRP of Li-ion batteries are investigated experimentally at the cell and module levels. Firstly, the internal implantation thermocouple was operated on the cell, and the TR characteristic temperature of the cell was obtained by the Extended Volume Accelerating Rate Calorimetry (EV-ARC) test to evaluate the adiabatic TR characteristics. Then, the TR tests at the cell level using different abuse methods, including nail penetration, side heating, and overcharge, were carried out to compare and evaluate the TR behavior. Finally, the comparative TRP tests of the Li-ion battery modules with different trigger methods were conducted.

2. Experimental

2.1. Preparation for Internal Temperature Measurement

In this study, a commercial prismatic cell was used for the tests. The cathode material is a Li(NixCoyMnz)O2 (x:y:z = 5:2:3) composite cathode with a graphite anode. Table 1 lists the specifications of the cell.
For the TR of a large Li-ion battery, the temperature inside and outside is vastly different, and the surface temperature is significantly lower than the internal temperature [25,26]. In order to accurately measure the internal temperature of the cell and to avoid irreparable damage to it, extremely thin, high-precision thermocouples (KAIPUSEN KPS-IN600-K-0) were carefully implanted in the center of the cell. The process of thermocouple implantation is shown in Figure 1. First, to ensure the safety of the cell during the process, the cell was discharged to 0% state-of-charge (SOC), the cut-off discharge rate was 1/3 C, and the cell was discharged at a constant voltage to a current of 1.85 A (Figure 1a). Since there was a safety valve above the cell, the side surface of the cell was chosen for thermocouple implantation in order to avoid damage to it. Two diagonal lines were drawn to determine the center, and then a drill was used to bore a 2 mm diameter hole through the center of the case (Figure 1b). It is noted that the drill bit should not damage the jelly roll. After drilling holes in the side surface of the cell, the burrs were removed from the housing at the holes to prevent them from falling into the internal jelly roll. A 1-mm-diameter docking rod was wrapped with insulating tape and inserted into the gap between the cell jelly roll to allow access to the implanted thermocouple (Figure 1c). The purpose of wrapping the thermocouple with tape was to prevent the thermocouple from coming into direct contact with the jelly roll and causing a short circuit within the cell. The temperature measurement post at the front end of the 1-mm-diameter thermocouple was slowly pushed through the expanded access to the middle of the jelly roll, the data wire at the end of the thermocouple was attached to the cell surface, and the front portion of the thermocouple was kept upright on the side of the cell (Figure 1d). The part of the thermocouple implanted in the cell was also wrapped with insulating tape. High-temperature glue was evenly applied around the gap of the hole where the thermocouple was to avoid contact between the inside of the cell and the outside, thus protecting the jelly roll (Figure 1e). After the glue was set, the voltage was checked to ensure that there was no internal short circuit of the cell after thermocouple implantation. After that, the cell was charged to 100% SOC at the rate of 1/10 C (Figure 1f). The internal thermocouple implantation process was performed in a dry room. After the glue solidified, the EV-ARC test and abuse tests should be conducted as soon as possible to ensure that it had little influence on the tests [26,27,28].

2.2. EV-ARC Test

The EV-ARC test has been widely used to evaluate the TR hazard of Li-ion batteries [29,30,31,32]. Figure 2 is the schematic diagram of the EV-ARC setup, where the thermocouple (Tin) was implanted in the center of the cell using the method described in Section 2.1. Two thermocouples were attached to the front and side surfaces of the cell to measure the temperature (Tf, Ts). The cell was clamped on a fixed iron frame to avoid the heat transfer caused by the contact between it and the EV-ARC chamber.
The EV-ARC follows a ‘heat-wait-seek’ working mode [14]. During the heat process, the self-generated heat of the cell is not considered, and adiabatic testing is not performed. After the cell has reached the target temperature, the instrument maintains this temperature for a period of time to achieve thermal equilibrium between the cell and the chamber. EV-ARC detects whether the temperature change rate dT/dt of the cell exceeds the preset detection sensitivity (0.02 °C·min−1) during the ‘Seek’ mode. If not, the above steps will be repeated. Once the temperature increase rate exceeds the threshold, the EV-ARC will enter adiabatic test conditions until the cell TR. The temperature and voltage data were collected in real time using a data collector (HIOKI LR8400).

2.3. Nail Penetration Abuse Test

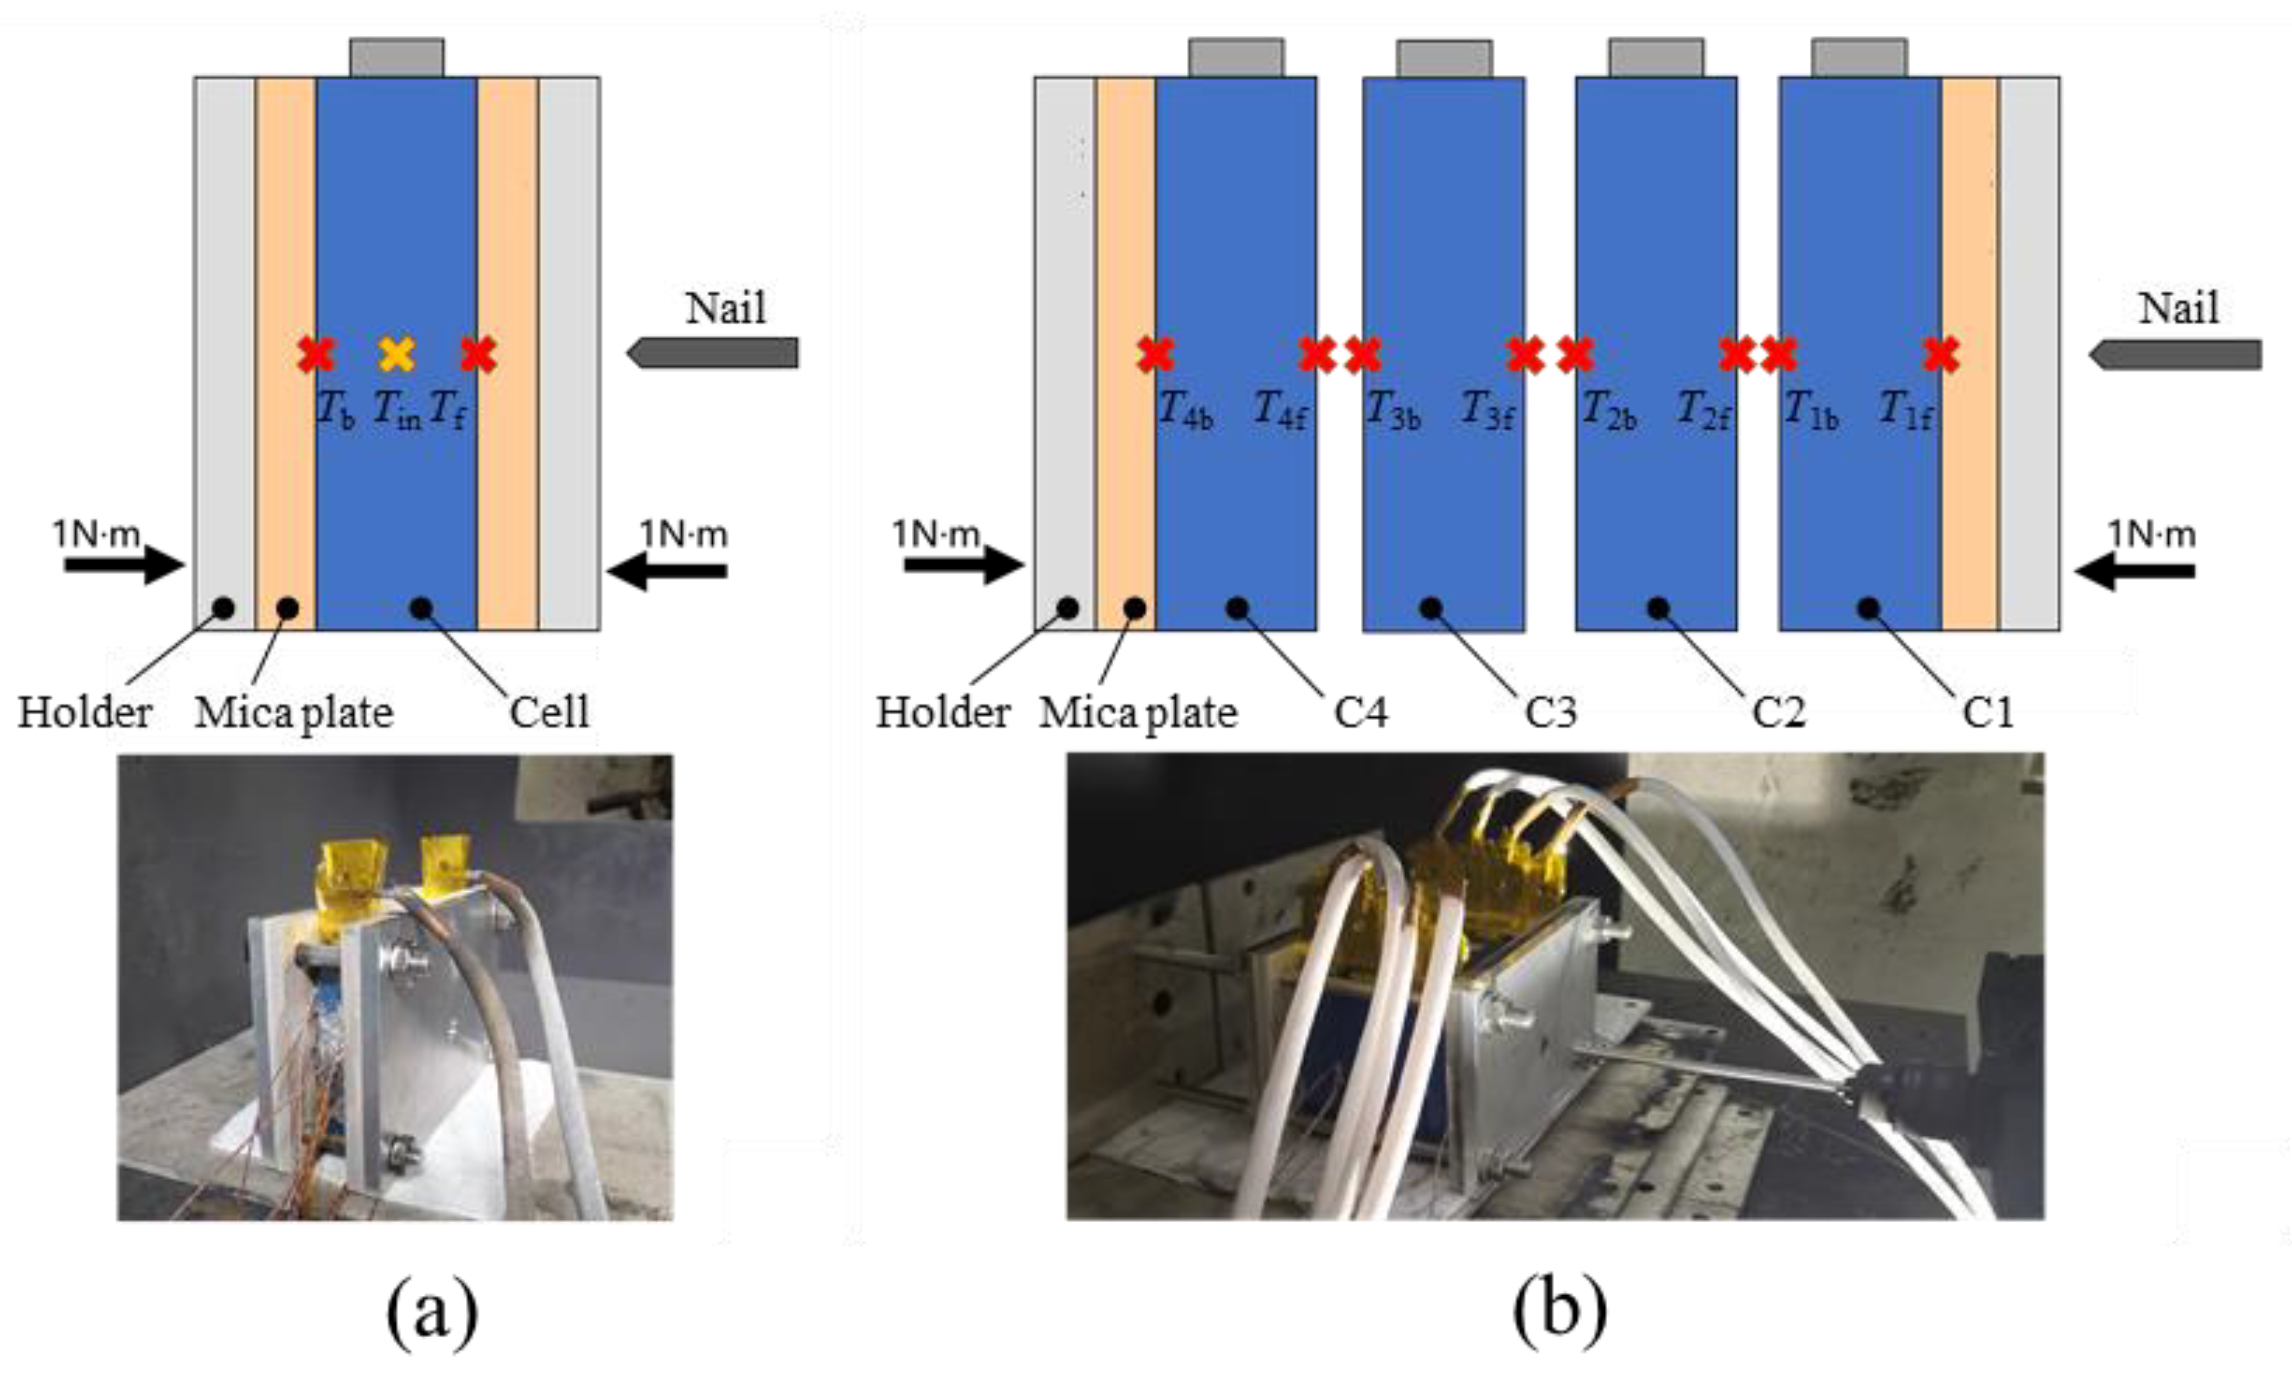
The nail-penetration abuse tests for the cell and the module were performed according to the test regulations [33]. The schematic diagram of the nail-penetration abuse test for the cell is shown in Figure 3a. The cell was charged to 100% SOC, and it was fixed by the holder, which contained two stainless-steel clamping plates and screws. To ensure the stability of the cell during testing, each screw was torqued to 1 N·m. In order to reduce the heat dissipation between the cell and the holder, two mica plates with a thickness of 10 mm were placed between the cell and the holder, and their dimensions were the same as the front surface of the cell. The holder and the mica plates were designed with a 10-mm-diameter through-hole corresponding to the center of the cell so that the nail could completely penetrate the cell. Two thermocouples (Tf, Tb) were located at the center of the front and back surfaces of the cell, and one thermocouple (Tin) was implanted inside the cell to measure the internal temperature. Voltage wires were clamped to the positive and negative lugs of the cell to collect voltage data. In the test, a stainless-steel felting nail with a diameter of 6 mm was used to penetrate the cell at a speed of 25 mm/s. The nail was kept inside the cell after the cell TR.
The schematic diagram of the nail-penetration test for the module is shown in Figure 3b. The module contained four cells, and there was no electrical connection between the cells. The holder and mica plates used for the module test and the applied clamping torque were identical to those of the cell test. In the test, the nail completely penetrated through the first cell without damaging the other cells. The cells are named C1–C4. C1 was the triggering cell. The position of the thermocouple on the surface of C1 was the same as that in the cell-level test, and the thermocouples of C2–C4 were located at the center of the front and back surfaces of the cells.

2.4. Side Heating Abuse Test

The schematic diagram of the side-heating test for the cell is shown in Figure 4a. The positions of the thermocouples were the same as that in the nail penetration test. The cell was heated by a steel heater of the same size as the surface of the cell, with a thickness of 3 mm and a heating power of about 450 W. The heater was turned on during the test and turned off immediately after the TR of C1. The holder and the mica plates fit closely with the cell. The rest of the setup was the same as that in the nail-penetration abuse test.
The schematic diagram of the side-heating abuse test for the module is shown in Figure 4b. The thermocouples on the surface of each cell in the module were the same as the module nail-penetration abuse test. The heater, holder, mica plates, and test process were the same as that in the cell-heating abuse test.

2.5. Overcharge Abuse Test

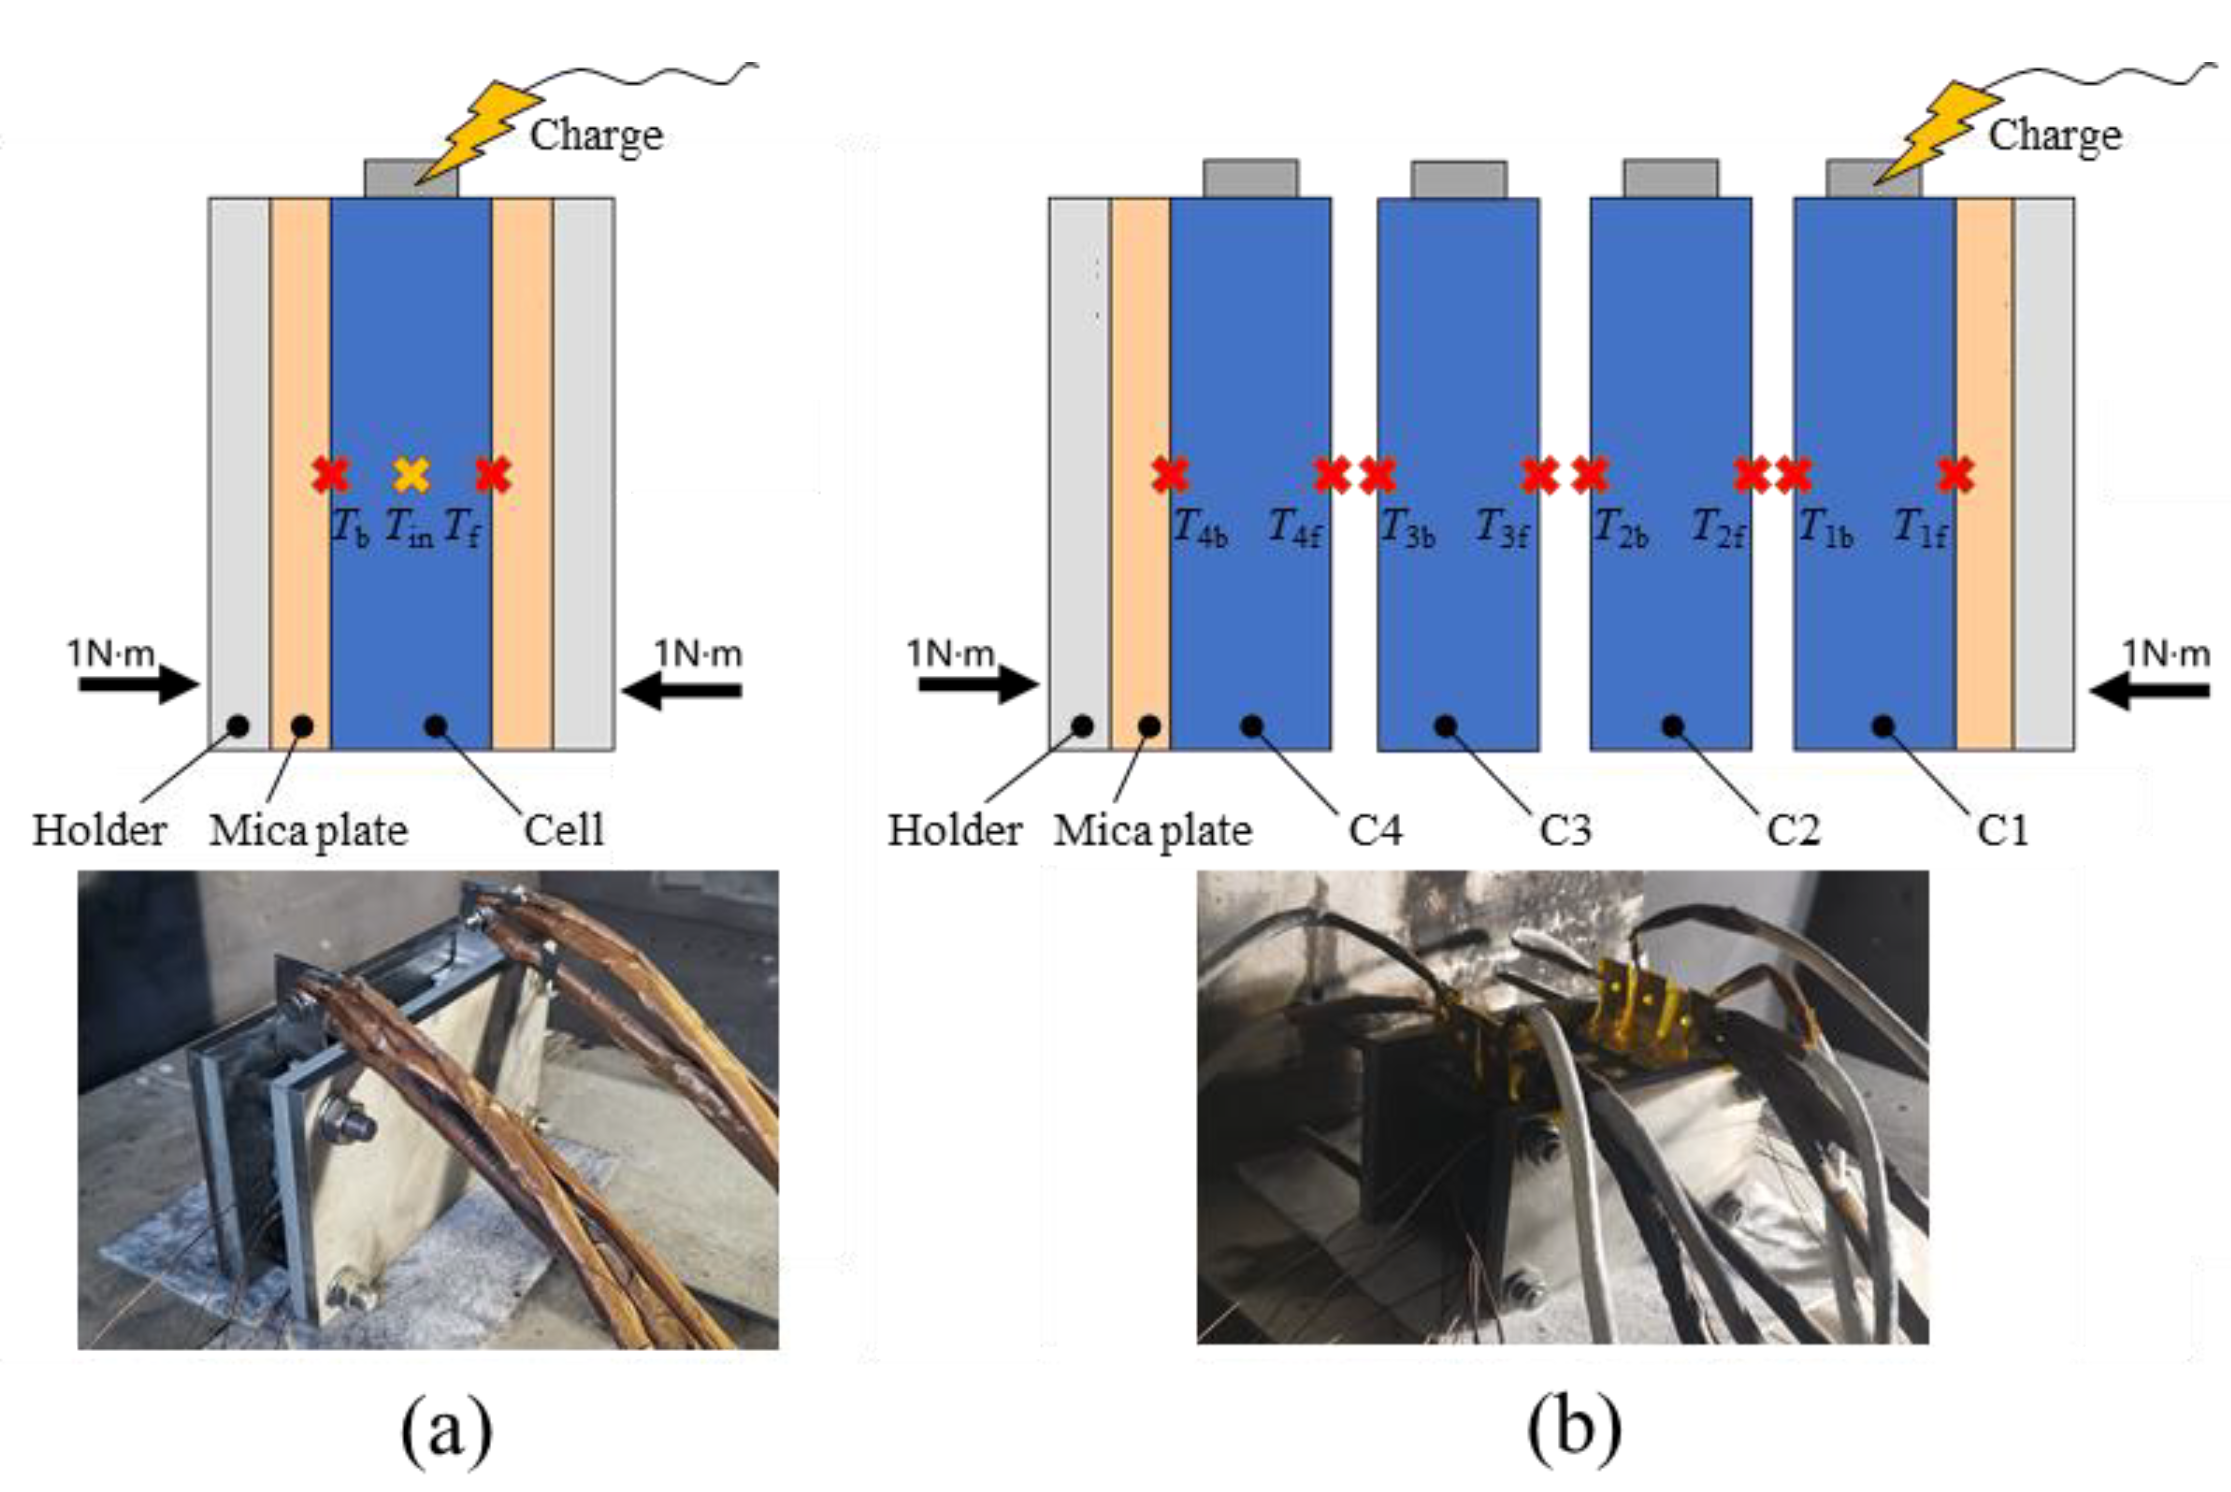
The overcharge abuse tests were performed according to ref. [34]. The schematic diagram of the overcharge abuse test for the cell is shown in Figure 5a. The thermocouple on the surface of the cell and the thermocouple implanted inside were the same as that in the side-heating abuse test. The cell was overcharged by a charge/discharge machine (NEWARE CT-4004) with a constant rate of 1/3 C, and no upper limit of charging voltage was set until the cell TR.
The schematic diagram of the overcharge abuse test for the module is shown in Figure 5b. Cell C1 was overcharged with a constant rate of 1 C, and the charger was turned off after the TR of C1. The rest of the setup was the same as that in the module side-heating abuse test.

3. Results and Discussion

3.1. TR Behavior under EV-ARC Test

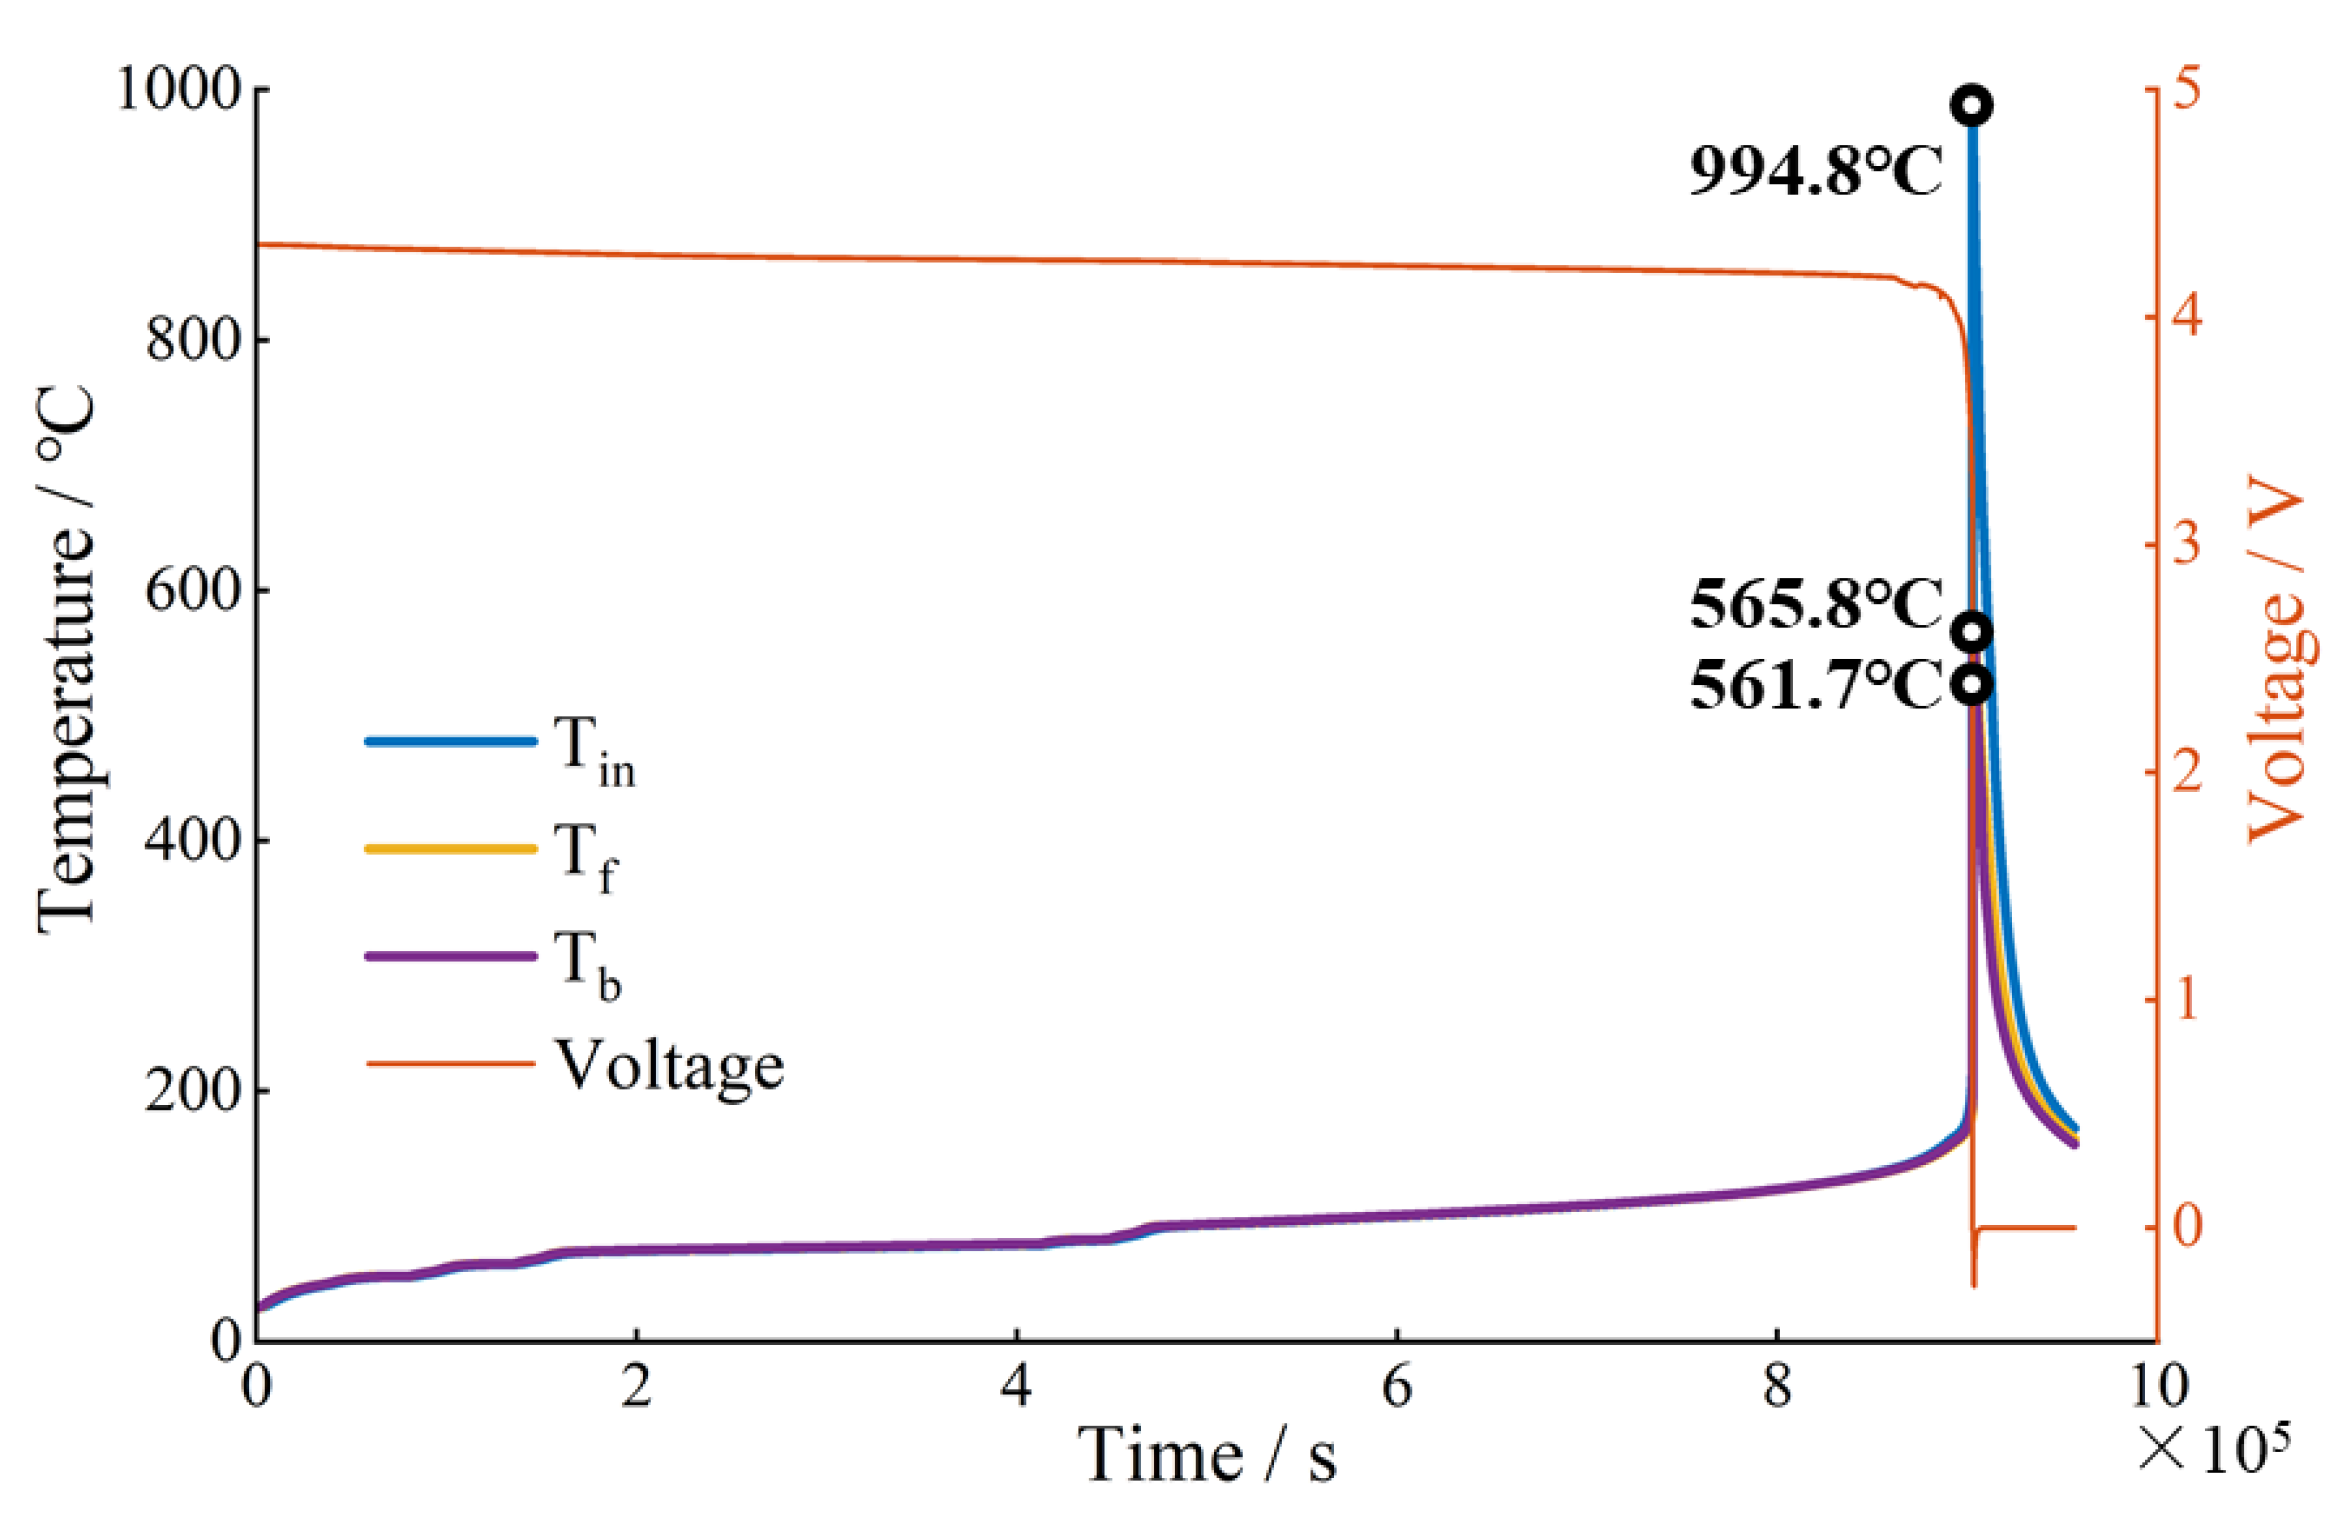
Using the EV-ARC test, the characteristic temperature of the TR cell was determined, including the self-generated heat temperature (T1), the TR trigger temperature (T2), and the TR maximum temperature (T3). The real-time voltage and temperature values of the different thermocouples are shown in Figure 6. The temperature of each thermocouple remained consistent until TR occurred, and it rose exponentially when TR happened. The maximum temperature of Tf and Ts was 565.8 °C and 561.7 °C during the test, and the maximum internal temperature Tin was 994.8 °C, which was nearly 430 °C higher than the surface temperature. The initial voltage of the cell was 4.3 V, and the voltage dropped rapidly to 0 after TR occurred, which indicated that a serious internal short circuit occurred in the cell. After the cell TR, the temperature of each thermocouple dropped rapidly and approached uniformity.
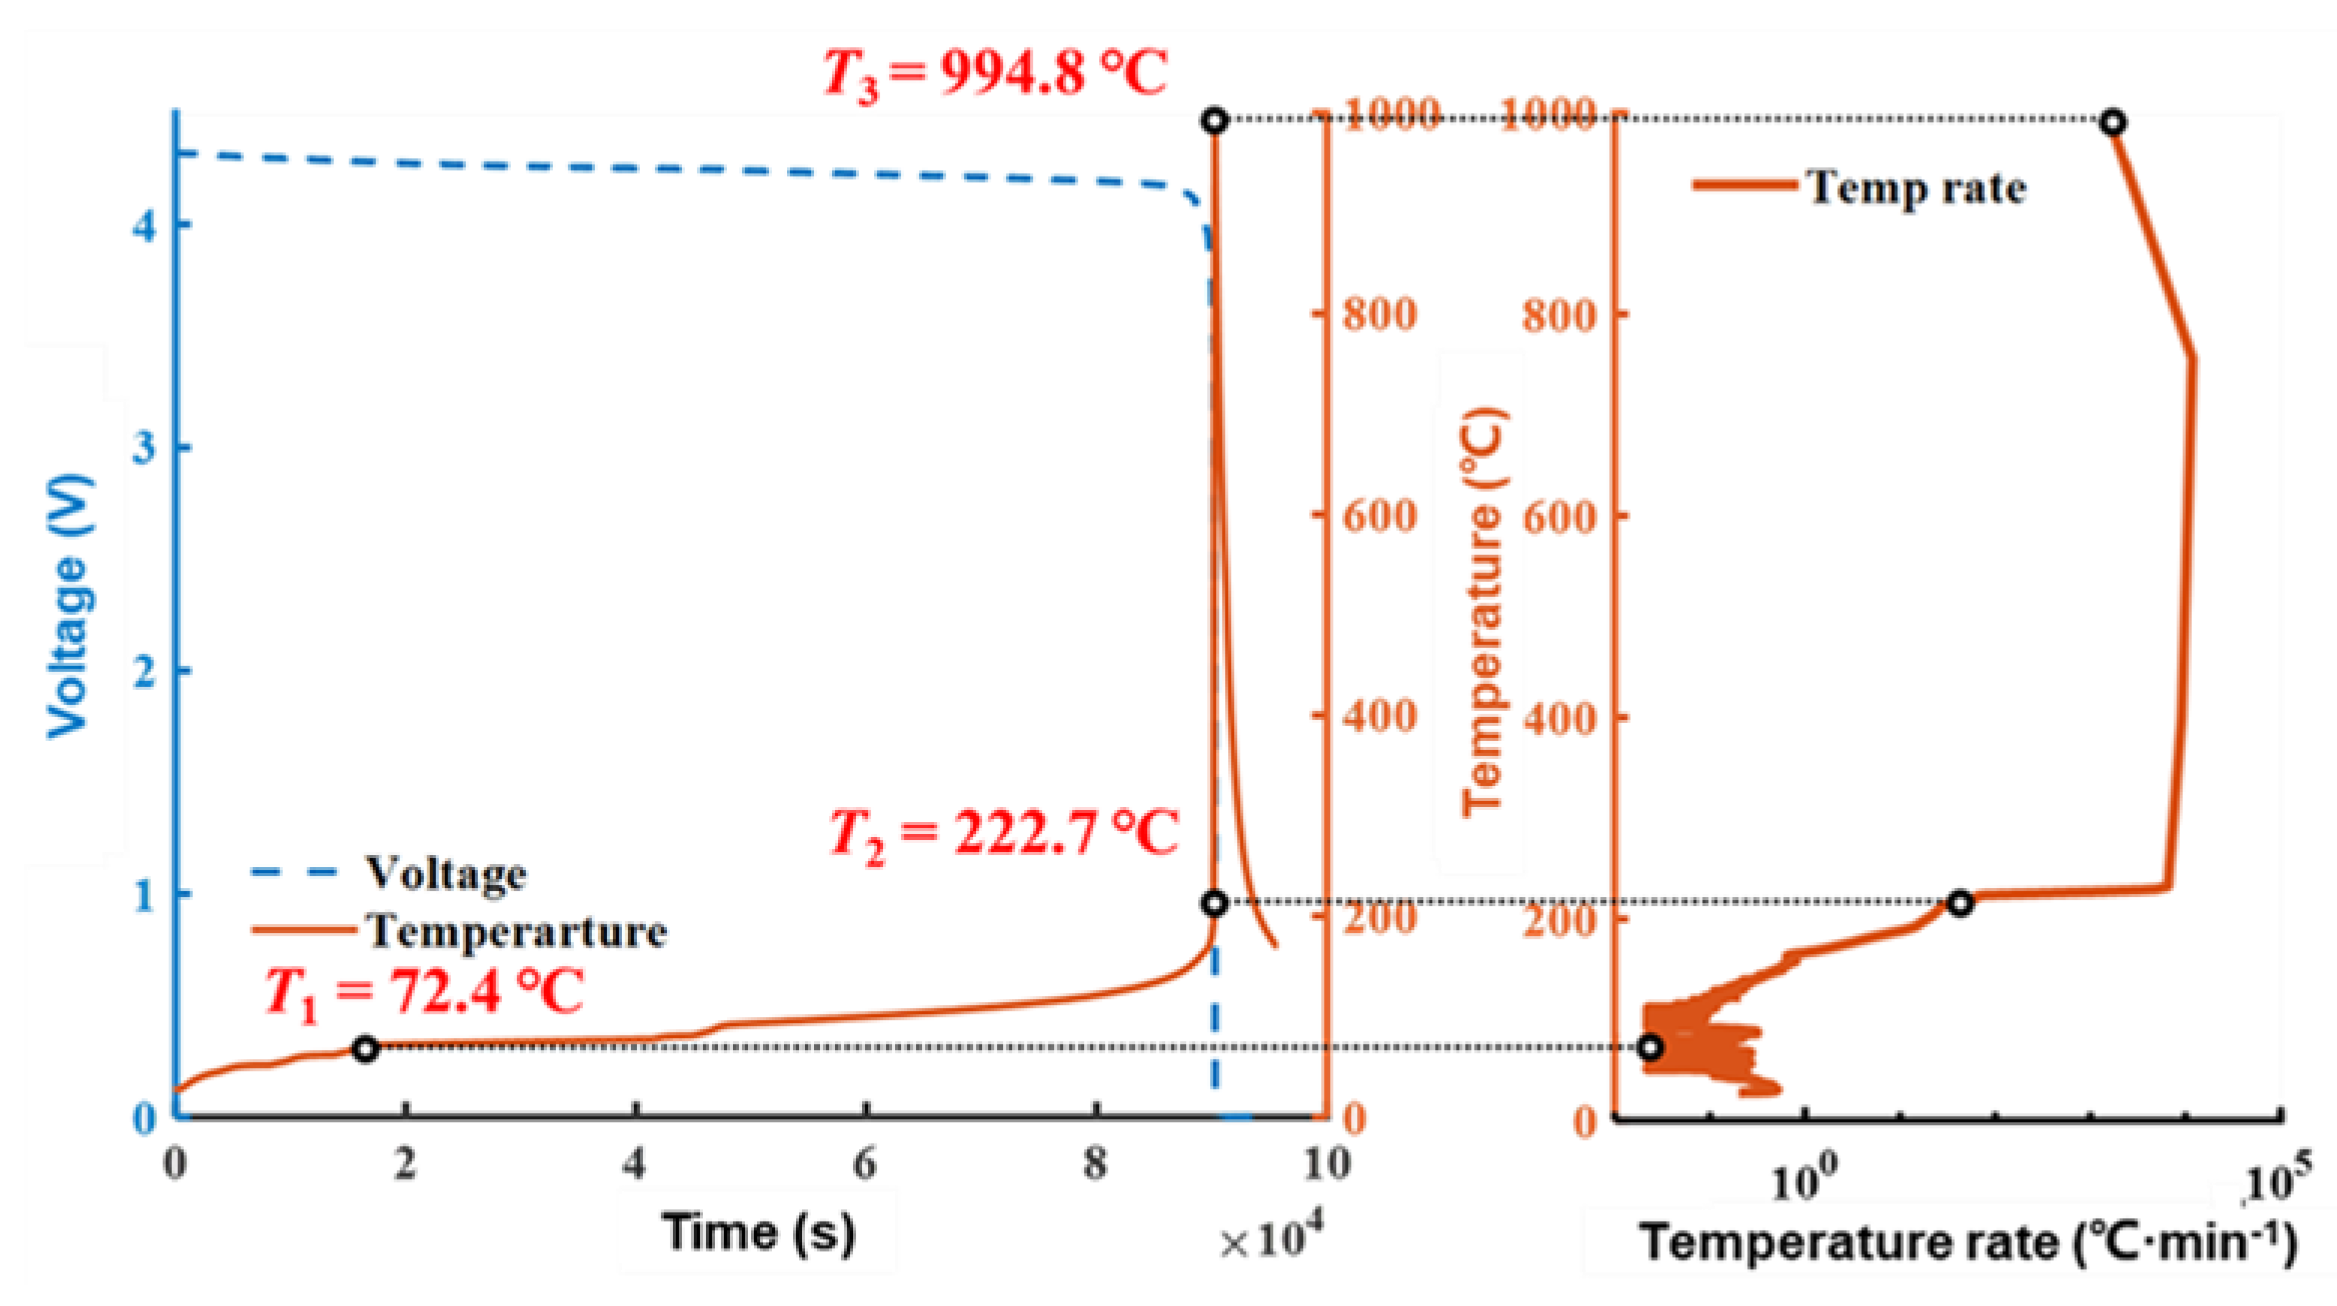
Figure 7 illustrates the temperature and temperature rate curve, which is the differentiation of the Tin data smoothed by the moving average algorithm. It indicates that the characteristic temperature T1 is 72.4 °C, T2 is 222.7 °C, and T3 is 994.8 °C [29]. Figure 8 shows the wreckage of the cell after EV-ARC test. Combined with the reaction time sequence of the cell TR, this process can be analyzed as follows:
When the cell temperature was below 60 °C, there was almost no internal exothermic reaction; at this time, the cell was slowly warming up because of the rising temperature of the EV-ARC chamber, and the voltage drop was mainly due to the electrochemical properties of the cell rather than the internal short circuit [35].
When the temperature reached above 60 °C, the SEI film inside the cell started to decompose, the capacity of the cell also started to decay, and the voltage dropped at an accelerated rate. As the internal reaction continued, the cell self-generated heat temperature rise rate reached the detection sensitivity threshold (0.02 °C·min−1), and the temperature reached T1, from which time EC-ARC started to enter the seek mode [36].
When the temperature reached above 110 °C, the active material of the cell was consumed, the voltage further accelerated to drop, and the EV-ARC repeatedly switched between the heat mode and the track mode due to the combined effects of the melting heat absorption of the diaphragm inside the cell and the exotherm of the side reaction. As the temperature continued to rise, the diaphragm gradually melted, a weak internal short circuit was generated inside the cell, and the voltage dropped while the temperature rise rate continued to increase [37].
When the temperature reached about 200 °C, the cell voltage dropped sharply with the internal temperature of the cell rose rapidly. Several seconds later, the temperature rate reached 1 °C·s−1. At this moment, the temperature was T2 [38].
Later, a violent reaction occurred inside the cell, and it released a large amount of heat; TR started, which caused the temperature to rise dramatically. The maximum temperature was T3 [39].
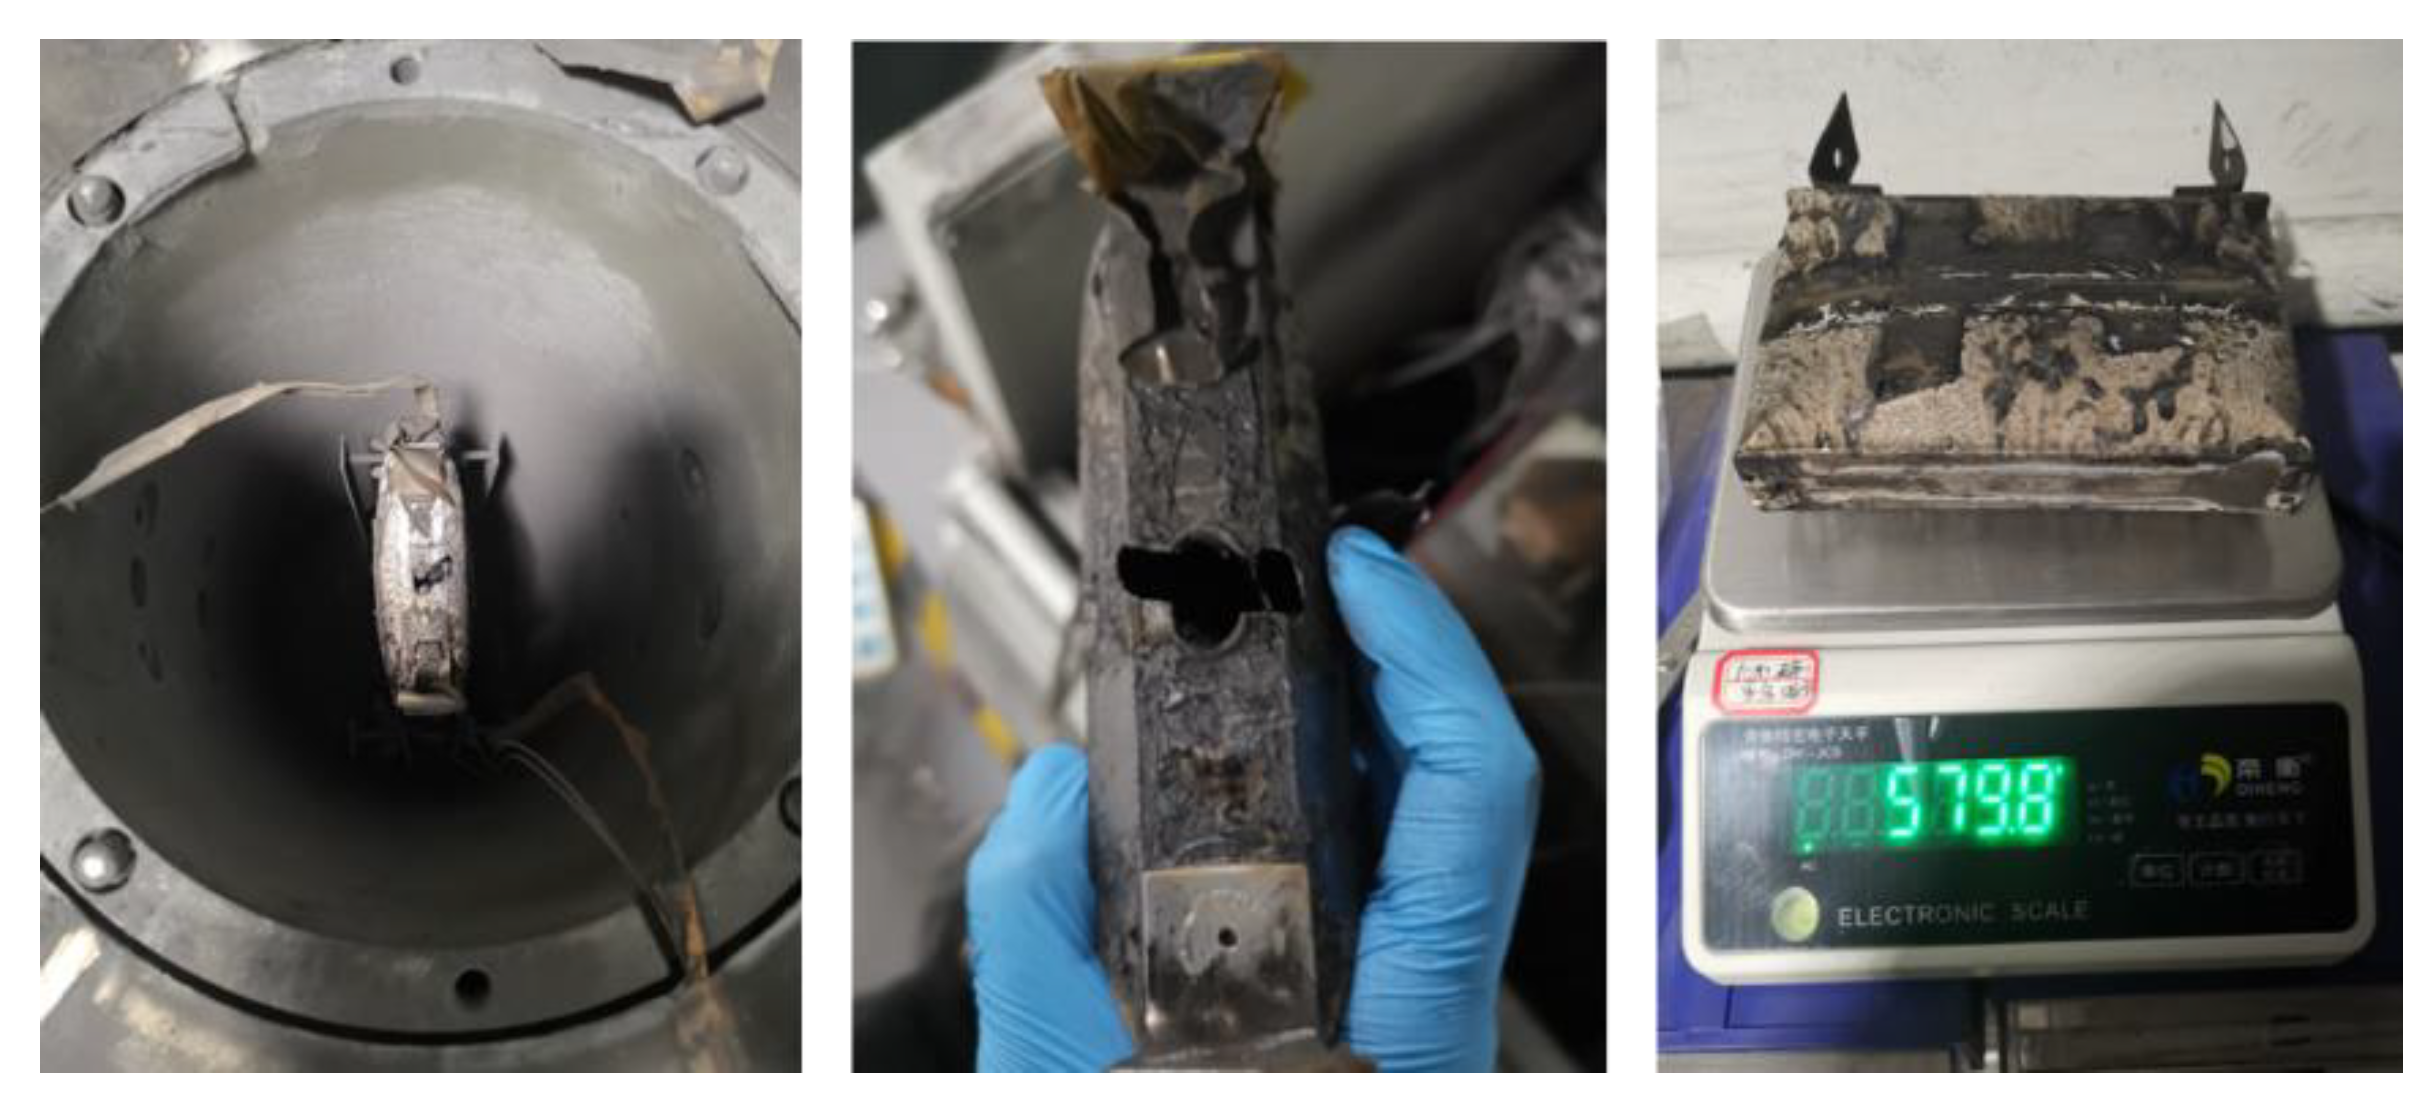
Figure 7 shows some photos of the cell wreckage after the EV-ARC test. The cell shell swelled significantly, and the surface of the cell was covered with black debris, and it could be seen that the safety valve of the cell had been opened, from where the jelly roll was ejected, resulting in the loss of mass. By calculation, the mass loss (Mloss) was 272.3 g.
Through the EV-ARC, it is possible to calculate the total increase in energy under an adiabatic environment (Ea), as in Equation (1) [40]. Where Mcore = 0.795 kg is the mass of the cell core, Cp = 981 J·kg−1·K−1 is the specific heat capacity of the cell, ΔT = T3T1 = 922.4 °C. Therefore, in this paper, Ea = 7.19 × 10⁵ J. The characteristic parameters of the cell under the EV-ARC test are shown in Table 2.
Ea = McoreCp∙ΔT

3.2. TR Behavior Using Different Abuse Methods

3.2.1. TR Behavior under Nail-Penetration Abuse Test

Figure 9a shows the temperature and voltage curves of the cell in the nail-penetration abuse test. At the moment of 0 s, the nail pierced into the cell, and subsequently, TR occurred. The voltage of the cell dropped from 4.31 V to 2.53 V within 0.2 s. Then, it rebounded to 3.41 V and gradually dropped to 0 during the following 6.5 s. The voltage fluctuation during TR was caused by the internal short circuit caused by the nail. After 0.3 s, when the voltage began to drop, Tf first increased, and after about 1 s, Tin rose rapidly, followed by Tb after about 3.8 s. At the moment of 7.6 s, Tin reached the highest value of 964.3 °C, and at this time, Tf and Tb were about 550 °C and 95 °C, respectively, and they were still in the rising stage.
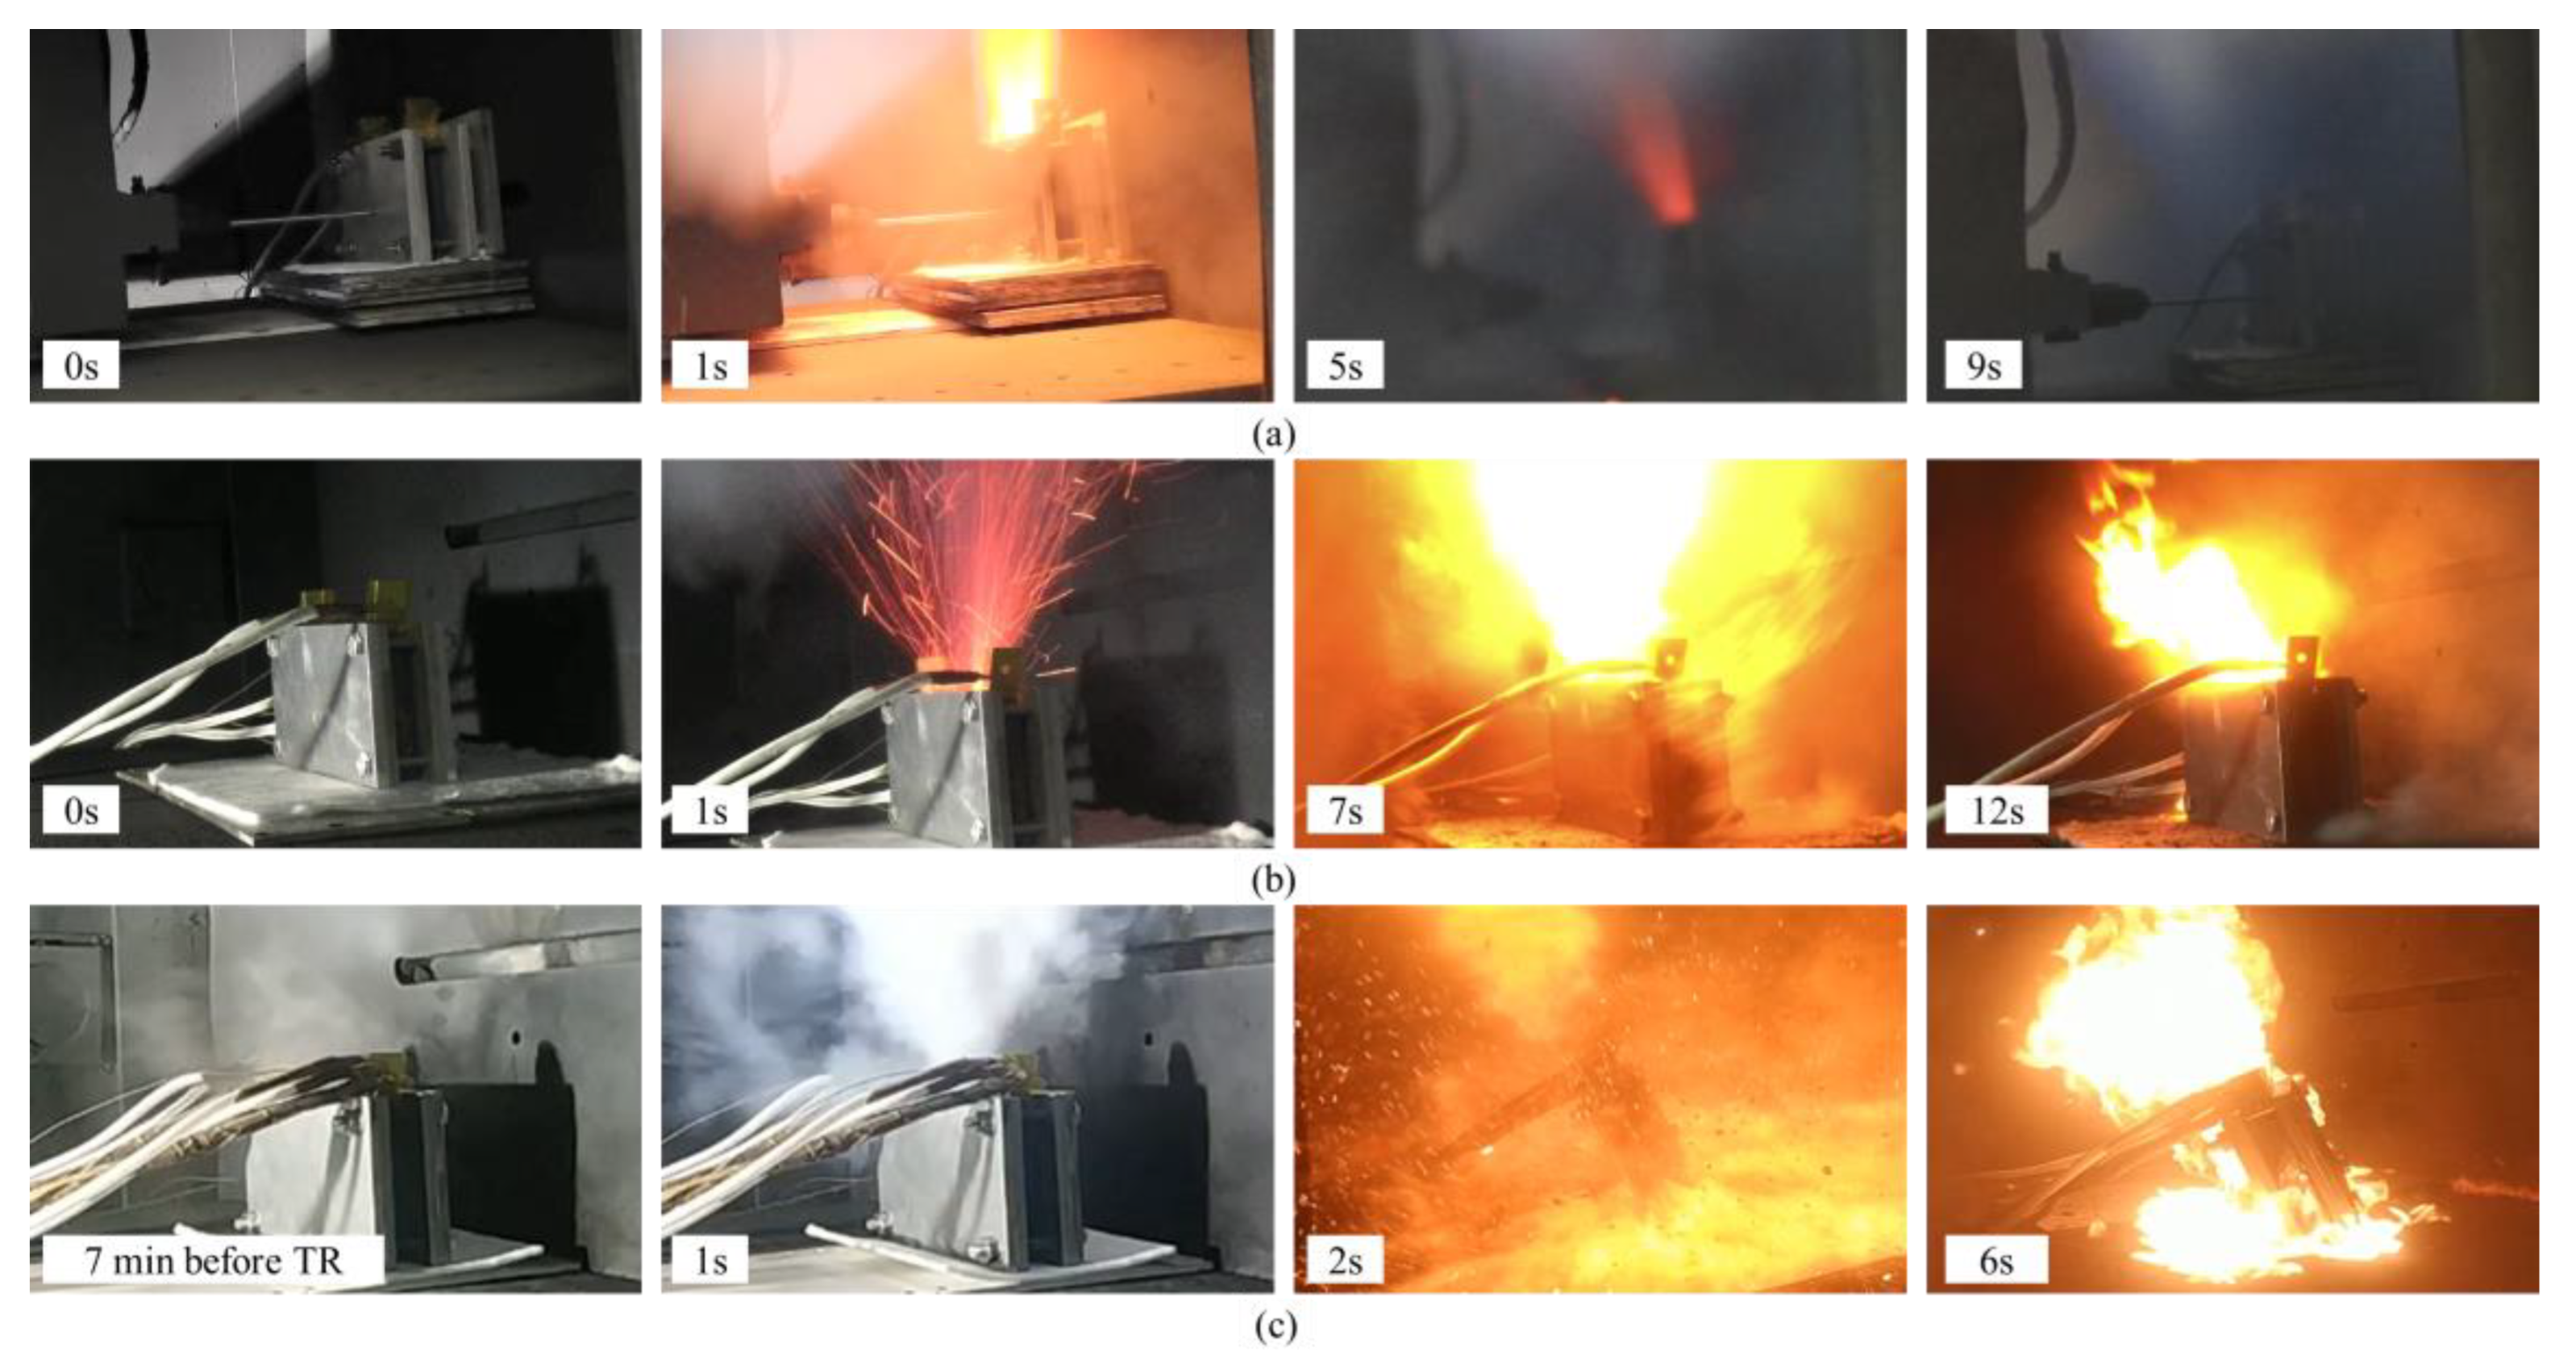
The TR process is shown in Figure 10a. After 1 s of the nail penetrating the cell, a large amount of electrolyte vapor violently ejected from the cell, after which the fire quickly disappeared. Then, 5 s later, the jet fire turned into a spark jet accompanied by a large amount of black smoke. At 9 s after TR, the cell stopped ejecting, and the environment was filled with dust and smoke.
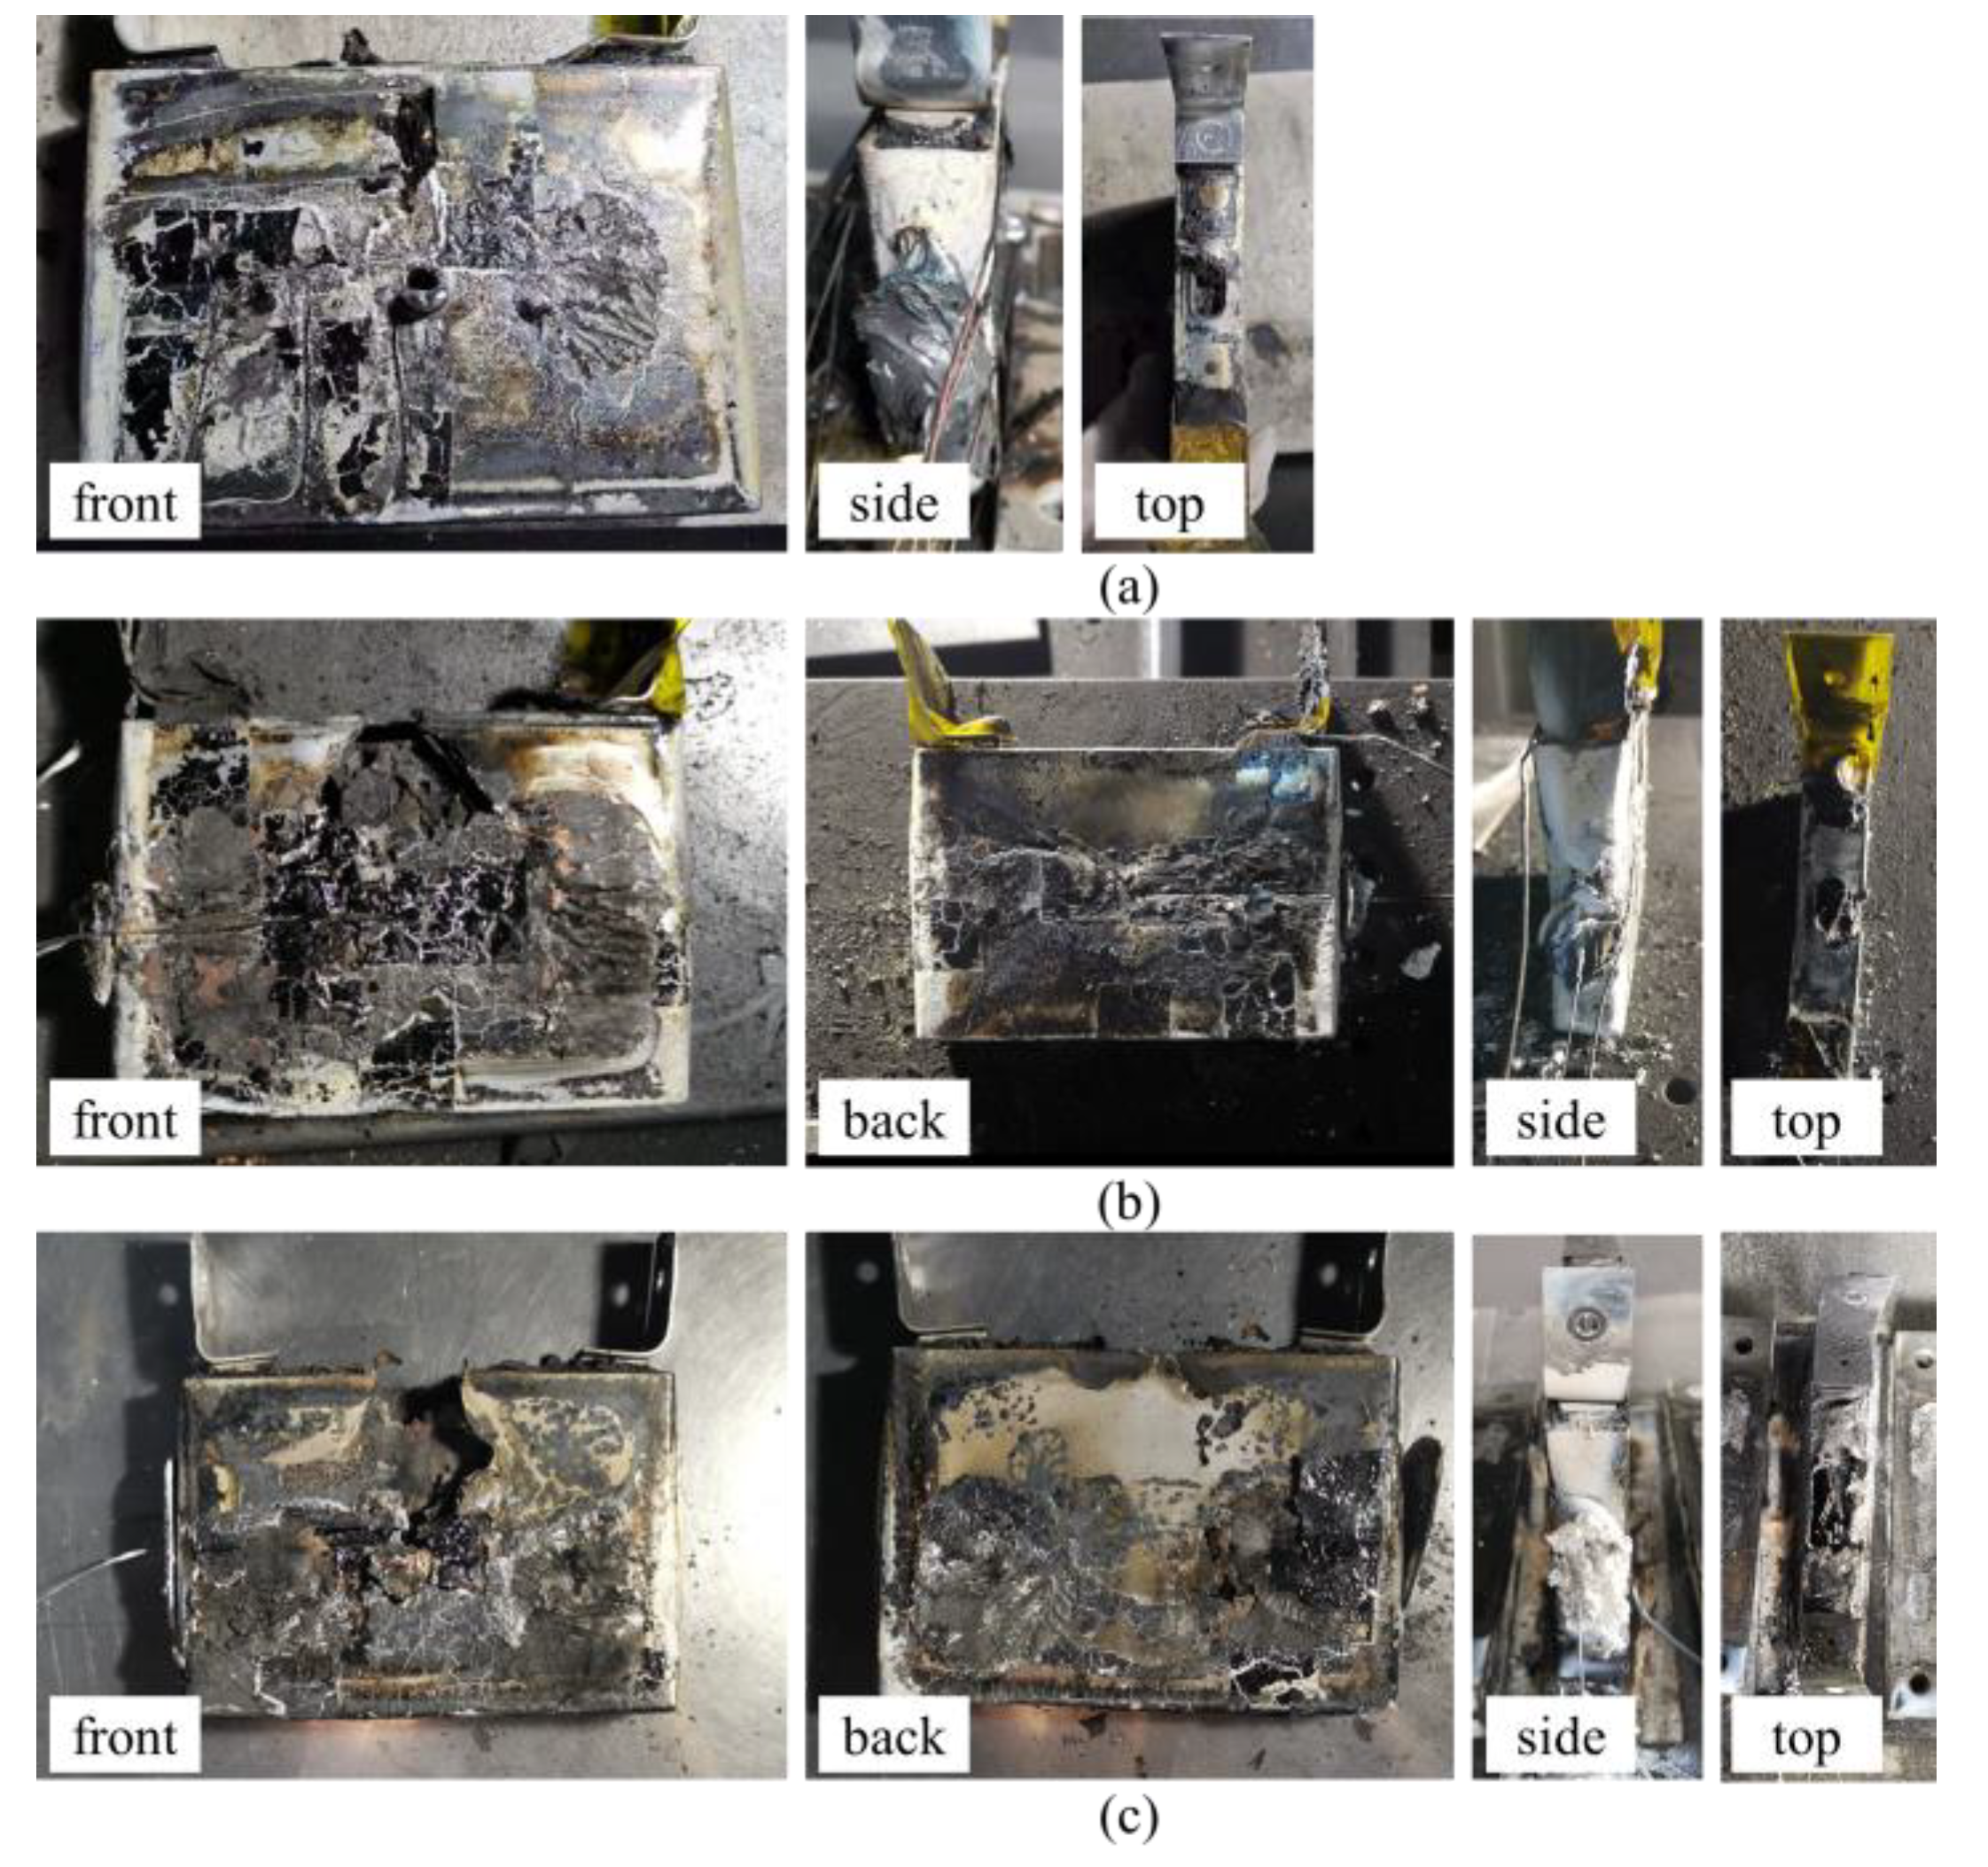
The cell wreckage after the test is shown in Figure 11a. The shell of the cell melted and solidified into an aluminum ball at the penetration hole on the front surface, which indicated that the temperature at the hole was extremely high at the time of TR. The plastic packaging film of the cell was completely melted, and the thermocouples were embedded inside the cell shell. Both the internal implantation thermocouple and the glue on the side surface of the cell were not broken, but the glue had detached from the cell shell, which might be due to the excessive pressure inside the cell during TR and the internal material ejected from the thermocouple implantation hole on the cell. On the top of the cell, it can be observed that its safety valve was fully opened, and its jelly roll could be viewed.

3.2.2. TR Behavior under Side Heating Abuse Test

Figure 9b shows the curves of temperature and voltage variation with time of the cell under the side-heating abuse test. The initial temperature of the cell was 20 °C. The heater was turned on at the moment of 0 s, and the front surface of the cell was heated, which allowed Tf to increase continuously. At the moment of 160 s, Tf rose to 328 °C. During this period, the values of Tin and Tb were almost indistinguishable and rose slowly to 42 °C, and the voltage of the cell was stabilized at 4.3 V. Then, the cell TR, the voltage rapidly dropped to 0 in the following 12 s. At the same moment as the voltage drop, Tf started to rise, and after about 3 s, Tin also rose rapidly, reaching a maximum of 1020 °C within 3 s. After 6 s of cell TR, Tb began to rise. The maximum values of Tf and Tb were 737 °C and 633 °C, respectively.
Figure 10b displays several images of the TR process in the test. After the TR of the cell at 1 s, a large number of jet sparks ejected from its safety valve, and this process lasted for about 6 s. Afterward, the sparks were ignited, the top of the cell burned vigorously, and the flame became smaller after 5 s. The flame above the cell lasted for about 126 s, and during this period, a lot of smoke was ejected from the cell.
Figure 11b shows the images of the cell wreckage after the test. After TR, the front surface of the cell, which was heated, appeared to have a large rupture, from where it can be seen that the cell had ejected a part of the jelly roll. From the upper portion of the cell, it can be found that the safety valve of the cell had opened, and the rupture extended from here to the front of the cell, which indicated that the ejection of sparks and fire might be the reason for the formation of the rupture. The glue on the side of the cell was broken rather seriously, probably because of the ejection from the hole of the cell during TR; the glue had been smashed and shattered, and its pieces fell around the cell. However, the internal implantation thermocouple remained intact. Similar to the nail-penetration abuse test, the plastic film on the cell surface melted, and the thermocouple was embedded in the cell shell.

3.2.3. TR Behavior under Overcharge Abuse Test

Figure 9c illustrates the curves of the temperature and voltage of the cell under the overcharge abuse test. In the test, the cell was charged from 100% SOC at a rate of 1/3 C. The voltage steadily increased to exceed its nominal cut-off voltage (4.35 V) until 2000 s. Due to the large capacity of the cell, there was no significant exothermic reaction inside the cell during this period, and the temperature of the cell barely increased. When the cell was overcharged to about 120% SOC (i.e., about 2100 s), the cell voltage rose faster and reached 5.13 V at about 2400 s. The temperature of the cell also started to increase slowly due to the heat generated by the internal side reactions of the cell. After this, there was an internal short circuit inside the cell, which caused the voltage to decrease slowly, and at the same time, the cell temperature rose even faster, with the internal temperature rising to 170 °C at the moment of 4700 s. As the overcharge continued, the internal resistance of the cell increased under the influence of the internal short circuit and led to a sharp increase in voltage. The cell temperature continued to rise, resulting in the deformation and melting of the separator, which eventually led to cell TR. It is notable that due to the instantaneous release of energy stored inside the cell, the TR process was too aggressive and caused the failure of the internal implantation thermocouple.
Figure 10c displays several images of the TR process in the test. In the previous 5 min of cell TR, the safety valve had broken, and white smoke was constantly coming out of the cell. With cell TR, a massive white smoke was ejected from the cell, and after 1 s, it was ignited, and violent flames and sparks engulfed the test area. Due to the excessive internal pressure of the cell, both the cell and the holder could be seen to be overturned by the shock wave of TR. After that, the flame of the cell became smaller, and the burning process lasted for 163 s.
Figure 11c illustrates images of the cell wreckage after the test. Most of the front shell of the cell melted, the upper part of it was completely broken, and the jelly roll inside the rupture could be seen ejected. Part of the shell on the back of the cell also suffered melting. The high-temperature-resistant glue on the side turned into foam, probably because the glue was melted by the high temperature during TR, and it was also impacted by the gas. The top of the cell was affected by the jet and fire, and the shell melted extensively. Overall, the cell was severely damaged after the test due to the TR being too violent to the extent that the internal implantation thermocouple failed inside the cell.

3.2.4. TR Behavior Comparison

In each of the tests, due to the different abuses used, the behavior and characteristics of cell TR were quite different from each other. Table 2 lists the characteristic parameters of cell TR in each test. In the EV-ARC test, the cell was in a strictly adiabatic condition, cell TR was almost undisturbed by external factors, and the energy released by TR also came entirely from the cell itself. Therefore, the TR characteristic parameters of the EV-ARC test can be used as evaluation standards [28].
In the other three abuse tests, nail penetration did not introduce additional energy into the cell, while side-heating and overcharge supplied thermal and electrical energy to the cell, respectively. Because of the extra energy, in the side-heating test, Tmax was higher than that in the EV-ARC and nail-penetration abuse tests. For the side-heating abuse test, the total TR energy and the extra energy can be calculated by Equation (1). While in the overcharge test, the internal implantation thermocouple even failed due to high temperature, and the electric energy charged into the cell was 124.4 Wh (4.48 × 10⁵ J) collected by the charger. The comparison of the energy is shown in Table 2. It can be seen that the TR energy of the nail-penetration abuse test was almost the same as that of the EV-ARC test, which also confirmed that the nail did not introduce extra energy into the cell. The extra energy introduced into the cell in the side-heating abuse test was approximately 2% of Ea. However, for the overcharge abuse test, the TR energy was almost 1.5 times more than Ea. It can be indicated that for the nail-penetration and side-heating abuse test, using internal implantation thermocouple is a good method for measuring the internal temperature of the cell, while for the overcharge abuse test, it is difficult to measure internal temperature due to the excessive extra energy.
In addition, the cell lost more jelly roll in the overcharge test, which resulted in the highest mass loss of the cell. Comparing the ejection and fire time, it can be found that excess extra energy led to longer combustion times, but it has no significant effect on the ejection time. In general, the higher the extra energy, the more violent the TR in the abuse tests.

3.3. TRP Behavior Using Different Abuse Methods

3.3.1. TRP Behavior under Nail-Penetration Abuse Test

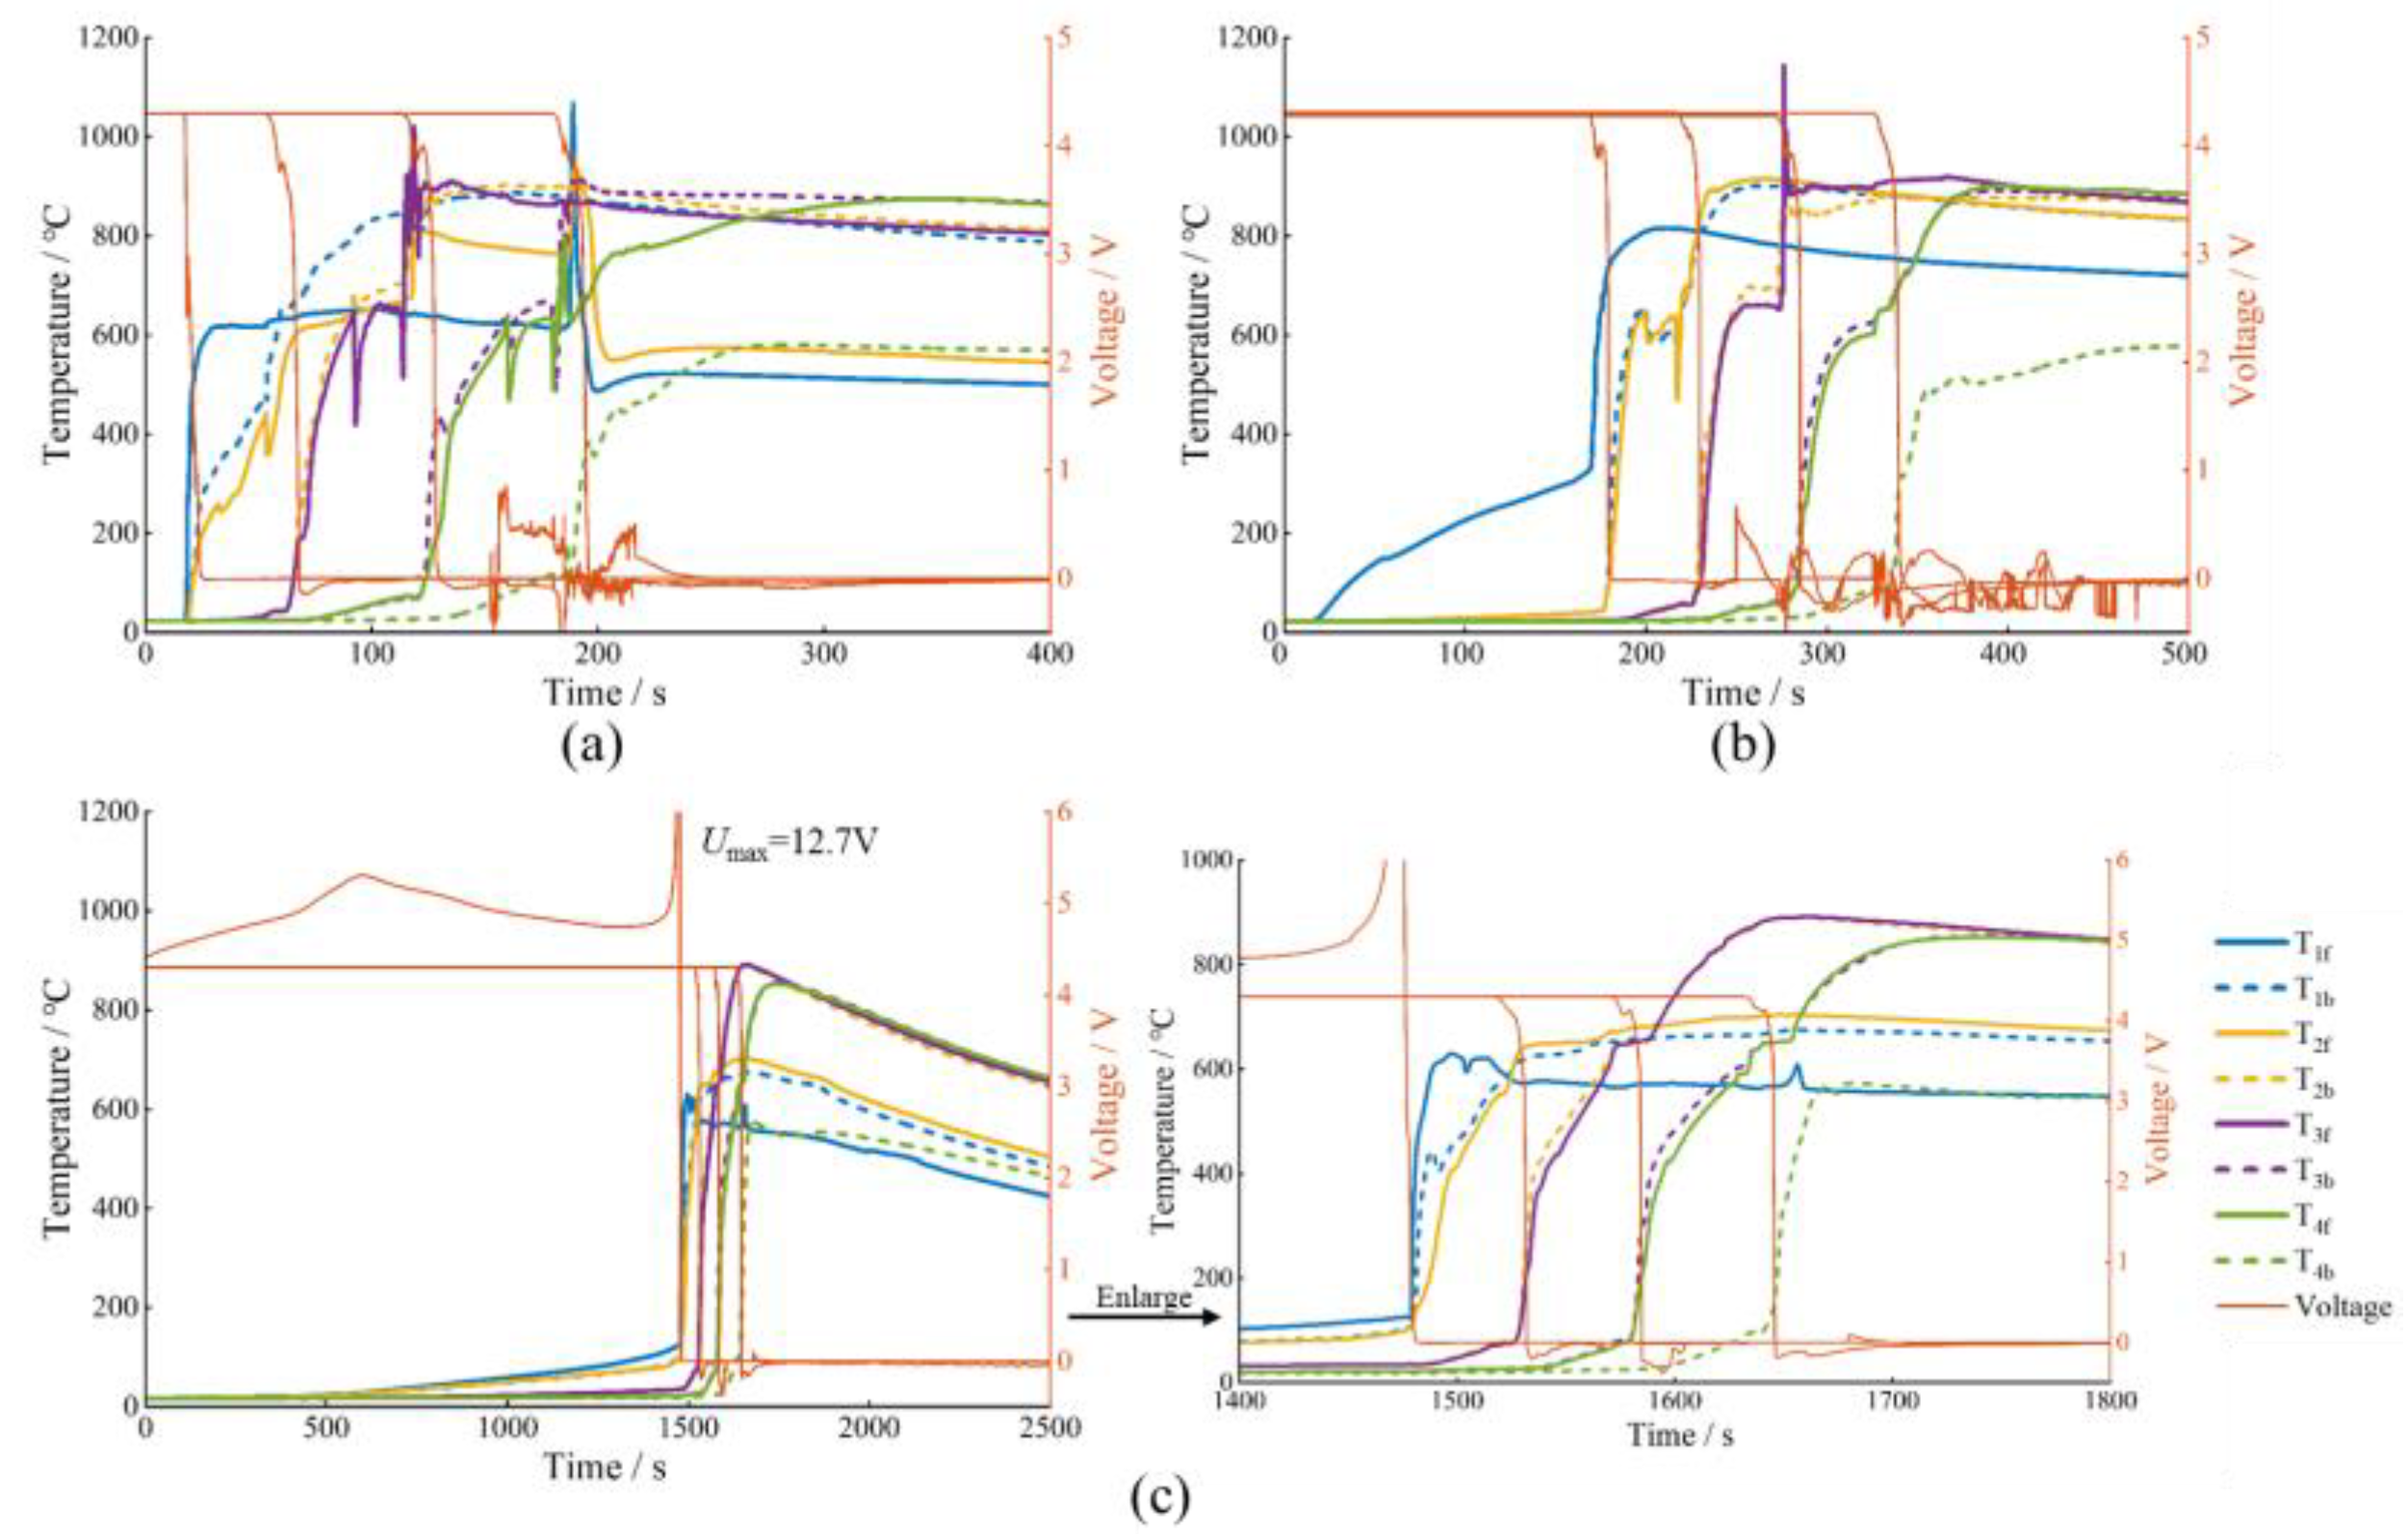
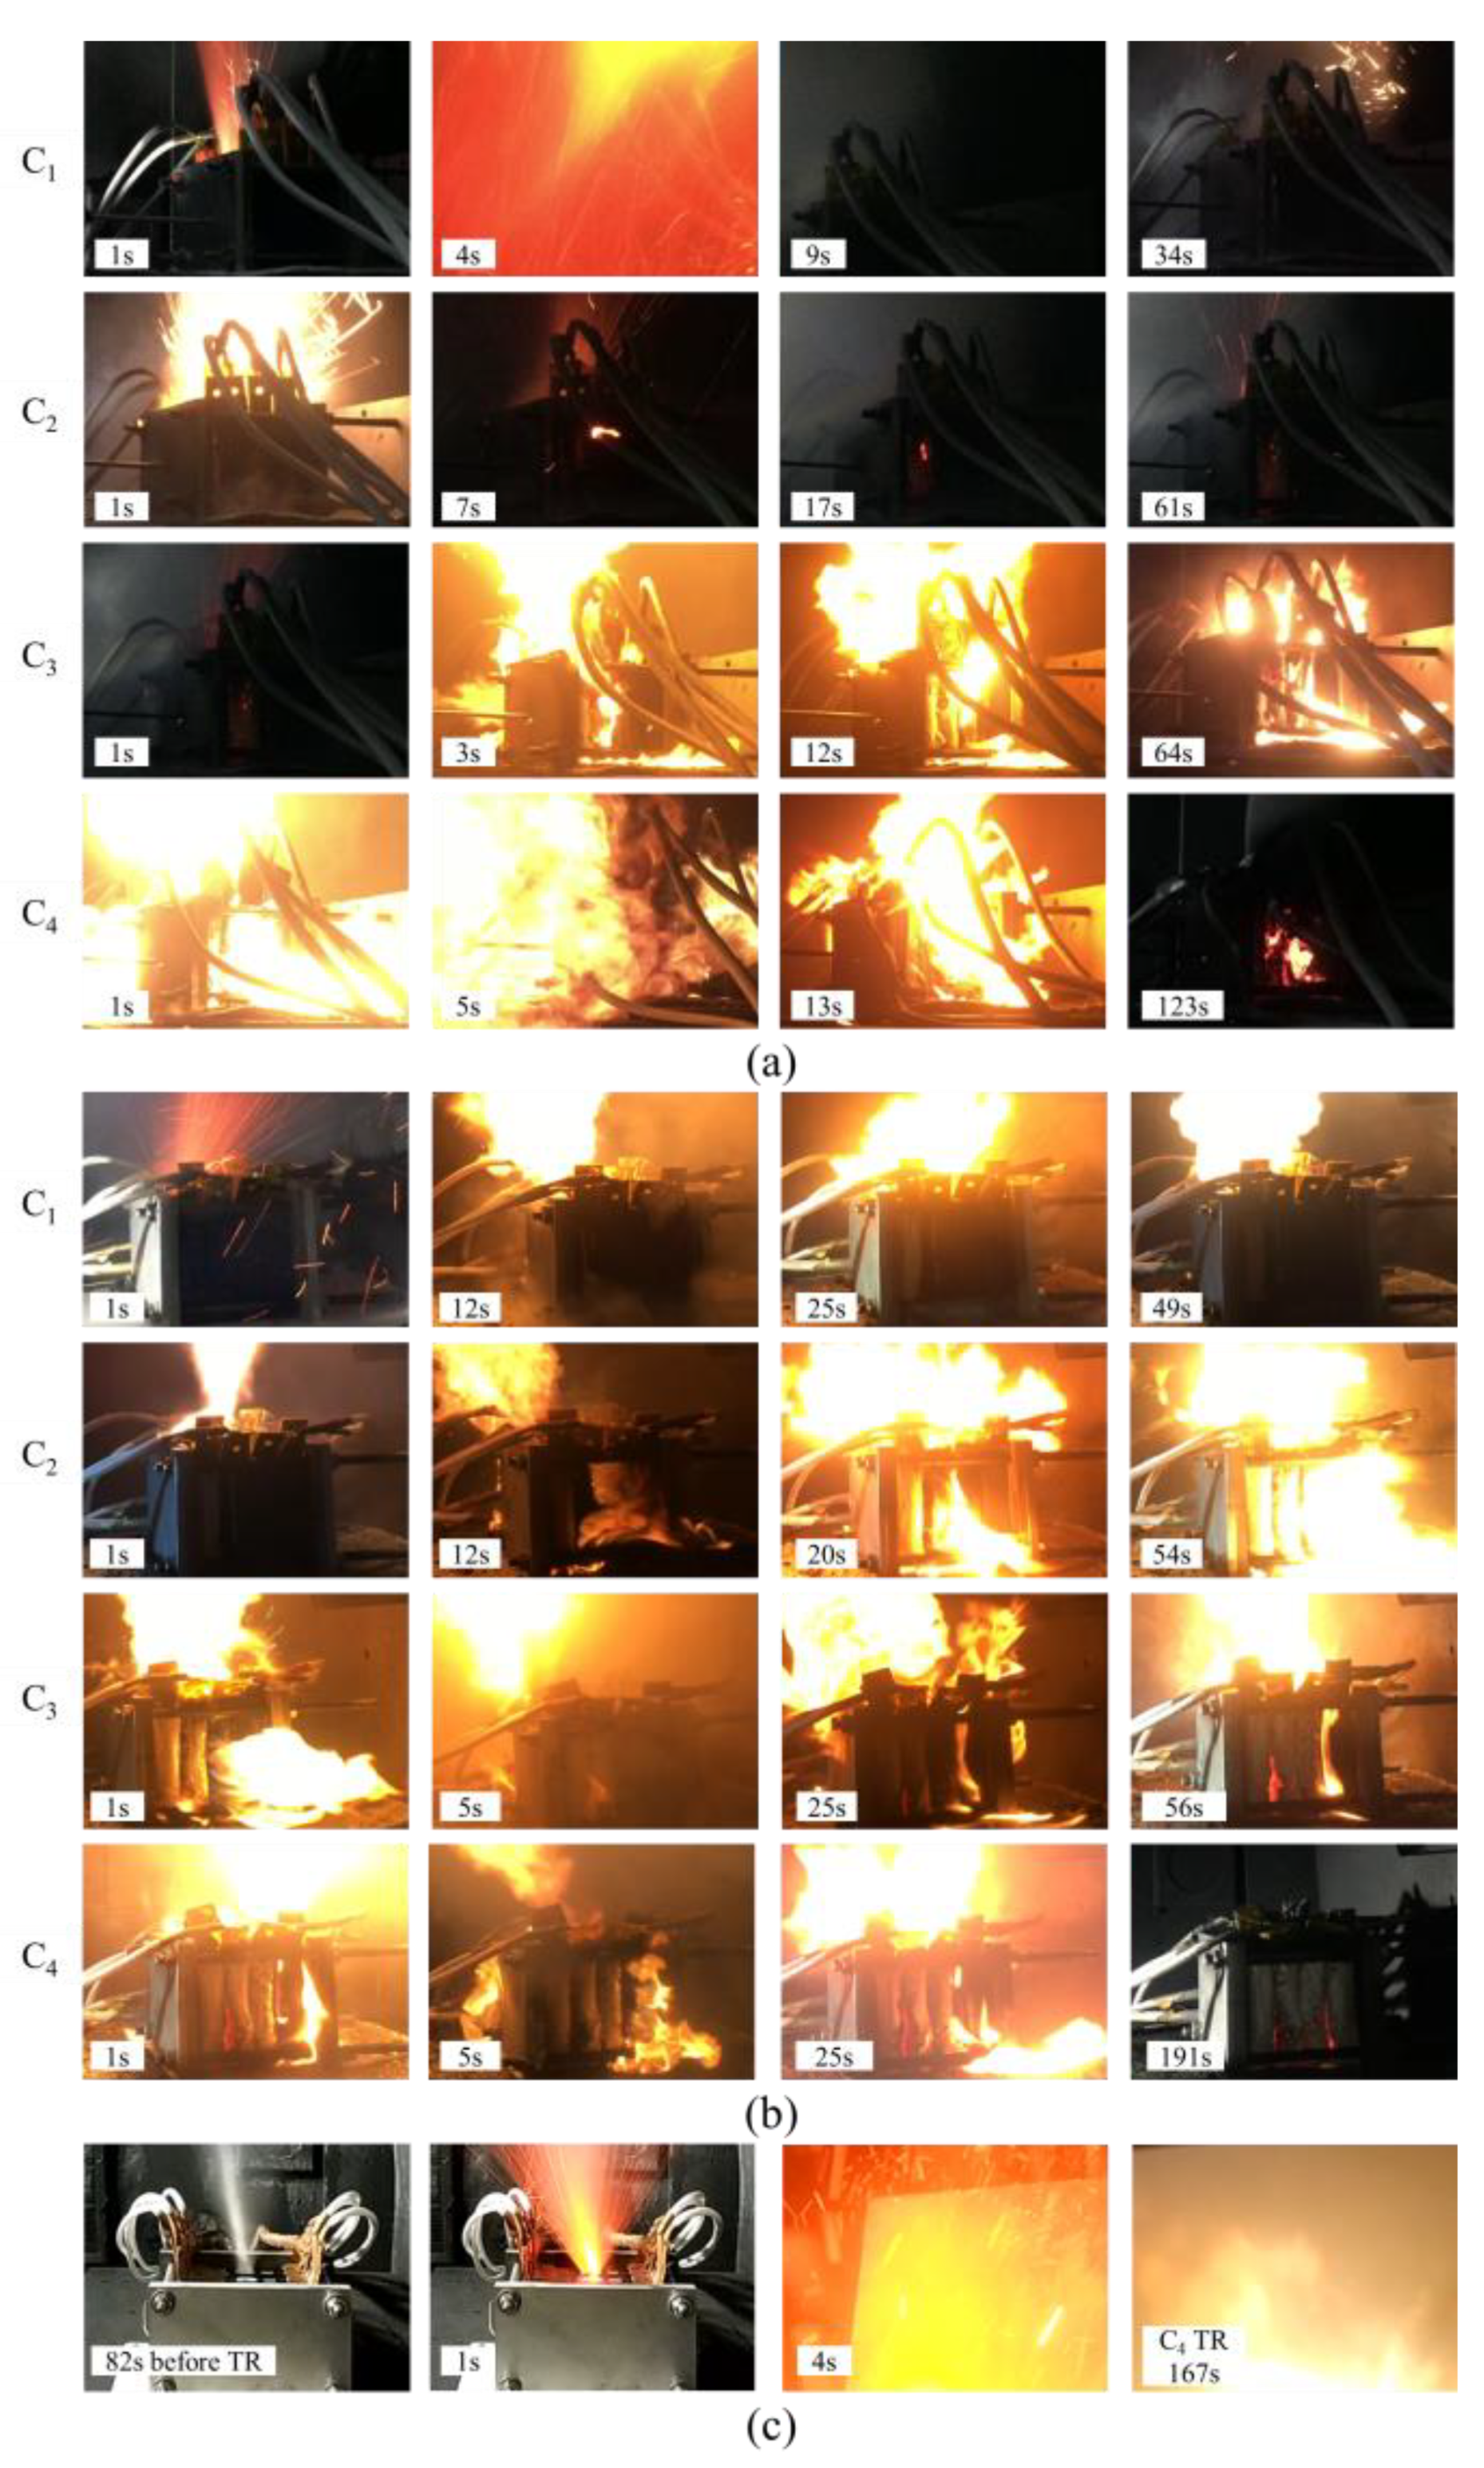
Figure 12a shows the curves of the temperature and voltage of each cell in the nail-penetration abuse test, and Figure 13a shows the TRP process of the module. After C1 was penetrated, T1f rose to 610 °C in 2 s, and T1b also started to rise fluctuatingly. After C2 TR, the curve of T2f approximated to T1f, and correspondingly, the curve of T3f approximated to T4f. C1 and C2 ejected sparks within a few seconds after TR, but there was no fire afterward; only a large amount of smoke was ejected. When C3 TR, the module began to burn, and the temperature of the cells fluctuated drastically due to the effect. After C4 TR, the naked fire of the module lasted for about 123 s. Thereafter, the module continued to release smoke.
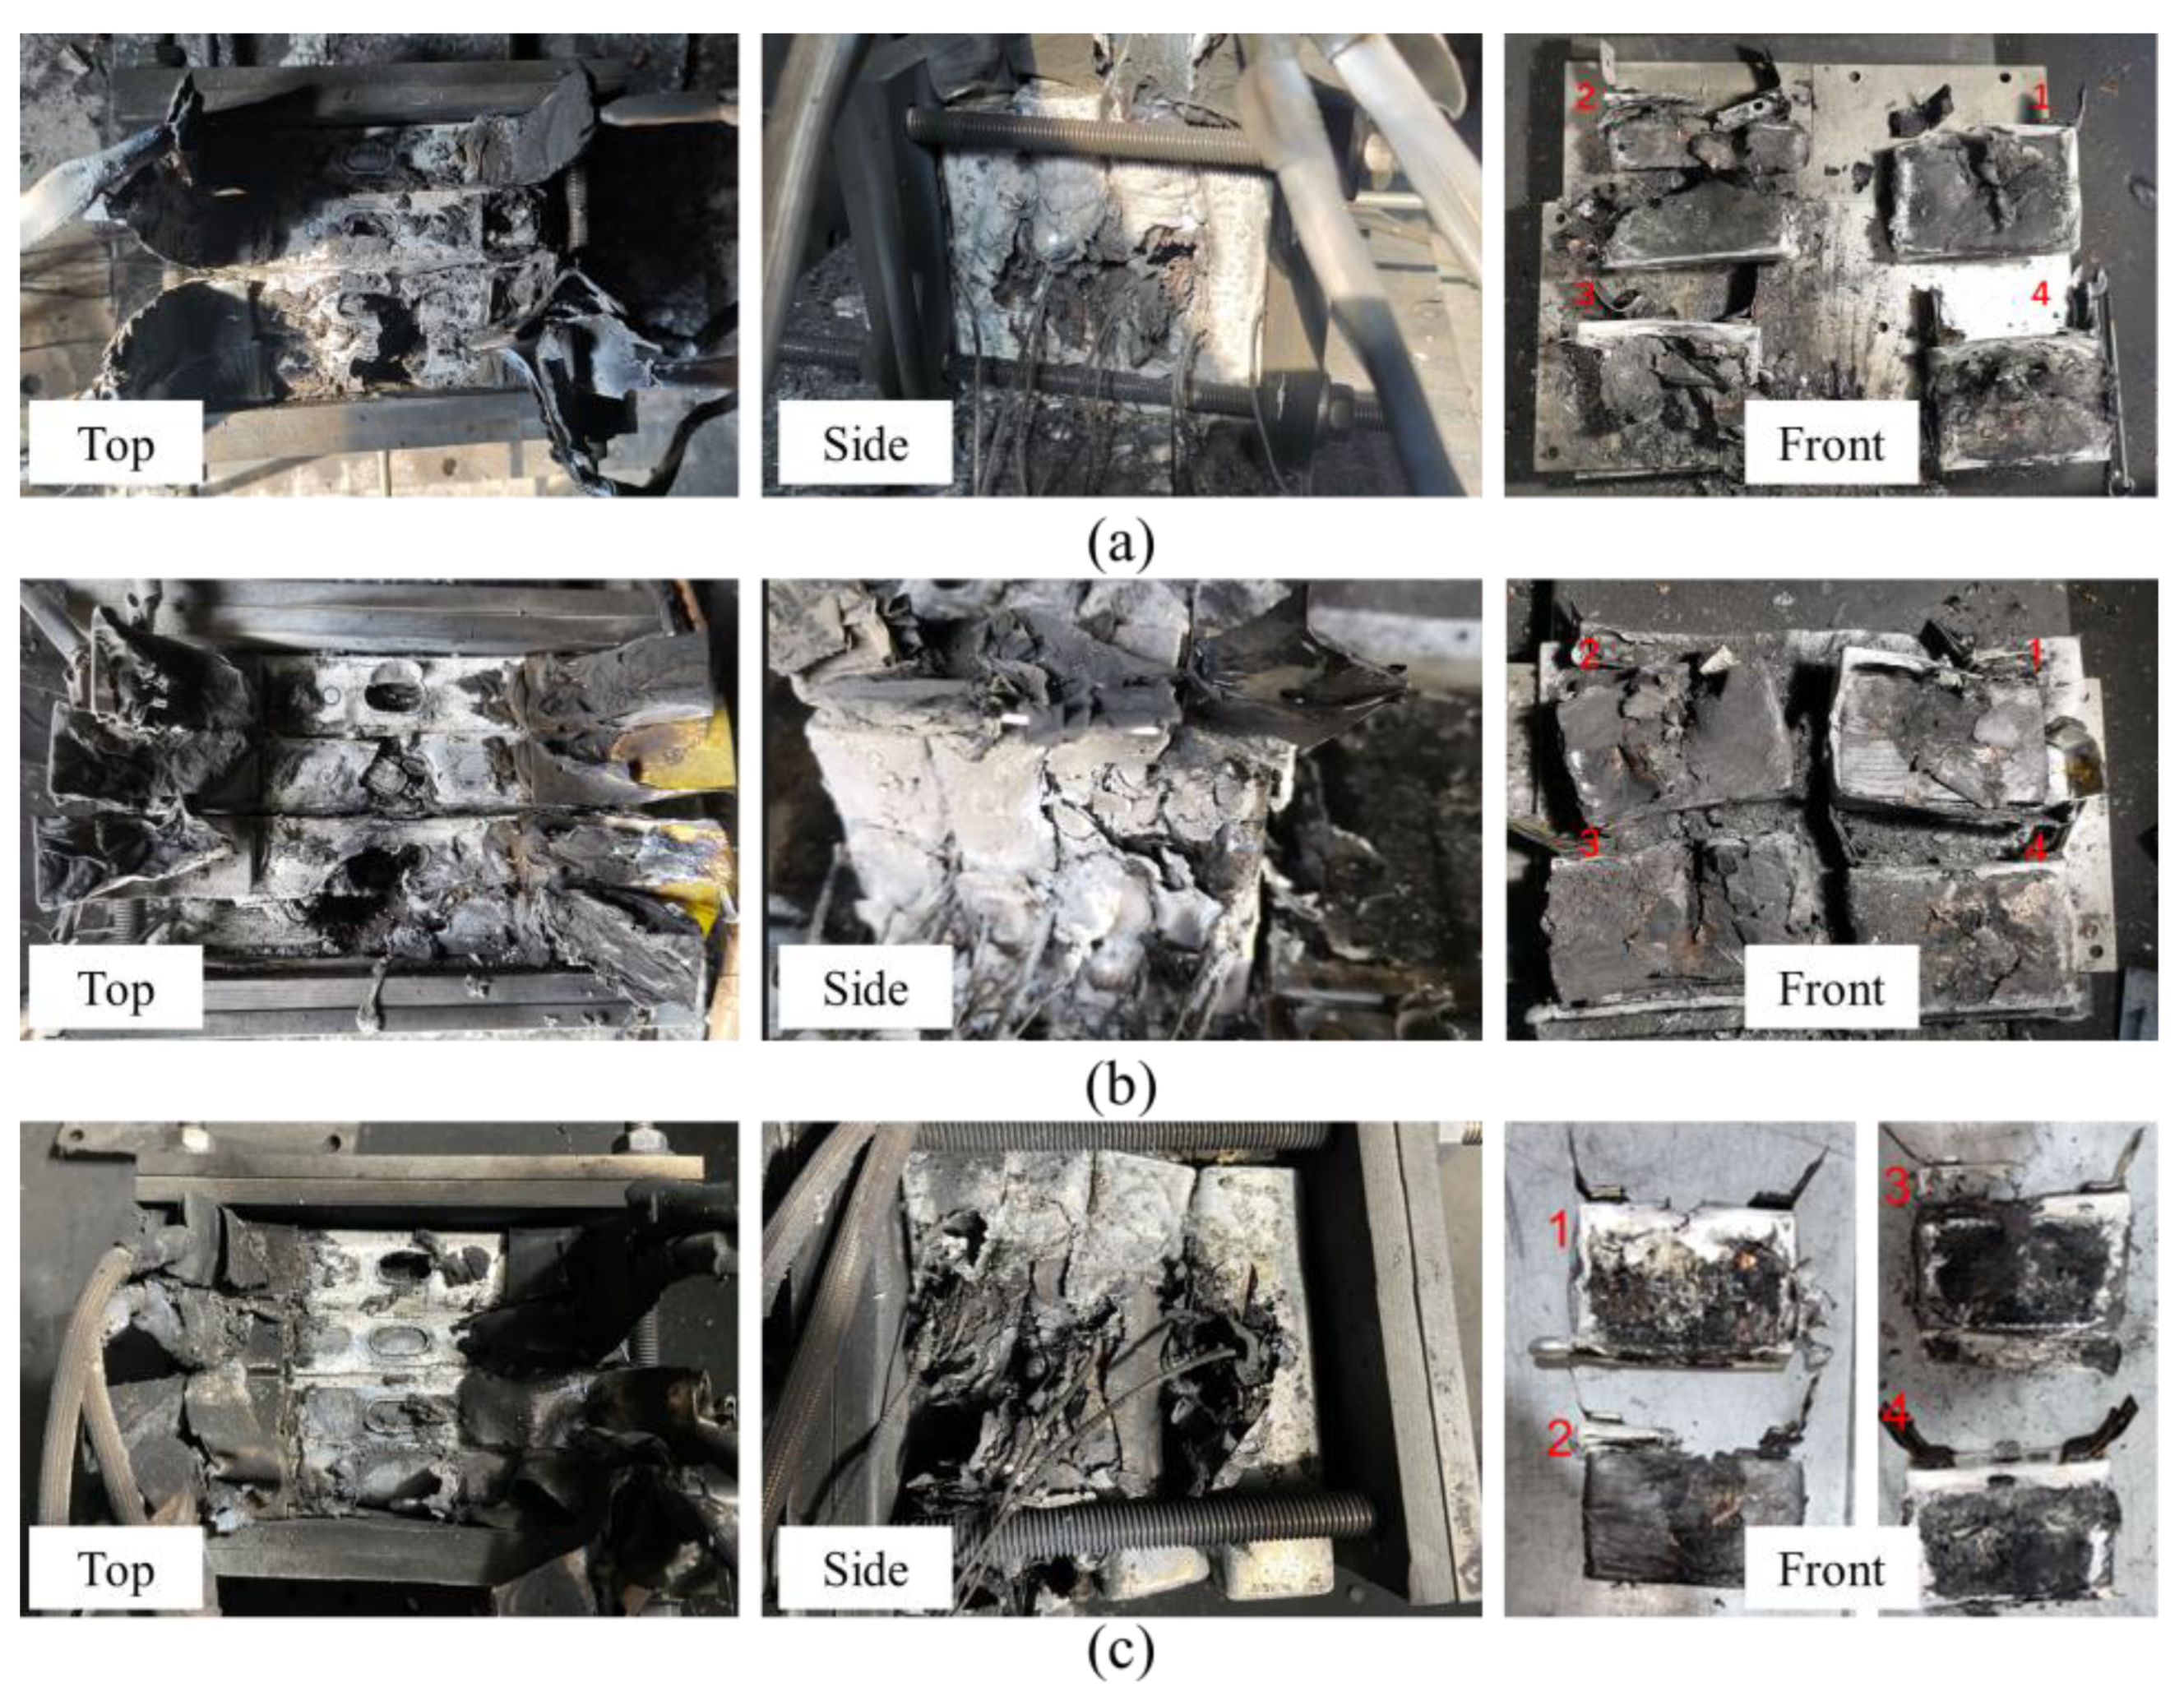
Figure 14a illustrates images of the cell wreckage after the test. The cell’s shell melted in many places and formed multiple metal adhesions after cooling, with the most obvious adhesions at the bottom between the cells. The breakage was more severe on the top of C1 and C2; in addition, the side surface from C2 to C4 was broken and ejected a large amount of jelly roll. Compared with the cell TR test, each cell in the module was more severely damaged.

3.3.2. TRP Behavior under Side-Heating Abuse Test

The curves of the temperature and voltage of each cell in the side-heating abuse test are illustrated in Figure 12b. C1 was heated for 155 s before TR, after which C1 ejected for about 10 s, and then combustion commenced above C1. The module remained burning until the end of TRP, as shown in Figure 13b. During the TRP, large fluctuations in T2f and T3f were observed. As the flames became more intense, they were also ejected from the side of C2-C4, which resulted in a higher temperature of C2–C4 than C1 by more than 100 °C. The module continued to combust for nearly 200 s following C4 TR, after which the flame disappeared from the outside of the module, but there were still visible sparks inside the module.
Figure 14b shows images of the cell wreckage after the test. Similar to the pinprick experiment, the damage on the top surface of C1 and C2 was more severe, with large breaks on the surface of each cell, and the shell of each contact cell was completely melted, allowing the internal failed jelly roll to be seen.

3.3.3. TRP Behavior under Side-Heating Abuse Test

The temperature and voltage curves of the module in the overcharge abuse test and its enlarged diagram are shown in Figure 12c. The voltage of C1 slowly rose from 4.31 V to 5.305 V, then it dropped due to the internal short circuit and started to rise rapidly when it reached about 5 V again. The maximum overcharge voltage was 12.7 V, after which it quickly dropped to 0. At this time, C1 was overcharged to about 141% SOC. The maximum temperature of both C1 and C2 was around 650 °C, while that of C3 and C4 reached almost 1000 °C. Figure 13c shows the process of the module overcharge test. Unexpectedly, due to the very violent impact wave of the overcharge-triggered TRP, the camera lens was struck during C1 TR and failed to capture the complete scene. It is worth noting that 83 s before C1 TR, its pressure relief valve suddenly broke and started to eject a large amount of electrolyte to the outside, which may be the reason for the low temperature of C1. After C4 TR, the module also burned for at least 167 s, after which the camera was affected by the high temperature and turned off.
Figure 14c shows images of the cell wreckage after the test. After the overcharge abuse test, a large amount of molten aluminum appeared on the bottom of C1, and the case of C2 was completely melted, with the jelly roll directly exposed to the module and severely damaged in the combustion. The pressure relief valves of both C2 and C3 can be seen from the above of the module; combined with the side images, it can be seen that the side surfaces of each cell badly deteriorated.

3.3.4. TRP Behavior Comparison

The TR intervals ti−i+1 (i = 1, 2, 3) of the adjacent cells in the different abuse tests are shown in Table 3. It can be seen that the total TRP time varies significantly among the three abuse tests, and the main reason for this is the time interval of the early stages of TRP. In the first TRP time interval, t1–2, the side-heating abuse test is longer than that of the nail-penetration and overcharge abuse test, while there was a different decrease for later TRP time intervals, t2–3 and t3–4. The additional energy introduced by the different abuse methods varies considerably, and the TR time is significantly affected for C1 and C2 in each test, and this effect gradually diminishes from the TR of C3. The less time for module TRP, the faster the release of the module’s TRP energy, which is also reflected in the more violent TRP. The wrecks of the cell of each module can be used as supporting evidence. The mass variation in the module under different abuse tests is shown in Table 4. C1 has the highest mass loss rate in each test, even up to 70% in the overcharge test, due to the extra introduced energy. However, for C2–C4, the difference in their mass loss is not significant, and the values are basically around 33%. The module had the shortest TRP time and lost the most mass in the overcharge test, which to some extent, indicates that the TRP triggered by the overcharge abuse would be more hazardous.

4. Conclusions

This paper investigates the TR behaviors of an Li-ion battery at the cell and module levels using different abuse methods (nail penetration, side heating, and overcharge), which were analyzed and compared through experiments. First, the TR tests at the cell level using EV-ARC and three abuse methods and TRP tests at the module level were conducted. The TR parameters, experimental phenomena, and the introduced extra energy were analyzed, and the TR behaviors using different abuse methods were studied.
Using the EV-ARC test, the characteristic cell temperatures, T1, T2, and T3, used in this study were measured to be 72.4 °C, 222.7 °C, and 994.8 °C, respectively. The maximum temperature of the cell under the nail-penetration abuse test was similar to that of the EV-ARC test, while the maximum temperature of the cell under the side-heating abuse test was higher than T3 due to the extra thermal energy. In addition, the overcharge abuse introduced more extra electrical energy. The TR behavior (cell temperature, TR time, test phenomena, etc.) using the three abuse methods differed significantly. At the cell level, overcharge abuse is the most hazardous, followed by side-heating abuse, and lastly, nail-penetration abuse was the least.
At the module level, the TRP behaviors using the three abuse methods are different in the early TRP stage, the first two TR cells were more affected by the abuse method, and the TR behaviors of the last two cells were similar. Usually, the triggered cell in the module had a higher rate of mass loss, while the mass loss rate of the other cells in the module was relatively similar. In addition, using the same abuse method, the cells in the module were more severely damaged. It can be indicated that the TRP triggered by the overcharge abuse would be more hazardous than that of the side-heating and nail-penetration abuse.

Author Contributions

Writing—original draft preparation, D.W. and M.Z.; Conceptualization, C.X.; Methodology, C.X., H.C. and X.F.; Data curation, L.Z., W.H., Z.Y. and J.Y.; Writing—review and editing, C.X. All authors have read and agreed to the published version of the manuscript.

Funding

This work was supported by the National Key Research and Development Program of China. (Grant NO. 2021YFB2501502).

Data Availability Statement

Not applicable.

Conflicts of Interest

The authors declare no conflict of interest.

References

  1. Hecht, C.; Victor, K.; Zurmühlen, S.; Sauer, D.U. Electric vehicle route planning using real-world charging infrastructure in Germany. eTransportation 2021, 10, 100143. [Google Scholar] [CrossRef]
  2. Lei, B.; Zhao, W.; Ziebert, C.; Uhlmann, N.; Rohde, M.; Seifert, H.J. Experimental Analysis of Thermal Runaway in 18650 Cylindrical Li-Ion Cells Using an Accelerating Rate Calorimeter. Batteries 2017, 3, 14. [Google Scholar] [CrossRef] [Green Version]
  3. Luo, Y.; Qian, Y.; Zeng, Z.; Zhang, Y. Simulation and analysis of operating characteristics of power battery for flying car utilization. eTransportation 2021, 8, 100111. [Google Scholar] [CrossRef]
  4. Thingvad, A.; Andersen, P.B.; Unterluggauer, T.; Træholt, C.; Marinelli, M. Electrification of personal vehicle travels in cities—Quantifying the public charging demand. eTransportation 2021, 9, 100125. [Google Scholar] [CrossRef]
  5. Klink, J.; Hebenbrock, A.; Grabow, J.; Orazov, N.; Nylén, U.; Benger, R.; Beck, H.-P. Comparison of Model-Based and Sensor-Based Detection of Thermal Runaway in Li-Ion Battery Modules for Automotive Application. Batteries 2022, 8, 34. [Google Scholar] [CrossRef]
  6. Tanim, T.R.; Dufek, E.J.; Walker, L.K.; Ho, C.D.; Hendricks, C.E.; Christophersen, J.P. Advanced diagnostics to evaluate heterogeneity in lithium-ion battery modules. eTransportation 2020, 3, 100045. [Google Scholar] [CrossRef]
  7. Xiong, R.; Ma, S.; Li, H.; Sun, F.; Li, J. Toward a Safer Battery Management System: A Critical Review on Diagnosis and Prognosis of Battery Short Circuit. iScience 2020, 23, 101010. [Google Scholar] [CrossRef]
  8. Dixon, J.; Bell, K. Electric vehicles: Battery capacity, charger power, access to charging and the impacts on distribution networks. eTransportation 2020, 4, 100059. [Google Scholar] [CrossRef]
  9. Qin, P.; Sun, J.; Yang, X.; Wang, Q. Battery thermal management system based on the forced-air convection: A review. eTransportation 2021, 7, 100097. [Google Scholar] [CrossRef]
  10. Greene, D.L.; Ogden, J.M.; Lin, Z. Challenges in the designing, planning and deployment of hydrogen refueling infrastructure for fuel cell electric vehicles. eTransportation 2020, 6, 100086. [Google Scholar] [CrossRef]
  11. Li, Y.; Wang, W.; Lin, C.; Yang, X.; Zuo, F. Multi-physics safety model based on structure damage for lithium-ion battery under mechanical abuse. J. Clean. Prod. 2020, 277, 124094. [Google Scholar] [CrossRef]
  12. Lamb, J.; Orendorff, C.J. Evaluation of mechanical abuse techniques in lithium ion batteries. J. Power Source 2014, 247, 189–196. [Google Scholar] [CrossRef]
  13. Jiang, Z.; Li, H.; Qu, Z.; Zhang, J. Recent progress in lithium-ion battery thermal management for a wide range of temperature and abuse conditions. Int. J. Hydrogen Energy 2022, 47, 9428–9459. [Google Scholar] [CrossRef]
  14. Li, W.; Wang, H.; Zhang, Y.; Ouyang, M. Flammability characteristics of the battery vent gas: A case of NCA and LFP lithium-ion batteries during external heating abuse. J. Energy Storage 2019, 24, 100775. [Google Scholar] [CrossRef]
  15. Oca, L.; Guillet, N.; Tessard, R.; Iraola, U. Lithium-ion capacitor safety assessment under electrical abuse tests based on ultrasound characterization and cell opening. J. Energy Storage 2019, 23, 29–36. [Google Scholar] [CrossRef]
  16. Zhang, G.; Wei, X.; Chen, S.; Zhu, J.; Han, G.; Dai, H. Revealing the Impact of Slight Electrical Abuse on the Thermal Safety Characteristics for Lithium-Ion Batteries. ACS Appl. Energy Mater. 2021, 4, 12858–12870. [Google Scholar] [CrossRef]
  17. Zhu, X.; Wang, H.; Wang, X.; Gao, Y.; Allu, S.; Cakmak, E.; Wang, Z. Internal short circuit and failure mechanisms of lithium-ion pouch cells under mechanical indentation abuse conditions: An experimental study. J. Power Source 2020, 455, 227939. [Google Scholar] [CrossRef]
  18. Yuan, C.; Wang, L.; Yin, S.; Xu, J. Generalized separator failure criteria for internal short circuit of lithium-ion battery. J. Power Source 2020, 467, 228360. [Google Scholar] [CrossRef]
  19. Li, Y.; Feng, X.; Ren, D.; Ouyang, M.; Lu, L.; Han, X. Thermal Runaway Triggered by Plated Lithium on the Anode after Fast Charging. ACS Appl. Mater. Interfaces 2019, 11, 46839–46850. [Google Scholar] [CrossRef]
  20. Cai, W.; Wang, H.; Maleki, H.; Howard, J.; Lara-Curzio, E. Experimental simulation of internal short circuit in Li-ion and Li-ion-polymer cells. J. Power Source 2011, 196, 7779–7783. [Google Scholar] [CrossRef]
  21. Ruiz, V.; Pfrang, A.; Kriston, A.; Omar, N.; van den Bossche, P.; Boon-Brett, L. A review of international abuse testing standards and regulations for lithium ion batteries in electric and hybrid electric vehicles. Renew. Sustain. Energy Rev. 2018, 81, 1427–1452. [Google Scholar] [CrossRef]
  22. Zhang, F.; Feng, X.; Xu, C.; Jiang, F.; Ouyang, M. Thermal runaway front in failure propagation of long-shape lithium-ion battery. Int. J. Heat Mass Transf. 2022, 182, 121928. [Google Scholar] [CrossRef]
  23. Wang, H.; Du, Z.; Rui, X.; Wang, S.; Jin, C.; He, L.; Zhang, F.; Wang, Q.; Feng, X. A comparative analysis on thermal runaway behavior of Li (NixCoyMnz) O2 battery with different nickel contents at cell and module level. J. Hazard. Mater. 2020, 393, 122361. [Google Scholar] [CrossRef] [PubMed]
  24. Ren, D.; Feng, X.; Liu, L.; Hsu, H.; Lu, L.; Wang, L.; He, X.; Ouyang, M. Investigating the relationship between internal short circuit and thermal runaway of lithium-ion batteries under thermal abuse condition. Energy Storage Mater. 2021, 34, 563–573. [Google Scholar] [CrossRef]
  25. Feng, X.; Xu, C.; He, X.; Wang, L.; Zhang, G.; Ouyang, M. Mechanisms for the evolution of cell variations within a LiNixCoyMnzO2/graphite lithium-ion battery pack caused by temperature non-uniformity. J. Clean. Prod. 2018, 205, 447–462. [Google Scholar] [CrossRef]
  26. Xu, C.; Feng, X.; Huang, W.; Duan, Y.; Chen, T.; Gao, S.; Lu, L.; Jiang, F.; Ouyang, M. Internal temperature detection of thermal runaway in lithium-ion cells tested by extended-volume accelerating rate calorimetry. J. Energy Storage 2020, 31, 101670. [Google Scholar] [CrossRef]
  27. Jin, C.; Sun, Y.; Wang, H.; Lai, X.; Wang, S.; Chen, S.; Rui, X.; Zheng, Y.; Feng, X.; Wang, H.; et al. Model and experiments to investigate thermal runaway characterization of lithium-ion batteries induced by external heating method. J. Power Source 2021, 504, 230065. [Google Scholar] [CrossRef]
  28. Lai, X.; Jin, C.; Yi, W.; Han, X.; Feng, X.; Zheng, Y.; Ouyang, M. Mechanism, modeling, detection, and prevention of the internal short circuit in lithium-ion batteries: Recent advances and perspectives. Energy Storage Mater. 2021, 35, 470–499. [Google Scholar] [CrossRef]
  29. Feng, X.; Fang, M.; He, X.; Ouyang, M.; Lu, L.; Wang, H.; Zhang, M. Thermal runaway features of large format prismatic lithium ion battery using extended volume accelerating rate calorimetry. J. Power Source 2014, 255, 294–301. [Google Scholar] [CrossRef]
  30. Huang, X.; Xiao, M.; Han, D.; Xue, J.; Wang, S.; Meng, Y. Thermal runaway features of lithium sulfur pouch cells at various states of charge evaluated by extended volume-accelerating rate calorimetry. J. Power Source 2021, 489, 229503. [Google Scholar] [CrossRef]
  31. Mei, W.; Duan, Q.; Zhao, C.; Lu, W.; Sun, J.; Wang, Q. Three-dimensional layered electrochemical-thermal model for a lithium-ion pouch cell Part II. The effect of units number on the performance under adiabatic condition during the discharge. Int. J. Heat Mass Transf. 2020, 148, 119082. [Google Scholar] [CrossRef]
  32. Vendra, C.M.; Shelke, A.V.; Buston, J.E.; Gill, J.; Howard, D.; Read, E.; Abaza, A.; Cooper, B.; Wen, J.X. Numerical and experimental characterisation of high energy density 21,700 lithium-ion battery fires. Process Saf. Environ. Prot. 2022, 160, 153–165. [Google Scholar] [CrossRef]
  33. Greve, L.; Fehrenbach, C. Mechanical testing and macro-mechanical finite element simulation of the deformation, fracture, and short circuit initiation of cylindrical Lithium ion battery cells. J. Power Source 2012, 214, 377–385. [Google Scholar] [CrossRef]
  34. Lai, X.; Zheng, Y.; Zhou, L.; Gao, W. Electrical behavior of overdischarge-induced internal short circuit in lithium-ion cells. Electrochim. Acta 2018, 278, 245–254. [Google Scholar] [CrossRef]
  35. Ramasamy, R.P.; White, R.E.; Popov, B.N. Calendar life performance of pouch lithium-ion cells. J. Power Source 2005, 141, 298–306. [Google Scholar] [CrossRef]
  36. Wang, Q.; Sun, J.; Yao, X.; Chen, C. Thermal stability of LiPF6/EC+DEC electrolyte with charged electrodes for lithium ion batteries. Thermochim. Acta 2005, 437, 12–16. [Google Scholar] [CrossRef]
  37. Venegas, F.G.; Petit, M.; Perez, Y. Plug-in behavior of electric vehicles users: Insights from a large-scale trial and impacts for grid integration studies. eTransportation 2021, 10, 100131. [Google Scholar] [CrossRef]
  38. Ryou, M.-H.; Lee, J.-N.; Lee, D.J.; Kim, W.-K.; Jeong, Y.K.; Choi, J.W.; Park, J.-K.; Lee, Y.M. Effects of lithium salts on thermal stabilities of lithium alkyl carbonates in SEI layer. Electrochim. Acta 2012, 83, 259–263. [Google Scholar] [CrossRef]
  39. Wang, H.; Tang, A.; Huang, K. Oxygen Evolution in Overcharged LixNi1/3Co1/3Mn1/3O2 Electrode and Its Thermal Analysis Kinetics. Chin. J. Chem. 2011, 29, 1583–1588. [Google Scholar] [CrossRef]
  40. Zhao, W.; Rohde, M.; Mohsin, I.U.; Ziebert, C.; Du, Y.; Seifert, H.J. Combined Thermal Runaway Investigation of Coin Cells with an Accelerating Rate Calorimeter and a Tian-Calvet Calorimeter. Batteries 2022, 8, 15. [Google Scholar] [CrossRef]
Figure 1. Process on thermocouple implantation. (a) Discharge; (b) drill the hole; (c) open access; (d) inserting the thermocouple; (e) gluing the thermocouple; (f) charge.
Batteries 08 00201 g001
Figure 2. Experimental setup for EV-ARC test. (a) EV-ARC; (b) EV-ARC chamber; (c) Schematic of thermocouple position.
Batteries 08 00201 g002
Figure 3. Nail-penetration abuse test. (a) cell test; (b) module test.
Batteries 08 00201 g003
Figure 4. Side-heating abuse test. (a) cell test; (b) module test.
Batteries 08 00201 g004
Figure 5. Overcharge abuse test. (a) cell test; (b) module test.
Batteries 08 00201 g005
Figure 6. TR characterization of cell under EV-ARC test.
Batteries 08 00201 g006
Figure 7. Internal temperature and voltage of the cell.
Batteries 08 00201 g007
Figure 8. Wreckage of the cell after EV-ARC test.
Batteries 08 00201 g008
Figure 9. TR characterization of cell under different abuse tests. (a) Nail penetration; (b) Side heating; (c) Overcharge.
Batteries 08 00201 g009
Figure 10. TR phenomena under different abuse test. (a) Nail penetration; (b) Side heating; (c) Overcharge.
Batteries 08 00201 g010
Figure 11. Cell wreckage after different abuse test. (a) Nail penetration; (b) Side heating; (c) Overcharge.
Batteries 08 00201 g011
Figure 12. TRP temperature and voltage with different trigger methods. (a) Nail penetration; (b) Side heating; (c) Overcharge.
Batteries 08 00201 g012
Figure 13. TRP phenomena with different abuse methods. (a) Nail penetration; (b) Side heating; (c) Overcharge.
Batteries 08 00201 g013
Figure 14. TRP wreckage with different trigger methods. (a) Nail penetration; (b) Side heating; (c) Overcharge.
Batteries 08 00201 g014
Table 1. Specifications of the cell.
Length (mm)Width (mm)Height (mm)Capacity (Ah)Weight (g)
1081022760930
Table 2. Characteristic parameters of cell TR under different abuse tests.
CharacteristicsTmax
(℃)
Mloss
(g)
Mloss Rate
(%)
TR Energy
(J)
Extra Energy
(J)
TR Trigger Time
(s)
Time of Ejection & Fire
(s)
EV-ARC994.8272.332.47.19 × 105NoneOver 90,000-
Nail penetration964.3331.335.66.96 × 105None16
Side heating1020372.139.97.39 × 1052.00 × 104180136
OverchargeNone 601.164.31.17 × 1064.48 × 1054700165
Table 3. Time interval of TRP with different trigger methods.
Abuse Methodt1–2 (s)t2–3 (s)t3–4 (s)TRP Time (s)
Nail penetration44.259.263.5177.8
Side heating47.554.855.2158.5
Overcharge37.248.351.3146.6
Table 4. Mass variation under different abuse tests.
Trigger MethodCellMloss (g)Mloss Rate (%)
Nail penetrationC1451.948.53
C2295.431.82
C3309.033.20
C4323.634.79
Side heatingC1425.945.89
C2323.534.92
C3310.733.46
C4301.932.71
OverchargeC1655.570.16
C2316.733.90
C3314.933.70
C4279.529.92
Publisher’s Note: MDPI stays neutral with regard to jurisdictional claims in published maps and institutional affiliations.