Article

A Novel Stochastic Mixed-Integer-Linear-Logical Programming Model for Optimal Coordination of Hybrid Storage Systems in Isolated Microgrids Considering Demand Response

by
Marcos Tostado-Véliz
1,*,
Ali Asghar Ghadimi
2,
Mohammad Reza Miveh
3,
Daniel Sánchez-Lozano
1,
Antonio Escamez
1 and
Francisco Jurado
1
1
Department of Electrical Engineering, University of Jaén, 23700 Linares, Spain
2
Department of Electrical Engineering, Faculty of Engineering, Arak University, Arak 38156-8-8349, Iran
3
Department of Electrical Engineering, Tafresh University, Tafresh 39518-79611, Iran
*
Author to whom correspondence should be addressed.
Batteries 2022, 8(11), 198; https://doi.org/10.3390/batteries8110198
Submission received: 22 September 2022 / Revised: 13 October 2022 / Accepted: 24 October 2022 / Published: 25 October 2022

Abstract

:
Storage systems and demand-response programs will play a vital role in future energy systems. Batteries, hydrogen or pumped hydro storage systems can be combined to form hybrid storage facilities to not only manage the intermittent behavior of renewable sources, but also to store surplus renewable energy in a practice known as ‘green’ storage. On the other hand, demand-response programs are devoted to encouraging a more active participation of consumers by pursuing a more efficient operation of the system. In this context, proper scheduling tools able to coordinate different storage systems and demand-response programs are essential. This paper presents a stochastic mixed-integer-lineal-logical framework for optimal scheduling of isolated microgrids. In contrast to other works, the present model includes a logical-based formulation to explicitly coordinate batteries and pumped hydro storage units. A case study on a benchmark isolated microgrid serves to validate the developed optimization model and analyze the effect of applying demand-response premises in microgrid operation. The results demonstrate the usefulness of the developed method, and it is found that operation cost and fuel consumption can be reduced by ~38% and ~82% by applying demand-response initiatives.

1. Introduction

Small, isolated grids are used for many decades in remote areas, where supply from the main grid is either difficult to avail due to the topology or frequently disrupted because of climatic conditions [1]. Conventionally, diesel generators based on nonrenewable fuel sources have been the most common choice for generating electricity in these isolated systems. However, gradual reduction of fossil fuel consumption, poor energy efficiency and environmental pollution are major problems that limited the use of such generators in remote areas. The use of renewable resources such as photovoltaic (PV) and wind generators (WGs) at the distribution level has provided numerous technical, economic and environmental benefits and can be considered to be a viable solution for remote communities [2]. However, the uncertain behavior and variability of renewable-based generators lead to the fluctuation of net load considerably and need extra flexibility resources to cope with the inherent intermittency of these sources [
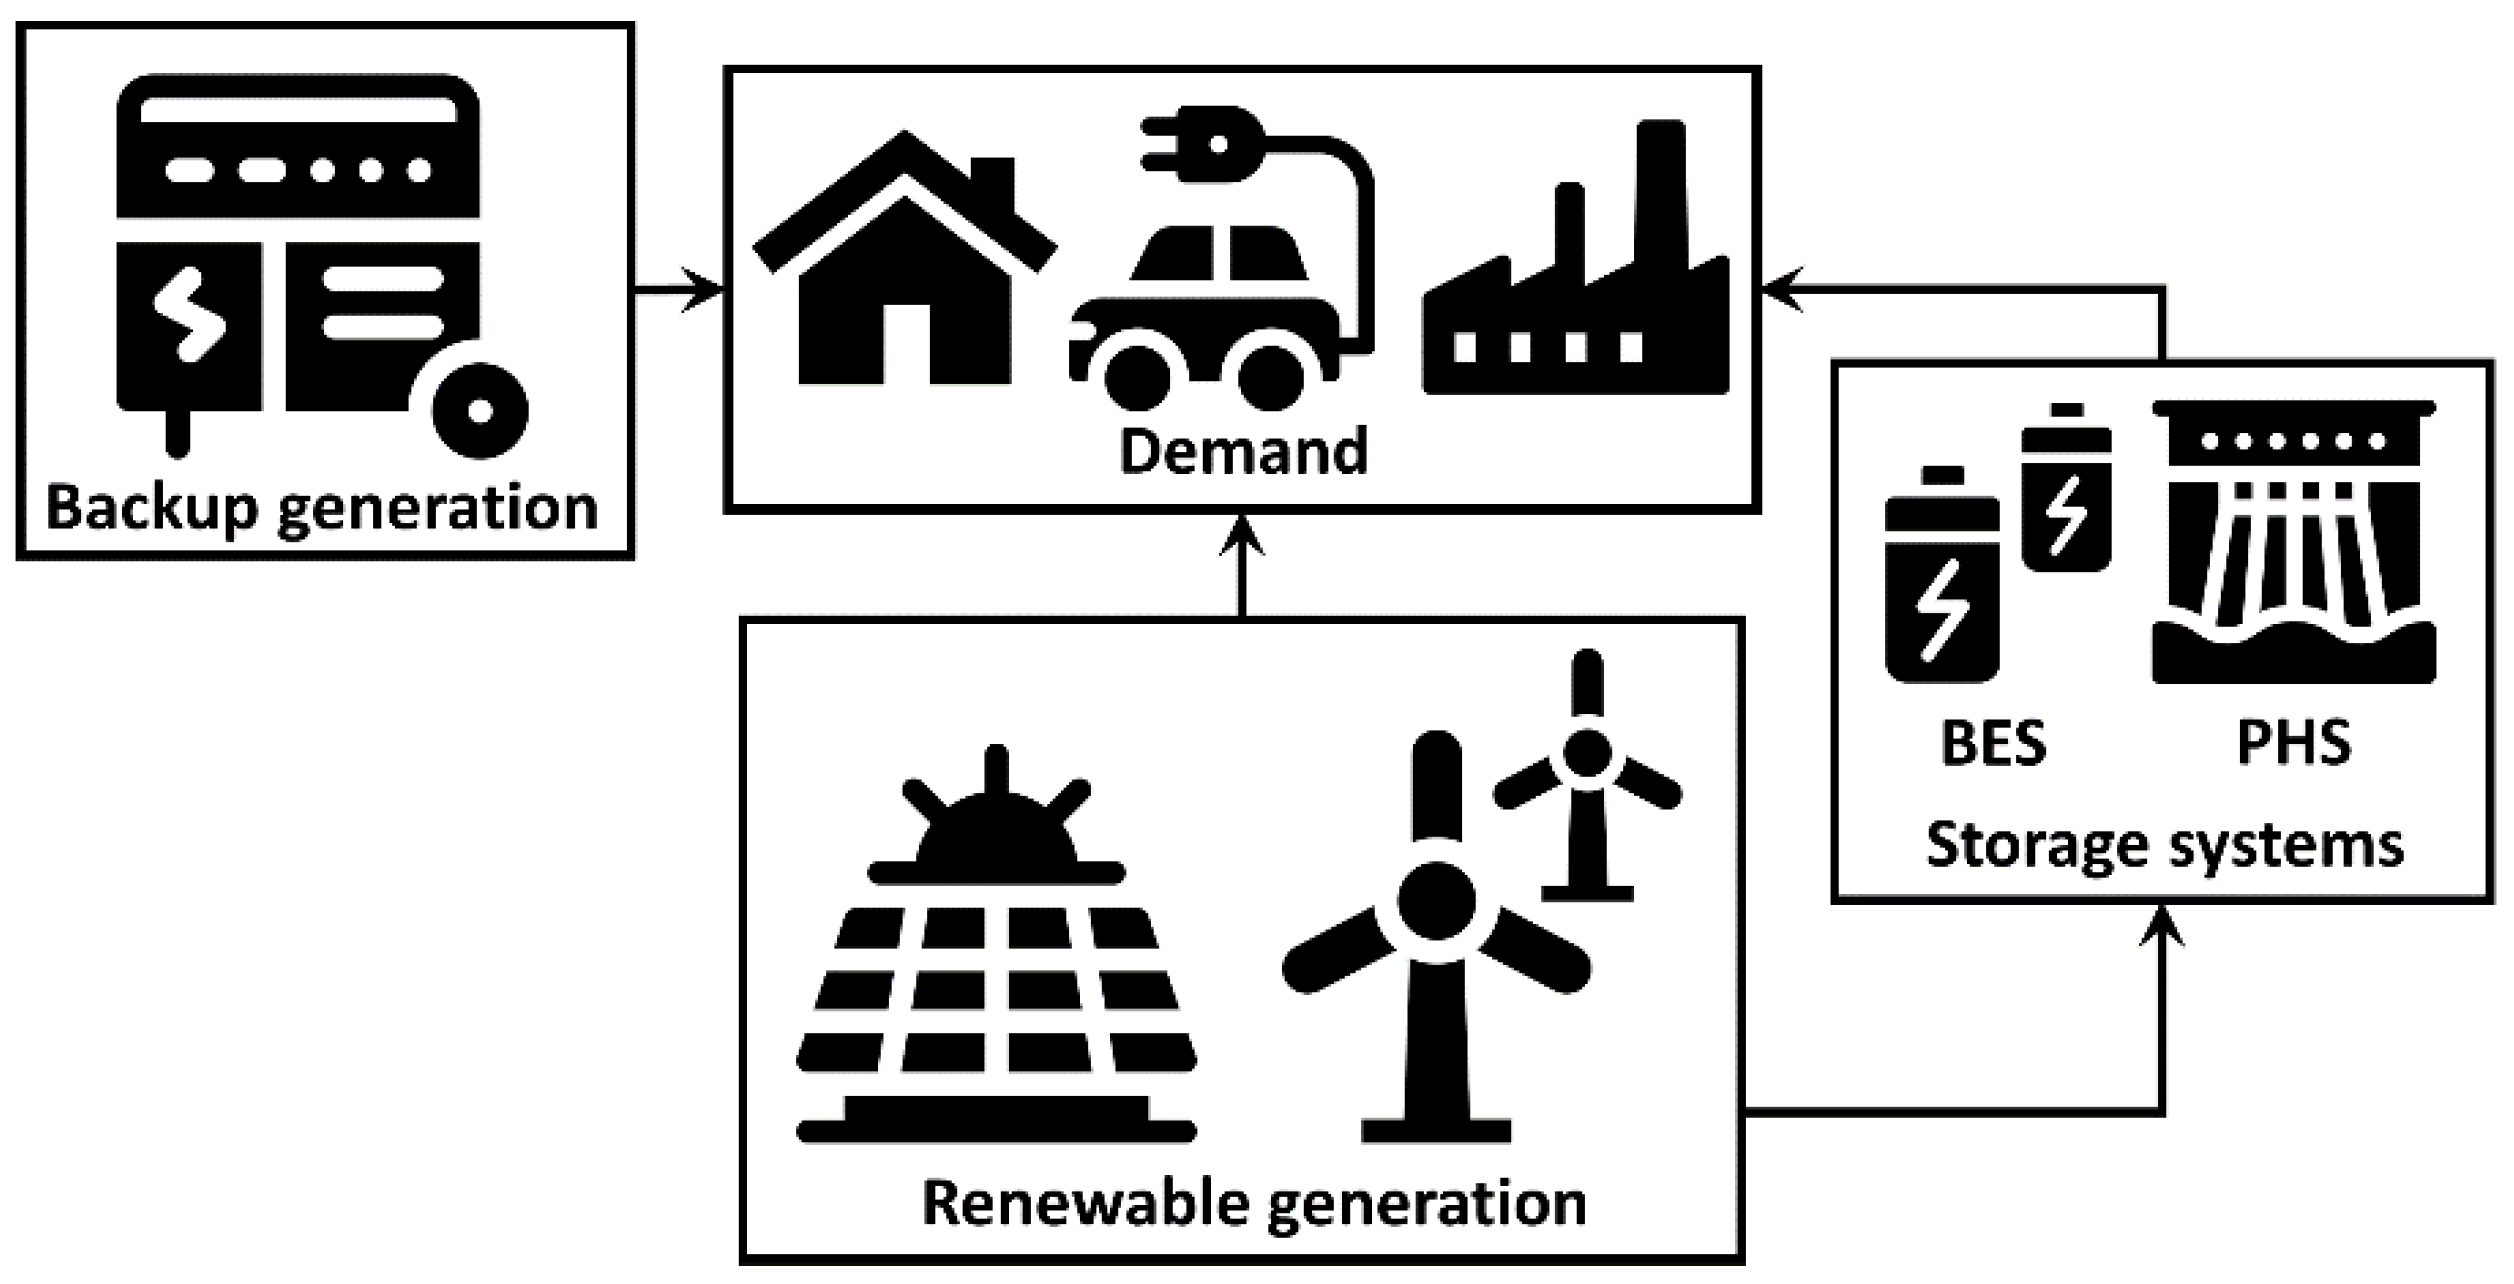
3]. In addition, in the circumstance where the generation of PVs and WGs are more than the required demand, the excess power should be curtailed to provide a balance between the load and supply. Storage systems play a key role in providing power balance in such remote areas. Due to the advantages of smart grids, it is promising to operate local distribution grids as a microgrid (MG) to take maximum benefits of renewable resources.
MGs as part of active distribution networks are one of the best solutions to overcome the challenges stemming from the high penetration of distributed energy resources (DERs) in distribution networks [4]. MGs are the conglomerate of several DERs, storage systems and loads with the ability to operate in both grid-connected and isolated modes. The use of MGs provides the ability to implement modern energy management means such as demand-side management and demand-response (DR) programs [5]. Moreover, storage systems in MGs are effective devices for developing renewable resources, as they are the only solution to deal with the challenge of intermittency of renewable sources. Storage systems can store the excess generation of DERs when demand is low and can use the stored energy when facing a shortage of generation. Among various storage systems, pumped hydro storage (PHS) units can be planned to operate more efficiently in MGs [6]. Nevertheless, optimal operation and coordination of several DERs and storage systems along with demand-response programs in isolated MGs is a very challenging issue that needs to be resolved.
A considerable amount of literature has been published on the optimal operation of DERs and storage systems in MGs. Vasudevan et al. [7] presented a comprehensive review of energy management strategies for variable speed pumped hydro storage. The paper also provided a comparison between PHS and other storage systems using critical data analysis. Zhao et al. [8] presented optimal management for an isolated MG consisting of several renewable-based sources and PHS to maximize the operating profit and cope with the effects of the intermittent renewable energies. DR is also used in the paper for peak load shaving. Alturki et al. [9] has designed and optimized an isolated hybrid WG/PV/biomass/PHS system to minimize the cost of energy. Stochastic optimal scheduling of several DERs, a pumped-storage unit, heating storage and cooling storage considering incentive-based DRPs in MG is studied in [10]. A scenario approach is employed to model the uncertain parameters of the model. In [11], energy management and real-time control of a typical MG including PHS and other renewable resources for both electricity and water demand are investigated using fuzzy logic and artificial neural network. The outcomes of the paper confirm that the management system keeps the stored water level as the same as the programming technique, while the pump and turbine are regulated more cost-effectively.
Liang et al. [12] propose optimal scheduling for an island MG consisting of a seawater-pumped storage station, PV, WG and diesel generator. The paper has presented a mathematical formulation for seawater-pumped storage stations. Optimal day-ahead scheduling for an isolated MG with renewable sources, PHS unit and DR is suggested in [13]. For the PHS, a precise model is presented, and the uncertainty of renewable resources is also modeled accurately. A novel management framework to optimize the operation of a pumped storage unit and intermittent WG in a typical MG is given in [14]. The uncertain parameters are modeled using the two-point estimate technique. Shi et al. [15] present a scheduling scheme for a typical MG based on the coordination of hybrid energy storage and heat pump air-conditioning systems using fuzzy control theory. An optimal operation for an MG including several renewable resources and PHS considering DR is investigated with a mixed-integer nonlinear programming solver in [16].
In [17], a stochastic-based scheduling method for MGs encompassing electric vehicles and storage systems was developed. This model considers AC/DC systems and highlights the interaction of on-board batteries with other components in the grid. Likewise, a multiagent energy management strategy for isolated MGs was developed in [18]. The mathematical model is based on the primal-dual method of multipliers to make the tool distributed and alleviate the computational cost of the optimization framework. An interval-based scheduling model was presented in [19] for MGs encompassing batteries, PHS units and DR initiatives. In this model, uncertainties from energy prices and renewable sources are modeled using a novel interval formulation that accounts for confidence intervals in forecasts. In [20], a hybrid robust methodology was proposed for multienergy MGs, including different vehicles, hydrogen, gas and electric subsystems. This model considers different uncertain models for each uncertain parameter involved.
As deduced from the literature above, literature regarding energy management in MGs is rich. However, most of the existing literature normally copes with only one type of storage technology. In addition, when different storage facilities are considered, optimal coordination among them is ignored or oversimplified. This is a simplistic assumption that disregards the different characteristics of each type of storage technology. For example, if a storage unit is devoted to long-term energy storage, it should be coordinated with batteries accordingly, which are normally focused on short-term energy storage. This paper tackles this issue by proposing a novel stochastic mixed-integer-linear-logical programming model for optimal scheduling of isolated MGs that comprises batteries and PHS systems (we choose these technologies because of their complemented features). In contrast to other papers, coordination among storage technologies is explicitly incorporated into the mathematical model by including a logical-based routine that considers the particularities of each storage technology. Various types of DR programs are also considered, and a benchmark case study is analyzed to validate the developed model and explore the effect of DR initiatives. As a major advantage of the developed methodology, it is worth mentioning its versatility, being easily adaptable to different layouts incorporating other storage technologies (e.g., hydrogen-based units). In addition, the mathematical problem is formulated as mixed-integer-linear programming (MILP), which ensures the global optimum reachability [21]. Lastly, a simple stochastic-based model is presented to easily incorporate uncertainties into the problem.
In the rest of this paper, Section 2 describes the isolated system under study. Section 3 presents the stochastic optimal scheduling modeling for the considered MG. Section 4 develops the mixed-integer-linear-logical programming model for optimal coordination of batteries and PHS. 
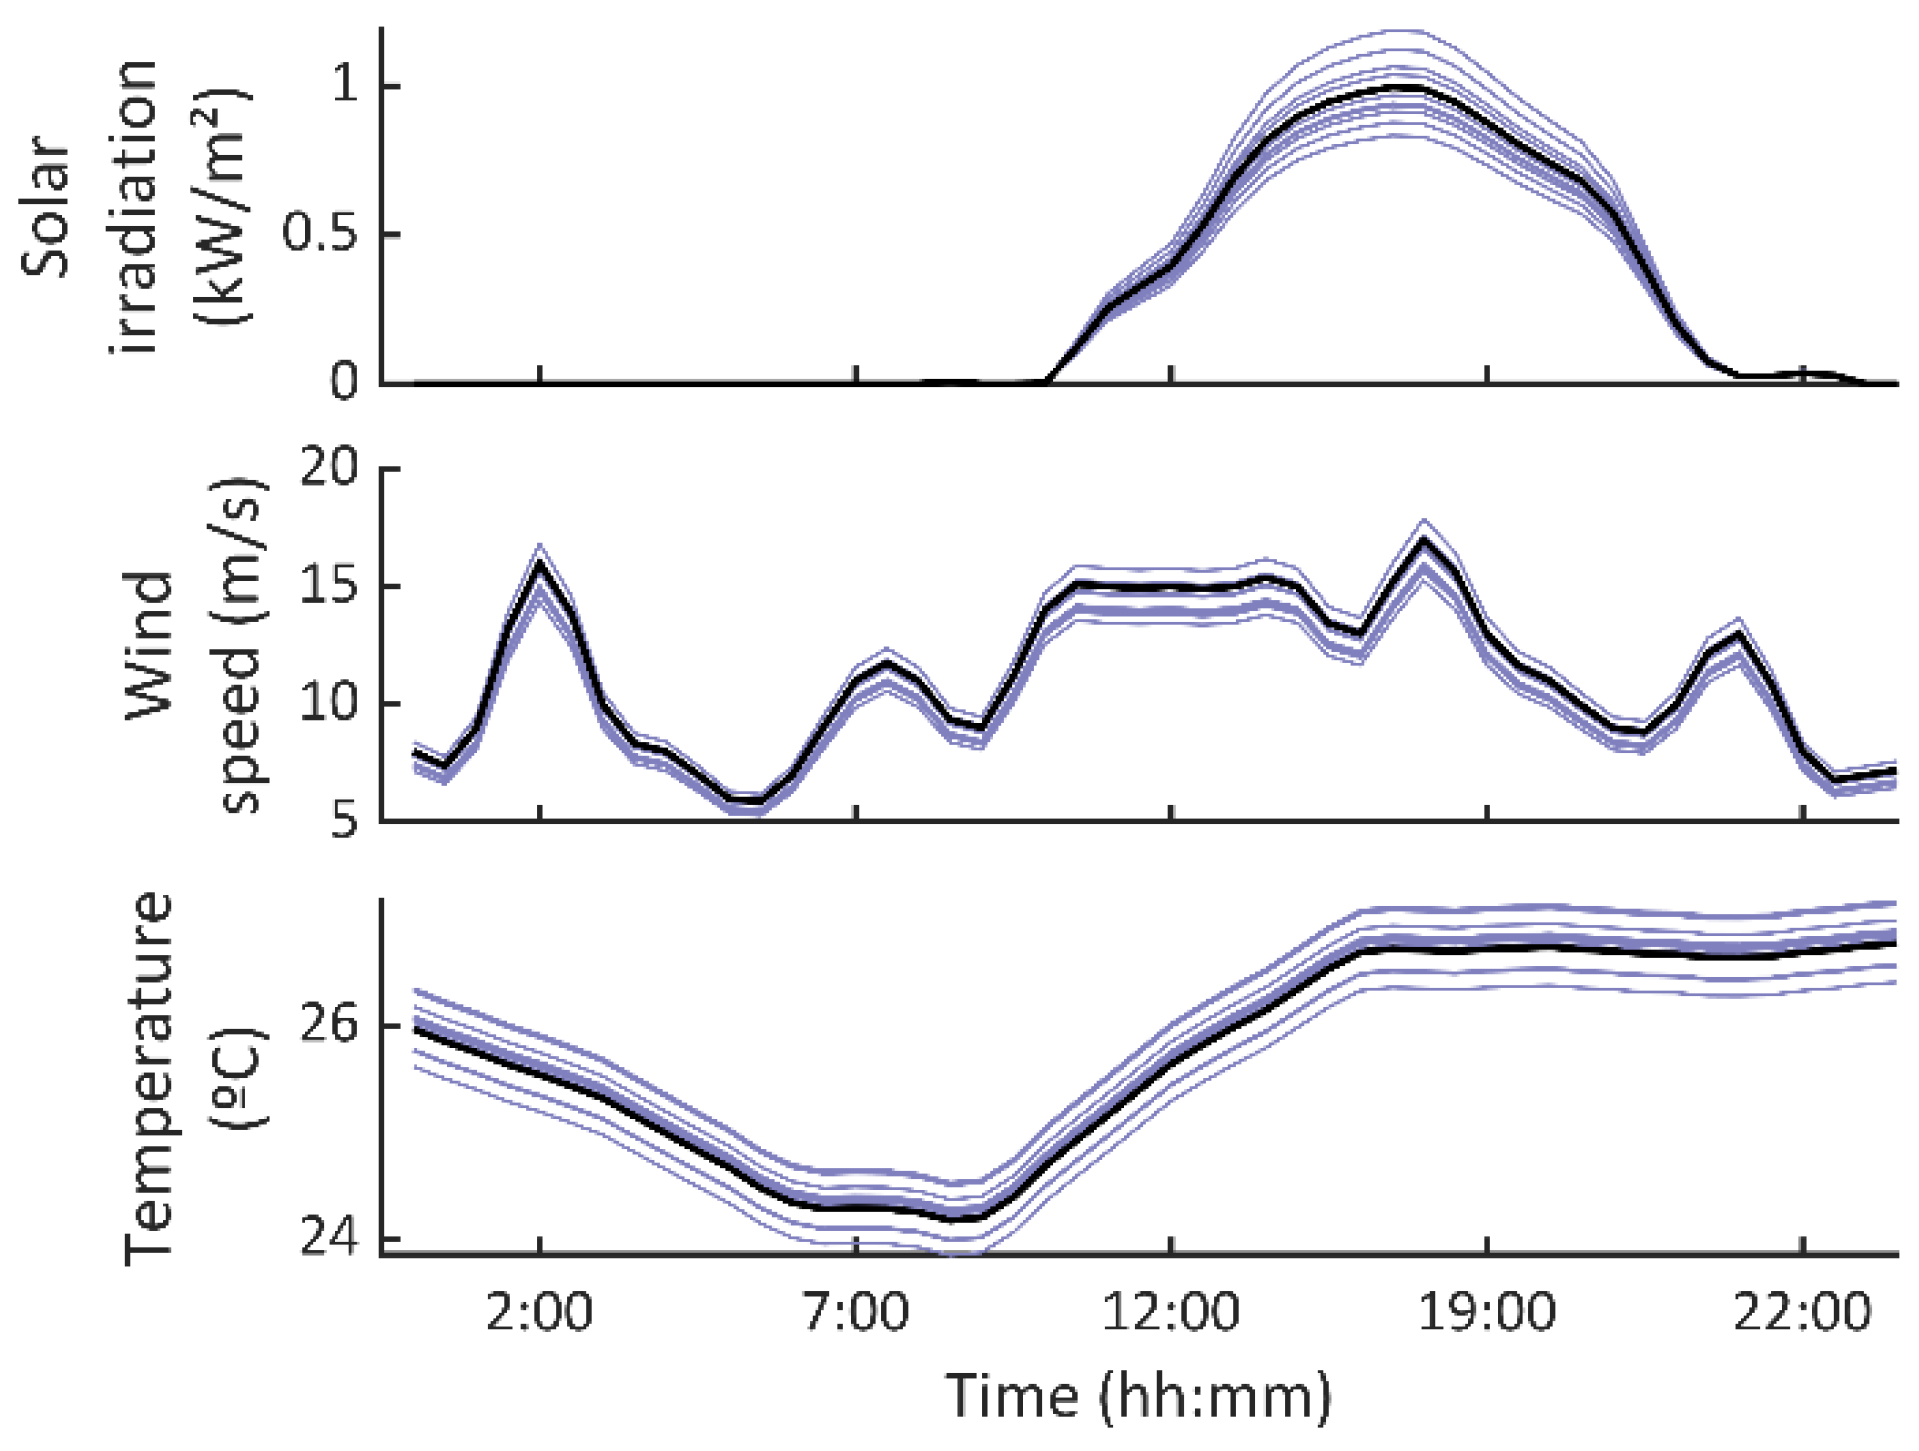
Section 5 describes the stochastic framework for uncertainties modeling. Section 6 presents a case study and various numerical results. The paper is concluded with Section 7.

2. Description of the Isolated mg under Study

Figure 1 schematically describes the isolated MG under study. Its electrical demand can be supplied from either renewable sources (PV and WG in our case) or backup generators (DEG in this paper). A ‘green’ hybrid storage system is included, comprising PHS and BES. These storage facilities can handle with eventual surplus energy from renewable sources. Therefore, this excess of energy is stored to be later exploited for reducing the dependency of the diesel generation.
It is assumed that the system under study is operated under some DR programs. We consider that electrical demand shows a certain degree of flexibility on the basis of price-based signals. This way, the MG operator could force some consumers to change their consumption patterns by pursuing a more economic operation of the MG, establishing compensatory payments as counterpart. Three kinds of DR programs are considered, which are described below:
  • Curtailing agreements: it is assumed that most local loads are subjected to curtail agreements with the MG operator. This way, these consumers may eventually reduce their consumption, obtaining a price-per-kWh reduced as compensatory payment.
  • Shedding agreements: this kind of consumer may be directly shut down if the MG operator considers it. These kinds of agreements are typical of great loads, such as industries. In compensation, these consumers obtain a price-per-hour-that-they-are-disconnected.
  • Energy agreements: these consumers require a certain amount of energy for their correct operation or demand satisfaction. In contrast to the curtailable loads, the users subjected to these kinds of agreements could shift their consumption whenever the MG operator determines; this way, their response is similar to shiftable consumers [22]. However, if their energy target is not satisfied, they obtain a price-per-kWh that is not satisfying. These kinds of agreements could thus be attractive, e.g., for vehicle recharging stations.
The scheduling task of the MG described above is performed over a day-ahead horizon. Therefore, the MG operator obtains weather and demand forecast information during the current day. On the basis of this information, the scheduling plan for the following day is determined. Scheduling orders are transferred to the different storage, demands and backup generators to be properly performed through the day ahead. This operational principle is illustrated in Figure 2.

3. Mathematical Models

In this section, the mathematical formulation of the day-ahead scheduling task described in Figure 2 is presented. This optimization problem is formulated from the operator point of view, who presumably aims at minimizing the operating cost of the MG.

3.1. Objective Function including DR Programs

The daily operational cost of the MG described in Section 2 is given by the Equation (1). This expression reflects the expected operation cost over the representative scenario space .
f = r { ω r · [ ( f r DEG + f r K + f r OM ) + s S { f r | s Sh } + e { f r | e ES } ] }
The Equation (1) yields the expected daily cost from a stochastic perspective by introducing the probability of occurrence of each scenario ω [23,24]. This way, the objective function considers different scenario realizations weighted by their probability of occurrence, thus allowing one to include uncertainties in a simple way. The expression (1) encompasses various costs. The term f r DEG stands for the DEG operation, maintenance and fuel costs, which can be expressed as a quadratic function of the delivered power, as follows [25]:
f r DEG = t T { τ · [ u r | t DEG · a DEG + p r | t DEG · b DEG + ( p r | t DEG ) 2 · c DEG ] } ;   r
In this case, quadratic variables in (2) are linearized using piecewise representations (see Appendix A). For simplicity, it is assumed that all the consumers in the MG are subjected to DR agreements. Therefore, those users that have not agreed to shiftable or energy contracts with the local energy entity are assumed to be operated under curtailable initiatives. Thus, the term f r K quantifies the payments in which the MG incurs due to curtailed demand. As commented, these kinds of users are compensated by a price-per-kWh that is reduced, as noted in the Equation (3).
f r K = τ · ϱ K · t T { p r | t K } ;   r
In this paper, curtailed load is treated as an independent generator with delivered power p K whose limits are coherently fixed by the constraint (4).
0 p r | t K p r | t LD ;   r t T
The operational and maintenance costs of the different components are expressed in (1) by the term f r OM and calculated as follows:
f r OM = t T { τ ·   [ i { PV , WG } { μ i · p r | t i } + μ BES · i { ch , dch } { ( p r | t BES , i ) 2 } + i { pump , turb } { μ PHS · p r | t PHS , i + σ PHS · ( on r | t PHS , i + off r | t PHS , i ) } ] } ;   r
In (5), the operation and maintenance expenditures are proportional to the total energy produced in PV and WG [26]. In the case of BES, degradation costs can be considered proportional to the square of the energy exchanged with the grid [27], being linearized using piecewise functions (see Appendix A). For the PHS, together with the conventional maintenance expenditures, the start-up and shutdown costs are also included [14].
The remainder terms in (1) make mention of the costs due to application of shedding and energy DR programs, as explained in Section 2. For shedding agreements, these payments are given for the total hours that a consumer is disconnected, whereas for energy users, users are compensated by the total non-satisfied energy. Thus, the costs of these DR programs are calculated by (6) and (7) for the consumers subjected to shedding and energy agreements, respectively.
f r | s Sh = κ s · τ · t T { size ( T ) u r | t s } ;   r s S
f r | e ES = ϱ e · ( E e τ · t T { p r | t e } ) ;   r e

3.2. Power Balance

The constraint (8) ensures the power balance in the MG under study for each representative scenario, including the effect of applying DR programs.
p r | t DEG + p r | t PV + p r | t WG + p r | t BES , dch + p r | t PHS , turb + p r | t K = p r | t LD + p r | t BES , ch + p r | t PHS , pump + s S { u r | t s · p r | t s } + e { p r | t e } ;   r t T

3.3. DEG Modeling

DEG can be represented by its minimum/maximum dispatchable powers and ramp limitations [26,28], as noted in (9) and (10), respectively.
u r | t DEG · p _ DEG p r | t DEG u r | t DEG · p ¯ DEG ;   r t T
p r | t 1 DEG R DEG p r | t DEG p r | t 1 DEG + R DEG ;   r t T \ t > 1

3.4. PV Modeling

Instantaneous PV potential is determined by weather parameters, more precisely, by solar irradiance and ambient temperature [28]. In this work, it is assumed that these parameters can be forecasted with sufficient accuracy, which is a plausible assumption [20]. Once these parameters are available, PV potential can be calculated as follows [28]:
ϕ r | t PV = p ¯ PV · [ 0.25 · ϑ r | t + 0.03 · ϑ r | t · θ r | t + ( 1.01 1.13 · η PV ) · ( ϑ r | t ) 2 ] ;   r t T
As commented in [28], the expression (11) should not be directly applied since it could eventually yield a PV potential higher than the installed capacity. In practice, inverters impose limits on the maximum power that a PV unit can deliver in order to avoid fast degradation of components. In this sense, (12) is imposed to avoid unrealistic results.
0 p r | t PV { 1.1 · p ¯ PV ,   if   ϕ r | t PV > 1.1 · p ¯ PV ϕ r | t PV ,   o . w . ;   r t T
In (12), overloads of 10% are allowed, which is quite usual in commercial inverters [29]. It is worth noting that the power given by the PV plant at any instant is declared as an optimization variable rather than a parameter. This is because the power delivered by PV units may be eventually fixed lower than the solar potential [23]. This situation eventually occurs when full PV potential cannot be delivered to consumers or storage systems. On the face of this situation, surplus energy has to be dissipated in dumped loads [30].

3.5. WG Modeling

Wind potential can be calculated as a function of wind speed using the so-called wind-power curves [26]. In practice, this model is nonlinear and determines the relationship between the wind speed and the power given by a wind turbine. Normally, these curves are divided in various segments delimited by characteristics of wind speed values, for which the relation between power and speed changes. One common expression for this kind of relationship is given by (13) [26].
ϕ r | t WG = { 0 ,   if   γ r | t < γ _ WG α · ( γ r | t ) 3 β · p ¯ WG ,   if   γ _ WG γ r | t γ WG , rat p ¯ WG ,   if   γ WG , rat < γ r | t γ ¯ WG 0 ,   if   γ r | t > γ ¯ WG ;   r t T
where γ WG , rat is the rated wind speed, whose value is typically facilitated by manufacturers. As in the case of the PV array, wind generation could be dispatched below the valued yielded by (13). However, it is not necessarily imposing additional bounds, due to the fact that the maximum value of (13) coincides with the rated power of the wind turbine. Therefore, it is just necessary to declare the constraint (14), which includes the operational efficiency.
0 p r | t WT η WG · ϕ r | t WG ;   r t T

3.6. BES Modeling

For grid-scale applications, Lithium-ion (Li-ion) and Sodium-Sulfur (NaS) technologies are recognised as the most suitable, eco-friendly and cost-effective solutions for battery storage applications [31]. The energy-to-power ratio of these technologies typically ranges from 2 to 4 h [32], which limits their available power range, as stated in the constraint (15) [33], while (16) avoids simultaneous charging/discharging of the BES.
0 p r | t BES , i u r | t BES , i · ε ¯ BES e 2 P ;   r t T i { ch , dch }
i { ch , dch } { u r | t BES , i } 1 ;   r t T
Equation (17) models the state of charge of the BES. Note that self-discharge effect has been neglected, as is usual for Li-ion and NaS technologies [26,33]. In addition, the efficiency of charging and discharging processes has been assumed to be the same, which is plausible for the considered battery technologies [33]. On the other hand, (18) limits the energy stored in the BES by the nominal capacity and the depth-of-discharge settings.
ε r | t BES = ε r | t 1 BES + τ · ( η BES · p r | t BES , ch p r | t BES , dch η BES ) ;   r t T \ t > 1
( 1 DOD ) · ε ¯ BES ε r | t BES ε ¯ BES ;   r t T
The model (17) is not defined for t = 1 ; therefore, it is necessary to fix the state of charge of the BES at this time instant. In this work, as is customary (e.g., see [26]), we assume that the batteries are totally charged at t = 1 . For coherency, the state of charge at the end of the time horizon is forced to be 100%. Under these premises, the BES model is completed by the constraint (19).
ε r | t = 1 BES = ε r | t = size ( T ) BES = ε ¯ BES ;   r

3.7. PHS Modeling

In PHS systems, water inflow determines power imports and exports as a function of the gravity acceleration, net head and water density, as stated in (20) and (21) for the pumping and turbine processes, respectively [34].
p r | t PHS , turb = g · H · ρ · q r | t PHS , turb · η PHS 1000 ;   r t T
p r | t PHS , pump = g · H · ρ · q r | t PHS , pump 1000 · η PHS ;   r t T
Conventionally, PHS units can be operated within a range delimited by maximum and minimum rate flows, as reflected in the constraint (22). As in the case of the BES, the PHS cannot be operated in turbine and pumping modes simultaneously, which is ensured by imposing the constraint (23). On the other hand, (24) reflects coherency among the binary variables associated with the PHS operation, which is essential for properly calculating the start-up and shutdown costs in (1).
u r | t PHS , i · q _ PHS q r | t PHS , i u r | t PHS , i · q ¯ PHS ;   r t T i { pump , turb }
i { pump , turb } { u r | t PHS , i } 1 ;   r t T
on t PHS , i off t PHS , i = u t PHS , i u t 1 PHS , i ;   t T \ t > 1 i { pump , turb }
The total water volume stored in upper and lower reservoirs is calculated by (25) and (26), respectively. These models determine the instantaneous volume stored in both reservoirs as a function of the water volume in the previous time step and the flow balance that occurred at time t . The Equation (27) models the total capacity of reservoirs. For simplicity, we assume that both reservoirs are identical, and their bounds are thus similarly defined.
v r | t Upper = v r | t 1 Upper + 3600 · τ ( q r | t PHS , pump q r | t PHS , turb ) ;   r t T \ t > 1
v r | t Lower = v r | t 1 Lower + 3600 · τ ( q r | t PHS , turb q r | t PHS , pump ) ;   r t T \ t > 1
v _ PHS v r | t i v ¯ PHS ;   r t T i { Upper , Lower }
As in the case of the BES, the models (25) and (26) are not defined for t = 1 ; therefore, the amount of water stored in each reservoir at the beginning of the time horizon has to be defined. In our case, we consider that the upper reservoir is completely filled at the beginning of the time horizon, as noted in (28). As both reservoirs have the same capacity, the lower reservoir is considered to be empty at t = 1 , as ensured by imposing the constraint (29). To keep the model coherent, the expressions (28) and (29) force the final state of both reservoirs to be equal to their initial status. The PHS modeling is completed by the ramp constraints (30).
v r | t = 1 Upper = v r | t = size ( T ) Upper = v ¯ PHS ;   r
v r | t = 1 Lower = v r | t = size ( T ) Lower = v _ PHS ;   r
p r | t 1 PHS , i R PHS p r | t PHS , i p r | t 1 PHS , i + R PHS ;   r t T \ t > 1 i { pump , turb }

3.8. Consumers Subjected to Energy Agreements

It is realistic to assume that instantaneous power supplied to consumers subjected to energy agreements must be limited because of either contractual limits or equipment rate values, which is ensured by (31). The energy users aim at receiving a certain amount of energy over the time horizon, which is presumably fixed by contractual conditions. However, they cannot receive more energy than that agreed with the MG operator. By this reason and to avoid incoherency in (7), the constraint (32) has to be included in the model.
0 p r | t e p ¯ e ; r t T e
τ · t T { p r | t e } E e ; r e  

3.9. MG Scheduling Problem Statement

The optimal scheduling task for the MG described in Section 2 aims at operating the system at minimum cost. Therefore, the objective function for this problem consists of minimizing the operating cost defined in (1). On the other hand, the operational constraints (8)–(32) must be satisfied at any moment.

4. Mixed-Integer-Logical Programming Model for Optimal Coordination of PHS and BES

Combining various energy storage technologies may be a good alternative to exploit the advantages of the different storage systems and circumvent their weaknesses [35]. The MG under study provides ‘green’ energy storage by means of BES and PHS. Batteries are able to provide an efficient, fast response; however, their storage capacity is normally limited by expensive components or environmental concerns [36]. In this sense, PHS may effectively complement BES due to the fact that this technology is able to provide large, cost-effective storage capacity. However, its charging–discharging cycle is notably less efficient compared with batteries [34].
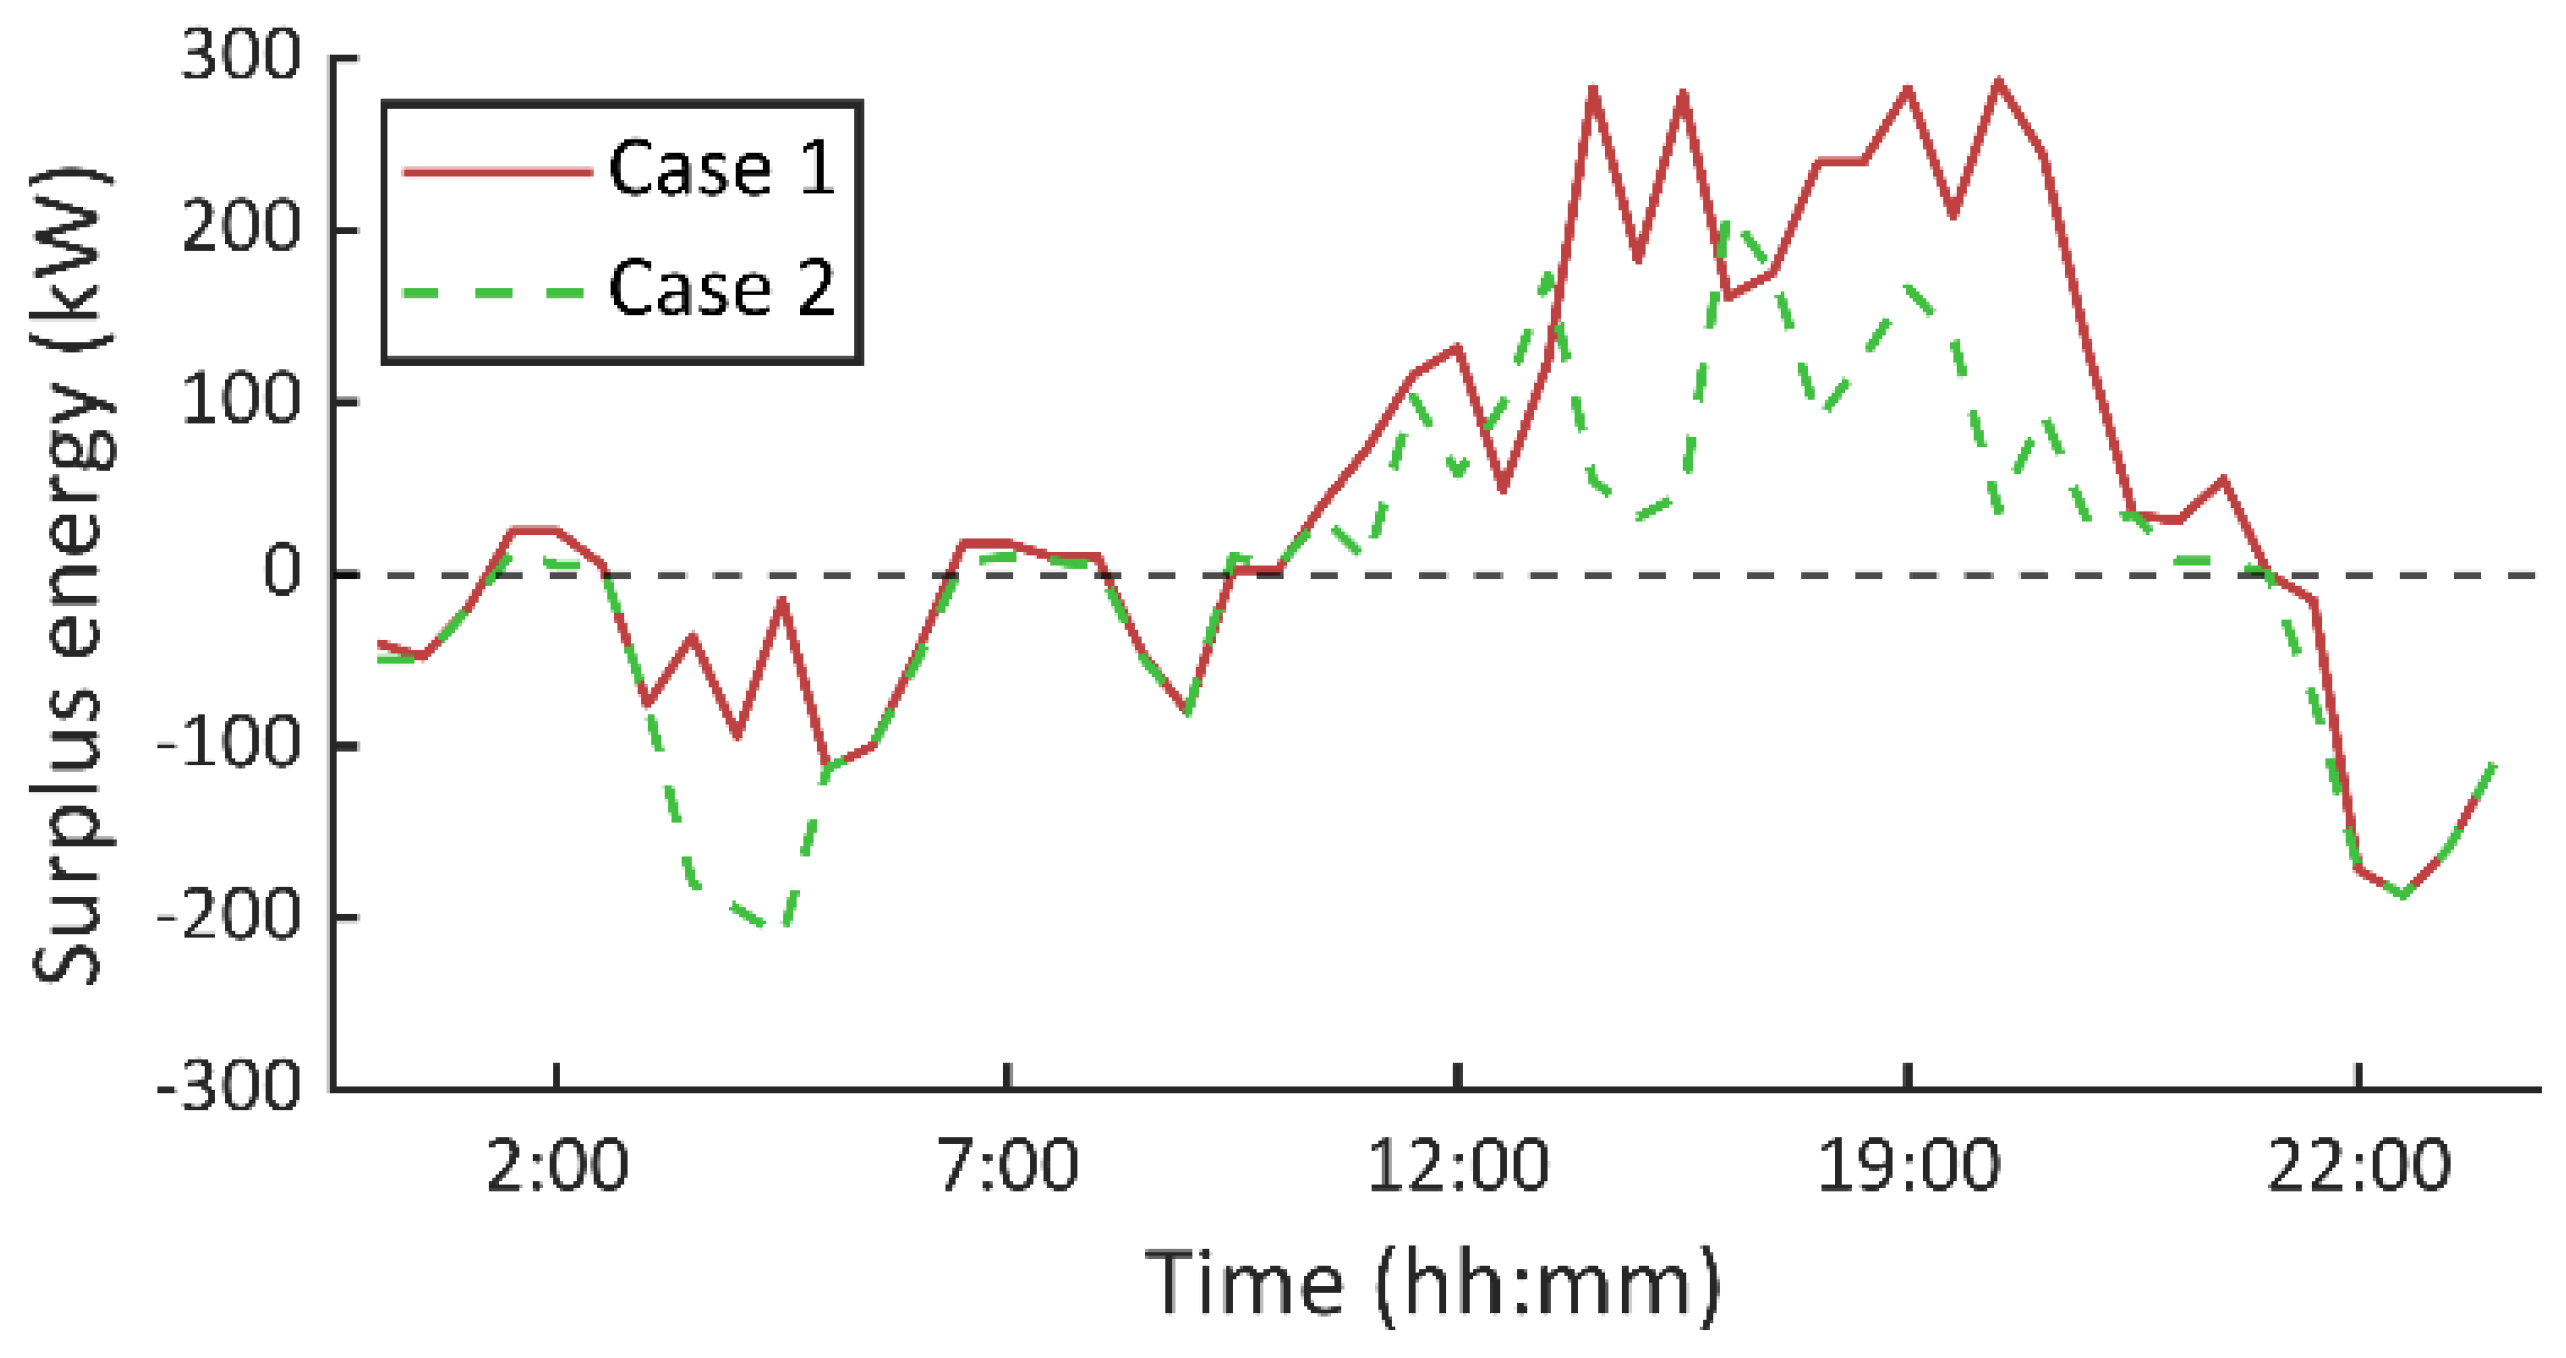
To optimally exploit different storage technologies, they should be operated in a coordinated way. In addition, the green-oriented character of the storage system in the MG under study should not be ignored, i.e., only surplus energy from renewable sources must be stored. For the MG under study, we propose a coordination scheme for BES and PHS based on the following logical rules:
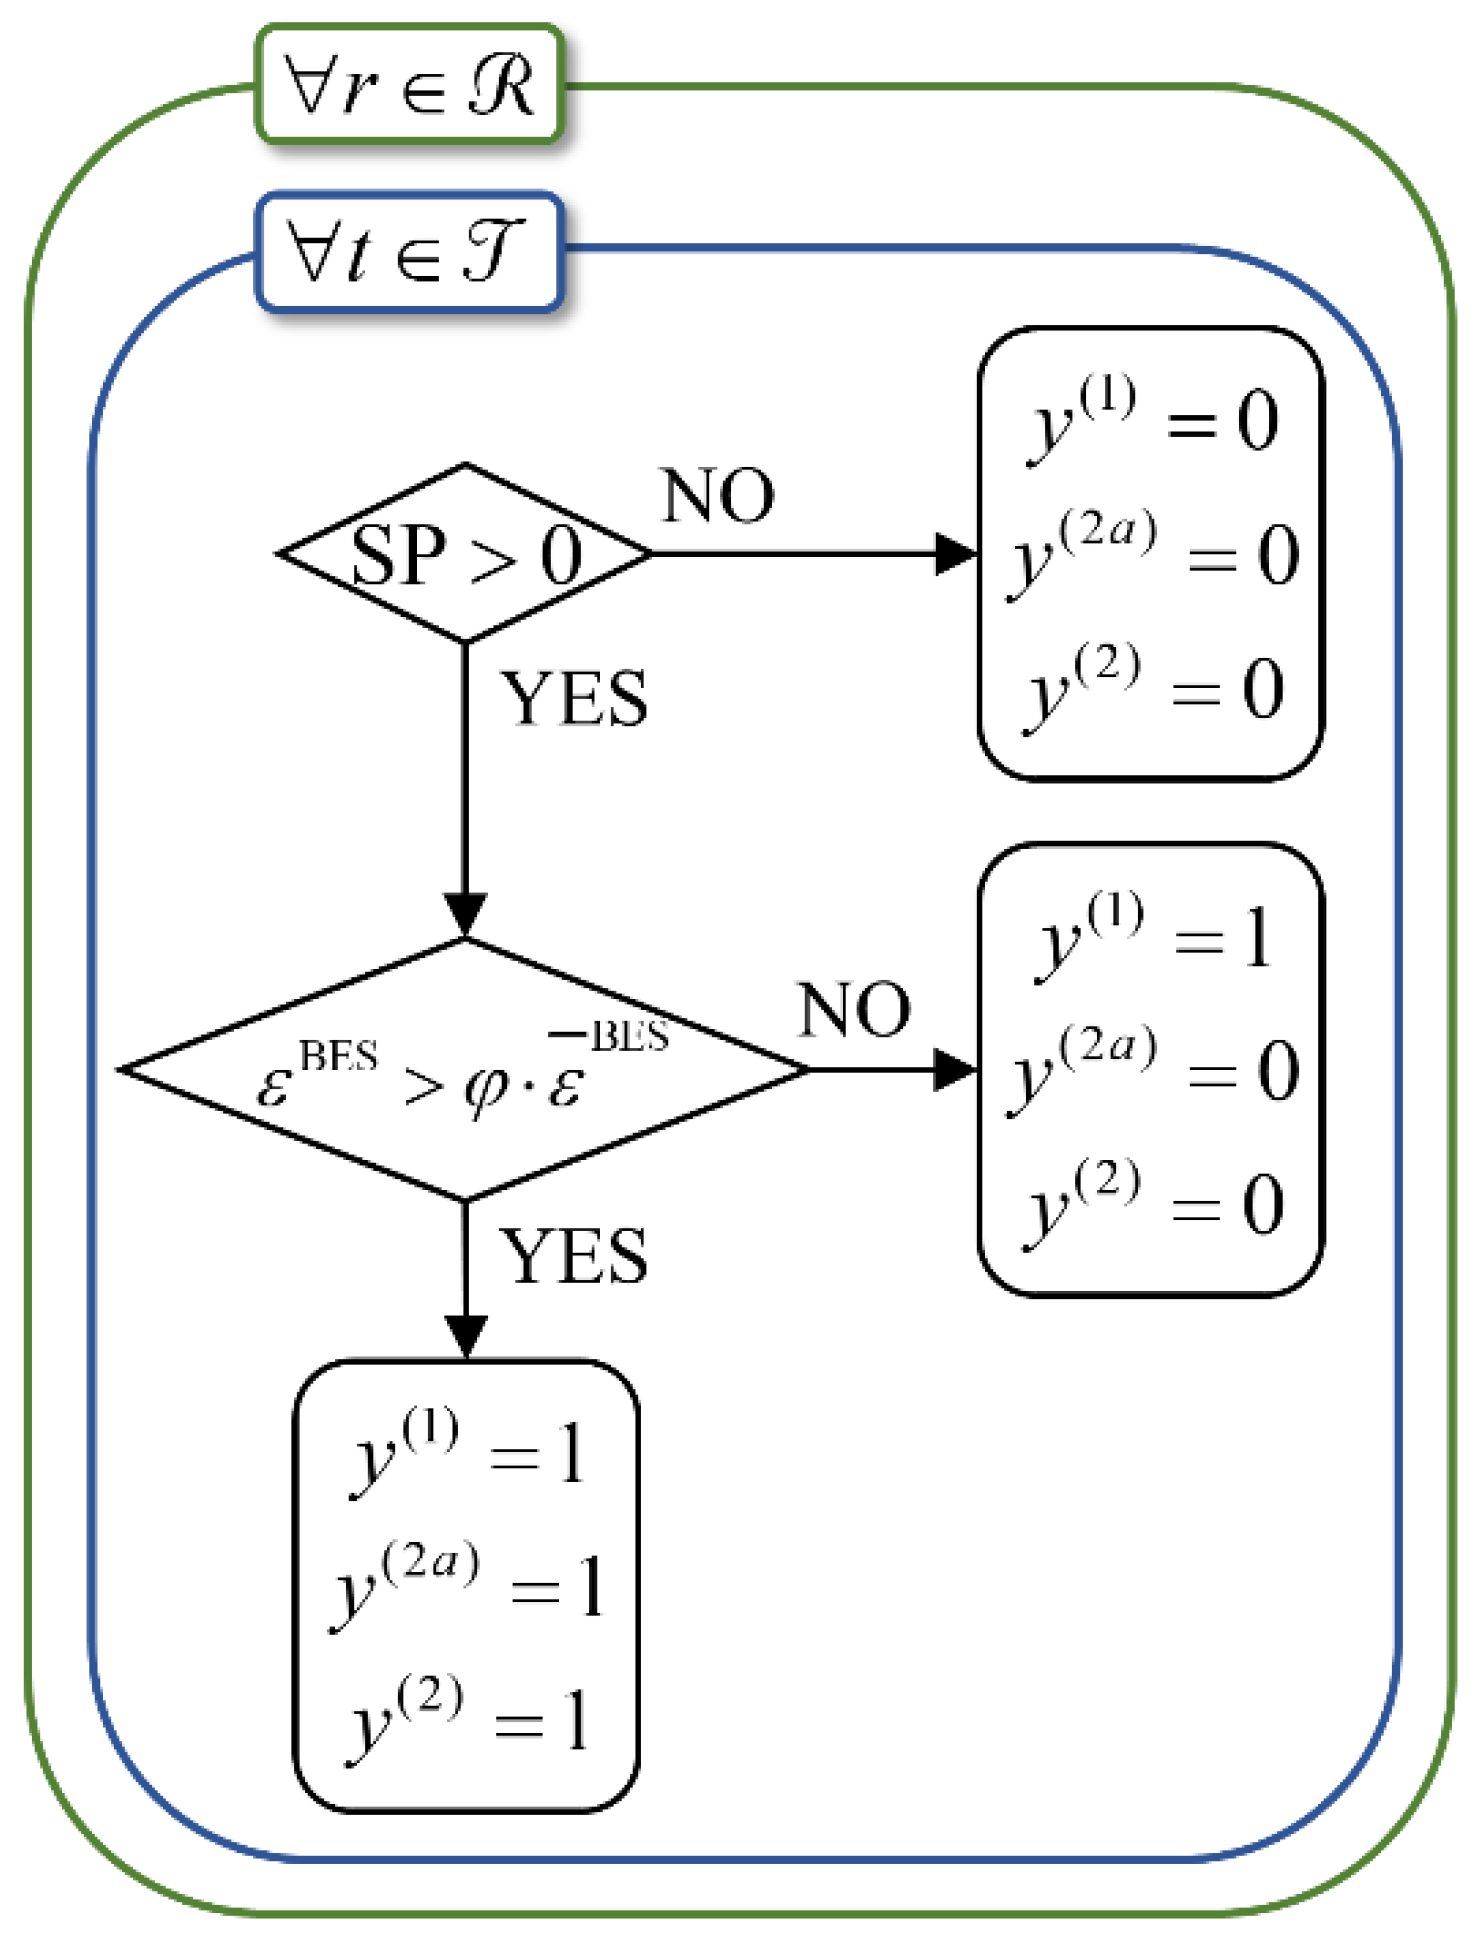
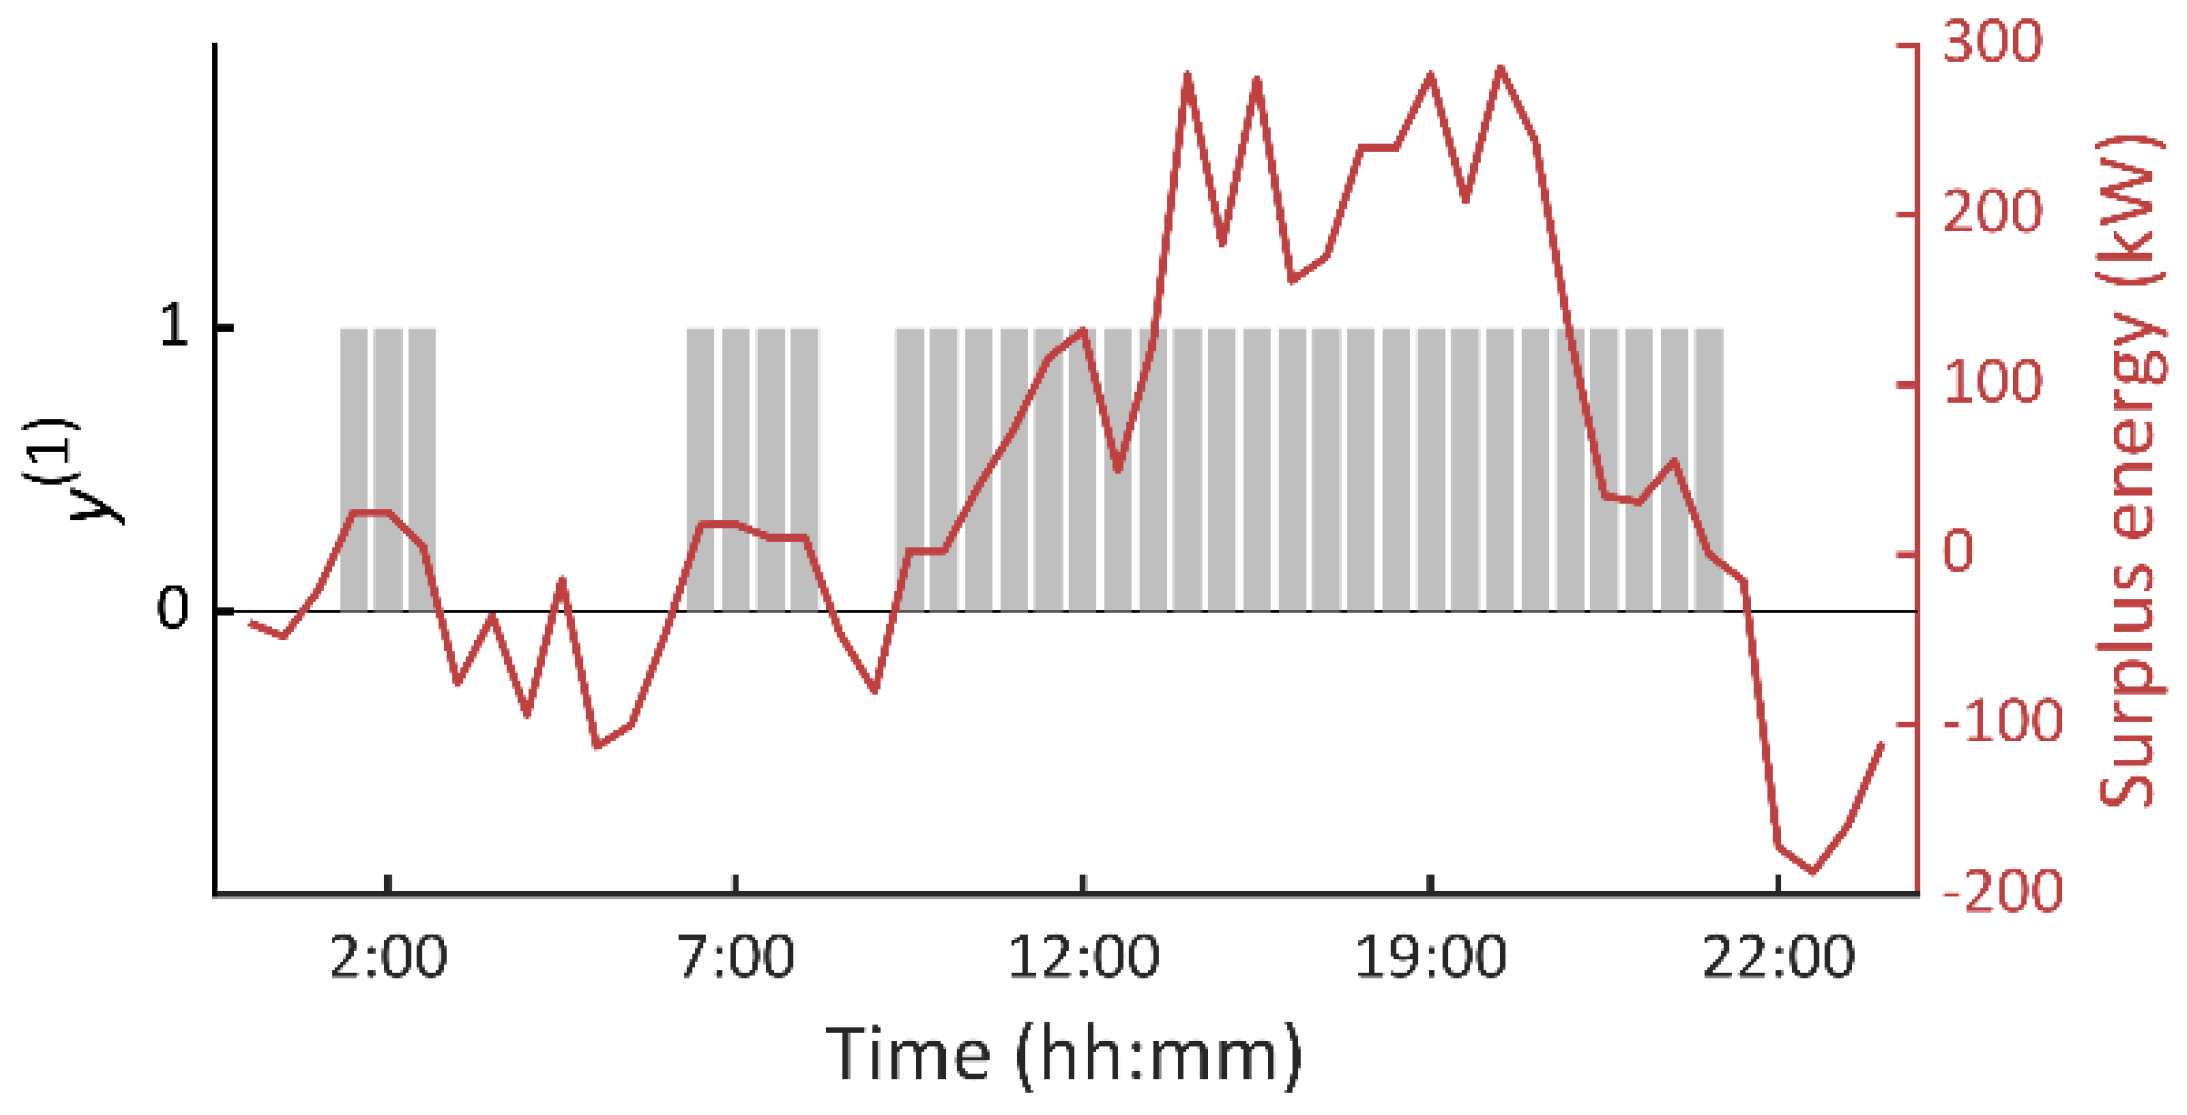
  • Since the proposed storage system is green-oriented, it can be only charged when surplus energy is produced from renewable sources. It means that only when the net demand is greater than zero, the charging processes of the storage systems are enabled.
  • Due to the fact that the BES has a very efficient cycle in comparison with PHS, batteries should be scheduled primarily, in detriment of the PHS system. In this sense, on face of eventual surplus renewable energy generation, the batteries should be charged first, giving them priority w.r.t. the PHS.
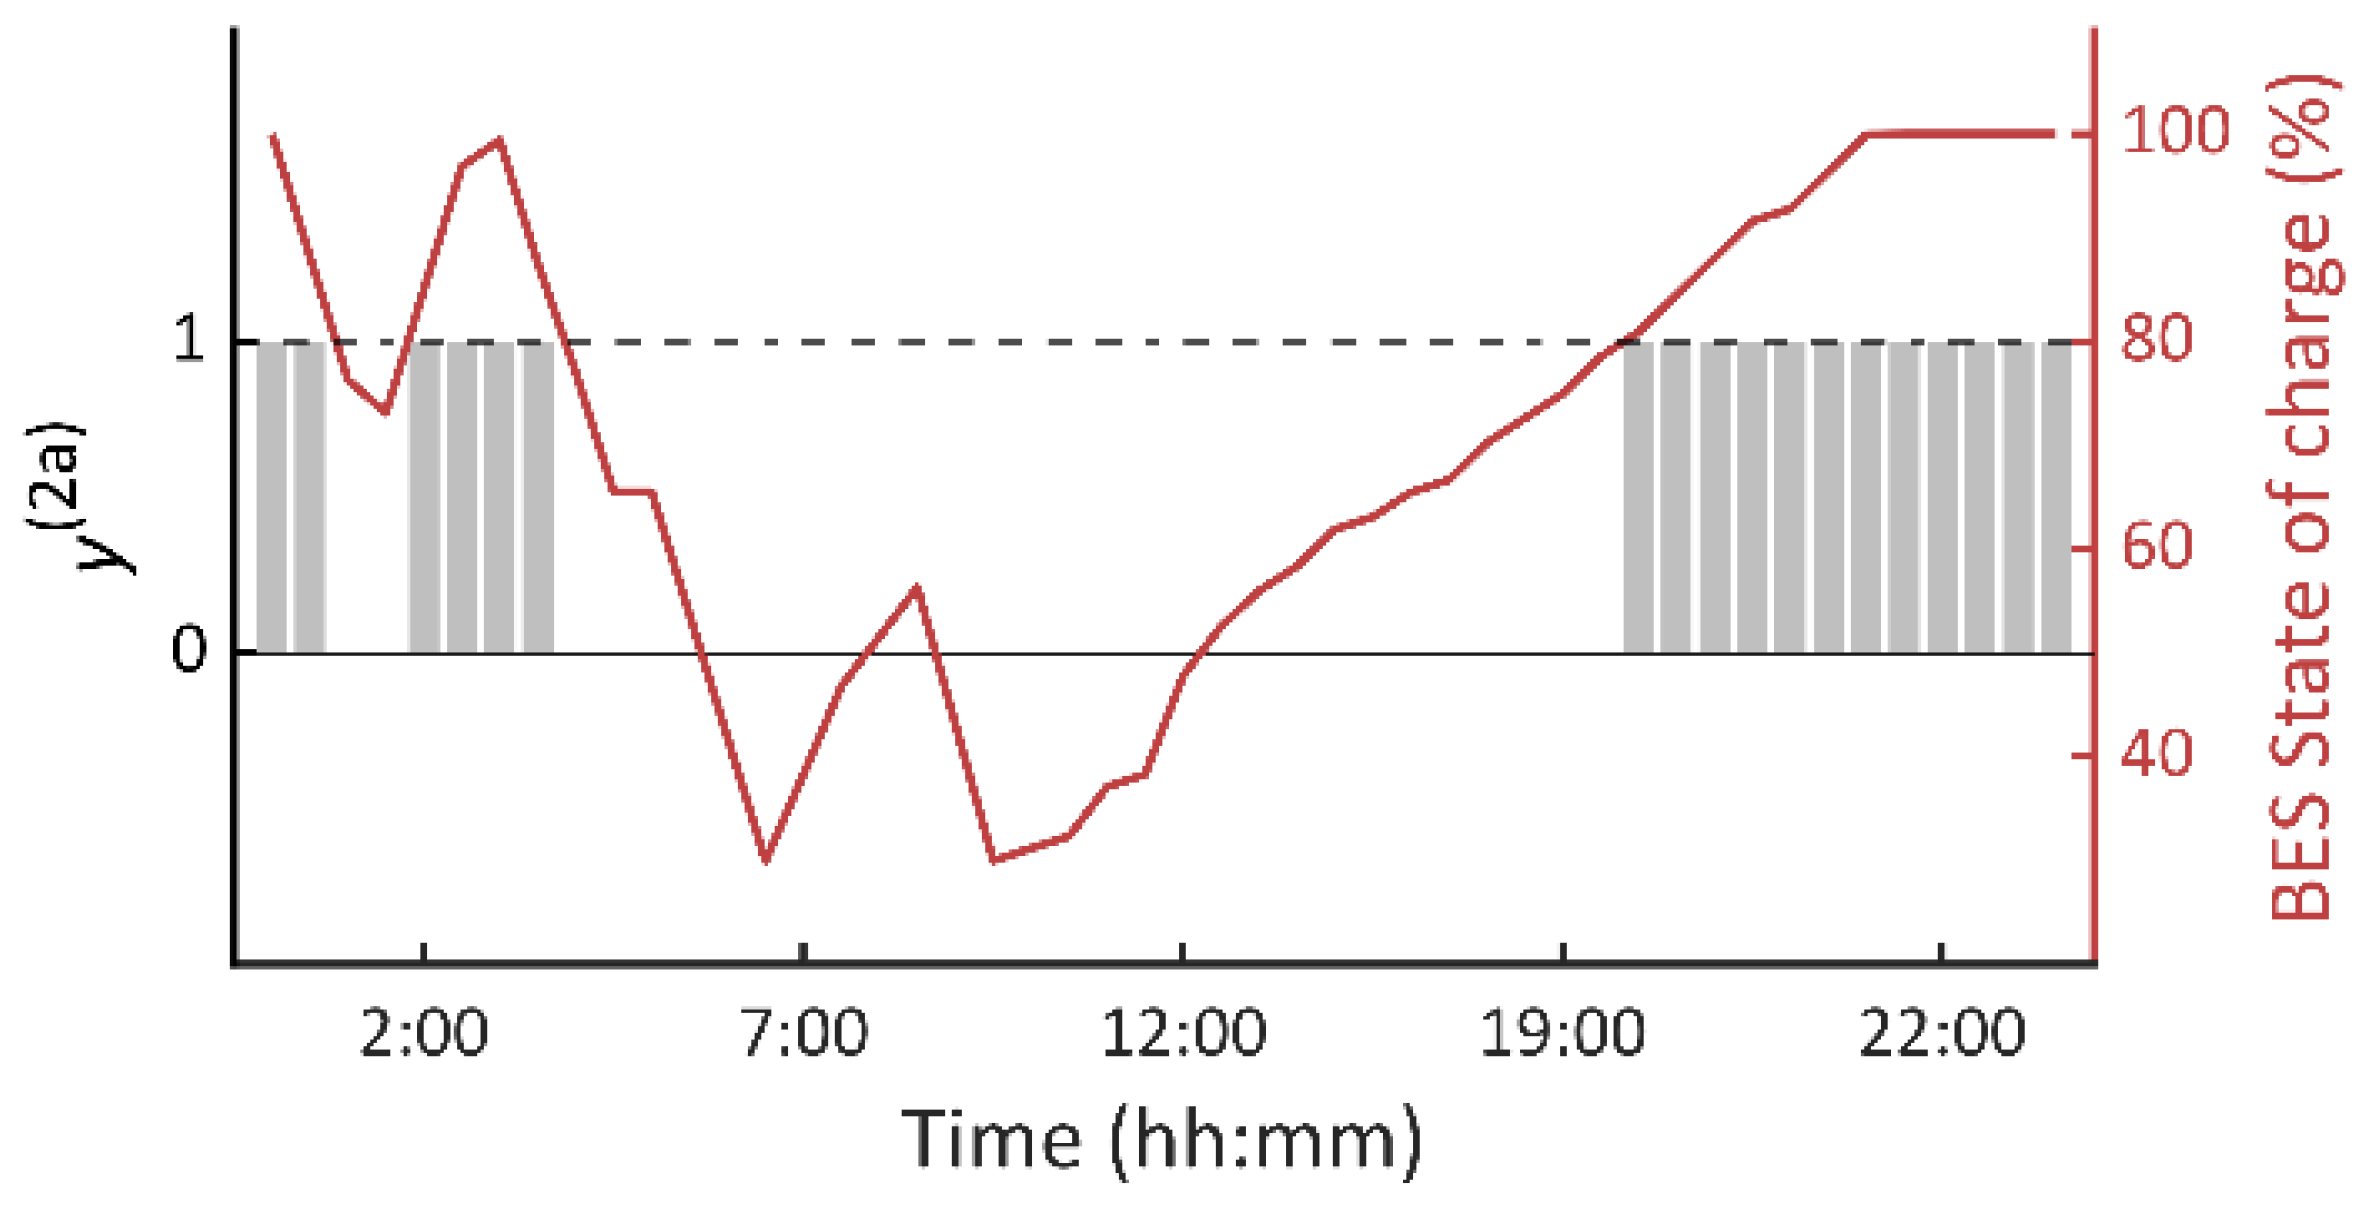
  • Charging (pumping) mode of the PHS should only be enabled when the state of charge of the BES is higher than a preset threshold ( φ ), which means that batteries are sufficiently charged. It means that batteries are unable to store much more energy and, therefore, additional storage capacity is needed. Under these circumstances, the PHS system is scheduled to pump water to the upper reservoir and thus exploit the remaining energy produced by renewable sources.
The coordination scheme proposed above is normally ignored in other works. One of the main contributions of the present methodology is that it considers them by means of logical rules that can be integrated within the mathematical model developed in Section 3. As result, the original MILP model is extended to a mixed-integer-linear-logical framework that integrates the rules above as additional constraints. This mathematical model encompasses a set of binary variables that are equal to 1 when some of the rules above are satisfied. Table 1 describes the introduced binary variables for logical modeling of the optimal coordination between BES and PHS, while the flowchart in Figure 3 illustrates the relationship between the logical rules and the declared variables. In the following subsection, the mathematical model of the developed mixed-integer-logical programming framework is developed and explained.
For the MG under study, the surplus energy from renewable sources can be calculated as follows.
SP r | t = ϕ r | t PV + ϕ r | t WG p r | t LD s S { u r | t s · p r | t s } e { p r | t e } ;   r t T
Indeed, the Equation (33) says if renewable potential (PV + WG) is higher than the net demand, then (33) is higher than zero and takes negative values otherwise. This logical ‘if’ condition is mathematically represented by
y r | t ( 1 ) = { 1 ,   if   SP r | t > 0 0 ,   o . w . ;   r t T  
To mathematically model the ‘if’ condition (34), we use the ‘big M’ method [32]. This approach consists of introducing a large positive number, namely, M , and a series of additional constraints. More specifically, the condition (34) can be linearized by imposing the constraints (35) and (36).
M · y r | t ( 1 ) SP r | t ;   r t T  
SP r | t M · ( 1 y r | t ( 1 ) ) ;   r t T
As observed, if y ( 1 ) = 1 , then 0 SP M , and, therefore, the equation (33) is taking positive values. In contrast, if y ( 1 ) = 0 , then M SP 0 , and thus, (33) could only take negative values. This way, the condition (34) can be elegantly represented by a simple set of two constraints.
The second logical rule says if surplus renewable energy remains and batteries are sufficiently charged, then pumping mode of the PHS is enabled. This condition is modeled by the variable y ( 2 ) and mathematically represented as follows:
y r | t ( 2 ) = { 1 ,   if   SP r | t > 0   and   ε r | t BES > φ · ε ¯ BES 0 ,   o . w . ;   r t T  
The condition (37) cannot be directly represented by linear constraints since it involves an ‘and’ condition. It is worth noting that the first condition of the ‘and’ statement has been already treated with the variable y ( 1 ) . Hence, we could use the same approach to model the second condition. This way, we introduce the auxiliary variable y ( 2 a ) , which aims at modeling the following ‘if’ condition.
y r | t ( 2 a ) = { 1 ,   ε r | t BES > φ · ε ¯ BES 0 ,   o . w . ;   r t T  
Now, the constraints (39) and (40) are analogous to (36) and (37), but for modeling the condition (38), by using the variable y ( 2 a ) .
M · y r | t ( 2 a ) ε r | t BES φ · ε ¯ BES ;   r t T  
M · ( 1 y r | t ( 2 a ) ) φ · ε ¯ BES ε r | t BES ;   r t T
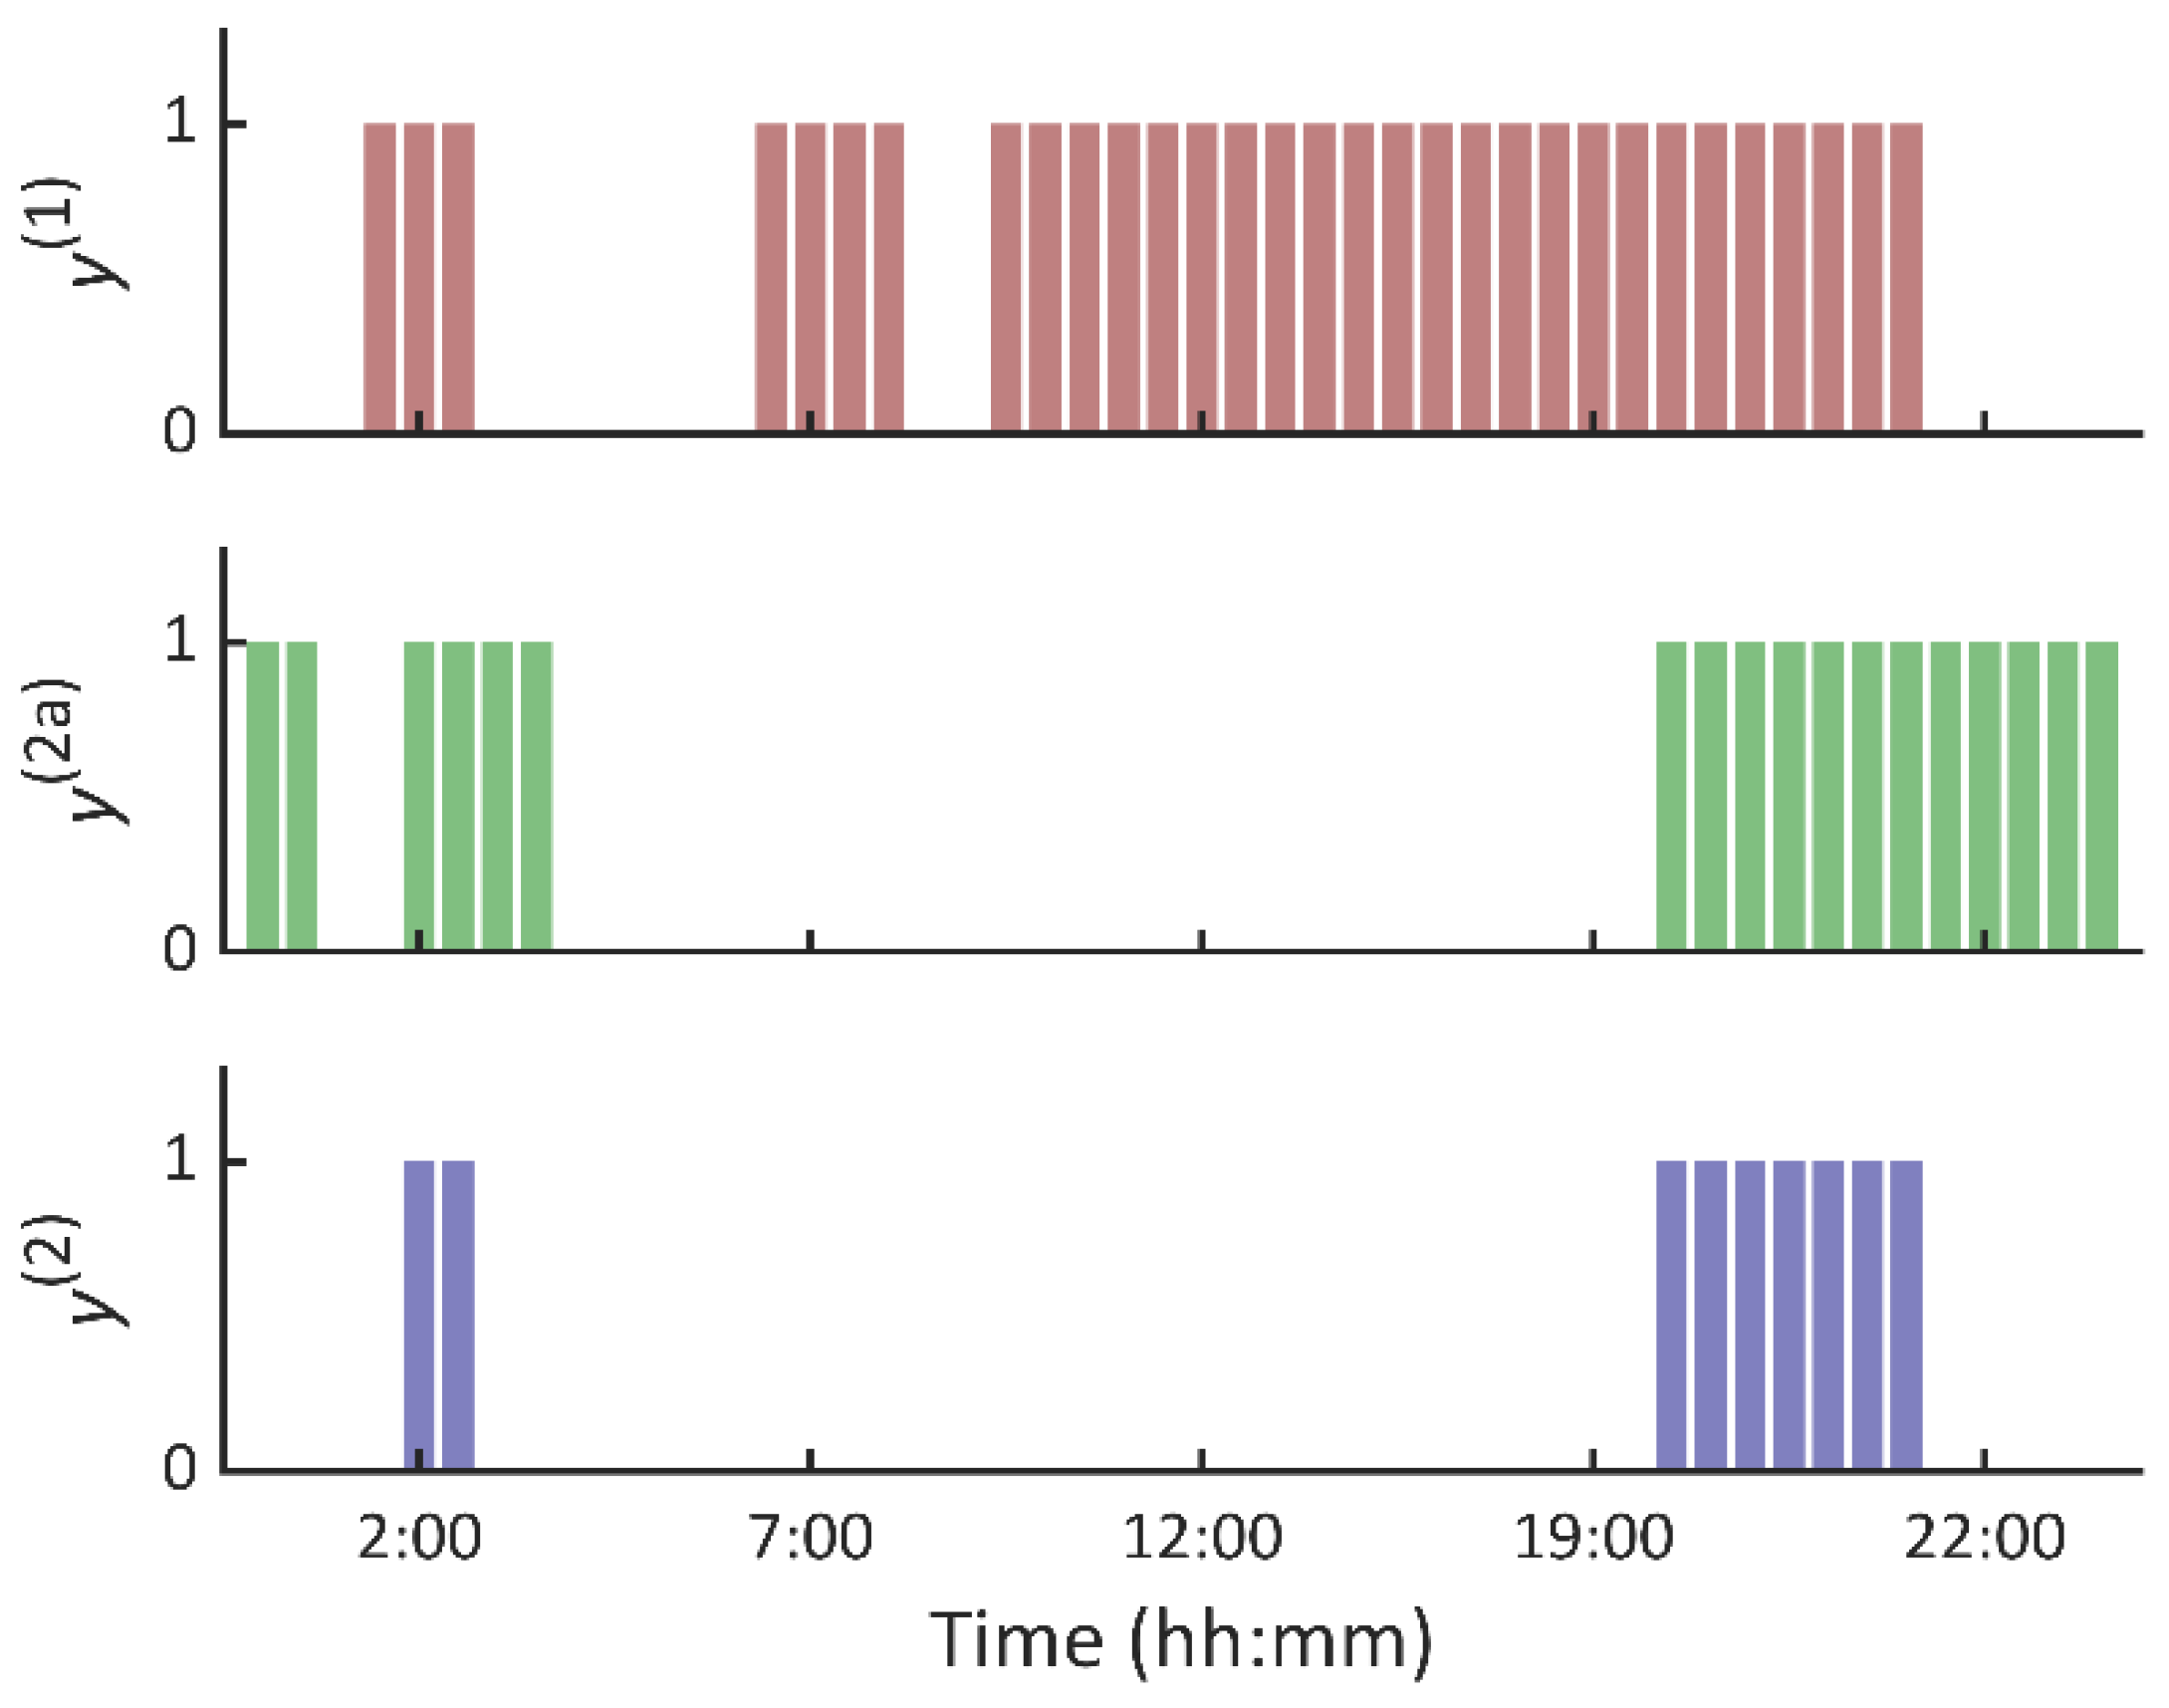
Now, we can easily model the ‘and’ condition in (37) making use of the variables y ( 1 ) and y ( 2 a ) . So, if these variables are equal to 1, then y ( 2 ) is also equal to 1, and 0 otherwise. This condition is linearized by imposing the constraints (41) and (42).
y r | t ( 2 ) y r | t ( 1 ) + y r | t ( 2 a ) 1 ;   r t T
y r | t ( 2 ) y r | t ( 1 ) ,   y r | t ( 2 ) y r | t ( 2 a ) ;   r t T
As seen in (41) and (42), if both y ( 1 ) and y ( 2 a ) are equal to 1, then y ( 2 ) is forced to be equal to 1 as well (the reciprocal can be also easily verified since y ( 2 ) is declared as a binary variable). The model is completed by the constraints (43) and (44), which limits the charging powers of the BES and PHS so that they cannot absorb more energy than the excess produced by renewable generators; this way, the storage system exploited in the studied MG is totally green and only supplied by renewable sources.
p r | t BES , ch y r | t ( 1 ) · SP r | t ;   r t T
p r | t PHS , pump y r | t ( 2 ) · SP r | t ;   r t T
It is worth noting that bi-integer variables appear in (43) and (44), which can be linearized, introducing dummy variables and additional constraints (see Appendix B).
Note that the rules (33)–(44) can be adapted to any other storage technology. In this regard, it is only necessary to change the powers and state-of-charge variables by their corresponding variables related to other technologies. For example, in case of hydrogen-based technologies, the state-of-charge can be replaced by the state-of-pressure [29].

5. Uncertainties Modeling

The mathematical models presented in the previous sections were declared over a so-called representative scenario space (denoted by ). This model allows one to easily incorporate uncertainties via scenarios. To manage with uncertainty of demand and renewable generation, we propose a stochastic paradigm. The scenarios to consider are built on the basis of predicted profiles and assuming Gaussian distribution for the forecast errors. According to the law of the great numbers, random character of a stochastic parameter can be cached by generating a large number of scenarios (normally, 1000 scenarios are considered suitable [37]). However, treatment of this amount of data is computationally expensive and frequently unaffordable. To address this issue, some works use space-reduction techniques [38]. In this paper, we have used the methodology described in [24]. It consists of using the k-medoids clustering technique [26] to only consider the most representative scenarios. This clustering methodology groups a set of raw data into clusters according to the similitude of their members. Then, the whole cluster is represented by a unique member, called medoid, which is actually used in simulations. The total number of clusters can be heuristically determined by observing some indicators such as the Davies–Bouldin index or the total sum of distances [24,39]. The k-medoids method allows one to easily calculate the probability of occurrence of each representative scenario as follows.
ω r = no .   of   elements   in   cluster   r total   no .   of   scenarios ;   r

6. Case Study

In this section, various numerical experiments are carried out on a benchmark isolated MG such as that described in Section 2. The simulations have a twofold purpose: (1) validate the mixed-integer-logical programming developed in Section 4; (2) analyse the impact of DR programs in the operation of the studied MG. To do that, the mathematical model described in Section 4 has been integrated with the optimization problem explained in Section 3 to build a mixed-integer-lineal-logical programming for optimal scheduling of the MG under study with coordination of ‘green’ BES and PHS systems. The resulting optimization problem was run on an Intel® CoreTM i5-9400F 2.90 GHz 8.00 GB RAM personal computer and solved using Gurobi [40] over a 24 h time horizon with 30 min resolution.

6.1. Input Data

Figure 4 plots the forecast weather parameters. These profiles correspond to real observations on 3 May 2016 at the Virgin Islands (U.S.) [41]. The predicted local demand subjected to curtailed agreements is showed in Figure 5 and was built by scaling down the electrical demand at La Palma Island (Spain) on 3 May 2016 [42]. Two consumers subjected to shedding agreements are considered, whose forecasted demand is also plotted in Figure 5. The data in Figure 4 and Figure 5 are the stochastic information that serve as input for the optimization problem. On the basis of these forecast profiles, 1000 scenarios have been generated assuming Gaussian distribution of errors, which have been reduced to 10 representative scenarios following the procedure described in Section 5. The representative profiles are plotted in Figure 4 and Figure 5 alongside their corresponding forecast values. Table 2, Table 3, Table 4, Table 5 and Table 6 report the data of DEG, PV system, WG system, BES system and PHS unit used in simulations, respectively, whereas Table 7 collects the costs associated to DR programs. Lastly, for optimal coordination of BES and PHS, the parameter φ has been set equal to 0.8.

6.2. Model Validation

The first experiments are conducted on validating the mixed-integer-logical programming developed in Section 4. Figure 6 plots the value of the variable y ( 1 ) and the eventual surplus energy from renewable sources. As seen, this binary variable is equal to 1 when the surplus energy is positive (i.e., when the renewable sources are able to produce an excess of energy).
Likewise, Figure 7 serves to validate the variable y ( 2 a ) which is equal to 1 when the state of charge of the BES is higher than 80% of the total capacity. Finally, Figure 8 depicts the value of y ( 1 ) , y ( 2 a ) and y ( 2 ) . As observed in this figure, the latter is only equal to 1 when the other two variables are actually equal to 1. With these results, the mixed-integer-logical programming for optimal coordination of ‘green’ BES and PHS is considered sufficiently validated.

6.3. Analyzing the Effect of DR Programs

This section is devoted to analysing the effect of DR programs in MG operation. To this purpose, we analyse the following two cases:
  • Case 1: it is considered the base case in which the different DR programs explained throughout this paper are put to practice.
  • Case 2: in this case, flexible demand is not considered. In this sense, curtailable and sheddable demands have to be entirely covered. On the other hand, all the energy demanded by those consumers under energy agreements has to be satisfied. Nevertheless, certain flexibility is still contemplated for these users, as this energetic demand can be satisfied whenever the scheduling tool determines.
Table 8 reports the operating cost (objective function) in both studied cases. As seen, the operational cost of the MG under study can be notably reduced by applying DR programs. More precisely, monetary savings achieve up to ~38%. To obtain a better view on these results, Figure 9 shows the actual demand covered for those users under curtailing and shedding DR programs, while Table 9 reports the percentage of energetic demand satisfied by energy consumers. As observed, while in case 2 the demand is completely covered, the scheduling tool was demonstrated to partially not satisfy the demand of these consumers in case 1. In this scenario, the monetary costs of penalizations are more of an economic undertaking than the operation of the backup generation to fully cover the load.
Figure 10 compares the actual surplus energy in the studied cases. As appreciated in this figure, more surplus is frequently produced in case 1, especially during the evening due to high PV potential. This is because the optimal scheduling tool programs the different responsive loads so that surplus energy is maximized compared with case 2.
Figure 11 analyzes the status of the different storage systems through the time horizon. In the case of the BES system, the effect of DR is not especially appreciated. However, DR programs are more noticeable in the operation of the PHS unit. As seen in Figure 11, the last hours of the evening are exploited in case 1 to refill the upper reservoir, while the PHS pumps water earlier in case 2. This is due to the fact that more surplus energy is produced during these hours in case 1, as seen in Figure 10. Lastly, Table 10 reports the total energy generated by the DEG in the studied cases. As observed, energy generated by the DEG is notably reduced by applying DR programs (~82%). This is achieved by joint participation of flexible consumers which, by reducing their demand requirements, enable a high surplus of renewable generation. This way, the MG operator not only achieves reducing the operational cost of the system, but also environmental targets are more easily reachable due to a drastic reduction of fuel consumption.

7. Conclusions

This paper has presented a mathematical model for optimal coordination of ‘green’ BES and PHS systems in isolated MGs including DR programs. Our proposal combines the traditional mixed-integer-linear programming model for optimal coordination of the different MG assets and responsive loads, with an original mixed-integer-logical programming framework for mathematically modeling a series of logical rules that enables an effective coordination of the different storage facilities. Furthermore, a simple stochastic programming paradigm has been proposed which exploits clustering techniques to keep the whole optimization procedure computationally tractable.
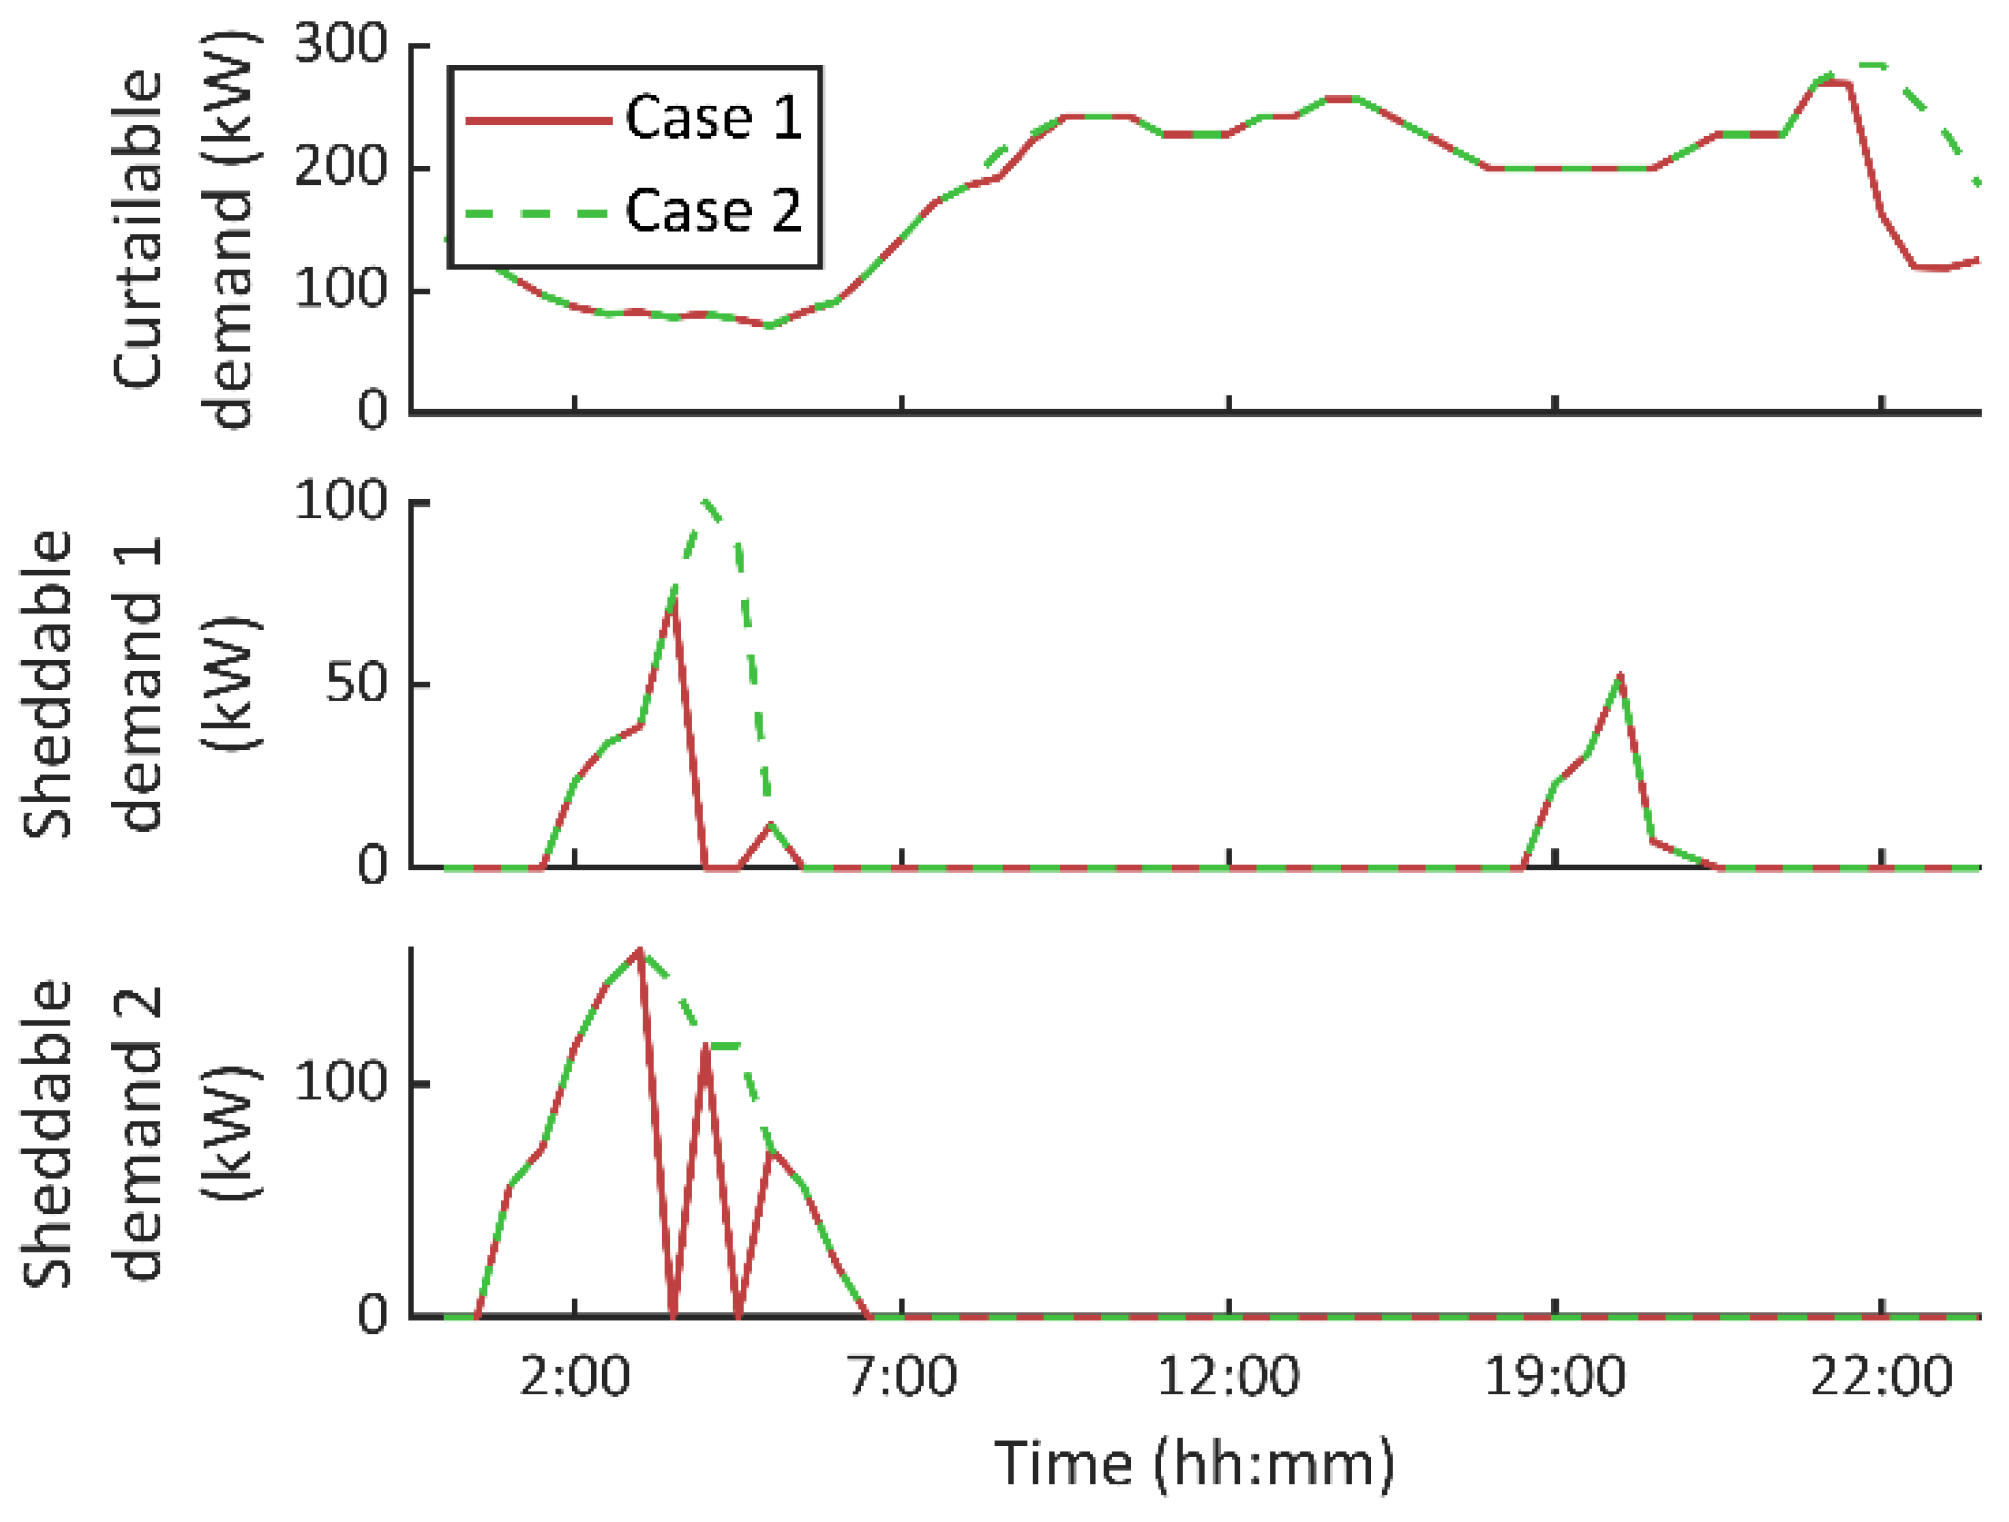
A case study has been presented to validate the developed mixed-integer-logical programming model. The numerical experiments have also served to analyse the effect of DR programs in MG operation. In this regard, a notable cost reduction is achieved by enabling demand participation (~38%). Notable monetary savings are possible due to a drastic reduction of DEG generation (~82%). Furthermore, it has been observed that the different responsive loads are programmed so that surplus energy from renewable sources is maximized.
It is worth commenting that the developed model shares a limitation with stochastic programming. Although this uncertainty model is normally assumed to be feasible and widely applicable, it requires accurate forecasts to be reliable. In this sense, the developed methodology can be adapted to other uncertainty models to overcome such drawbacks, which will be addressed in future works. Moreover, future research will be focused on developing similar optimization frameworks for other types of hybrid storage systems, which may encompass hydrogen tanks, supercapacitors or air-compressed storage systems.

Author Contributions

Conceptualization, M.T.-V., M.R.M., D.S.-L. and A.E.; data curation, M.T.-V., A.A.G., D.S.-L. and A.E.; formal analysis, M.T.-V., A.A.G., M.R.M., A.E. and F.J.; funding acquisition, M.T.-V. and F.J.; investigation, M.T.-V., M.R.M., D.S.-L. and A.E.; methodology, M.T.-V., M.R.M., D.S.-L. and A.E.; project administration, A.A.G. and F.J.; resources, A.A.G. and F.J.; software, A.A.G., M.R.M. and A.E.; supervision, A.A.G. and F.J.; validation, M.T.-V., A.A.G., M.R.M., A.E. and F.J.; visualization, M.T.-V. and F.J.; writing—original draft, M.T.-V., M.R.M., D.S.-L. and A.E.; writing—review and editing, A.A.G. and F.J. All authors have read and agreed to the published version of the manuscript.

Funding

This research received no external funding.

Data Availability Statement

Not applicable.

Acknowledgments

The icons used in this paper were developed by Freepik, from www.flaticon.com (accessed on 20 September 2022).

Conflicts of Interest

The authors declare no conflict of interest.

Nomenclature

Index (Set)
r ( ) Representative scenario
t ( T ) Time
s ( S ) Consumer subjected to shedding agreements
e ( ) Consumer subjected to energy-supplying agreement
Superscripts
DEG Diesel engine generator
PV Photovoltaic-based generator
WG Wind-based generator
BES ,   ch / dch Battery energy storage in charging/discharging mode
PHS ,   pump / turb Pumped hydro storage in pump/turbine mode
K Curtailed load
OM Operation and maintenance
LD Local demand
Upper / Lower Upper/lower reservoir
( * ) ¯ / ( * ) _ Maximum/minimum value of a variable or parameter
Parameters and constants
ω Probability (p.u.)
τ Time step (hrs.)
a ,   b ,   c Fuel cost coefficients ($/h, $/kWh, $/kWh²)
ϱ Energy cost ($/kWh)
μ Operation and maintenance cost ($/kWh or $/kWh²)
σ Start-up and shutdown costs ($)
κ Cost of shedding load ($/h)
E Energy agreed for energy-supplying agreements (kWh)
R Ramp up/down (kW)
η Efficiency (p.u.)
ϑ Solar irradiation (kW/m²)
θ Temperature (ºC)
γ Wind speed (m/s)
α ,   β Coefficients of the speed–power curve of a wind turbine (kW/(m/s)3, -)
e 2 P Energy-to-power ratio (hrs.)
DOD Depth of discharge (p.u.)
H Net head (m)
ρ Water density (kg/m³)
g Gravity acceleration (m/s²)
M Large positive number
f Friction factor (-)
L Pipe length (m)
D Inlet pipe diameter (m)
Decision variables
p Power (kW)
u Commitment status (binary)
q Water flow (m³/s)
ε Energy (kWh)
v Water volume (m³)
on r | t i / off r | t i Pair   of   variables   that   are   equal   to   1   if   the   unit   i   is   activated / deactivated   at   time   t , and 0 otherwise (binary)
y Auxiliary variables for linear representation of logical rules (binary)

Appendix A. Linearization of Quadratic Terms

In this paper, the quadratic terms of the optimization model are linearized using a piecewise representation of the nonlinear function [43]. Supposing a nonlinear function of a continuous variable ψ ( w ) , let us assume the bounds of this function are known (i.e., ψ ( w _ ) , ψ ( w _ ) ). To obtain the piecewise representation of this function, its range is divided into n 1 segments, as shown in (A1).
ψ ˜ = w ˜ i , ψ ( w ˜ i ) ; i { 1 , 2 , , n }
where the superscript ( ) ˜ makes mention of points of the piecewise function (see Figure A1). Then, an auxiliary binary variable δ is declared and ψ is replaced in the formulation by the linear variable z , which is given by:
z = i = 1 i = n { δ i · ( w · K i L i ) }
where the K and L s are, respectively, calculated by (A3) and (A4).
K i = ψ ( w ˜ i ) ψ ( w ˜ i 1 ) x ˜ i x ˜ i 1 ;   i { 2 , 3 , , n }
L i = ψ ( w ˜ i ) K i · w ˜ i ;   i { 2 , 3 , , n }
Figure A1. Piecewise representation of a nonlinear function ψ .
Batteries 08 00198 g0a1
To ensure the coherency between the set δ and the value of w , the constraint has to be included.
i = 1 i = n 1 { δ i · w ˜ i } w i = 2 i = n { δ i 1 · w ˜ i }
Finally, only one segment of ψ ˜ should be active each time. This condition can be guaranteed by declaring δ a special ordered set 1 (SOS1) [44]. Many commercial solvers such as Gurobi enable direct declaration of SOS1 property and exploit it in an efficient manner. It is worth noting that n bi-linear terms appear in (A2) because of the product of the set δ by w . These nonlinear terms can be easily linearized by introducing the dummy variable v and the constraints (A6) and (A7) [33].
w M · ( 1 δ ) v w + M · ( 1 δ )
M · δ v M · δ

Appendix B. Linearization of Bi-Integer Variables

A bi-integer variable arises from the product of two integer variables. Let us assume δ 1 and δ 2 are two integer variables. The product of these two variables can be replaced by the integer dummy variable ϖ , besides imposing the constraints (A8)–(A10).
ϖ δ 1 ,   ϖ δ 2
ϖ δ 1 + δ 2 1
ϖ 0

References

  1. Bayat, M.; Koushki, M.M.; Ghadimi, A.A.; Tostado-Véliz, M.; Jurado, F. Comprehensive enhanced Newton Raphson approach for power flow analysis in droop-controlled islanded AC microgrids. Int. J. Electr. Power Energy Syst. 2022, 143, 108493. [Google Scholar] [CrossRef]
  2. Ma, T.; Yang, H.; Lu, L.; Peng, J. Technical feasibility study on a standalone hybrid solar-wind system with pumped hydro storage for a remote island in Hong Kong. Renew. Energy 2014, 69, 7–15. [Google Scholar] [CrossRef]
  3. Elmouatamid, A.; Ouladsine, R.; Bakhouya, M.; El Kamoun, N.; Khaidar, M.; Zine-Dine, K. Review of Control and energy management approaches in micro-grid systems. Energies 2021, 14, 168. [Google Scholar] [CrossRef]
  4. Shafiee, M.; Rashidinejad, M.; Abdollahi, A. A novel stochastic framework based on PEM-DPSO for optimal operation of microgrids with demand response. Sustain. Cities Soc. 2021, 72, 103024. [Google Scholar] [CrossRef]
  5. Hajiamoosha, P.; Rastgou, A.; Bahramara, S.; Sadati, S.M. Stochastic energy management in a renewable energy-based microgrid considering demand response program. Int. J. Electr. Power Energy Syst. 2021, 129, 106791. [Google Scholar] [CrossRef]
  6. Jodehi, A.R.; Javadi, M.S.; Catalão, J.P.S. Optimal placement of battery swap stations in microgrids with micro pumped hydro storage systems, photovoltaic, wind and geothermal distributed generators. Int. J. Electr. Power Energy Syst. 2021, 125, 106483. [Google Scholar] [CrossRef]
  7. Vasudevan, K.R.; Ramachandaramurthy, V.K.; Venugopal, G.; Ekanayake, J.B.; Tiong, S.K. Variable speed pumped hydro storage: A review of converters, controls and energy management strategies. Renew. Sustain. Energy Rev. 2021, 135, 110156. [Google Scholar] [CrossRef]
  8. Zhao, Y.; Chen, J. A quantitative risk-averse model for optimal management of multi-source standalone microgrid with demand response and pumped hydro storage. Energies 2021, 14, 2692. [Google Scholar] [CrossRef]
  9. Alturki, F.A.; Awwad, E.M. Sizing and cost minimization of standalone hybrid wt/pv/biomass/pump-hydro storage-based energy systems. Energies 2021, 14, 489. [Google Scholar] [CrossRef]
  10. Ma, Y.; Li, C.; Zhou, J.; Zhang, Y. Comprehensive stochastic optimal scheduling in residential micro energy grid considering pumped-storage unit and demand response. J. Energy Storage 2020, 32, 101968. [Google Scholar] [CrossRef]
  11. Mousavi, N.; Kothapalli, G.; Habibi, D.; Lachowicz, D.; Moghaddam, V. A real-time energy management strategy for pumped hydro storage systems in farmhouses. J. Energy Storage 2020, 32, 101928. [Google Scholar] [CrossRef]
  12. Liang, N.; Li, P.; Liu, Z.; Song, Q.; Luo, L. Optimal scheduling of island microgrid with seawater-pumped storage station and renewable energy. Processes 2020, 8, 737. [Google Scholar] [CrossRef]
  13. Ghasemi, A.; Enayatzare, M. Optimal energy management of a renewable-based isolated microgrid with pumped-storage unit and demand response. Renew. Energy 2018, 123, 460–474. [Google Scholar] [CrossRef]
  14. Ghasemi, A. Coordination of pumped-storage unit and irrigation system with intermittent wind generation for intelligent energy management of an agricultural microgrid. Energy 2018, 124, 1–13. [Google Scholar] [CrossRef]
  15. Shi, J.; Huang, W.; Tai, N.; Qiu, P.; Lu, Y. Energy management strategy for microgrids including heat pump air-conditioning and hybrid energy storage systems. J. Eng. 2017, 2017, 2412–2416. [Google Scholar] [CrossRef]
  16. Kaur, M.; Verma, Y.P.; Sharma, M.K. Impact of demand response and pumped storage on microgrid operation. In Proceedings of the 2016 IEEE 1st International Conference on Power Electronics, Intelligent Control and Energy Systems (ICPEICES), Delhi, India, 4–6 July 2016; pp. 1–6. [Google Scholar] [CrossRef]
  17. Wang, P.; Wang, D.; Zhu, C.; Yang, Y.; Abdullah, H.M.; Mohamed, M.A. Stochastic management of hybrid AC/DC microgrids considering electric vehicles charging demands. Energy Rep. 2020, 6, 1338–1352. [Google Scholar] [CrossRef]
  18. Mohamed, M.A.; Jin, T.; Su, W. Multi-agent energy management of smart islands using primal-dual method of multipliers. Energy 2020, 208, 118306. [Google Scholar] [CrossRef]
  19. Ahmadi, S.; Tostado-Véliz, M.; Ghadimi, A.A.; Miveh, M.R.; Jurado, F. A novel interval-based formulation for optimal scheduling of microgrids with pumped-hydro and battery energy storage under uncertainty. Int. J. Energy Res. 2022, 46, 12854–12870. [Google Scholar] [CrossRef]
  20. Mobasseri, A.; Tostado-Véliz, M.; Ghadimi, A.A.; Miveh, M.R.; Jurado, F. Multi-energy microgrid optimal operation with integrated power to gas technology considering uncertainties. J. Clean. Prod. 2022, 333, 130174. [Google Scholar] [CrossRef]
  21. Paterakis, N.G.; Erdinç, O.; Bakirtzis, A.G.; Catalão, J.P.S. Optimal household appliances scheduling under day-ahead pricing and load-shaping demand response strategies. IEEE Trans. Ind. Inform. 2015, 11, 1509–1519. [Google Scholar] [CrossRef]
  22. Liu, J.; Chen, C.; Liu, Z.; Jermsittiparsert, K.; Ghadimi, N. An IGDT-based risk-involved optimal bidding strategy for hydrogen storage-based intelligent parking lot of electric vehicles. J. Energy Storage 2020, 27, 101507. [Google Scholar] [CrossRef]
  23. Tostado-Véliz, M.; Bayat, M.; Ghadimi, A.A.; Jurado, F. Home energy management in off-grid dwellings: Exploiting flexibility of thermostatically controlled appliances. J. Clean. Prod. 2021, 310, 127507. [Google Scholar] [CrossRef]
  24. Tostado-Véliz, M.; Kamel, S.; Aymen, F.; Jordehi, A.R.; Jurado, F. A stochastic-IGDT model for energy management in isolated microgrids considering failures and demand response. Appl. Energy 2022, 317, 119162. [Google Scholar] [CrossRef]
  25. Alvarado-Barrios, L.; del Nozal, A.R.; Valerino, J.B.; Vera, I.G.; Martínez-Ramos, J.L. Stochastic unit commitment in microgrids: Influence of the load forecasting error and the availability of energy storage. Renew. Energy 2020, 146, 2060–2069. [Google Scholar] [CrossRef]
  26. Arévalo, P.; Tostado-Véliz, M.; Jurado, F. A novel methodology for comprehensive planning of battery storage systems. J. Energy Storage 2021, 37, 102456. [Google Scholar] [CrossRef]
  27. Garcia-Torres, F.; Vilaplana, D.G.; Bordons, C.; Roncero-Sánchez, P.; Ridao, M.A. Optimal Management of Microgrids With External Agents Including Battery/Fuel Cell Electric Vehicles. IEEE Trans. Smart Grid 2019, 10, 4299–4308. [Google Scholar] [CrossRef]
  28. Tostado-Véliz, M.; Mouassa, S.; Jurado, F. A MILP framework for electricity tariff-choosing decision process in smart homes considering ‘Happy Hours’ tariffs. Int. J. Electr. Power Energy Syst. 2021, 131, 107139. [Google Scholar] [CrossRef]
  29. Tostado-Véliz, M.; Kamel, S.; Hasanien, H.M.; Turky, R.A.; Jurado, F. A mixed-integer-linear-logical programming interval-based model for optimal scheduling of isolated microgrids with green hydrogen-based storage considering demand response. J. Energy Storage 2022, 48, 104028. [Google Scholar] [CrossRef]
  30. Chaib, A.; Achour, D.; Kesraoui, M. Control of a solar PV/wind hybrid energy system. Energy Procedia 2016, 95, 89–97. [Google Scholar] [CrossRef] [Green Version]
  31. International Renewable Energy Agency. Utility-Scale Batteries, Innovation Landscape Brief. 2019. Available online: https://www.irena.org/-/media/Files/IRENA/Agency/Publication/2019/Sep/IRENA_Utility-scale-batteries_2019.pdf (accessed on 26 June 2021).
  32. Mongird, K.; Fotedar, V.; Viswanathan, V.; Koritarov, V.; Balducci, P.; Hadjerioua, B.; Alam, J. Energy Storage Technology and Cost Characterization Report; Hydro Wires USA Department of Energy: Washington, DC, USA, 2019; Report no. PNNL-28866.
  33. Alsaidan, I.; Khodaei, A.; Gao, W. A comprehensive battery energy storage optimal sizing model for microgrid applications. IEEE Trans. Power Syst. 2018, 33, 3968–3980. [Google Scholar] [CrossRef]
  34. Morabito, A.; Hendrick, P. Pump as turbine applied to micro energy storage and smart water grids: A case study. Appl. Energy 2019, 241, 567–579. [Google Scholar] [CrossRef]
  35. Pu, Y.; Li, Q.; Chen, W.; Liu, H. Hierarchical energy management control for islanding DC microgrid with electric-hydrogen hybrid storage system. Int. J. Hydrogen Energy 2019, 44, 5153–5161. [Google Scholar] [CrossRef]
  36. Zakeri, B.; Syri, S. Electrical energy storage systems: A comparative life cycle cost analysis. Renew. Sustain. Energy Rev. 2015, 42, 569–596. [Google Scholar] [CrossRef]
  37. Rashidizadeh-Kermani, H.; Vahedipour-Dahraie, M.; Anvari-Moghaddam, A.; Guerrero, J.M. A stochastic bi-level decision-making framework for a load-serving entity in day-ahead and balancing markets. Int. Trans. Electr. Energy Syst. 2019, 29, e12109. [Google Scholar] [CrossRef]
  38. Javadi, M.S.; Lotfi, M.; Nezhad, A.E.; Anvari-Moghaddam, A.; Guerrero, J.M.; Catalão, J.P.S. Optimal operation of energy hubs considering uncertainties and different time resolutions. IEEE Trans. Ind. Appl. 2020, 56, 5543–5552. [Google Scholar] [CrossRef]
  39. Swaminathan, S.; Pavlak, G.S.; Freihaut, J. Sizing and dispatch of an islanded microgrid with energy flexible buildings. Appl. Energy 2020, 276, 115355. [Google Scholar] [CrossRef]
  40. Gurobi—The fastest solver. Available online: https://www.gurobi.com/ (accessed on 28 June 2022).
  41. National Centers for Environmental Information. Land-Based Datasets and Products. Available online: https://www.ncdc.noaa.gov/data-access/land-based-station-data/land-based-datasets (accessed on 28 June 2022).
  42. Red Eléctrica de España. Canary Electricity Demand in Real-Time. Available online: https://www.ree.es/en/activities/canary-islands-electricity-system/canary-electricity-demand-in-real-time (accessed on 28 June 2022).
  43. Tostado-Véliz, M.; Kamel, S.; Hasanien, H.M.; Turky, R.A.; Jurado, F. Uncertainty-aware day-ahead scheduling of microgrids considering response fatigue: An IGDT approach. Appl. Energy 2022, 310, 118611. [Google Scholar] [CrossRef]
  44. Gounaris, C.E.; Misener, R.; Floudas, C.A. Computational comparison of piecewise-linear relaxations for pooling problems. Ind. Eng. Chem. Res. 2009, 48, 5742–5766. [Google Scholar] [CrossRef]
Figure 1. Schematic representation of the isolated MG under study.
Batteries 08 00198 g001
Figure 2. The day-ahead scheduling task for the MG under study.
Batteries 08 00198 g002
Figure 3. Flowchart of the logical rules developed for optimal coordination of BES and PHS and their relationship with the introduced binary variables.
Batteries 08 00198 g003
Figure 4. Weather forecast (black) and considered scenarios (blue) in simulations.
Batteries 08 00198 g004
Figure 5. Demand forecast (black) and considered scenarios (blue) in simulations.
Batteries 08 00198 g005
Figure 6. The value of the variable y ( 1 ) and surplus energy from renewable sources.
Batteries 08 00198 g006
Figure 7. The value of the variable y ( 2 a ) and state of charge of the BES.
Batteries 08 00198 g007
Figure 8. The value of the variables y ( 1 ) (top), y ( 2 a ) (middle) and y ( 2 ) (bottom).
Batteries 08 00198 g008
Figure 9. Actual demand satisfied to consumers subjected to curtailing (top) and shedding (middle and bottom) agreements in the studied cases.
Batteries 08 00198 g009
Figure 10. Comparison of the surplus energy produced from renewable sources in the two studied cases.
Batteries 08 00198 g010
Figure 11. Operation of the different storage facilities in the studied cases. BES (upper) and PHS (middle and bottom).
Batteries 08 00198 g011
Table 1. Summary of binary variables for mixed-integer-logical programming model for optimal coordination of BES and PHS.
VariableMeaning
y ( 1 ) Is equal to 1 if surplus energy is produced from renewable sources. This variable enables the charging processes of the different storage systems.
y ( 2 ) Is equal to 1 when surplus energy remains and the batteries are sufficiently charged. Therefore, this variable enables the pumping mode of the PHS.
y ( 2 a ) Is an auxiliary variable necessary to properly model the described logical rules.
Table 2. DEG data [25].
ParameterValue
p ¯ DEG / p _ DEG 500/50 kW
R DEG 100 kW
a DEG 0.6 $/h
b DEG 0.05 $/kWh
c DEG 0.02 $/kWh²
Table 3. PV system data [26].
ParameterValue
p ¯ PV 250 kW
η PV 0.167
μ DEG 0.24 $/kWh
Table 4. WG system data [26].
ParameterValue
p ¯ WG 300 kW
γ _ WG / γ WG , rat / γ ¯ WG 2/11/21 m/s
η WG 0.88
α WG 0.2268 kW/(m/s)3
β WG 0.006
μ WG 0.19 $/kWh
Table 5. BES data [26,27].
ParameterValue
ε ¯ BES 100 kWh
e 2 P 4 h
η BES 0.95
DOD 0.70
μ BES 1 × 10 6 $/kWh²
Table 6. PHS data [34].
ParameterValue
q ¯ PHS / q _ PHS 2/0.1 m³/s
η PHS ,   pump / turb 0.80
v ¯ PHS / v _ PHS 6000/500 m³
R PHS 150 kW
μ PHS 0.31 $/kWh
σ PHS USD 10
Table 7. Costs of DR programs.
ParameterValue
ϱ K 1.50 $/kWh
κ 1 50 $/h
κ 2 75 $/h
E 1 750 kWh
E 2 900 kWh
p ¯ 1 100 kW
p ¯ 2 150 kW
ϱ 1 0.24 $/kWh
ϱ 2 0.24 $/kWh
Table 8. Operational cost in the studied cases.
Case #Operational Cost
1USD 2253.10
2USD 3624.50
Table 9. Percentage of total demand satisfied to consumers subjected to energy agreements in the studied cases.
Case #Demand Satisfied
1 (user 1)70%
1 (user 2)54%
2 (user 1)100%
2 (user 2)100%
Table 10. Total DEG energy in the studied cases.
Case #Energy
1148.45 kWh
2836.60 kWh
Publisher’s Note: MDPI stays neutral with regard to jurisdictional claims in published maps and institutional affiliations.

