
Microstructure Modulation of Zn Doped VO2(B) Nanorods with Improved Electrochemical Properties towards High Performance Aqueous Batteries


Abstract
1. Introduction
2. Experiment
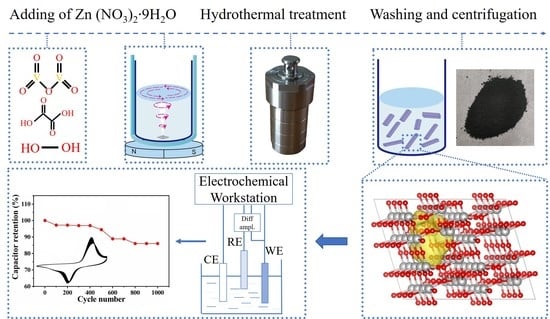
2.1. Preparation of V1−xZnxO2 Samples
2.2. Characterization of V1−xZnxO2 Samples
2.3. Electrochemical Measurements
3. Results and Discussion
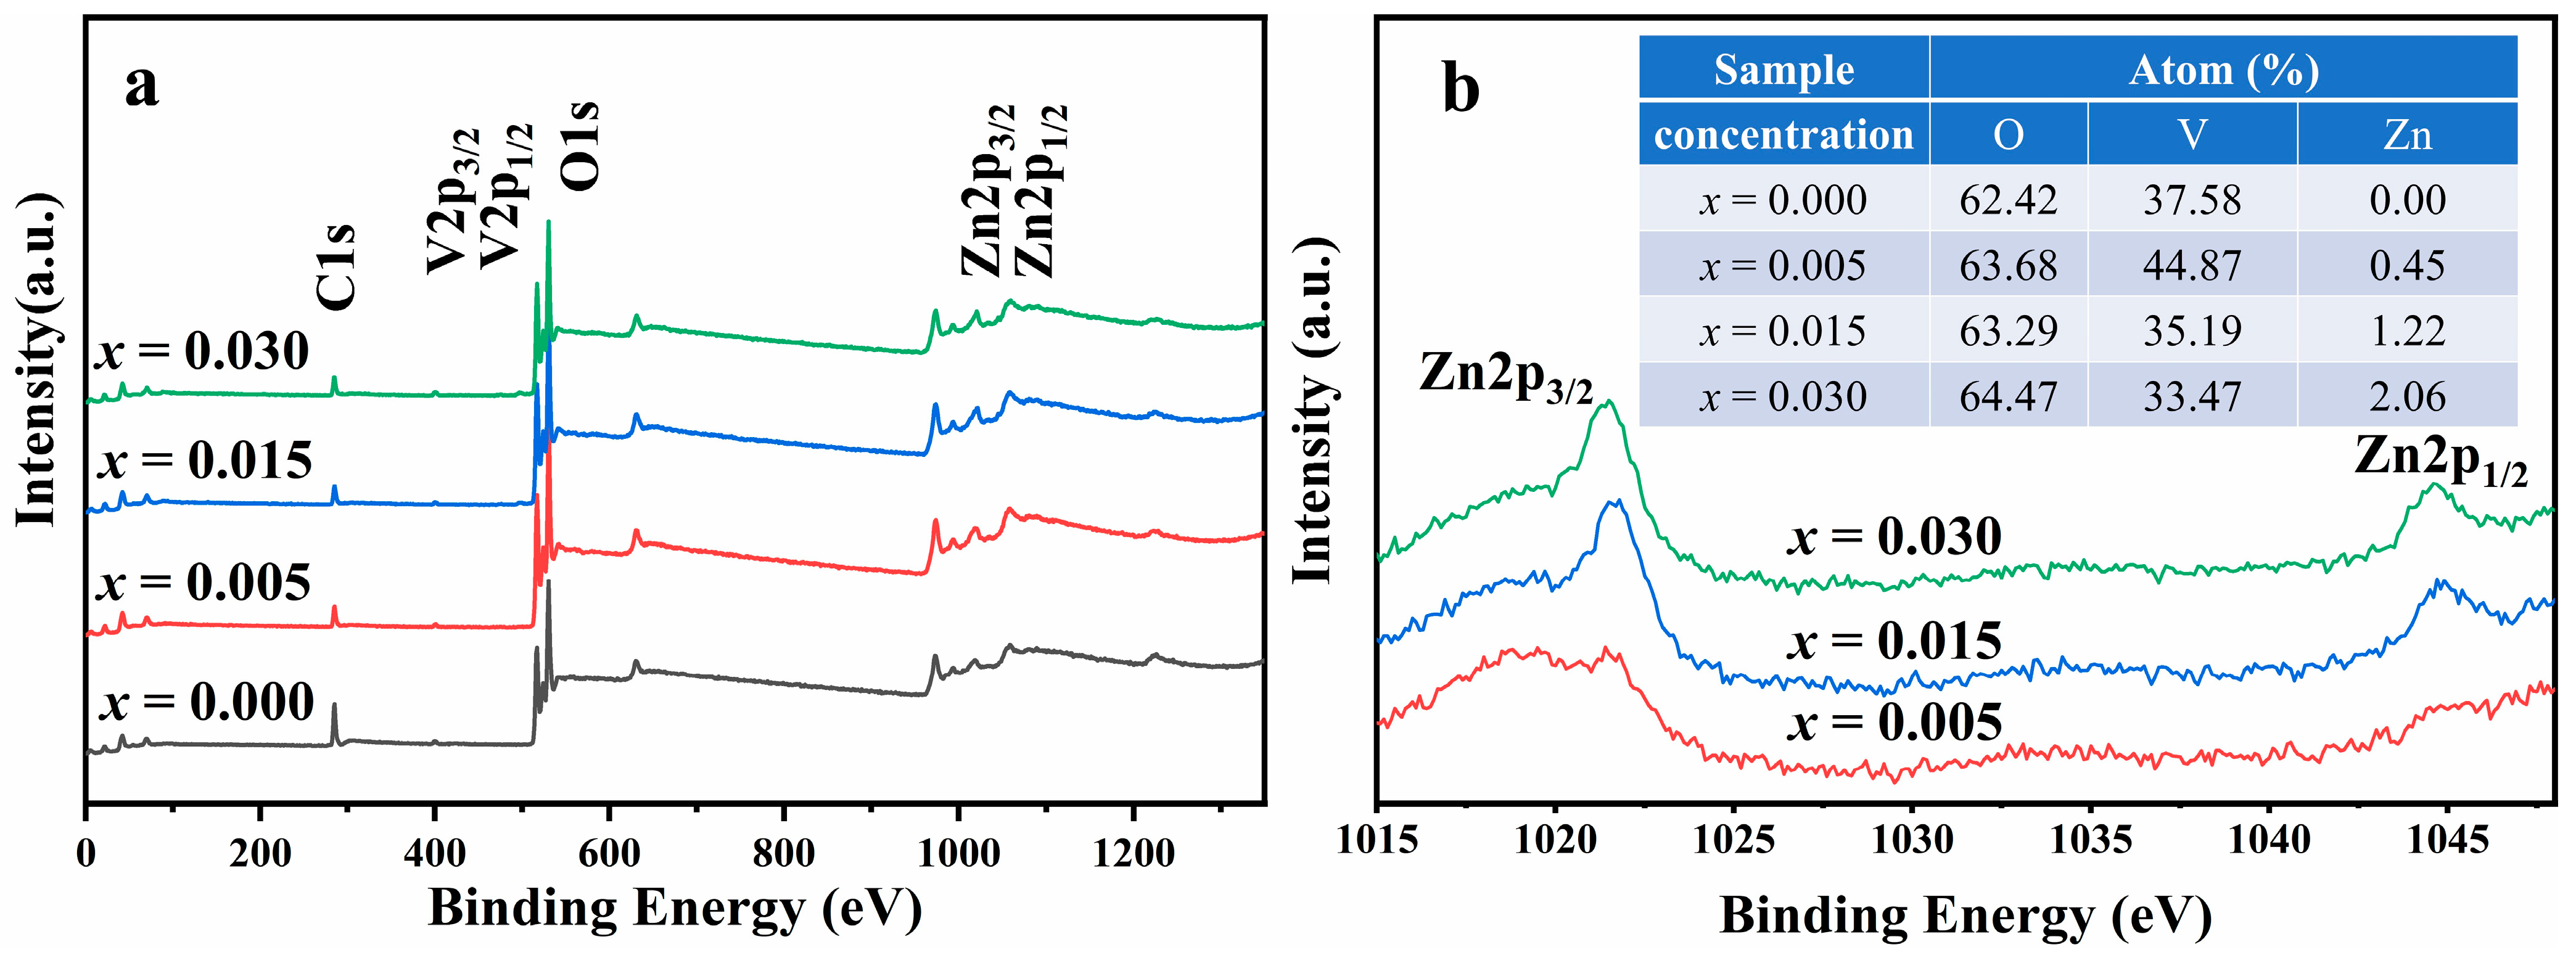
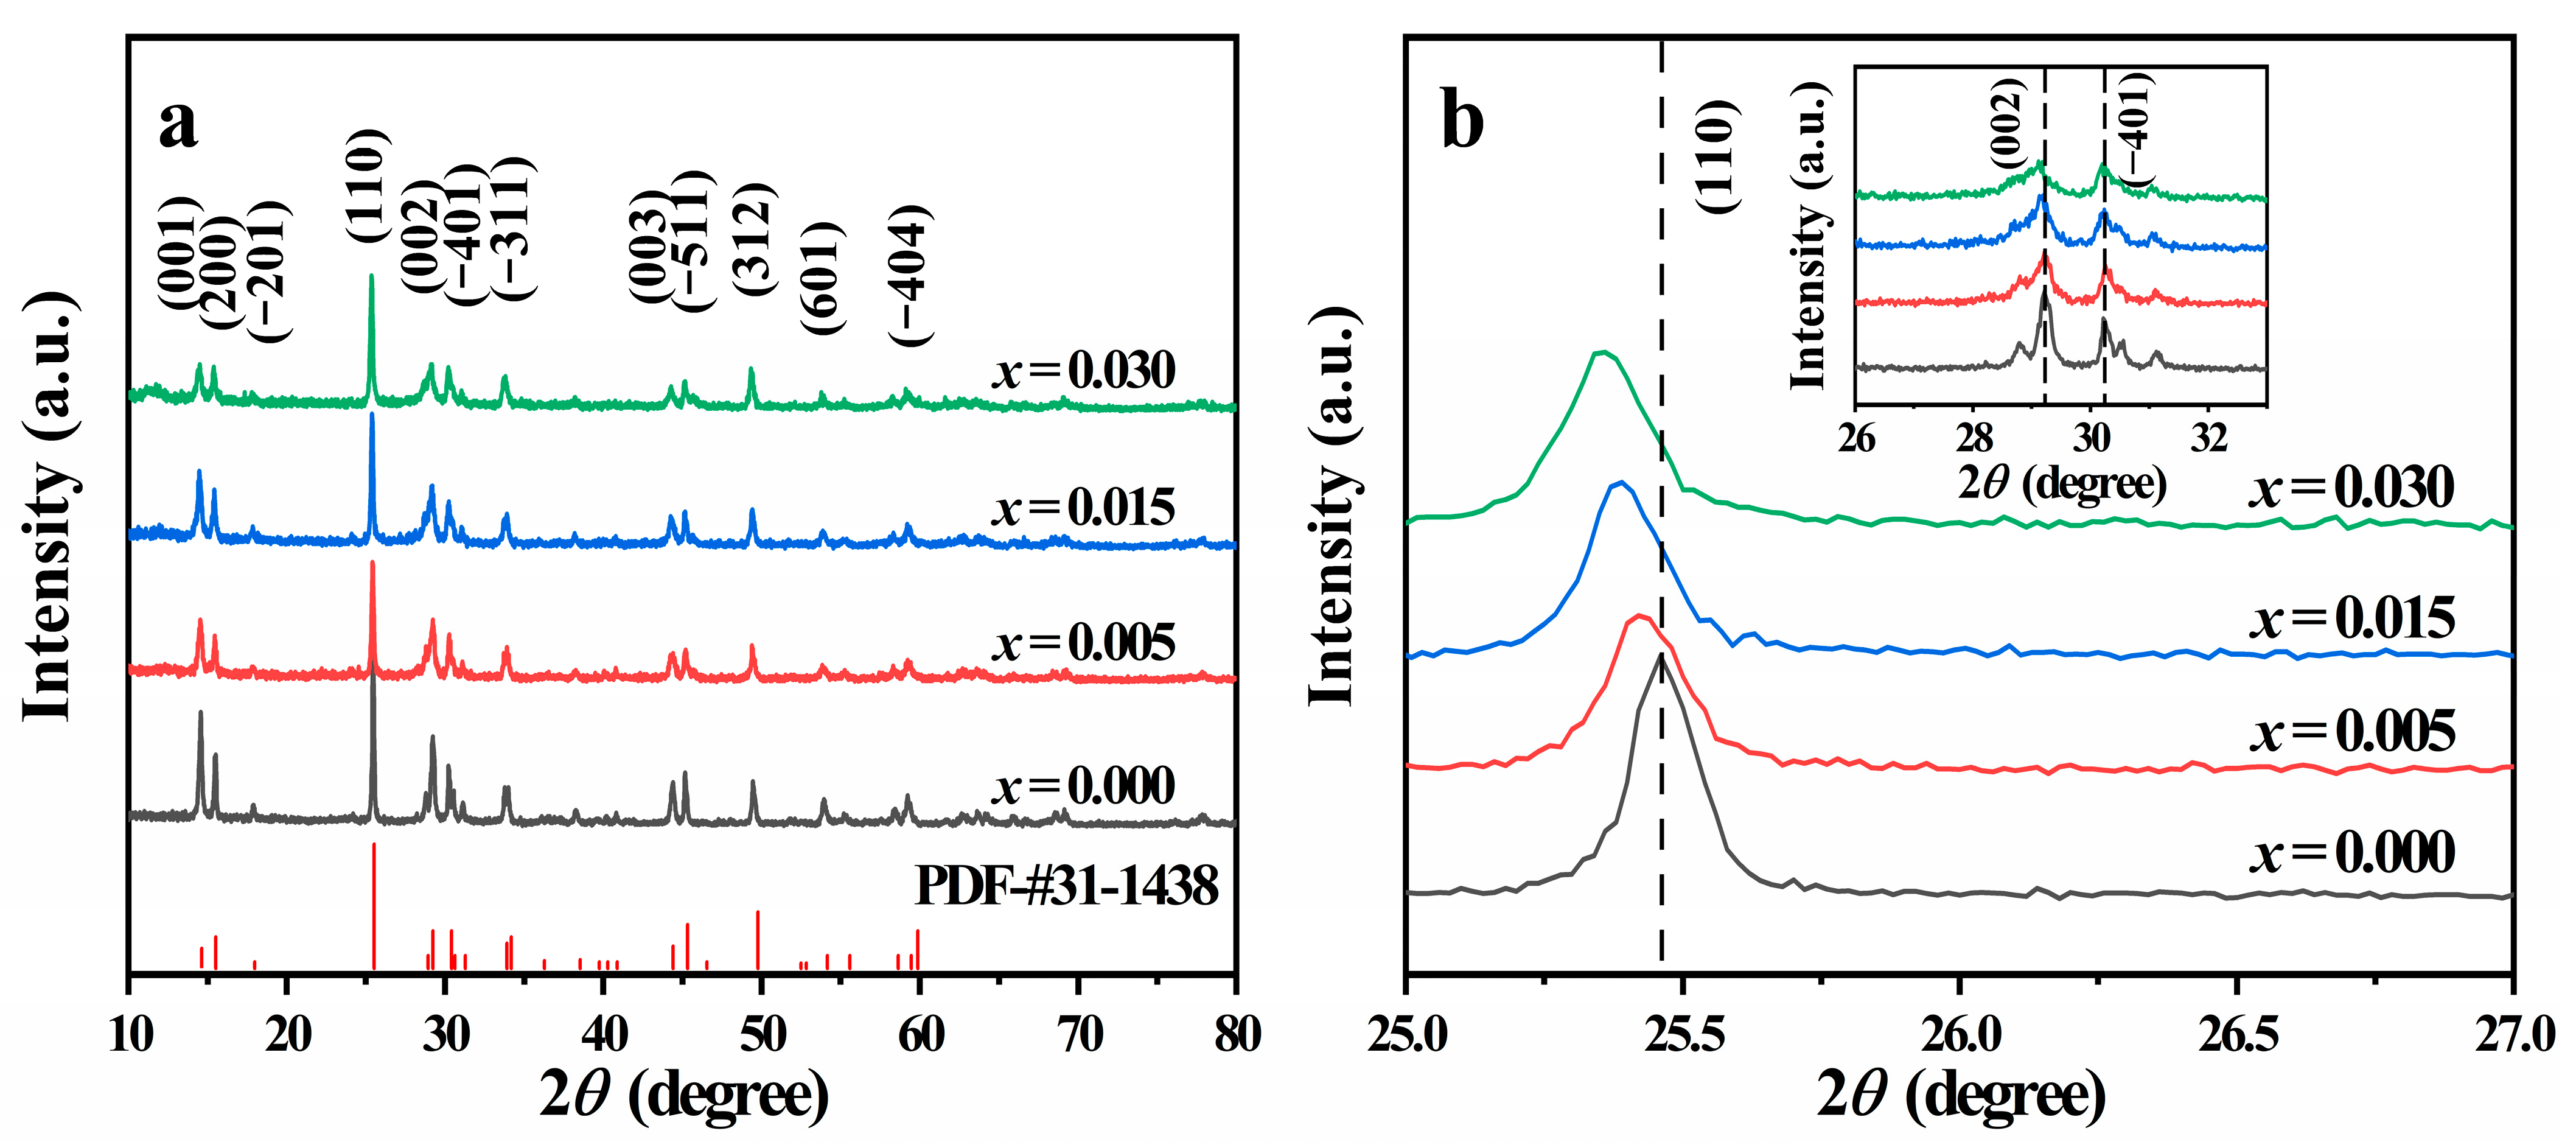
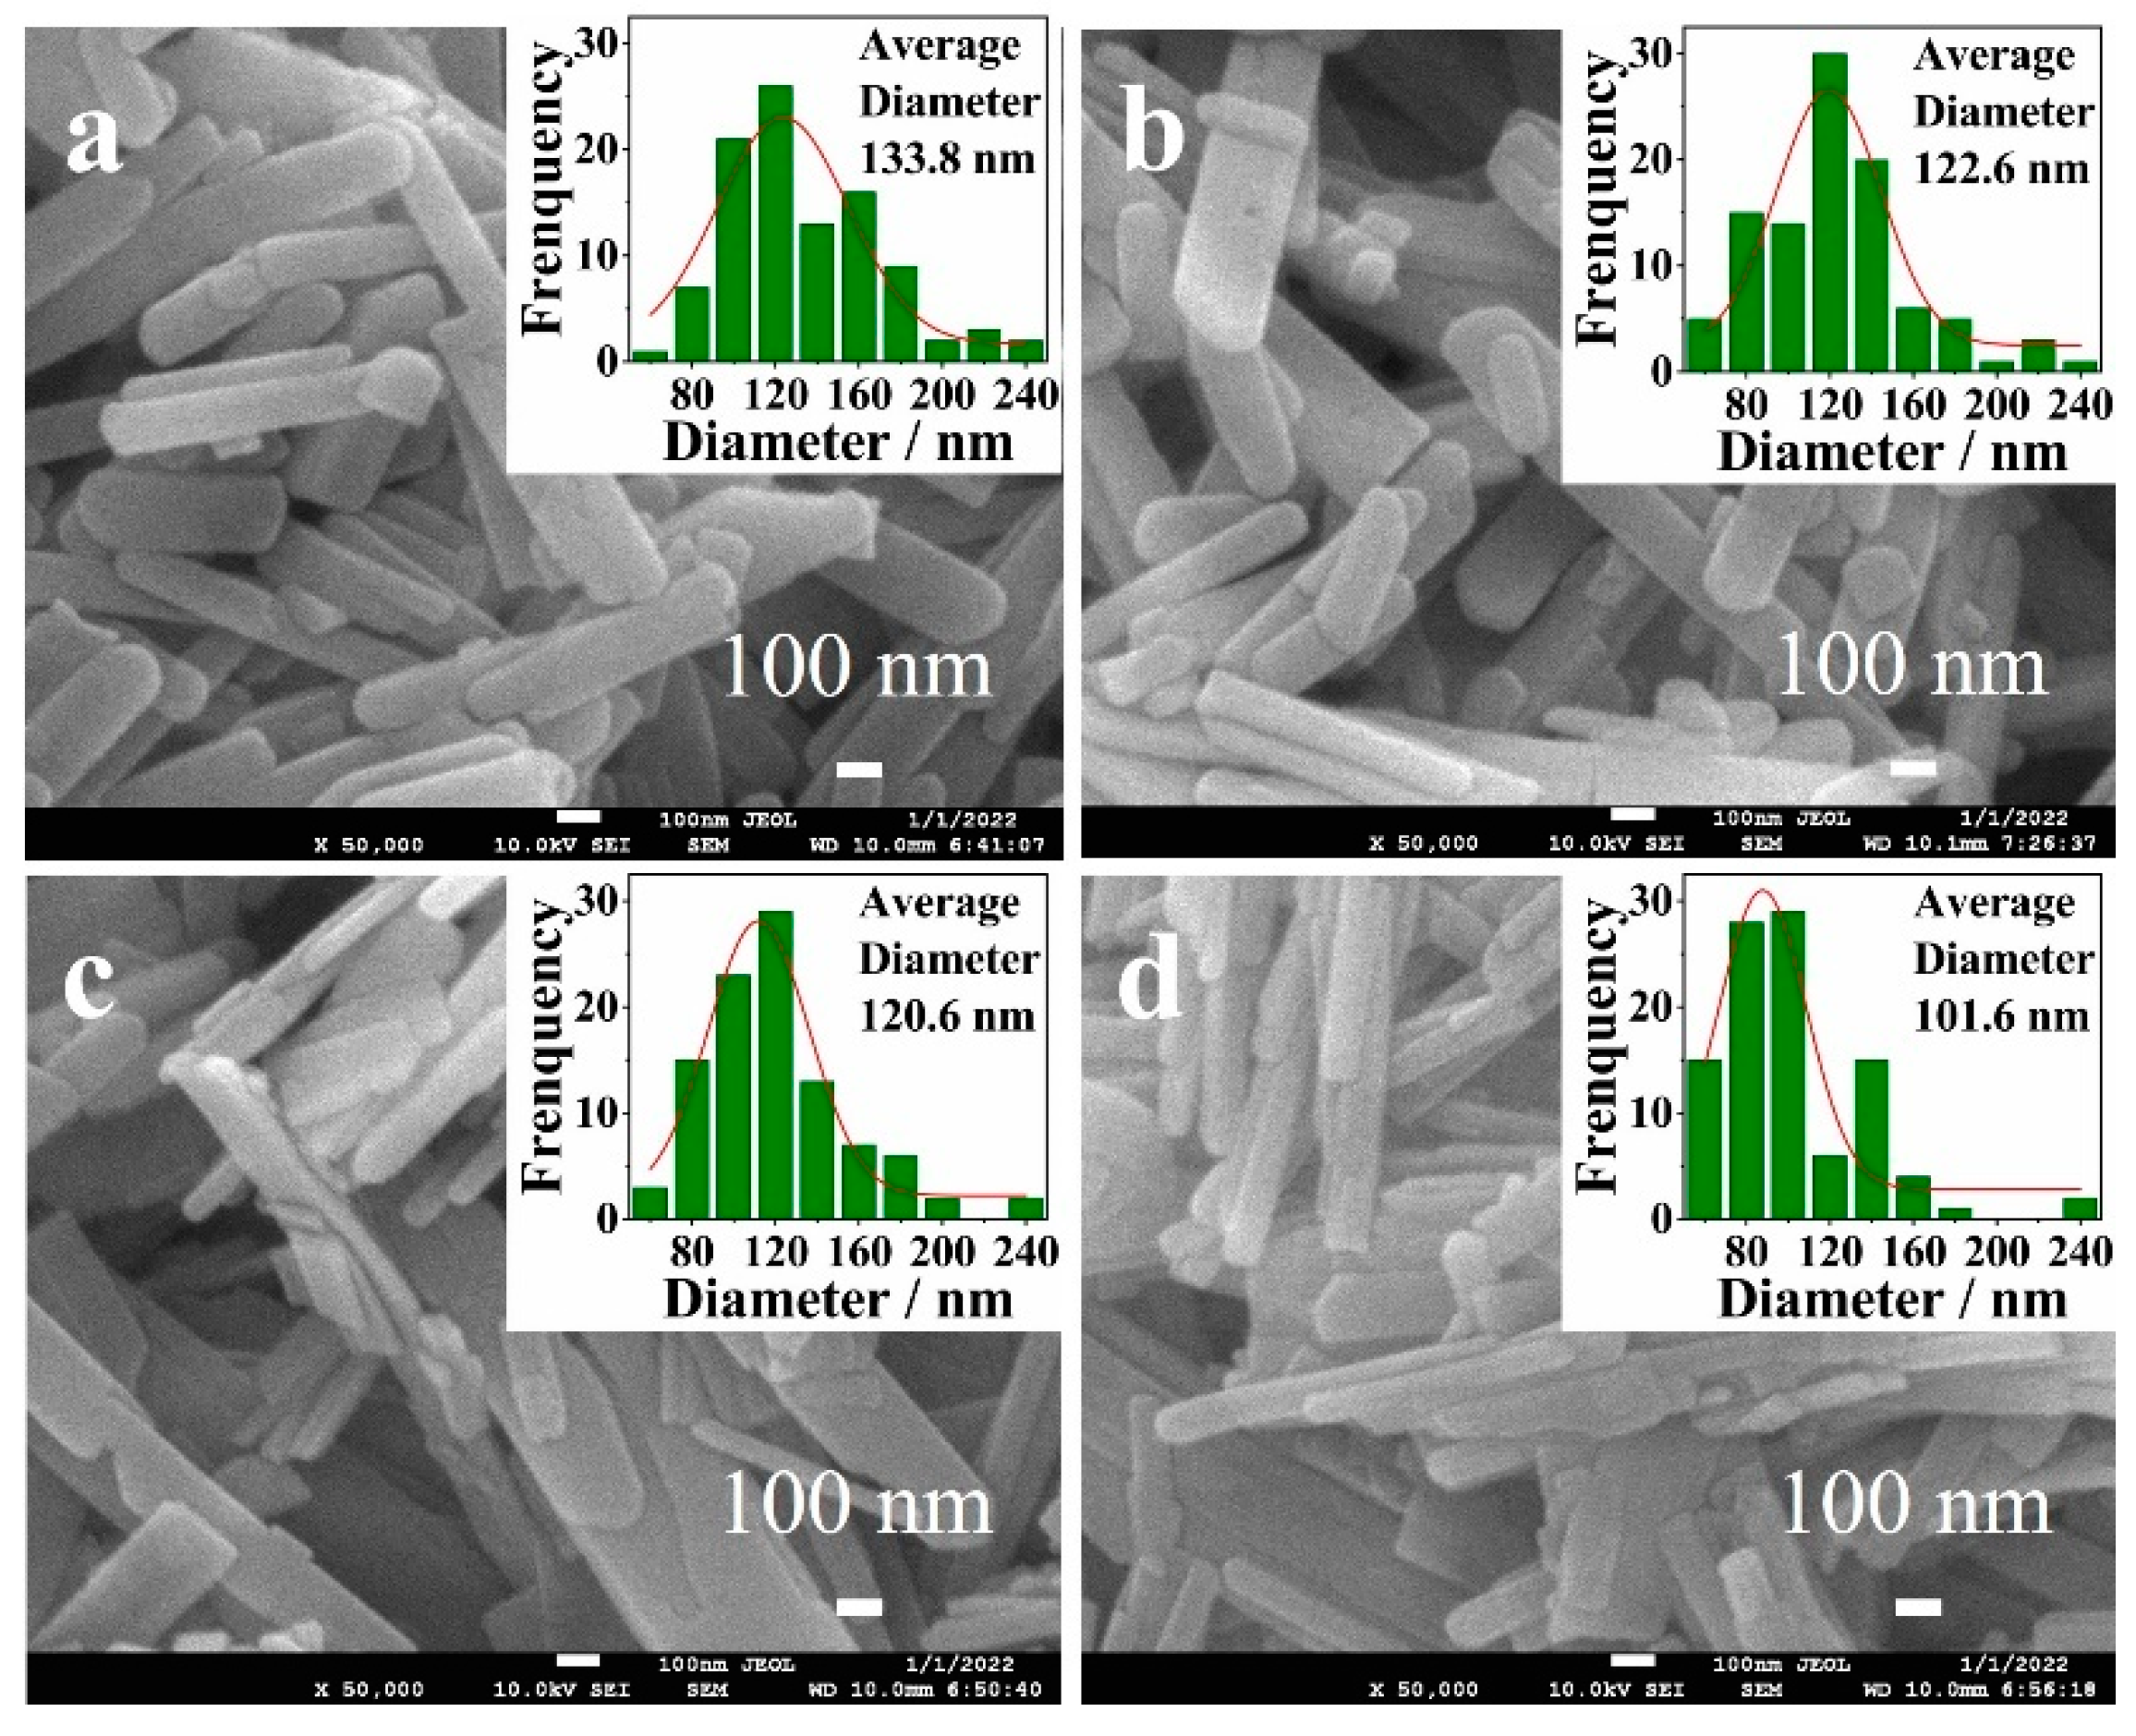
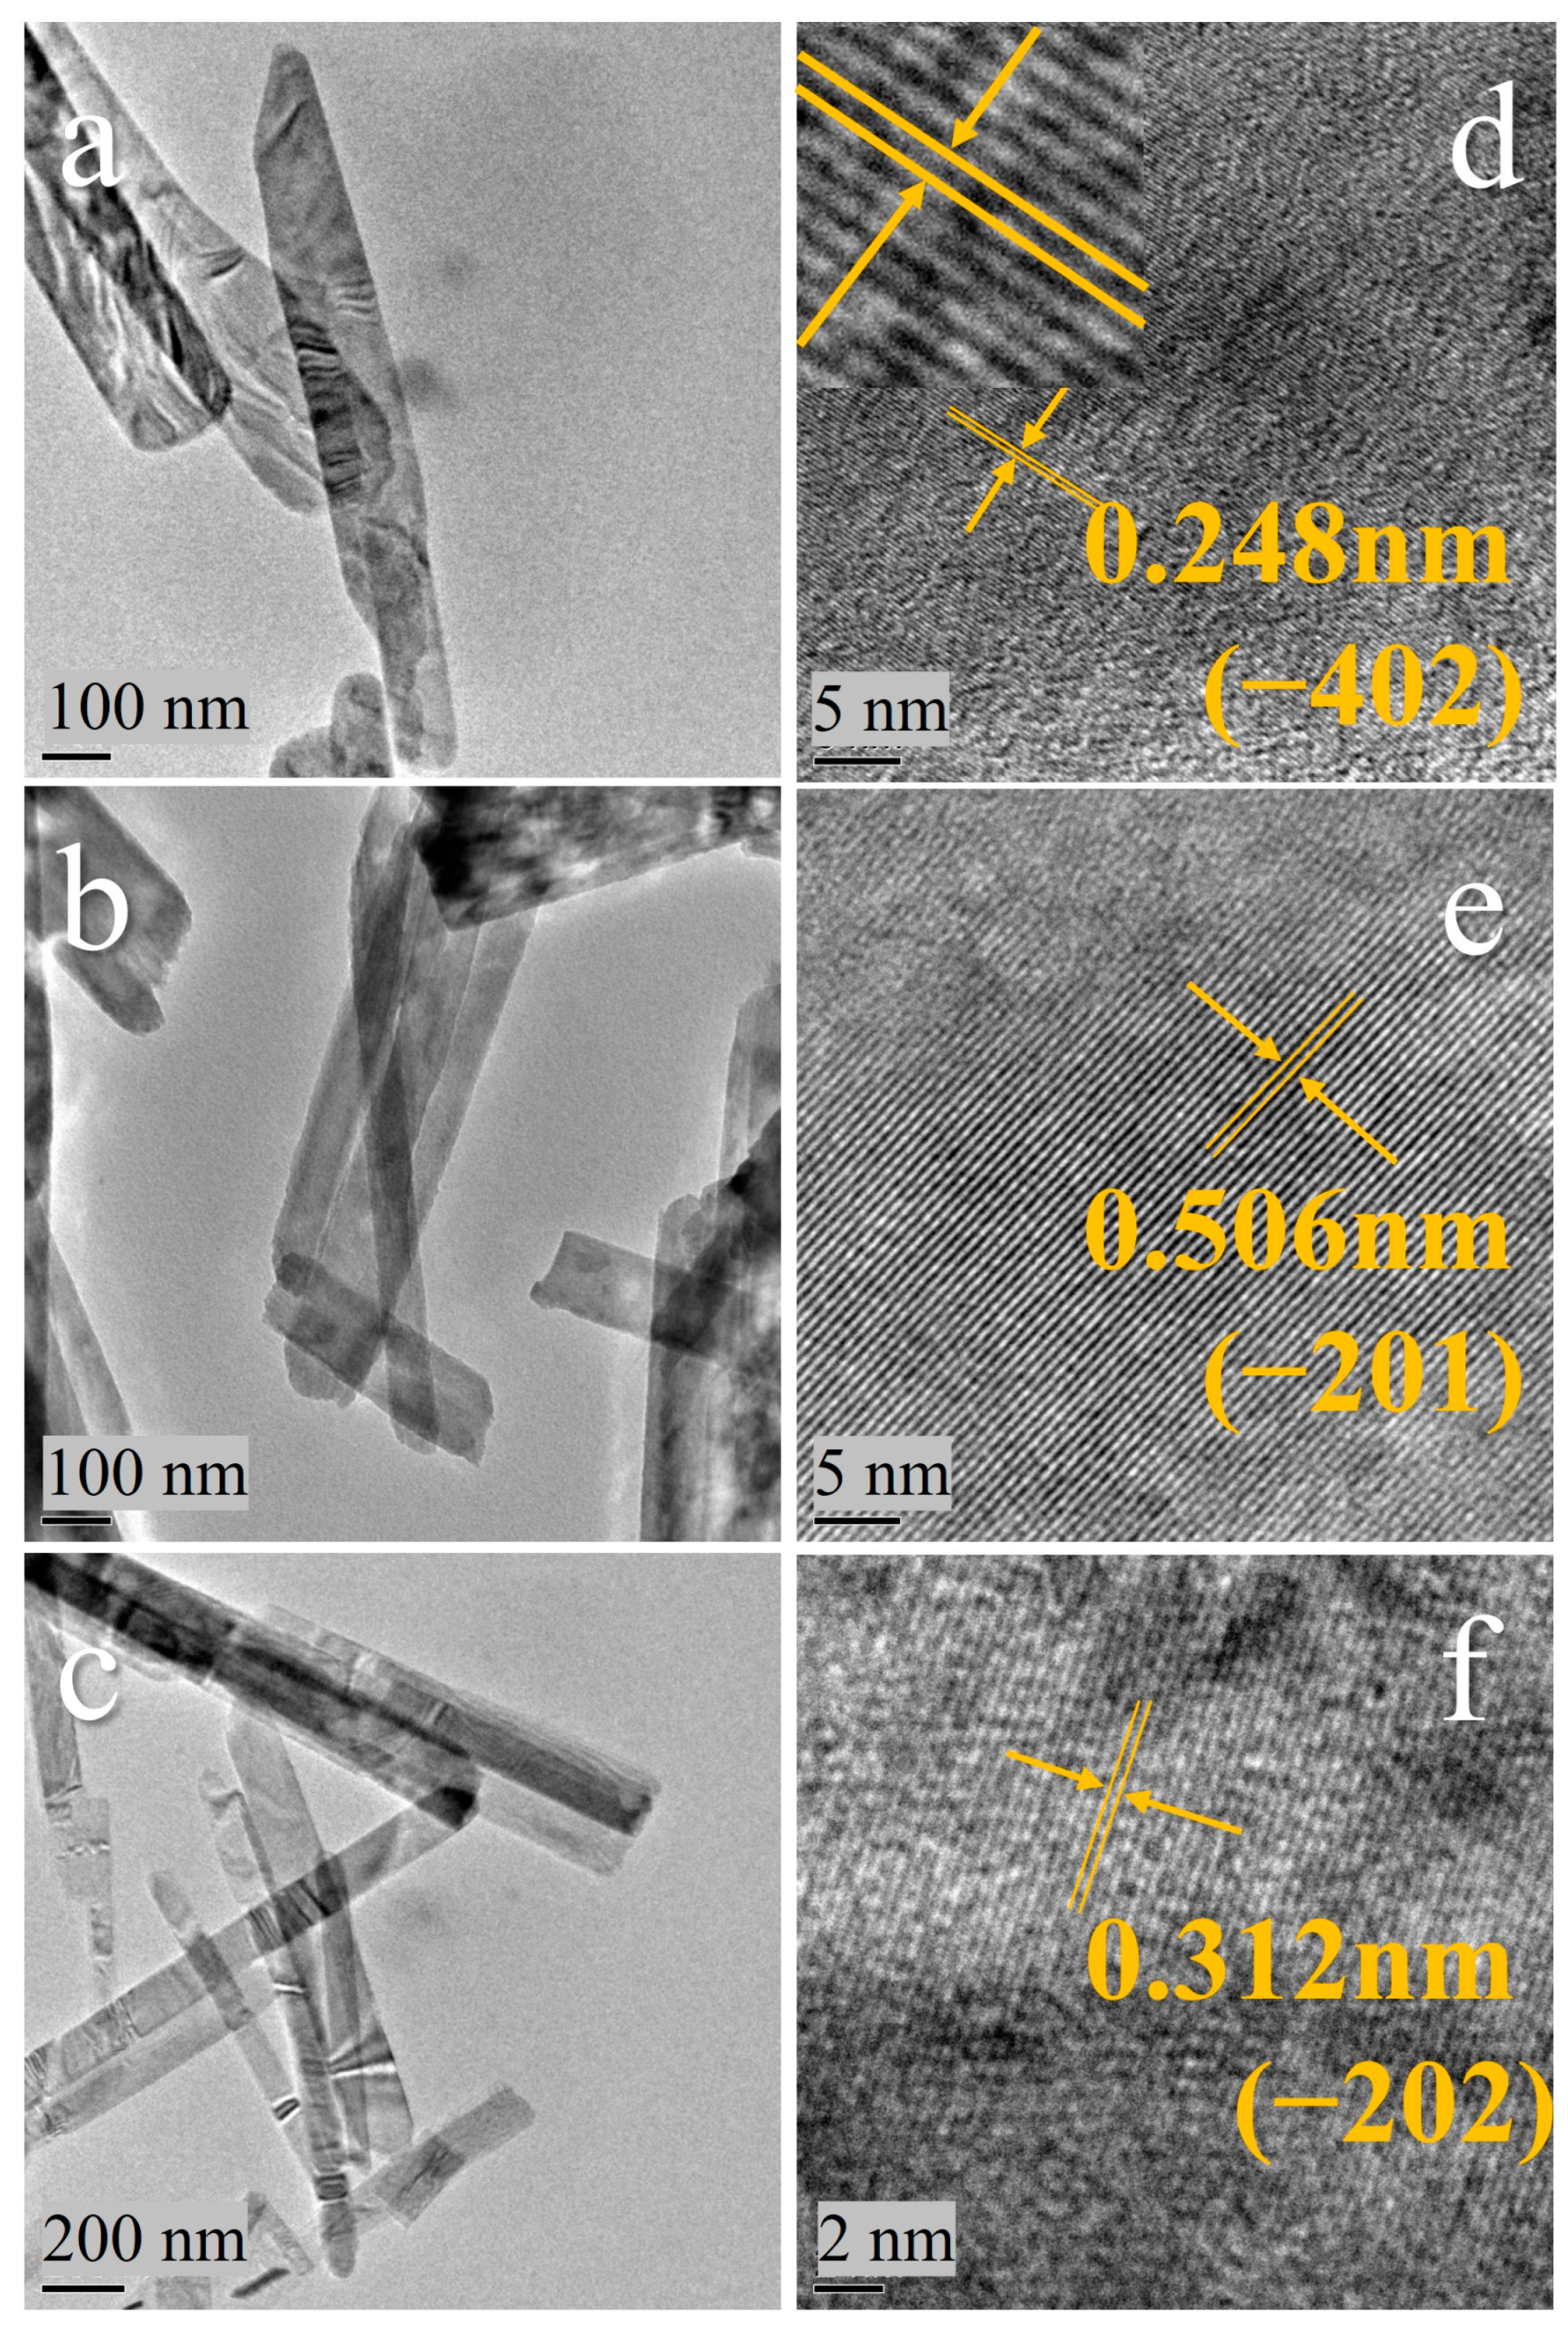
3.1. Structural Characterizations
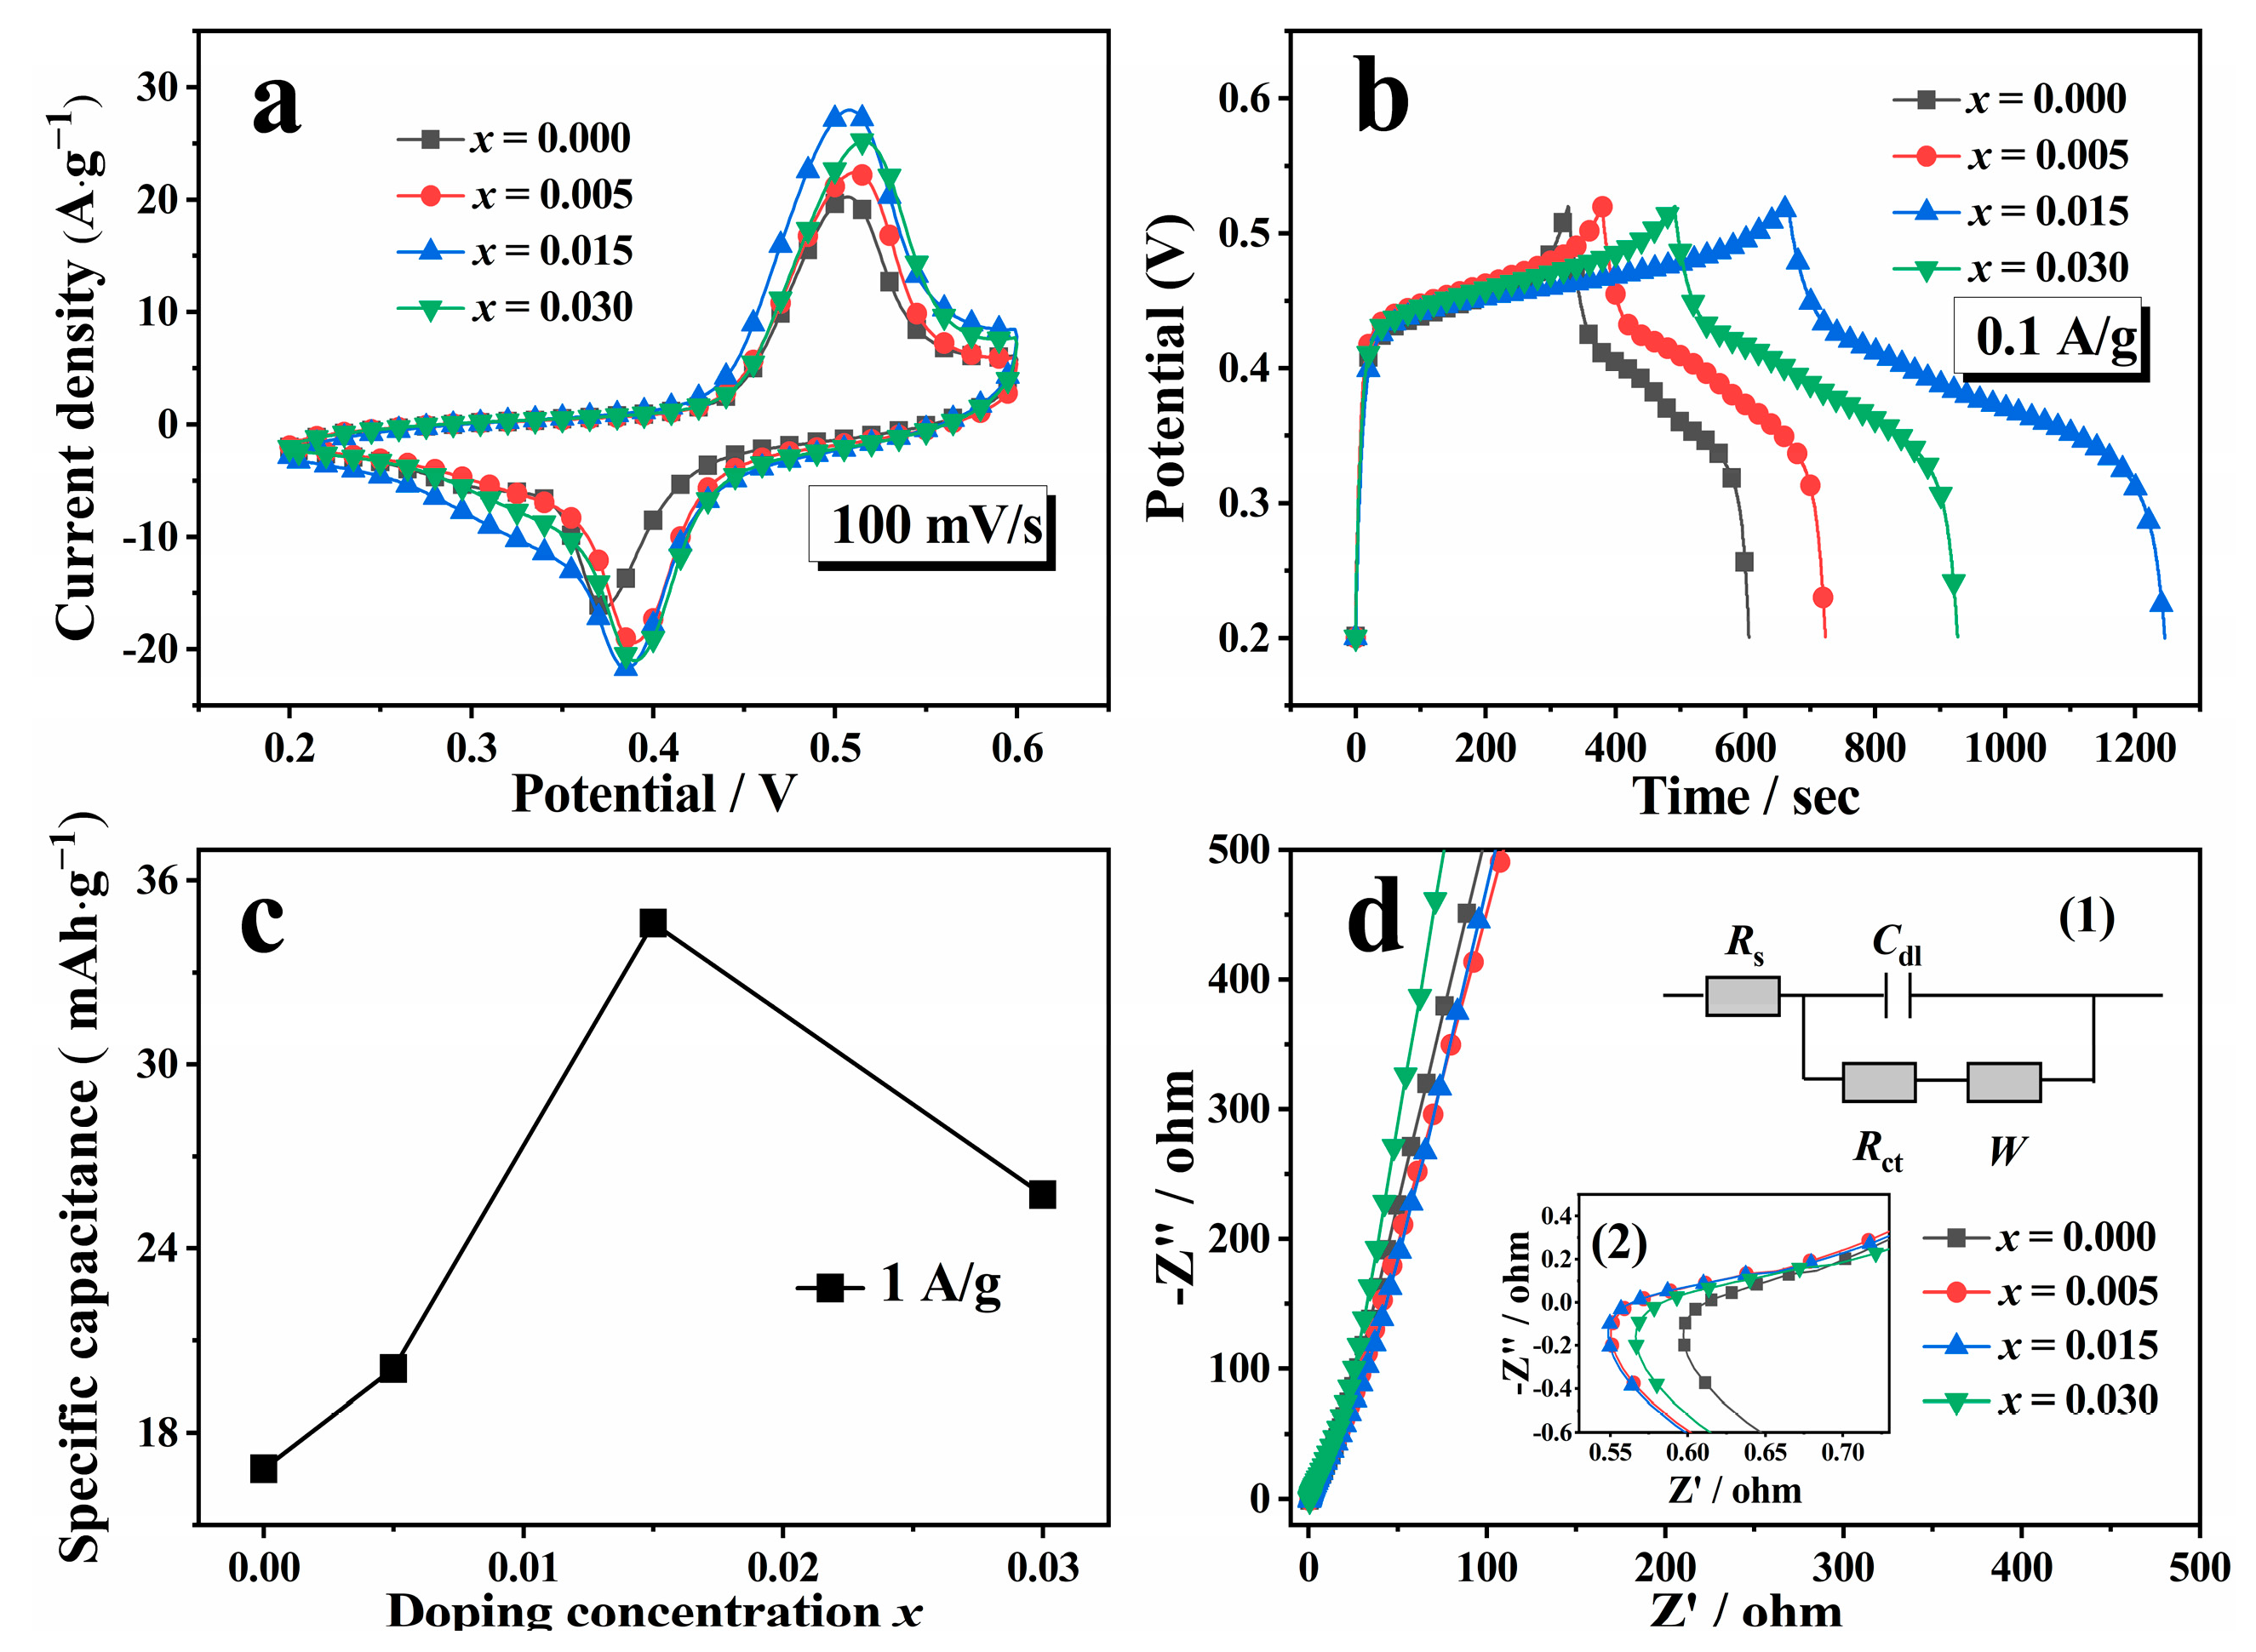
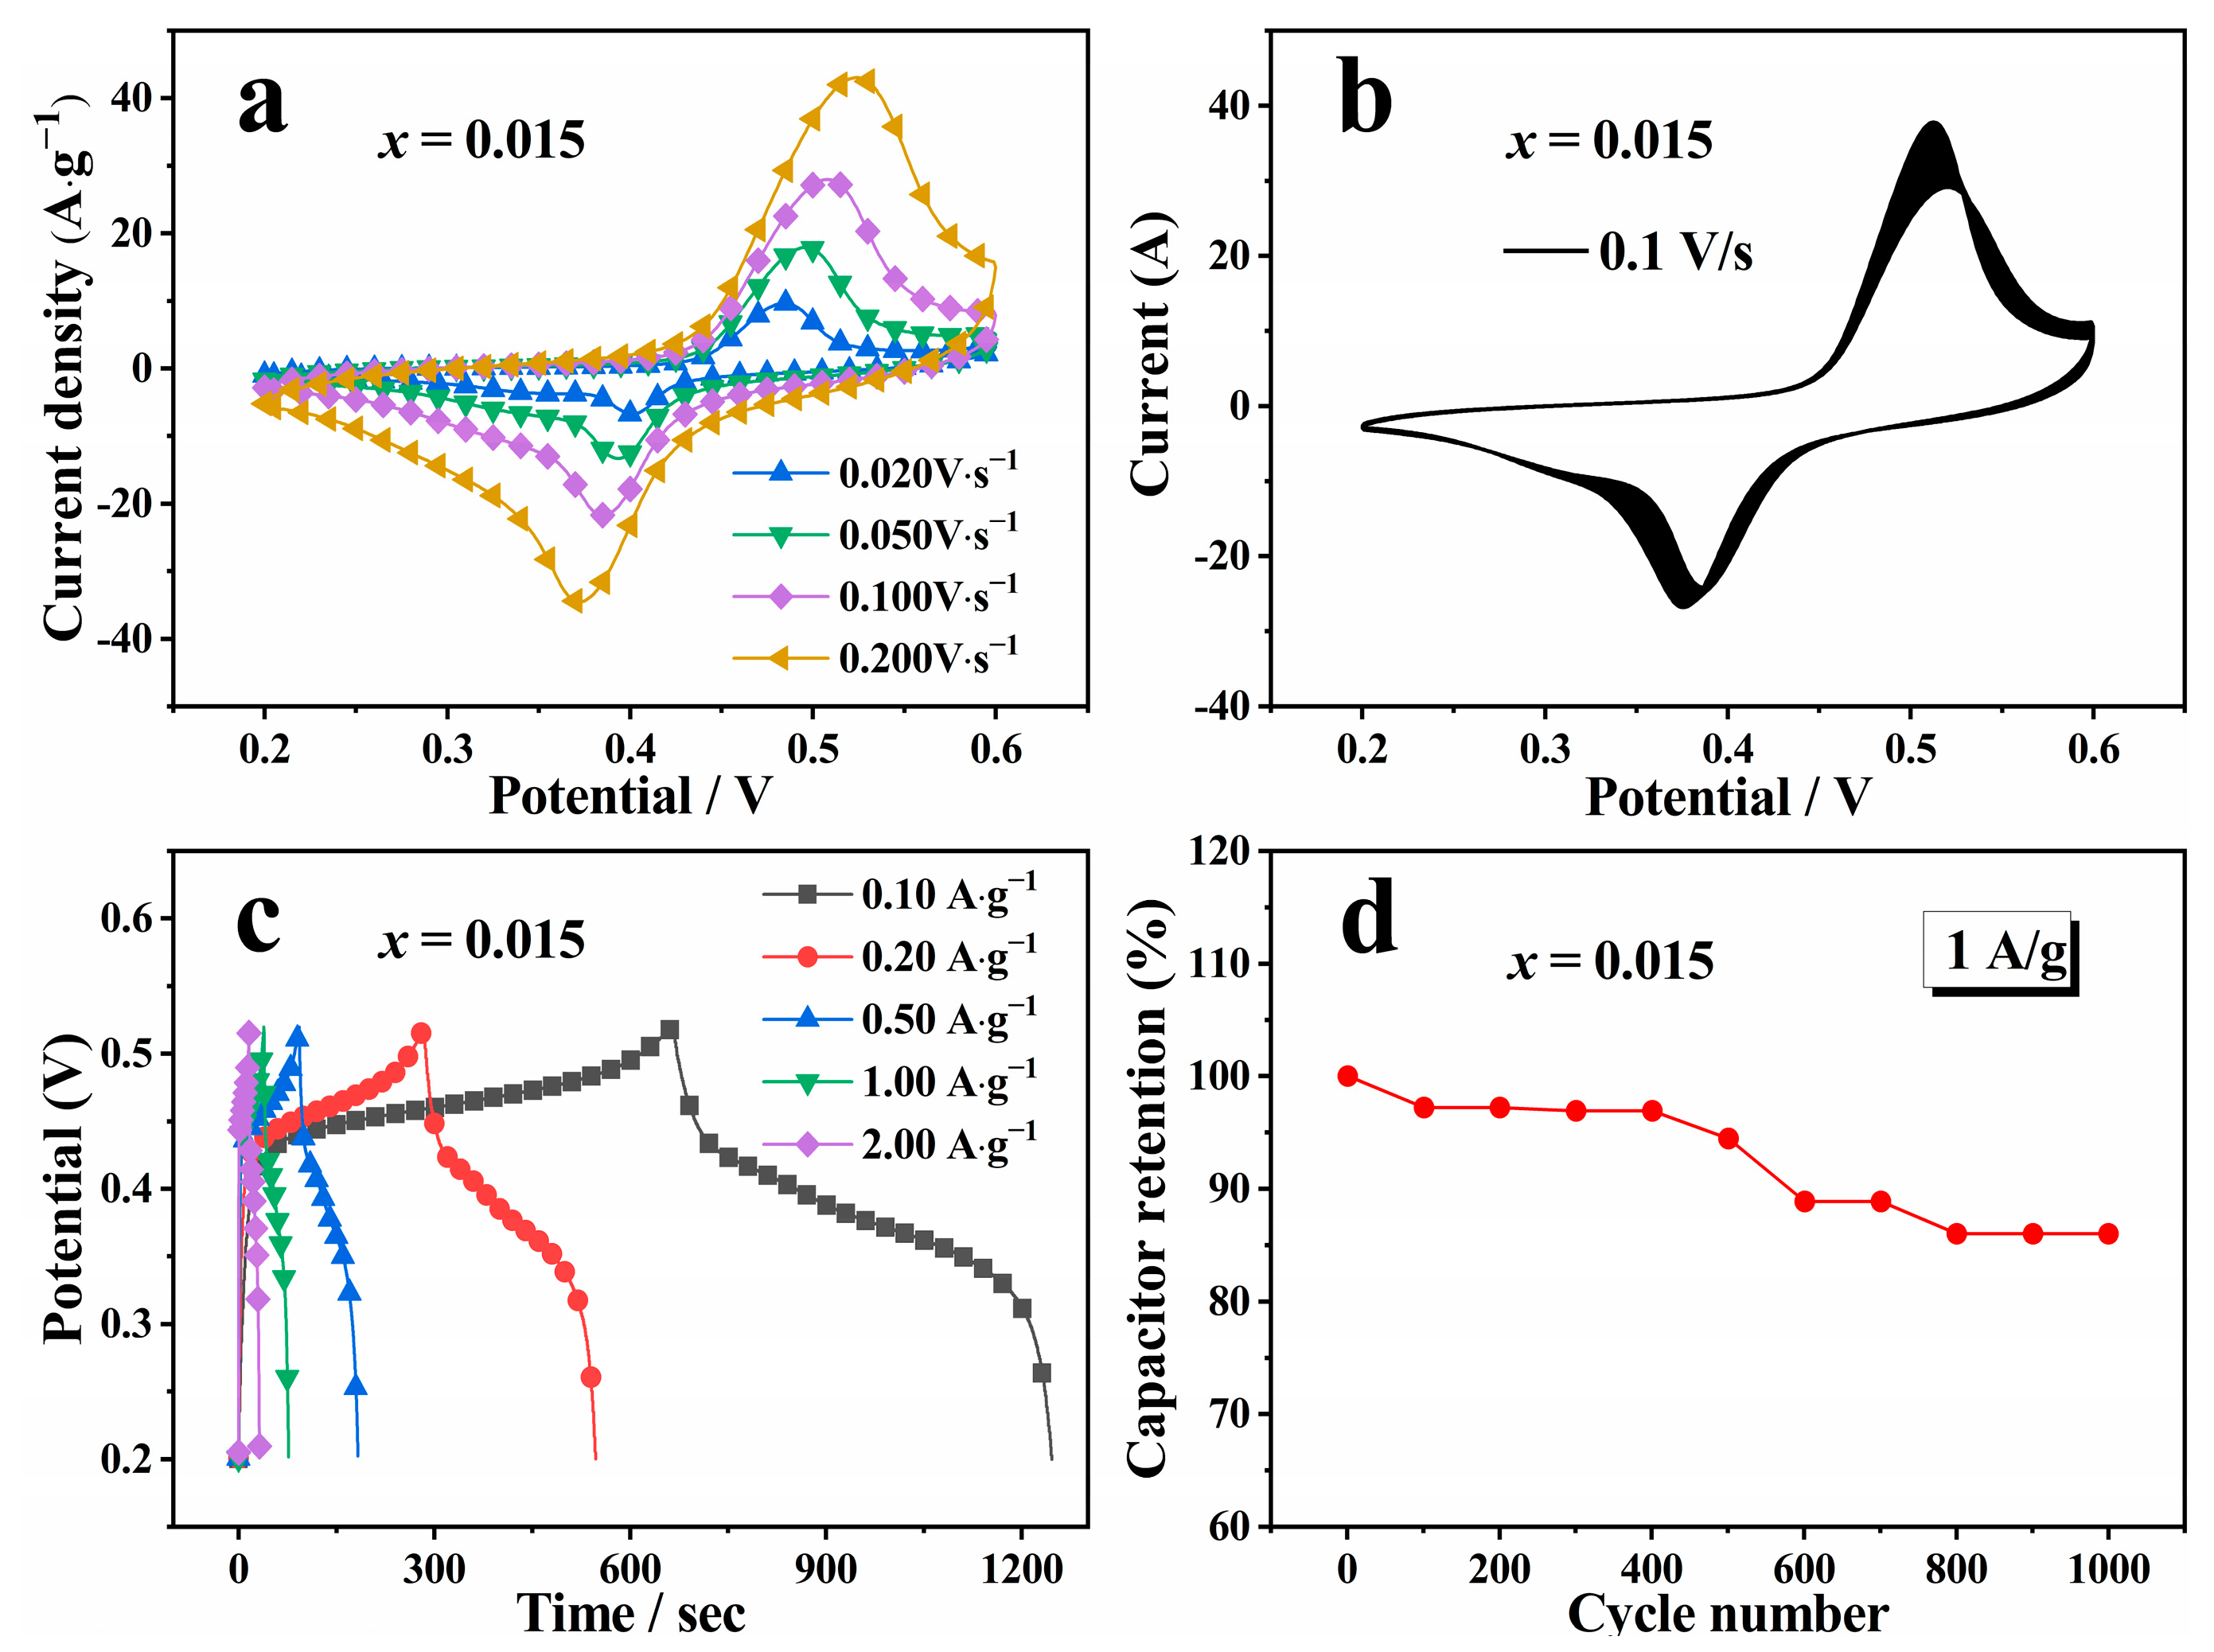
3.2. Electrochemical Performance
4. Conclusions
Author Contributions
Funding
Institutional Review Board Statement
Informed Consent Statement
Data Availability Statement
Conflicts of Interest
References
- Bella, F.; Griffini, G.; Correa, J.P.; Saracco, G.; Gratzel, M.; Hagfeldt, A.; Turri, S.; Gerbaldi, C. Improving efficiency and stability of perovskite solar cells with photocurable fluoropolymers. Science 2016, 354, 203–206. [Google Scholar] [CrossRef] [PubMed]
- Yang, Z.G.; Zhang, J.L.; Kintner-Meyer, M.C.W.; Lu, X.C.; Choi, D.W.; Lemmon, J.P.; Liu, J. Electrochemical energy storage for green grid. Chem. Rev. 2011, 111, 3577–3613. [Google Scholar] [CrossRef] [PubMed]
- Huie, M.M.; Bock, D.C.; Takeuchi, E.S.; Marschilok, A.C.; Takeuchi, K.J. Cathode materials for magnesium and magnesium-ion based batteries. Coord. Chem. Rev. 2015, 287, 15–27. [Google Scholar]
- Liu, Q.; Hu, Z.; Zhang, Y.; Xing, G.; Tang, Y.; Chou, S. Designing Advanced Vanadium-Based Materials to Achieve Electrochemically Active Multielectron Reactions in Sodium/Potassium-Ion Batteries. Adv. Energy Mater. 2020, 10, 2002244. [Google Scholar]
- Liu, J.; Xu, C.; Chen, Z.; Ni, S.; Shen, Z. Progress in aqueous rechargeable batteries. Green Energy Environ. 2018, 3, 20–41. [Google Scholar] [CrossRef]
- Chen, X.; Wang, L.; Li, H.; Cheng, F.; Chen, J. Porous V2O5 nanofibers as cathode materials for rechargeable aqueous zinc-ion batteries. J. Energy Chem. 2019, 38, 20–25. [Google Scholar] [CrossRef]
- Zhang, Y.; Chen, A.; Sun, J. Promise and challenge of vanadium-based cathodes for aqueous Zinc-ion batteries. J. Energy Chem. 2021, 54, 655–667. [Google Scholar] [CrossRef]
- Wan, F.; Niu, Z. Design Strategies for Vanadium-based Aqueous Zinc-Ion Batteries. Angew. Chem. Int. Ed. 2019, 58, 16358–16367. [Google Scholar] [CrossRef]
- Wei, Q.; Liu, J.; Feng, W.; Sheng, J.; Tian, X.; He, L.; An, Q.; Mai, L. Hydrated vanadium pentoxide with superior sodium storage capacity. J. Mater. Chem. A 2015, 3, 8070. [Google Scholar] [CrossRef]
- Wang, W.; Jiang, B.; Hu, L.; Lin, Z.; Hou, J.; Jiao, S. Single crystalline VO2 nanosheets: A cathode material for sodi-um-ion batteries with high rate cycling performance. J. Power Source 2014, 250, 181. [Google Scholar] [CrossRef]
- Liu, Y.; Wu, X. Review of vanadium-based electrode materials for rechargeable aqueous zinc ion batteries. J. Energy Chem. 2021, 56, 223–237. [Google Scholar] [CrossRef]
- Zhao, Q.; Jiao, L.; Peng, W.; Gao, H.; Yang, J.; Wang, Q.; Du, H.; Li, L.; Qi, Z.; Si, Y.; et al. Facile synthesis of VO2(B)/carbon nanobelts with high capacity and good cyclability. J. Power Source 2012, 199, 350–354. [Google Scholar] [CrossRef]
- Wang, F.; Liu, Y.; Liu, C.Y. Hydrothermal synthesis of carbon/vanadium dioxide core–shell microspheres with good cycling performance in both organic and aqueous electrolytes. Electrochim. Acta 2010, 55, 2662–2666. [Google Scholar] [CrossRef]
- Liu, G.; Du, Y.; Liu, W.; Wen, L. Study on the action mechanism of doping transitional elements in spinel LiNi0.5Mn1.5O4. Electrochim. Acta 2016, 209, 308–314. [Google Scholar] [CrossRef]
- Huang, H.; Tian, T.; Pan, L.; Chen, X.; Tervoort, E.; Shih, C.J.; Niederberger, M. Layered metal vanadates with different interlayer cations for high-rate Na-ion storage. J. Mater. Chem. A 2019, 7, 16109. [Google Scholar] [CrossRef]
- Liu, D.; Zhang, Q.; Ding, S.; Yan, F.; Dai, H.; Li, T.; Xue, R.; Chen, J.; Gong, G.; Shang, C.; et al. Microdefects evolution and electrochemical performance modulation of Mn doped VO2(B) nanorods. J. Alloys Compd. 2022, 911, 164975. [Google Scholar] [CrossRef]
- Fang, D.L.; Li, J.C.; Liu, X.; Huang, P.F.; Xu, T.R.; Qian, M.C.; Zheng, C.H. Synthesis of a Co-Ni doped LiMn2O4 spinel cathode material for high-power Li-ion batteries by a sol-gel mediated solid-state route. J. Alloys Compd. 2015, 640, 82–89. [Google Scholar] [CrossRef]
- Akkila, T.; Mansur Basha, I. Study of structural, morphological and optical properties of nano-structured zinc doped V2O5 thin films. J. Pure Appl. Sci. Technol. 2018, 8, 18–33. [Google Scholar]
- Cui, Y.Y.; Liu, B.; Chen, L.L.; Luo, H.J.; Gao, Y.F. Formation energies of intrinsic point defects in monoclinic VO2 studied by first-principles calculations. AIP Adv. 2016, 6, 105301–105309. [Google Scholar] [CrossRef]
- Wang, X.; Wang, Z.; Zhang, G.; Jiang, J. Insight into electronic and structural reorganizations for defect-induced VO2 metal-insulator transition. J. Phys. Chem. Lett. 2017, 8, 3129–3132. [Google Scholar] [CrossRef]
- Kumar, N.S.; Chang, J.H.; Ho, M.-S.; Balraj, B.; Chandrasekar, S.; Mohanbabu, B.; Gowtham, M.; Guo, D.; Mohanraj, K. Impact of Zn2+ Doping on the Structural, Morphological and Photodiode Properties of V2O5 Nanorods. J. Inorg. Organomet. Polym. Mater. 2020, 31, 1066–1078. [Google Scholar] [CrossRef]
- Dai, H.; Ye, F.; Chen, Z.; Li, T.; Liu, D. The effect of ion doping at different sites on the structure, defects and multiferroic properties of BiFeO3 ceramics. J. Alloys Compd. 2018, 734, 60–65. [Google Scholar] [CrossRef]
- Qi, X.; Dho, J.; Tomov, R.; Blamire, M.G.; MacManus-Driscoll, J.L. Greatly reduced leakage current and conduction mechanism in aliovalent-ion-doped BiFeO3. Appl. Phys. Lett. 2005, 86, 062903. [Google Scholar] [CrossRef]
- Puska, M.J.; Nieminen, R.M. Theory of positrons in solids and on solid surfaces. Rev. Mod. Phys. 1994, 66, 841. [Google Scholar] [CrossRef]
- Wang, M.; Dai, H.; Li, T.; Chen, J.; Yan, F.; Xue, R.; Xing, X.; Chen, D.; Ping, T.; He, J. The evolution of structure and properties in GdMn(1−x)TixO3 ceramics. J. Mater. Sci. Mater. Electron. 2021, 32, 27348–27361. [Google Scholar] [CrossRef]
- Wang, H.; Wang, M.; Tang, Y. A novel zinc-ion hybrid supercapacitor for long-life and low-cost energy storage applications. Energy Storage Mater. 2018, 13, 1–7. [Google Scholar] [CrossRef]
- Wu, X.; Tao, Y.; Dong, L.; Wang, Z.; Hu, Z. Preparation of VO2 nanowires and their electric characterization. Mater. Res. Bull. 2005, 40, 315–321. [Google Scholar] [CrossRef]
- Li, N.; Huang, W.; Shi, Q.; Zhang, Y.; Song, L. A CTAB-assisted hydrothermal synthesis of VO2 (B) nanostructures for lithium-ion battery application. Ceram. Int. 2013, 39, 6199–6206. [Google Scholar] [CrossRef]
- Wang, X.; Xi, B.; Ma, X.; Feng, Z.; Jia, Y.; Feng, J.; Qian, Y.; Xiong, S. Boosting Zinc-Ion Storage Capability by Effectively Suppressing Vanadium Dissolution Based on Robust Layered Barium Vanadate. Nano Lett. 2020, 20, 2899–2906. [Google Scholar] [CrossRef]
- Ma, Y.; Zhu, X.; Wang, B.; Liu, S.; Meng, T.; Chen, H.; Peng, B.; Deng, Z. Sacrificial template synthesis of hierarchical nickel hydroxidenitrate hollow colloidal particles for electrochemical energy storage. Chem. Eng. Sci. 2020, 217, 115548. [Google Scholar] [CrossRef]
- Yang, H.; Cheng, Z.; Wu, P.; Wei, Y.; Jiang, J.; Xu, Q. Deep eutectic solvents regulation synthesis of multi-metal oxalate for electrocatalytic oxygen evolution reaction and supercapacitor applications. Electrochim. Acta 2022, 427, 140879. [Google Scholar] [CrossRef]
- Mahadi, N.B.; Park, J.S.; Park, J.H.; Chung, K.Y.; Yi, S.Y.; Sun, Y.K.; Myung, S.T. Vanadium dioxide-reduced graphene oxide composite as cathode materials for rechargeable Li and Na batteries. J. Power Source 2016, 326, 522–532. [Google Scholar] [CrossRef]
- Liu, Q.; Tan, G.Q.; Wang, P.; Abeyweera, S.C.; Zhang, D.T.; Rong, Y.C.; Wu, Y.A.; Lu, J.; Sun, C.J.; Ren, Y.; et al. Revealing mechanism responsible for structural reversibility of single-crystal VO2 nanorods upon lithiation/delithiation. Nano Energy 2017, 36, 197–205. [Google Scholar] [CrossRef]


| Doping Concentration | Lattice Parameters | β | |||
|---|---|---|---|---|---|
| x | a (Å) | b (Å) | c (Å) | V (Å3) | |
| 0.000 | 12.0707 | 3.6958 | 6.4270 | 274.23 | 106.966 |
| 0.005 | 12.0801 | 3.6943 | 6.4411 | 275.02 | 106.909 |
| 0.015 | 12.0759 | 3.6981 | 6.4319 | 274.81 | 106.906 |
| 0.030 | 12.0842 | 3.6925 | 6.4552 | 275.57 | 106.912 |
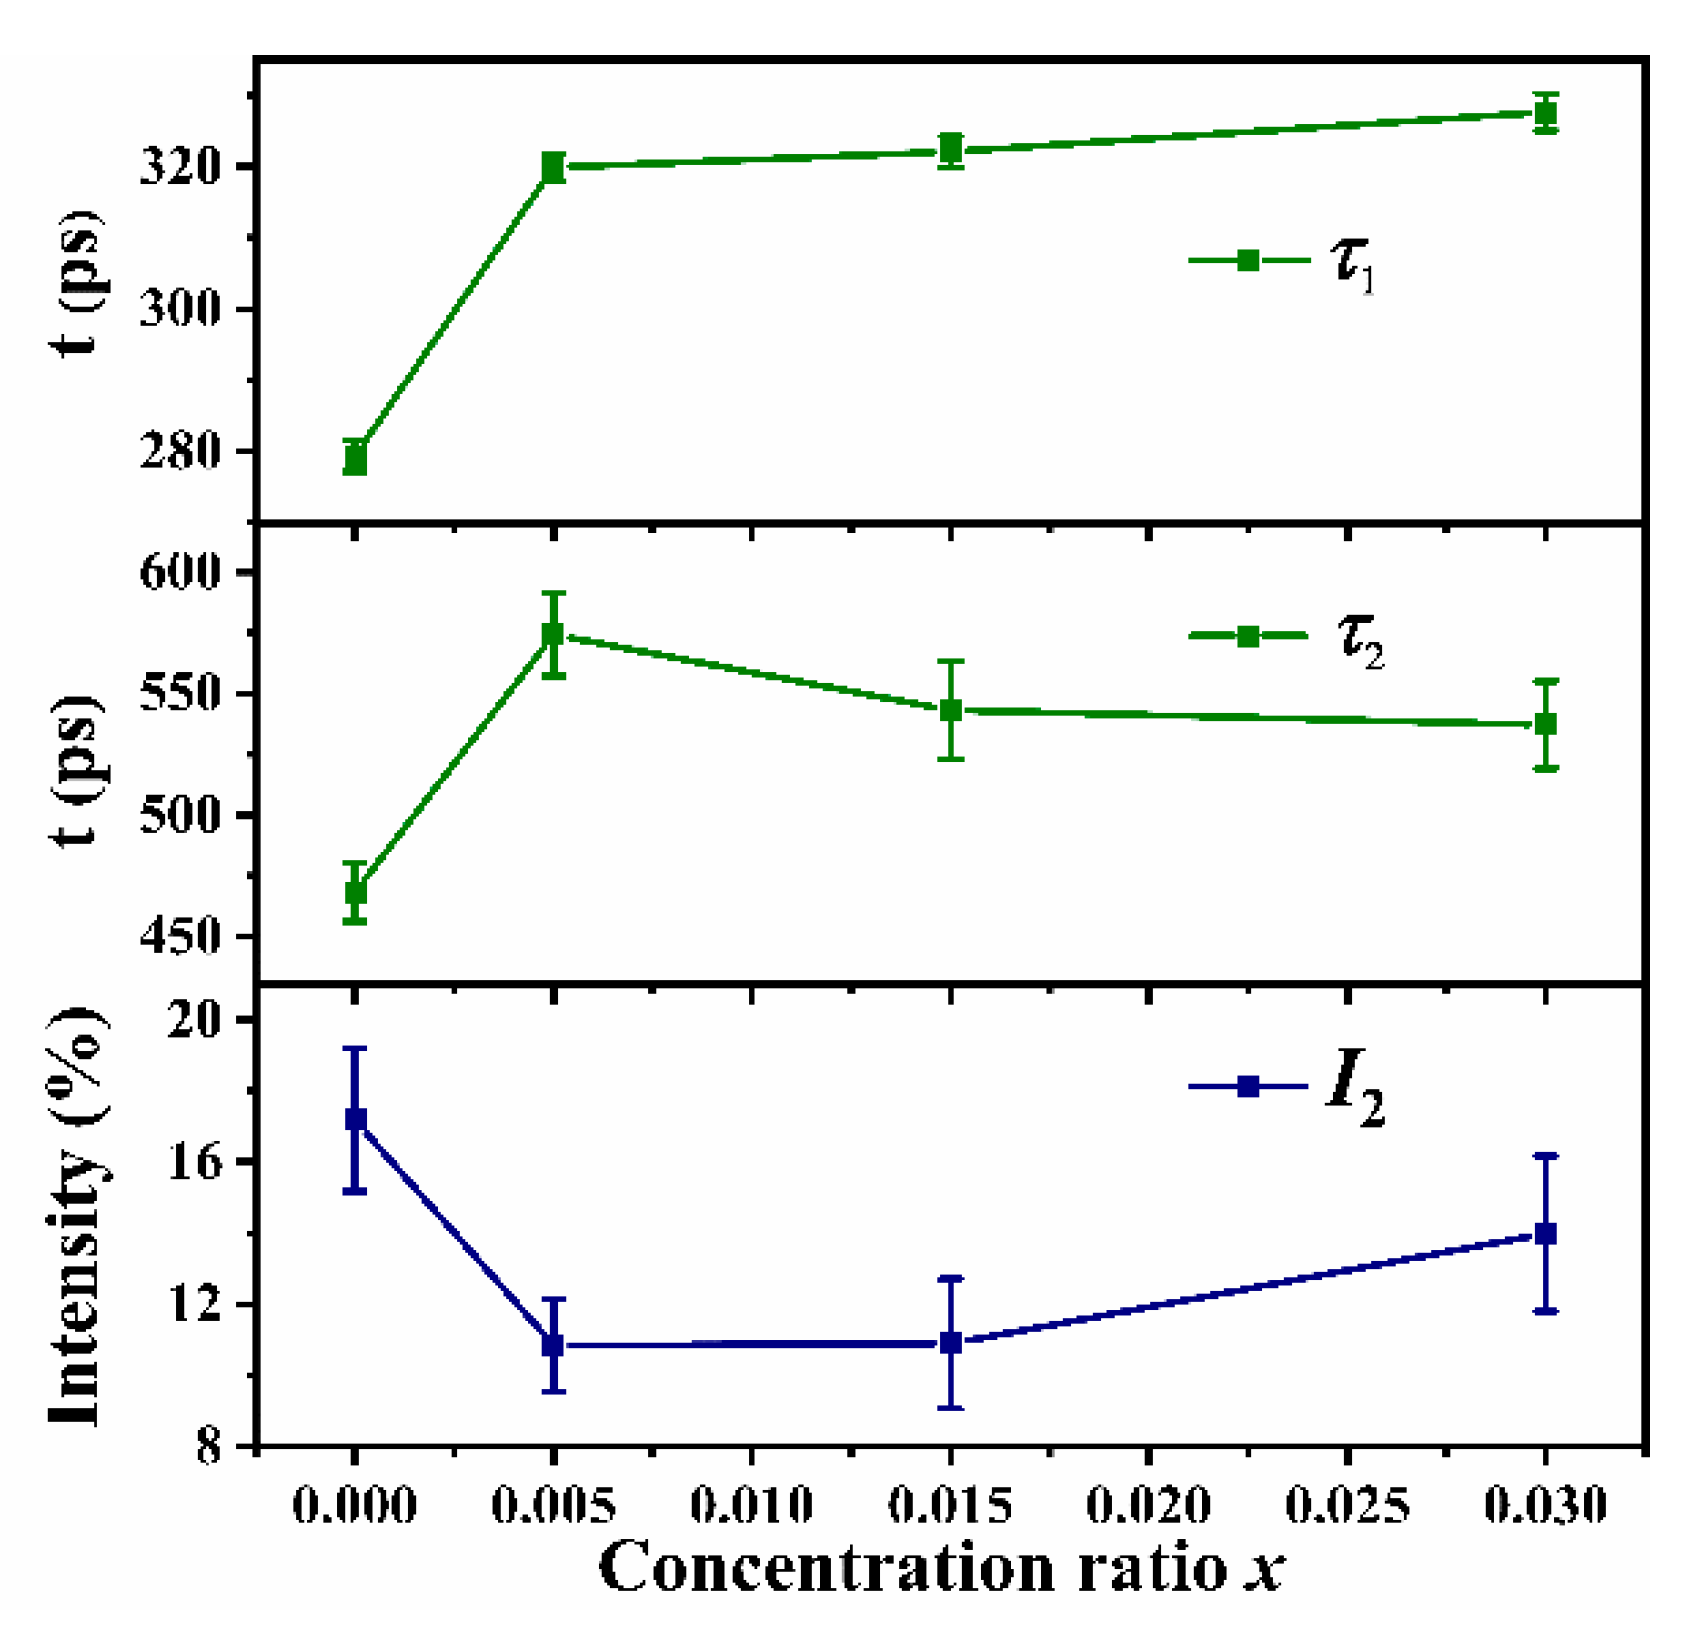
| Sample | Positron Lifetime/ps | Intensity/% | Bulk Lifetime/ps | Mean Lifetime/ps | ||
|---|---|---|---|---|---|---|
| x | τ1 | τ2 | I1 | I2 | τb | τm |
| 0.000 | 279.4 | 468.4 | 82.8177 | 17.1823 | 300.2141 | 311.8745 |
| 0.005 | 319.9 | 574.2 | 89.1532 | 10.8468 | 336.0428 | 347.4834 |
| 0.015 | 322.1 | 543.1 | 89.1115 | 10.8885 | 337.0332 | 346.1636 |
| 0.030 | 327.7 | 537.2 | 86.0118 | 13.9882 | 346.6081 | 357.0053 |
Publisher’s Note: MDPI stays neutral with regard to jurisdictional claims in published maps and institutional affiliations. |
© 2022 by the authors. Licensee MDPI, Basel, Switzerland. This article is an open access article distributed under the terms and conditions of the Creative Commons Attribution (CC BY) license (https://creativecommons.org/licenses/by/4.0/).
Share and Cite
Liu, D.; Zhang, Q.; Chen, X.; Dai, H.; Zhai, X.; Chen, J.; Gong, G.; Shang, C.; Wang, X. Microstructure Modulation of Zn Doped VO2(B) Nanorods with Improved Electrochemical Properties towards High Performance Aqueous Batteries. Batteries 2022, 8, 172. https://doi.org/10.3390/batteries8100172
Liu D, Zhang Q, Chen X, Dai H, Zhai X, Chen J, Gong G, Shang C, Wang X. Microstructure Modulation of Zn Doped VO2(B) Nanorods with Improved Electrochemical Properties towards High Performance Aqueous Batteries. Batteries. 2022; 8(10):172. https://doi.org/10.3390/batteries8100172
Chicago/Turabian StyleLiu, Dewei, Qijie Zhang, Xiaohong Chen, Haiyang Dai, Xuezhen Zhai, Jing Chen, Gaoshang Gong, Cui Shang, and Xuzhe Wang. 2022. "Microstructure Modulation of Zn Doped VO2(B) Nanorods with Improved Electrochemical Properties towards High Performance Aqueous Batteries" Batteries 8, no. 10: 172. https://doi.org/10.3390/batteries8100172
APA StyleLiu, D., Zhang, Q., Chen, X., Dai, H., Zhai, X., Chen, J., Gong, G., Shang, C., & Wang, X. (2022). Microstructure Modulation of Zn Doped VO2(B) Nanorods with Improved Electrochemical Properties towards High Performance Aqueous Batteries. Batteries, 8(10), 172. https://doi.org/10.3390/batteries8100172