Article

Study of SOC Estimation by the Ampere-Hour Integral Method with Capacity Correction Based on LSTM

1
School of Automobile and Traffic, Shenyang Ligong University, Shenyang 110159, China
2
School of Information Science and Engineering, Shenyang Ligong University, Shenyang 110159, China
*
Author to whom correspondence should be addressed.
Batteries 2022, 8(10), 170; https://doi.org/10.3390/batteries8100170
Submission received: 12 July 2022 / Revised: 15 September 2022 / Accepted: 30 September 2022 / Published: 9 October 2022

Abstract

:
The estimation of the state of charge (SOC) of a battery’s power is one of the key technologies in a battery management system (BMS). As a common SOC estimation method, the traditional ampere-hour integral method regards the actual capacity of the battery, which is constantly changed by the usage conditions and environment, as a constant for calculation, which may cause errors in the results of SOC estimation. Considering the above problems, this paper proposes an improved ampere-hour integral method based on the Long Short-Term Memory (LSTM) network model. The LSTM network model is used to obtain the actual battery capacity variation, replacing the fixed value of battery capacity in the traditional ampere-hour integral method and optimizing the traditional ampere-hour integral method to improve the accuracy of the SOC estimation method. The experimental results show that the errors of the results obtained by the improved ampere-hour integral method for the SOC estimation are all less than 10%, which proves that the proposed design method is feasible and effective.

Graphical Abstract

1. Introduction

With high energy density, low environmental pollution, and long cycle life, lithium-ion batteries are often used to power electric or hybrid vehicles [1]. In order to ensure the driving safety of the whole vehicle and monitor the power battery status, a battery management system (BMS) must be equipped [2]. The estimation of the state of charge (SOC) of the battery power is one of the most basic and core functions of the battery management system (BMS); this function is similar to the traditional vehicle fuel gauge [3]. Accurate estimation of the SOC can effectively prevent overcharge and over-discharge of the battery, which is closely related to the safety and reliability of the battery. By estimating the battery SOC in real-time, the driver can know the remaining power of the battery and the time and distance that the car can continue to drive at any time, while ensuring that the battery works safely, prolonging battery life, and improving battery energy utilization [4]. However, unlike other specific physical quantities, the SOC, as a defining quantity standing for the status of the battery, cannot be directly measured. First, the battery management system (BMS) needs to receive the battery voltage, current, temperature, and other information fed back by various sensors; then, it uses the preset SOC estimation method to calculate and obtain SOC. Therefore, it is crucial to choose the correct SOC estimation method.

1.1. Related Work

The open-circuit voltage method (OCV) [5], the internal resistance method [6], the ampere-hour integral method [7], and the Kalman filtering and its extension algorithm [8] are the most common SOC estimation methods. However, the open-circuit voltage method (OCV) is usually not used for real-time SOC estimation, because when using OCV for SOC estimation, the battery needs to be statically processed until in a stable state, so real-time estimation of SOC cannot be performed [9,10]. When using the internal resistance method to measure the SOC value of the battery, it is necessary to measure the internal resistance of the battery first and then infer the SOC value of the battery according to the known relationship between the internal resistance of the battery and the SOC. However, the measurement of the internal resistance is still greatly influenced by the external environment; so, the estimation accuracy is not high when the SOC is estimated by the internal resistance method. The Kalman filtering algorithm can accurately correct the initial value of the SOC and reduce the interference noise [11,12]. It has obvious advantages and disadvantages. The advantage is that the estimation accuracy is high, and the SOC can be dynamically measured; the disadvantage is that it relies heavily on the accuracy of the battery model and has high requirements on the algorithm. The ampere-hour integral method, also known as the coulomb measurement, is one of the most widely used and straightforward SOC estimation methods [13,14]. However, if the current acquisition accuracy is not high enough, accumulated errors will occur. The battery capacity, which changes dynamically with environmental factors, is used as a constant in the traditional ampere-hour integral method, and that will also cause some errors.
We propose an improved ampere-hour integral method, which predicts the actual battery capacity according to the parameters detected during battery use by establishing an LSTM model that uses the predicted actual battery capacity to replace the battery-rated capacity in the traditional ampere-hour integral method. The method optimizes the traditional ampere-hour integral method to achieve real-time SOC estimation while improving the accuracy of the SOC estimation.

1.2. Contributions

The battery is affected by the actual operating conditions and environmental factors. After a prolonged period of use, the actual amount of power that the battery can release will decrease to a certain extent. Therefore, if the actual battery capacity is regarded as a constant, the accuracy of the SOC estimation will be reduced, which will affect the safety of the vehicle. To address such problems in the traditional ampere-hour integral method, we propose an improved ampere-hour integral method.
The main contributions of the paper are the following:
(1)
This paper proposes an SOC estimation method based on an improved ampere-hour integral method; unlike the traditional ampere-hour integral method, which regards battery capacity as a constant, this method fully considers the influence of battery capacity loss on the SOC estimation, which is closer to the actual use of the battery, making the SOC value estimated by the improved ampere-hour integral method more accurate.
(2)
Based on the improved ampere-hour integral method, we propose the following method: first, we build an LSTM neural network model to predict the actual battery capacity; then, we use the obtained predicted value of the actual battery capacity to replace the rated battery capacity in the traditional ampere-hour integral method. First, the factors that affect the actual capacity of the battery are analyzed, and four main influencing factors, namely voltage, current, temperature, and the number of battery cycles are determined. Then, the above four main influencing factors are used as the inputs to the LSTM neural network model to predict the actual capacity of the battery, and the predicted value is a value that changes dynamically with the use of the battery. Finally, the SOC estimation is carried out as follows: the actual battery capacity is predicted based on the LSTM model, and the predicted value is used to replace the rated battery capacity (constant) in the traditional ampere-hour integral method.
(3)
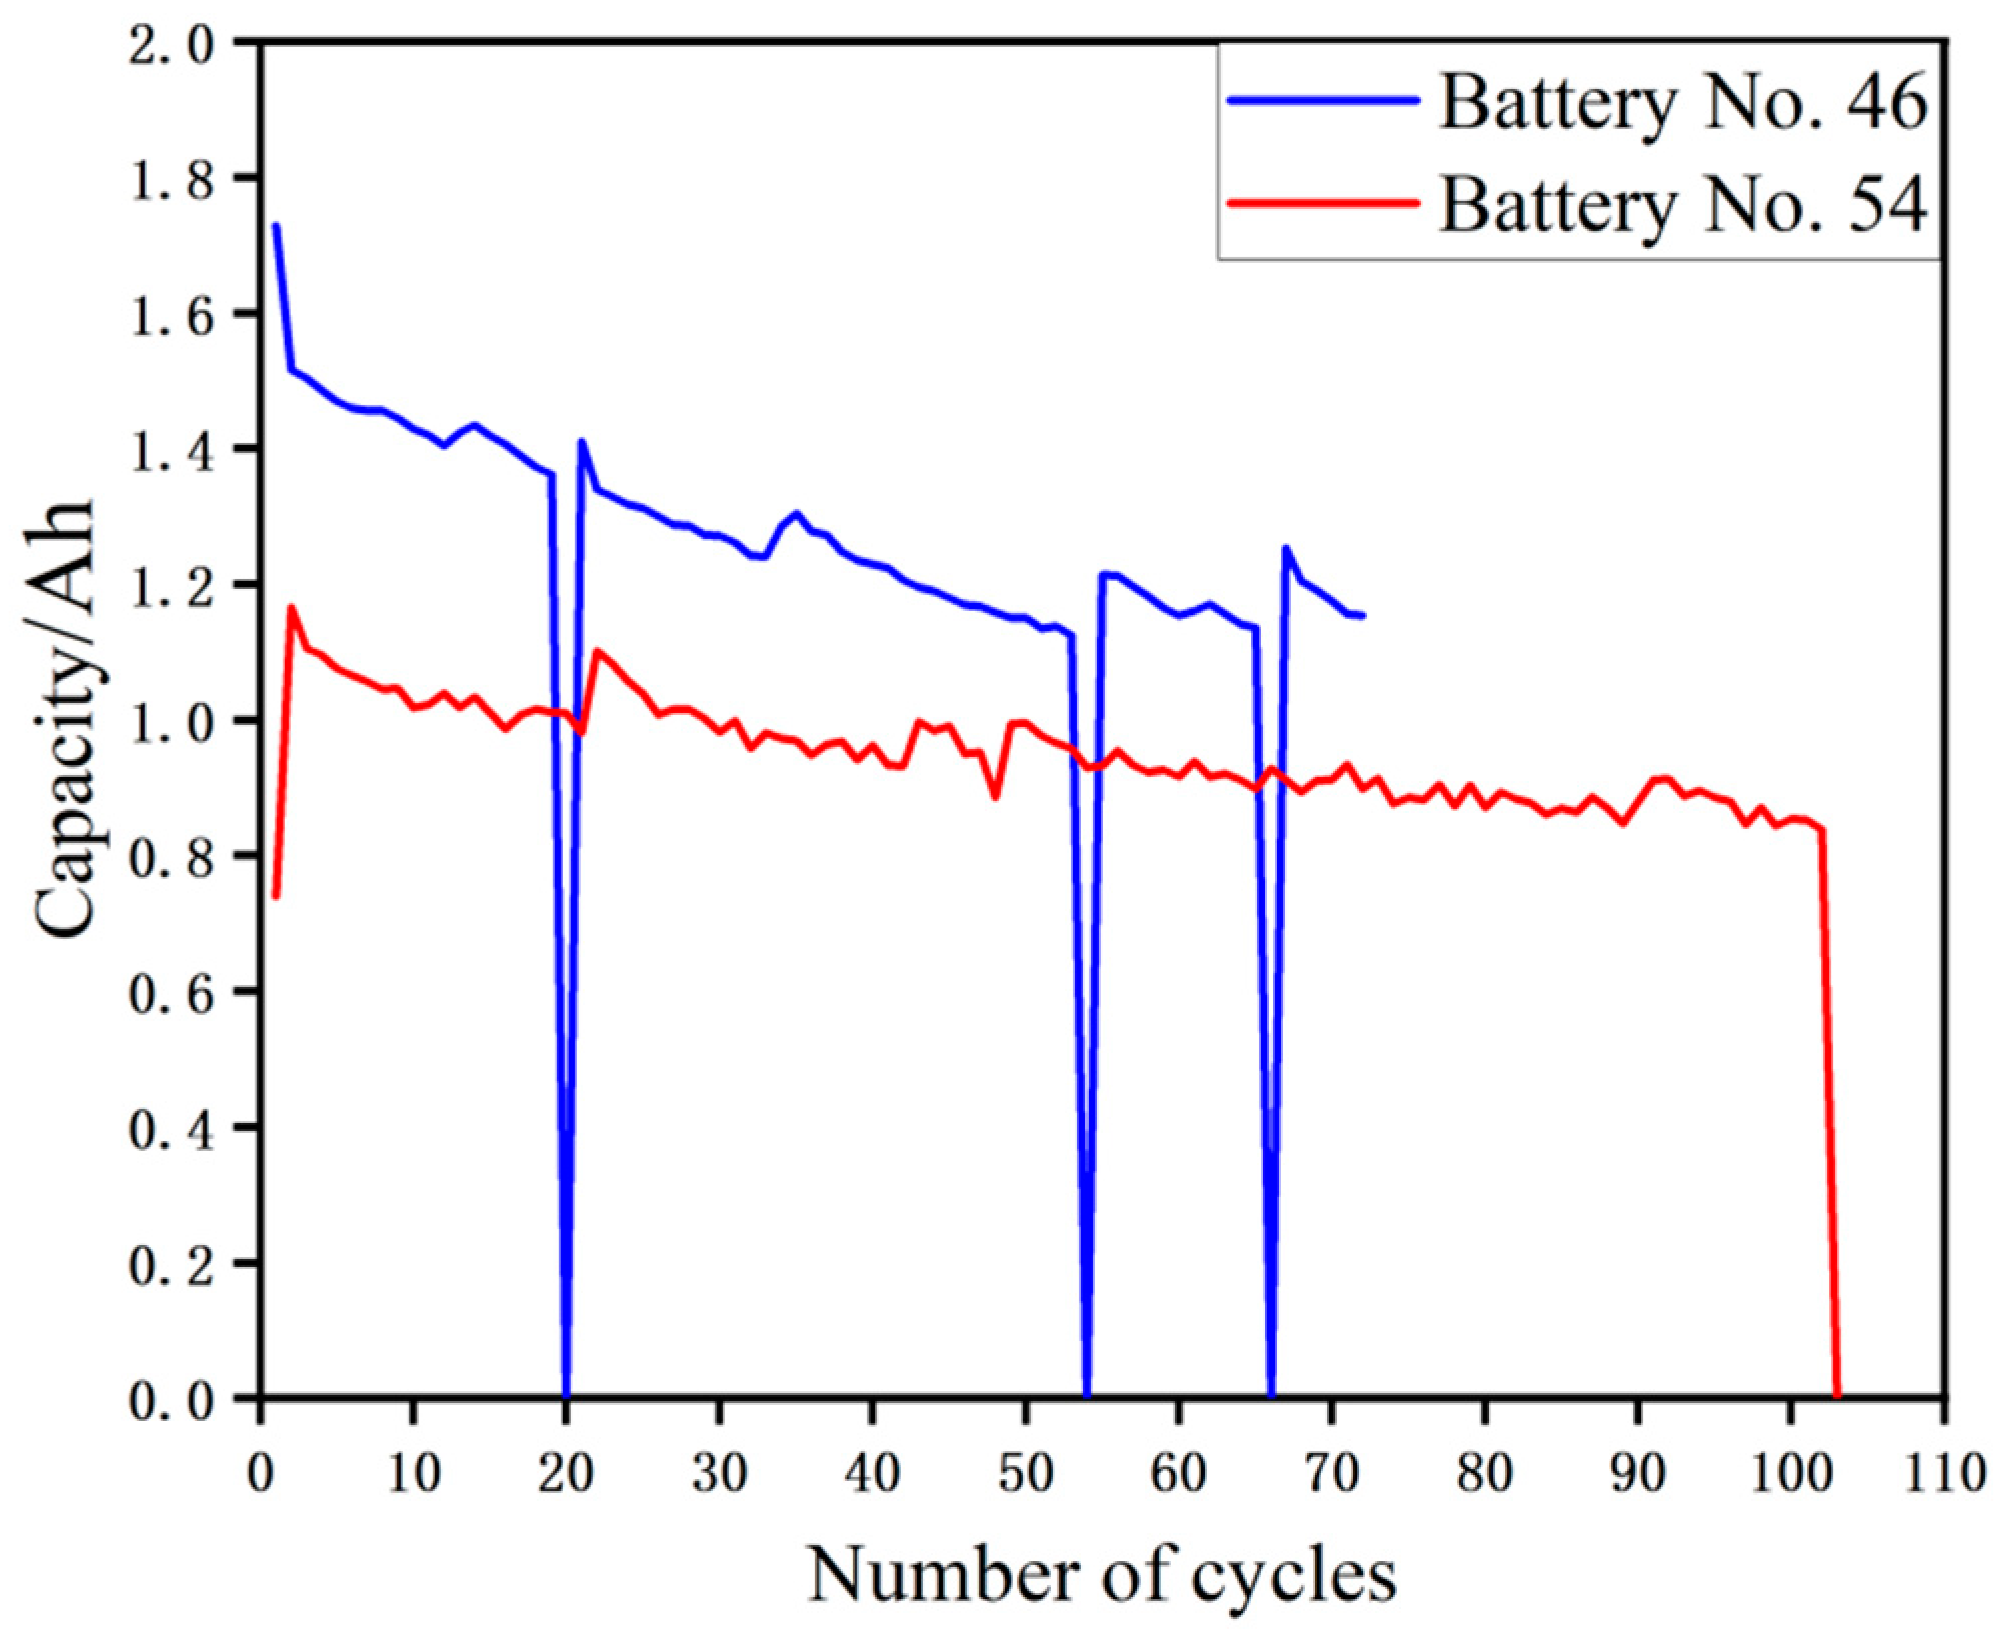
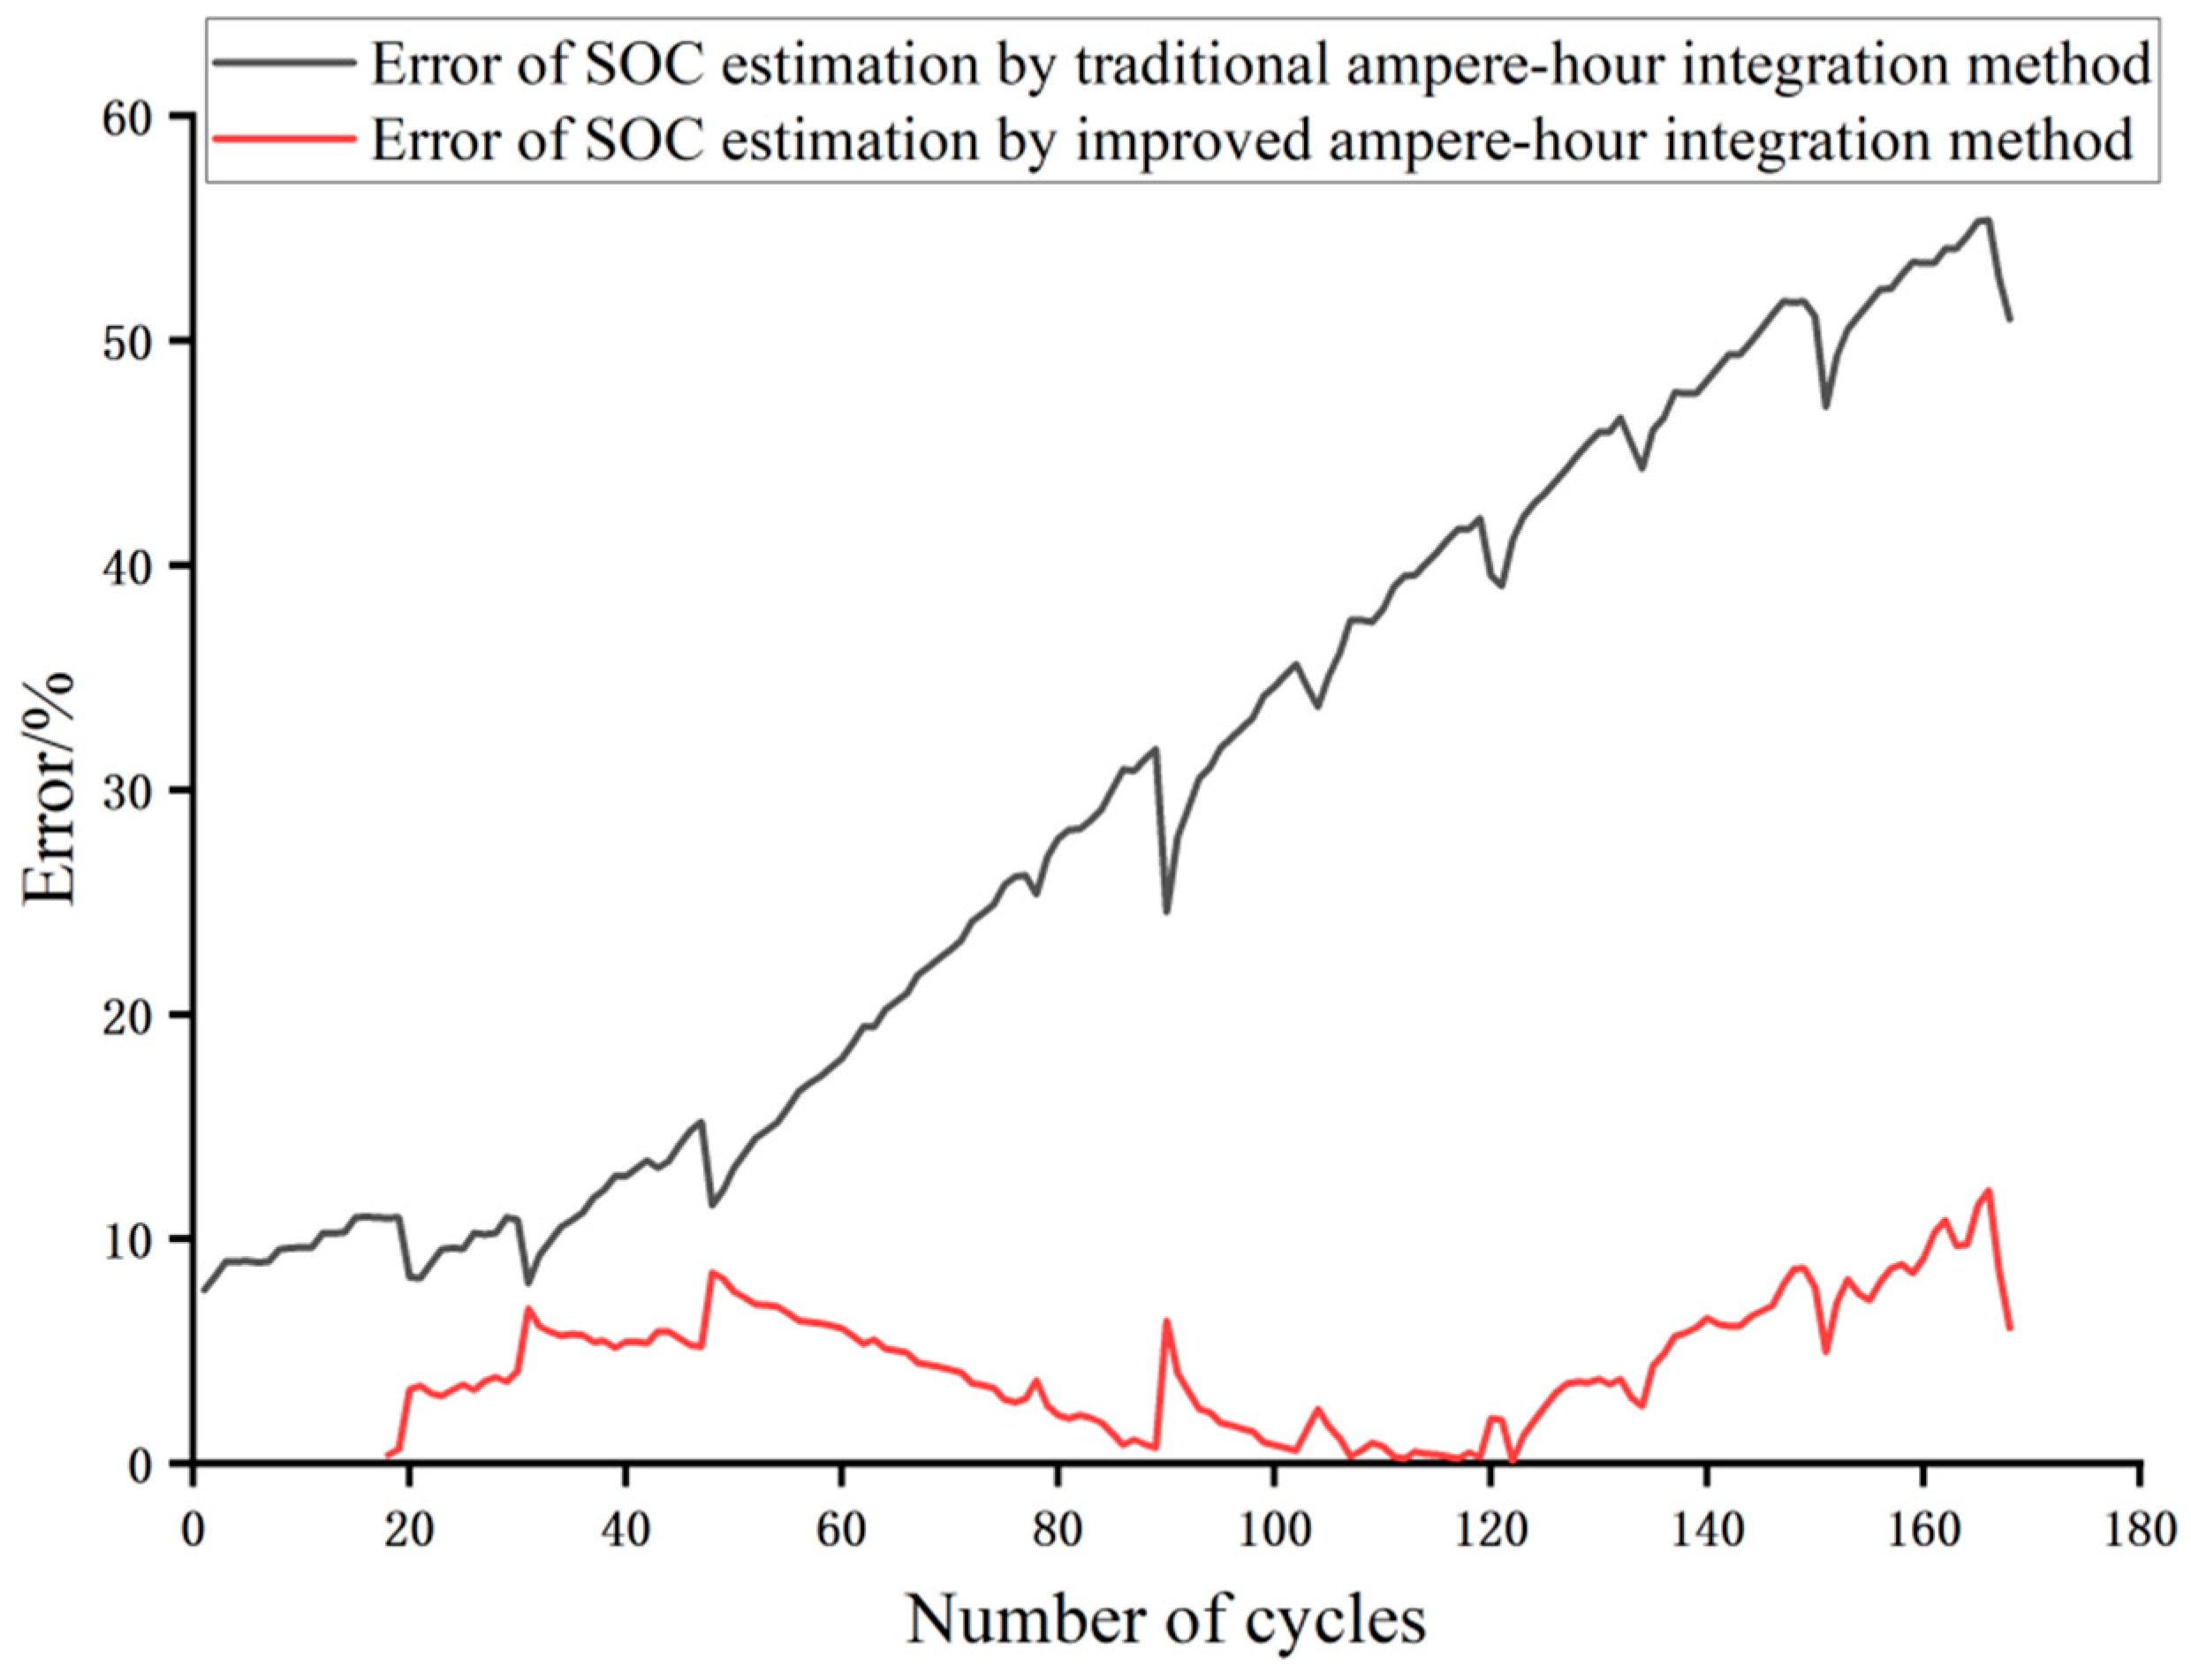
We selected battery data from the NASA-Battery Data Set, conducted a comparative test between the improved ampere-hour integral method and the traditional ampere-hour integral method, and compared the errors caused by the SOC estimation using these two ampere-hour integral methods, respectively.

2. Theoretical Analysis

2.1. Analysis of the Principle of the Ampere-Hour Integral Method

The SOC is defined as follows: under certain conditions, the battery is discharged at the rated rate; after a period of time, this changes, and the SOC is the ratio of the remaining power of the battery to the rated power that can be discharged under the same conditions and at the same rate [15], that is, the remaining power of the battery. It was proposed by the United States Advanced Battery Consortium (USABC) and published in the Electric Vehicle Battery Laboratory Manual [16].
The value of SOC is 0~100%, which means that the battery is completely discharged or filled, respectively, and the expression is
S O C = Q t Q 0 × 100 %
where Q 0 represents the rated capacity of the battery, and Q t is the remaining battery charge in time t.
Since the battery will be affected by different actual usage factors, Equation (1) cannot accurately estimate the value of SOC; hence, based on Equation (1), a relatively accurate calculation formula has been proposed. The calculation formula is as follows:
S O C = ( 1 ξ Q t Q 0 ) × 100 %
where Q i stands for the power discharged by the battery over a certain time, and ξ is the battery efficacy parameter.
In the traditional ampere-hour integral method, when the initial battery power S O C 0 is known, by integrating the battery current in a period and the corresponding time [11], the amount of power Q i released by the battery in this period can be obtained; then, the remaining battery capacity at time t ( S O C t ) can be obtained. Although the effect of the environment on the actual discharge capacity of the battery is not taken into consideration, it improves the accuracy of the true battery discharge Q i , which improves the estimation accuracy of SOC. However, it also increases its dependence on the accuracy of the current data acquisition, which is illustrated as follows,
S O C t = S O C 0 Q i Q 0 × 100 % = S O C 0 1 Q 0 η I ( t ) d t × 100 %
where S O C 0 indicates the initial charge of the battery, S O C t is the remaining power of the battery at time t, Q 0 indicates the rated capacity of the battery, Q i represents the amount of power released by the battery from 0 to t, I ( t ) represents the current and takes the direction of battery discharge current as positive, and η is the charging and discharging efficiency.

2.2. Analysis of the Errors of the Ampere-Hour Integral Method

Based on the most basic SOC estimation method, the traditional ampere-hour integral method improves the accuracy of the SOC estimation to some extent by improving the calculation accuracy of the actual battery discharge amount Q i . However, this method still regards the actual battery capacity as a constant; hence, there are still errors in the SOC estimated by the method, because the actual capacity of the battery is not a fixed value. The actual capacity of a battery is greatly affected by the voltage, current, temperature, and number of battery cycles. Therefore, if the actual capacity of the battery is regarded as a constant in the SOC estimation process, the error of the estimation result will increase as the battery capacity decreases.
All data used in this article are from the NASA-Battery Data Set. The NASA-Battery Data Set has a large amount of dense data, and each sampling interval is small, so the data are “consecutive”, and the model training is adequate. A total of 20 batteries were collected in this dataset. The batteries in this dataset were commercially rechargeable batteries, with a rated capacity of 2 Ah. The NASA-Battery Data Set recorded the battery voltage, current, and temperature changes over time within each cycle, as well as the actual amount of battery discharge, and therefore was applicable to this paper.
Figure 1 shows the SOC estimation results estimated by the traditional ampere-hour integral method at the 1st, 50th, 100th, and 150th discharge cycles of the No.5 battery in the NASA-Battery Data Set.
Theoretically, the SOC value at the end of the battery discharge should be 0. However, as depicted in Figure 1, disregarding the cutoff voltage limit, the SOC estimated by the traditional ampere-hour integral method did not reach the theoretical value of 0, except for the first operating cycle, and the error value of the SOC estimation became larger as the number of cycles increased.
Figure 2 shows the capacity change curves of battery No.7 and battery No.54 in the NASA-Battery Data Set. Both batteries were discharged to 2.2 V at a discharge rate of 1 C. The difference was that the working temperature of battery No.7 was 24 °C and the working temperature of battery No.54 was 4 °C. The figure shows that the capacity of battery No.7 fluctuated less, the capacity decreased steadily, and the battery life was longer. In contrast, the capacity changes of battery No.54 fluctuated more, there were sharp changes or even 0, the battery life was shorter, and the battery capacity was generally less than battery No.7. This is because the battery was used in low-temperature conditions; low temperature reduces battery chemical activity, which in turn accelerates the aging of the battery. In summary, after analysis, we can conclude that temperature significantly influences the battery’s capacity and service life.
As shown in Figure 3, with the capacity change curves of battery No.46 and battery No.54 in the NASA-Battery Data Set, both batteries were discharged to 2.2 V at 4 °C, where the discharge rate of battery No.46 was 0.5 C, and the discharge rate of battery No.54 was 1 C. The capacity of battery No.54 was generally smaller than that of battery No.46. This is because when other conditions are constant, the internal resistance loss of the battery will increase with the increase in the battery discharge rate, resulting in a decrease in the actual power released by the battery.
Based on the above analysis of the actual capacity battery changes, it can be seen that the change of the actual battery capacity is an inevitable phenomenon of battery aging, the process is a complicated nonlinear, and the actual capacity will be declined as the number of battery usage cycle increases, which will also be affected by the influence of factors such as voltage, current, temperature, and there is a certain correlation between various influencing factors [17]. So, the traditional ampere-hour integral method regards the dynamically changing actual capacity of the battery as a constant, which increases the error of the estimation result as the battery is used for a longer time. Therefore, we propose an improved ampere-hour integral method, which can not only predict the actual capacity of the battery but also optimize the traditional ampere-hour integral method and improve the accuracy of SOC estimation.

2.3. Principle Analysis of Improved Ampere-Hour Integral Method

Based on the above analysis, we propose an improved ampere-hour integral method. By analyzing the main factors affecting the actual battery capacity, such as voltage, current, temperature, and the number of battery cycles, we propose to apply an LSTM neural network to predict the actual battery capacity Q and bring Q into Equation (3), replacing the rated battery capacity Q 0 in the original equation, to obtain Equation (4). Q varies dynamically according to battery use and is closer to the actual battery use than the constant Q 0 , making the SOC values estimated by the improved ampere-hour integral method more accurate.
S O C t = S O C 0 1 Q η I ( t ) d t × 100 %
where S O C 0 stands for the initial battery charge, S O C t is the remaining battery charge representing time t, Q indicates the actual power that the battery can discharge through the LSTM neural network model, I ( t ) represents the current and takes the direction of battery discharge current as positive, and η is the charging and discharging efficiency.

3. Prediction of Actual Battery Capacity

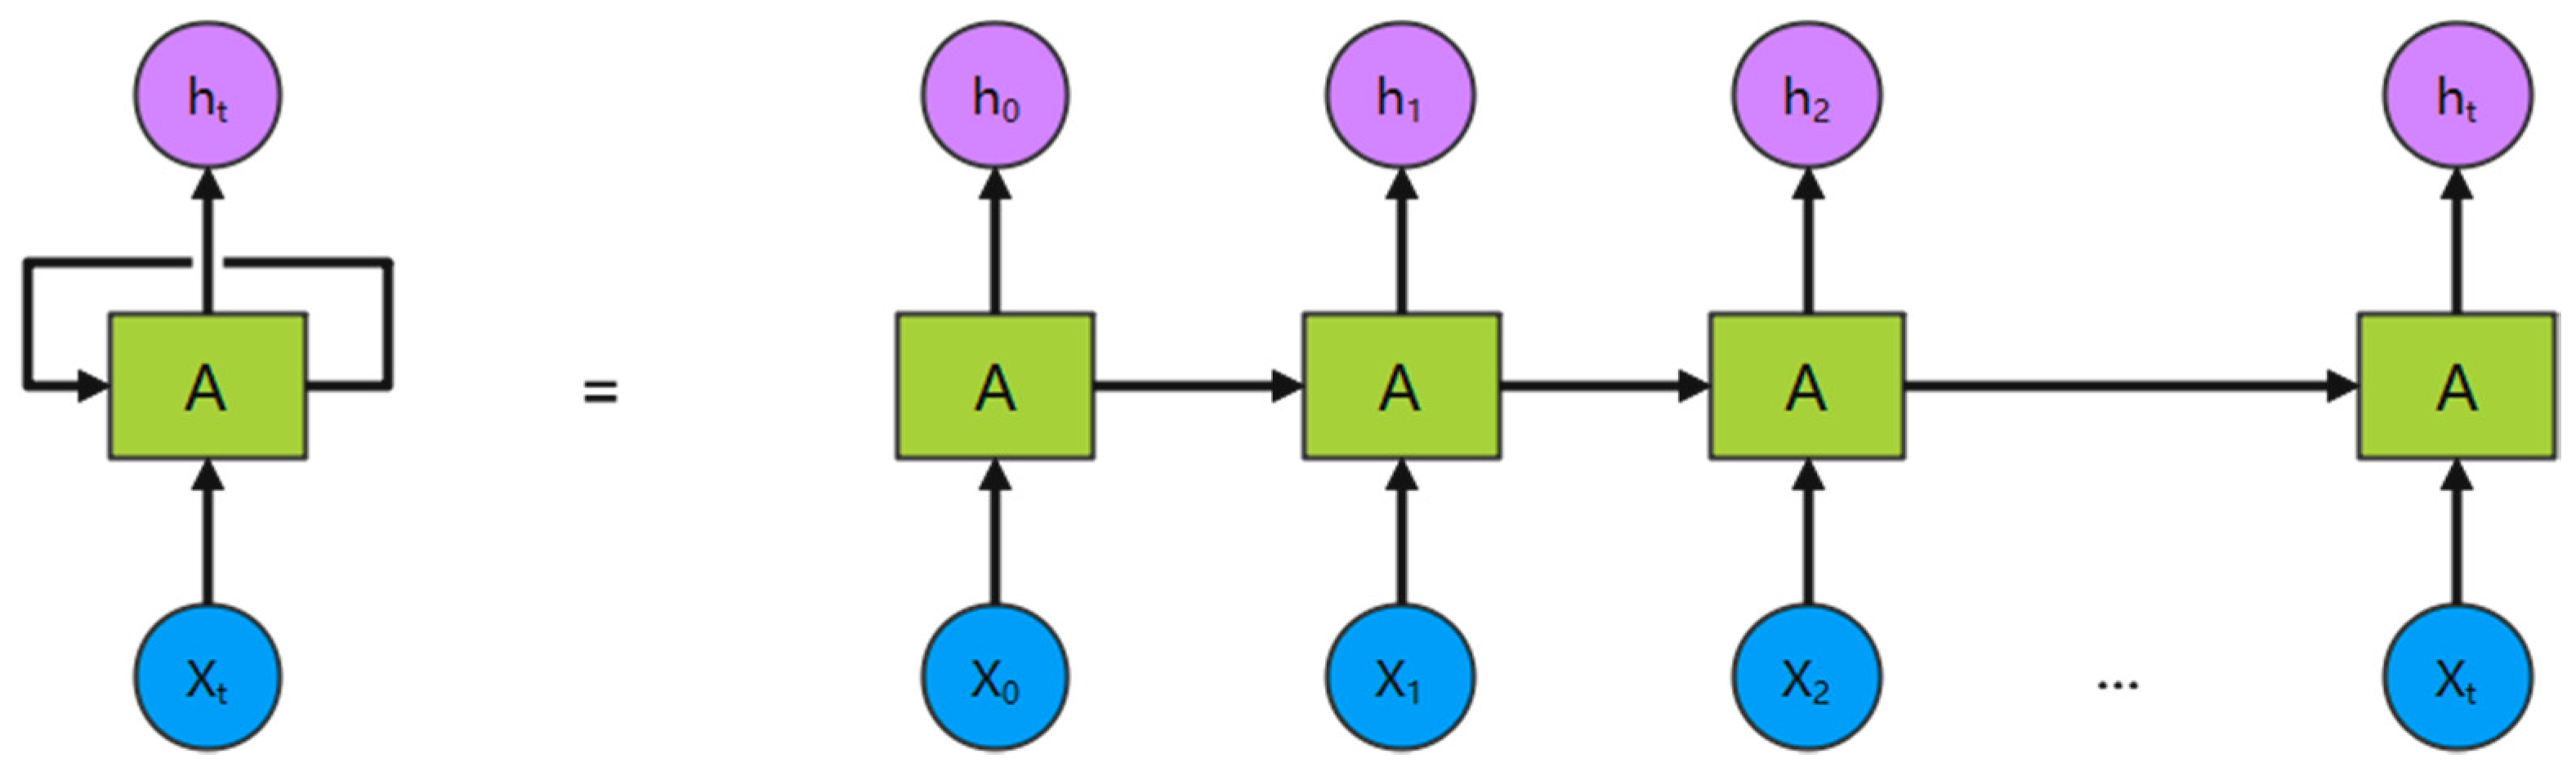
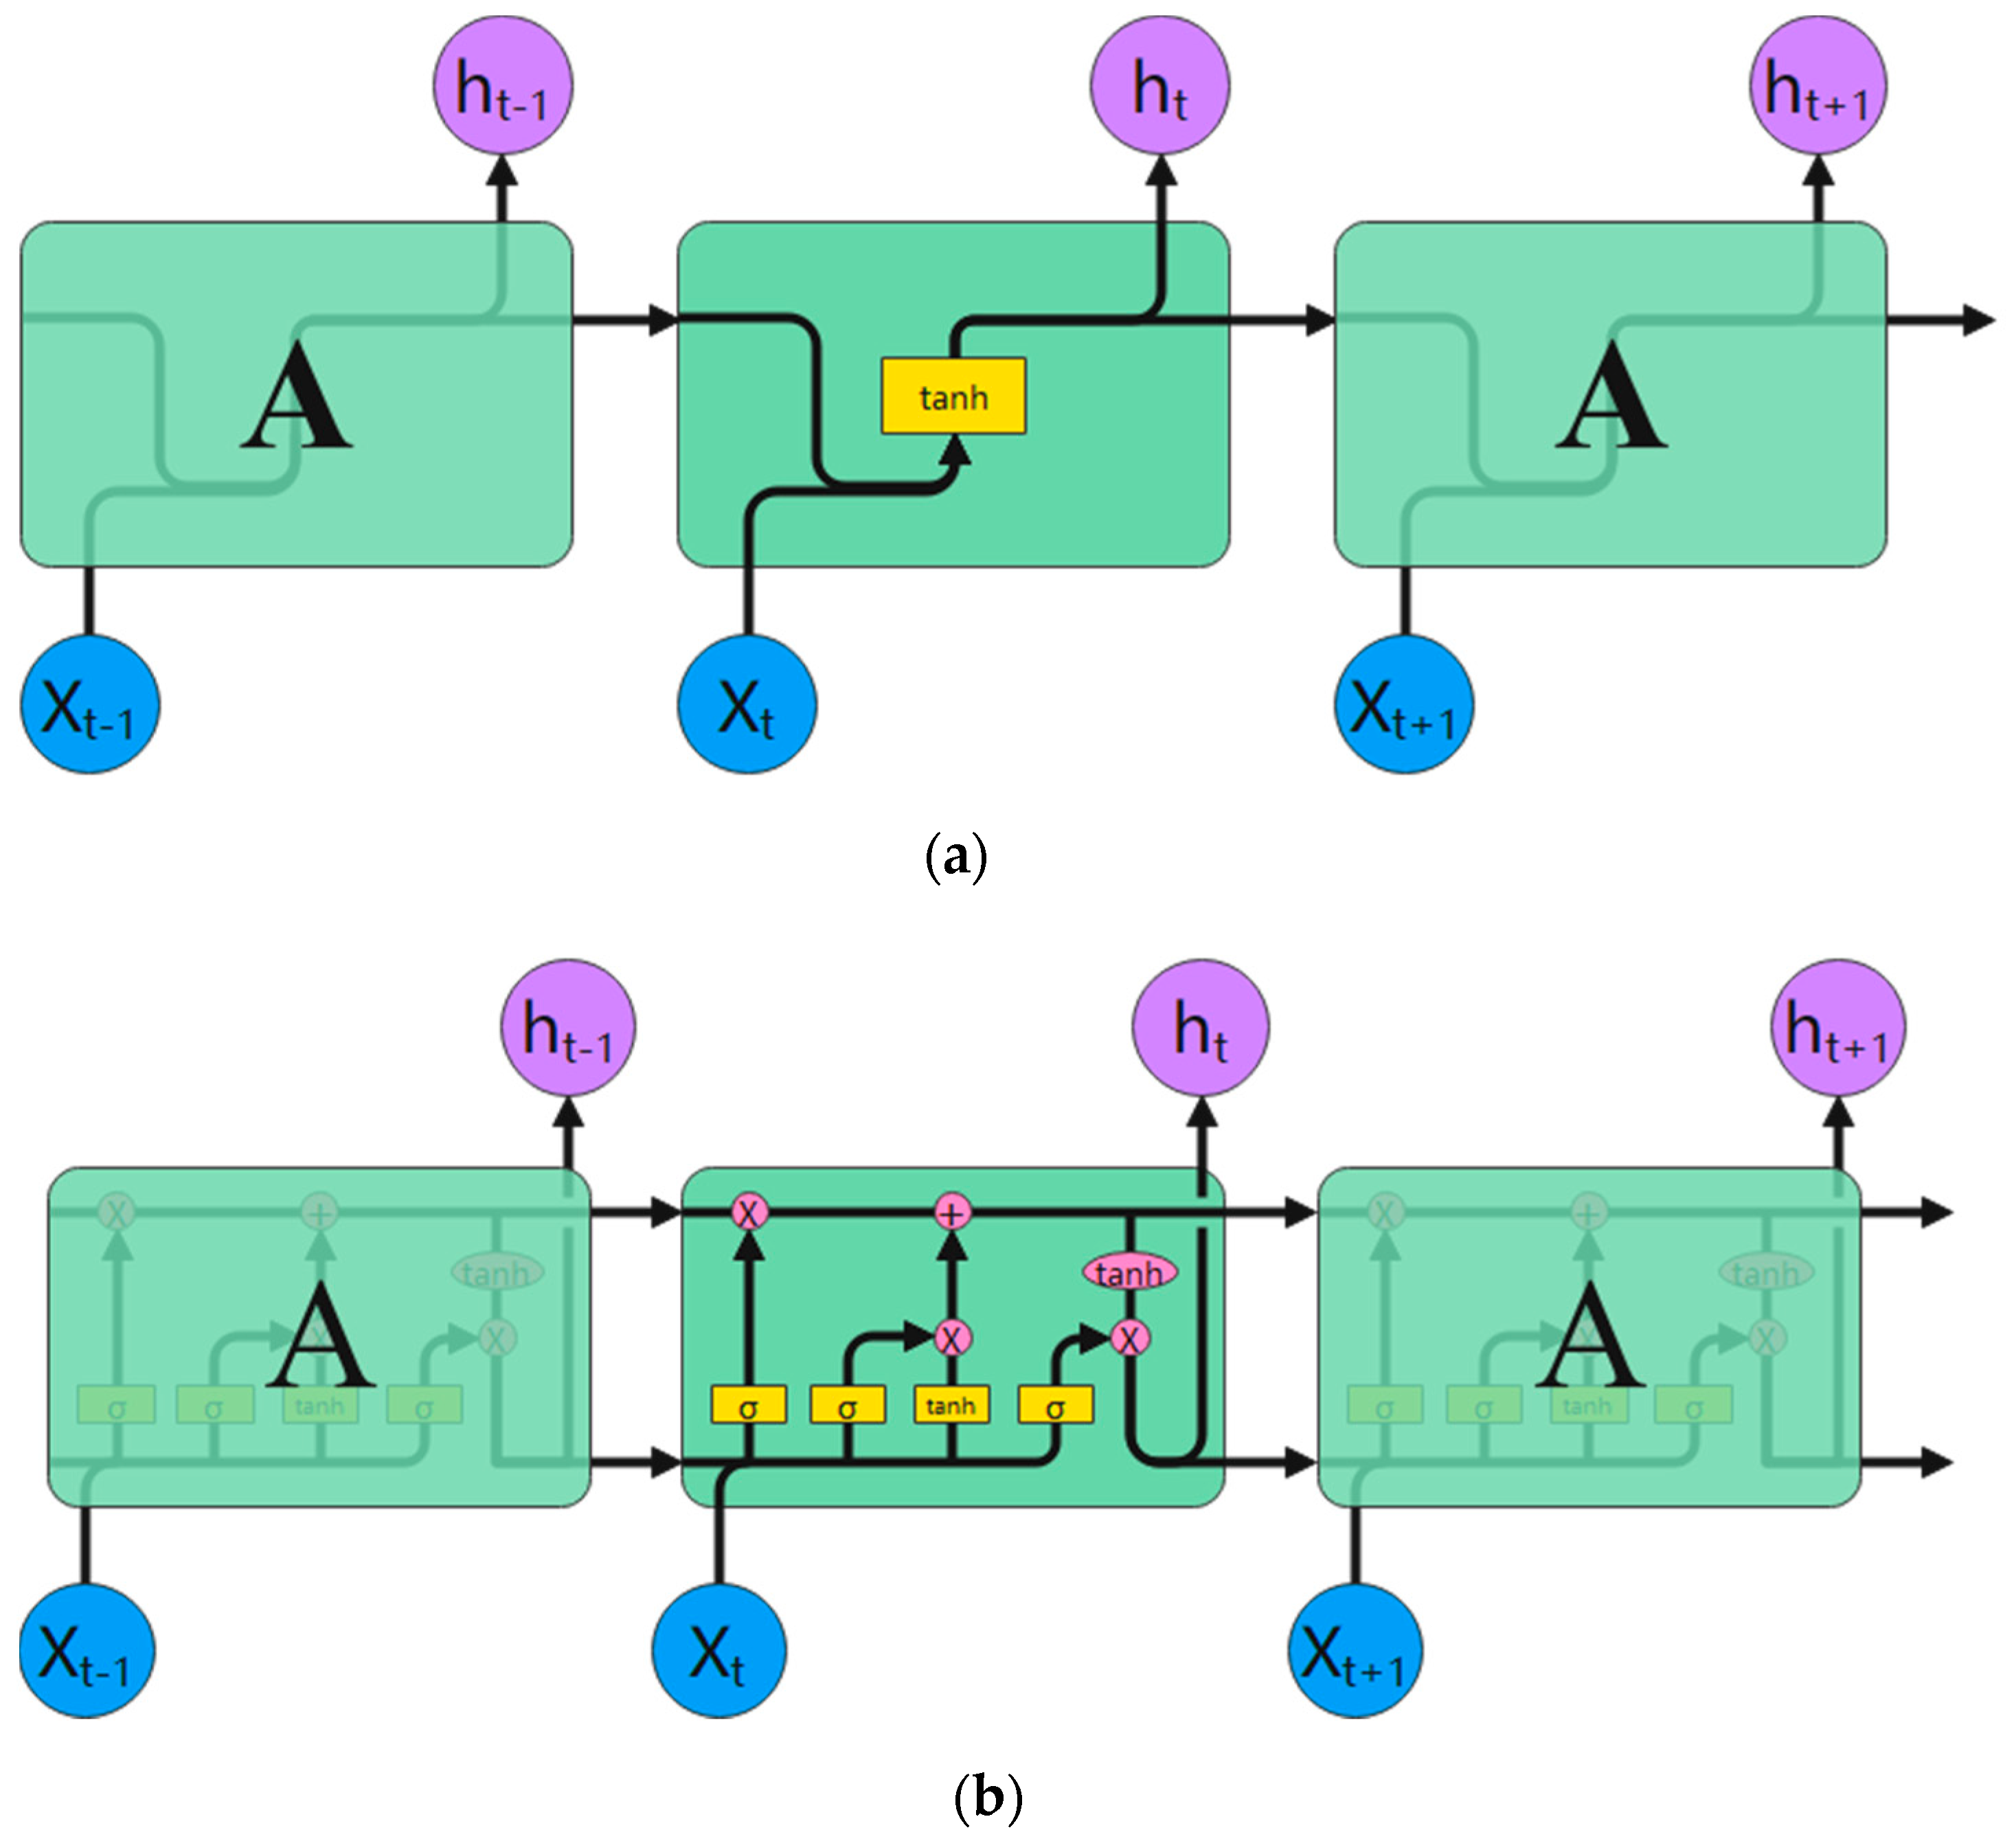
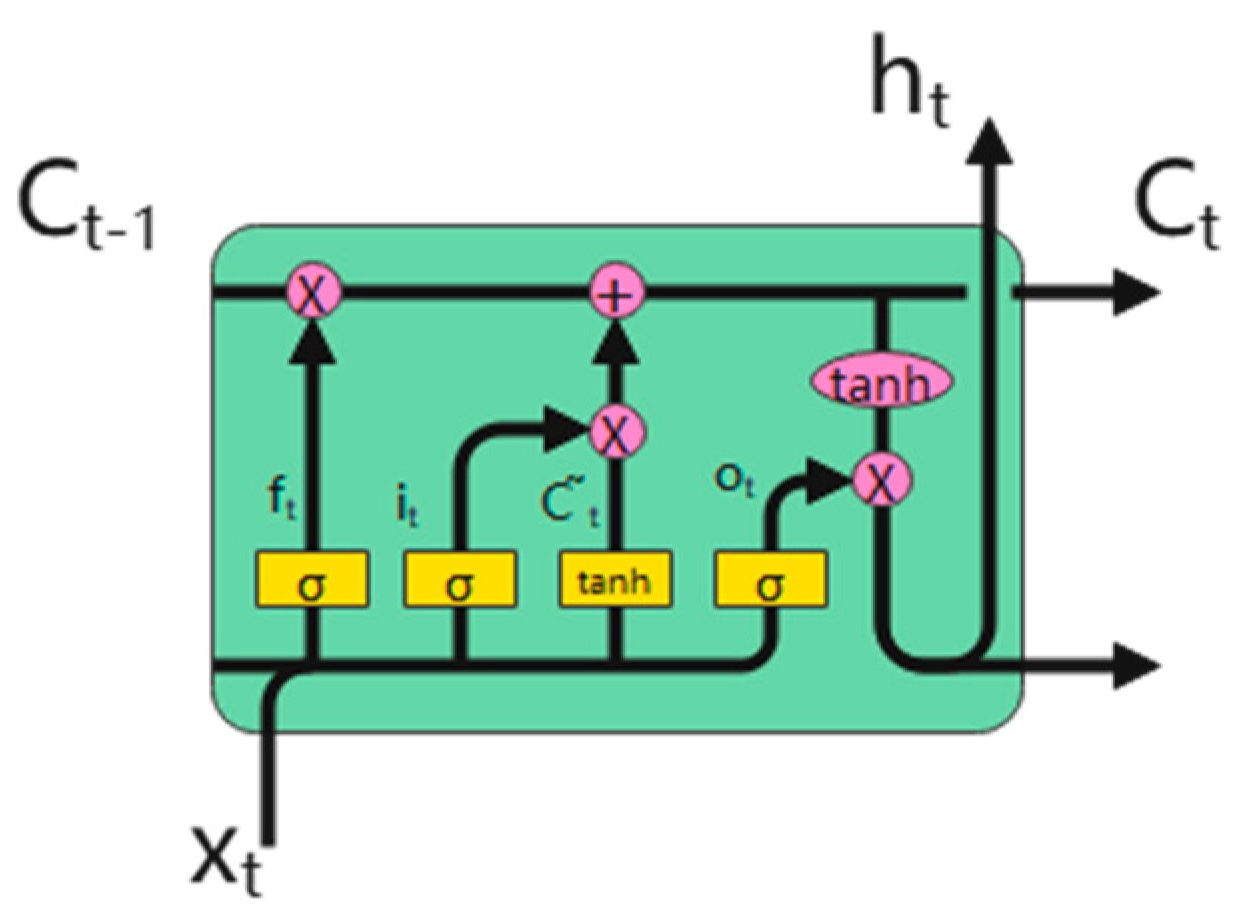
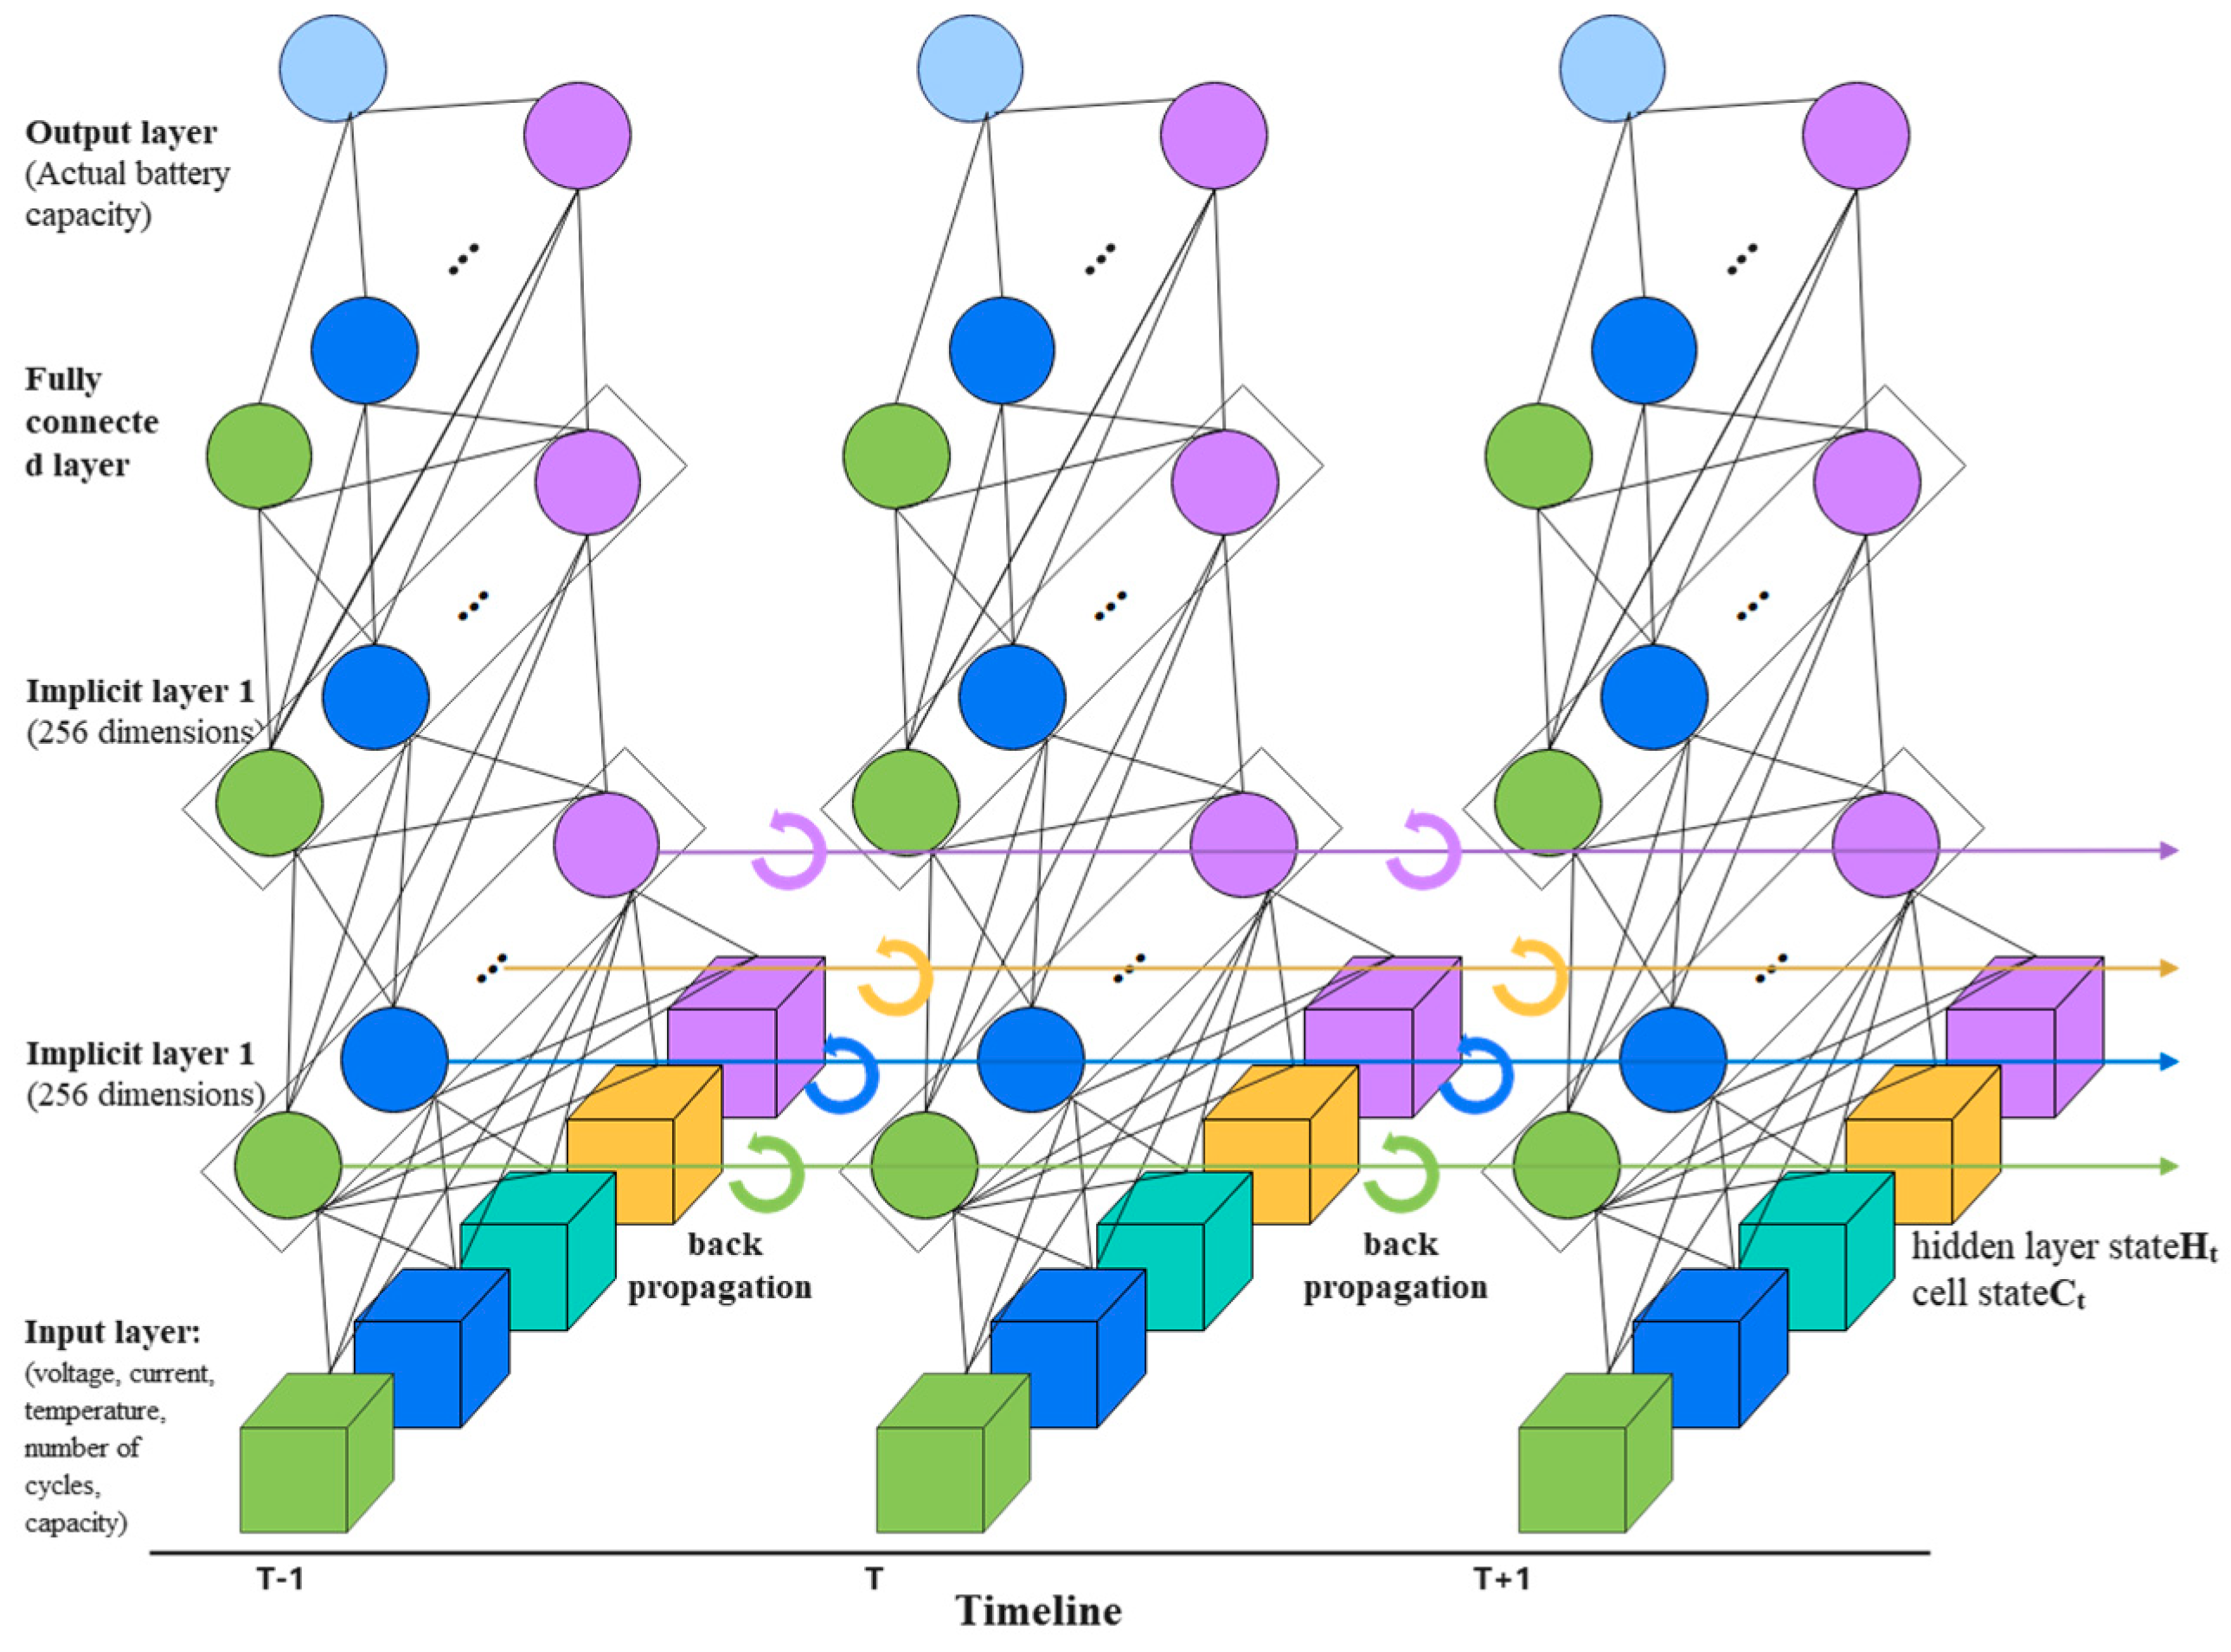
3.1. The Principle of the LSTM Neural Network

Contrary to other neural network models where the output of the hidden node depends only on the input functions of the current time slice, RNN has a “memory” function, which combines the information from the preceding time slice with the information from the current time slice to calculate the output [18]. As shown in Figure 4, the RNN is in time slice t, and the hidden node of time slice t 1 t-1 will also be used as input to the current time slice. Therefore, RNN is a deep learning model most used to deal with time series problems.
The mathematical expression of RNN is
h t = σ ( x t × ω x t + h t 1 × ω h t + b )
As an improved form of RNN, LSTM not only inherits the “memory” ability of RNN for data but can also solve its exploding gradient and vanishing gradient problems [19]. Unlike the vanishing gradient of other neural networks, the weights (W) in RNN are shared between time slices, and the total gradient does not vanish but becomes weaker as it is transmitted. The real meaning of its gradient dispersion is that the gradient is dominated by the proximal gradient, while the distal gradient becomes negligible as the propagation distance increases, making it hard to learn the model.
The RNN and LSTM structural units are shown in Figure 5.
The LSTM can solve the problem of the RNN vanishing gradient, which mainly relies on the cell state, the core part of the chain system from beginning to end, and the three gate units in Figure 6, which have the role of protecting and controlling the flow of information. The numerous gate units of LSTM cannot solve the gradient explosion problem thoroughly, but they can suppress its occurrence well and reduce the frequency of gradient explosion.
C t = f t × C t 1 + i t × C ˜ t
where C t stands for the current time-slice cell state, C t 1 indicates the state of the previous time slice unit, f t means the forget gate, i t stand for the input gate, and C ˜ t indicates the cell state update value.
(1) The forget gate selectively “forgets” the unimportant information on the previous time slice, the significant features in C t 1 are selected for computing C t , f t is a vector with values in [0.1]. Here, 0 means complete forgetting, intentionally blocking the gradient flow; and 1 means complete retention, saturating the forget gate.
f t = σ ( W f × [ h t 1 , x t ] + b f )
where x t means the current time slice input data, h t 1 represents the hidden node in the previous temporal slice, σ represents the activation function, W f represents the weight of the forget gate, and b f stands for the forget gate bias.
(2) The input gate determines what cell states are stored and selectively stores information on C ˜ t into C t .
i t = σ ( W i × [ h t 1 , x t ] + b i )
C ˜ t = tanh ( W c × [ h t 1 , x t ] ) + b c
where W i stands for the input gate weight, b i stands for the input gate bias, W C means the cell state weight, and b C stands for cell state bias.
(3) The output gate computes the output of the hidden node h t for computing the final prediction y t and the complete input of the next time slice.
O t = σ ( W o × [ h t 1 , x t ] ) + b o
h t = o t × tanh ( C t )
where o t stands for the output gate, W o represents the output gate weights, and b o means the output gate bias.
After analyzing the actual battery data provided by the NASA-Battery Data Set, it was found that the battery’s voltage, current, and temperature were all one-dimensional time-series data that changed with time, corresponding to the actual capacity of the battery discharged with each cycle. The actual capacity of the current battery is related to the historical capacity, voltage, current, and temperature. The LSTM can preserve this connection well, can also filter out useless information, respond to dynamic changes in the actual capacity of the battery, and then deal with long-time series problems. Therefore, in this paper, the capacity, voltage, current, temperature, and the number of cycles of the lithium battery over time were introduced into the LSTM to determine the actual capacity of the battery.

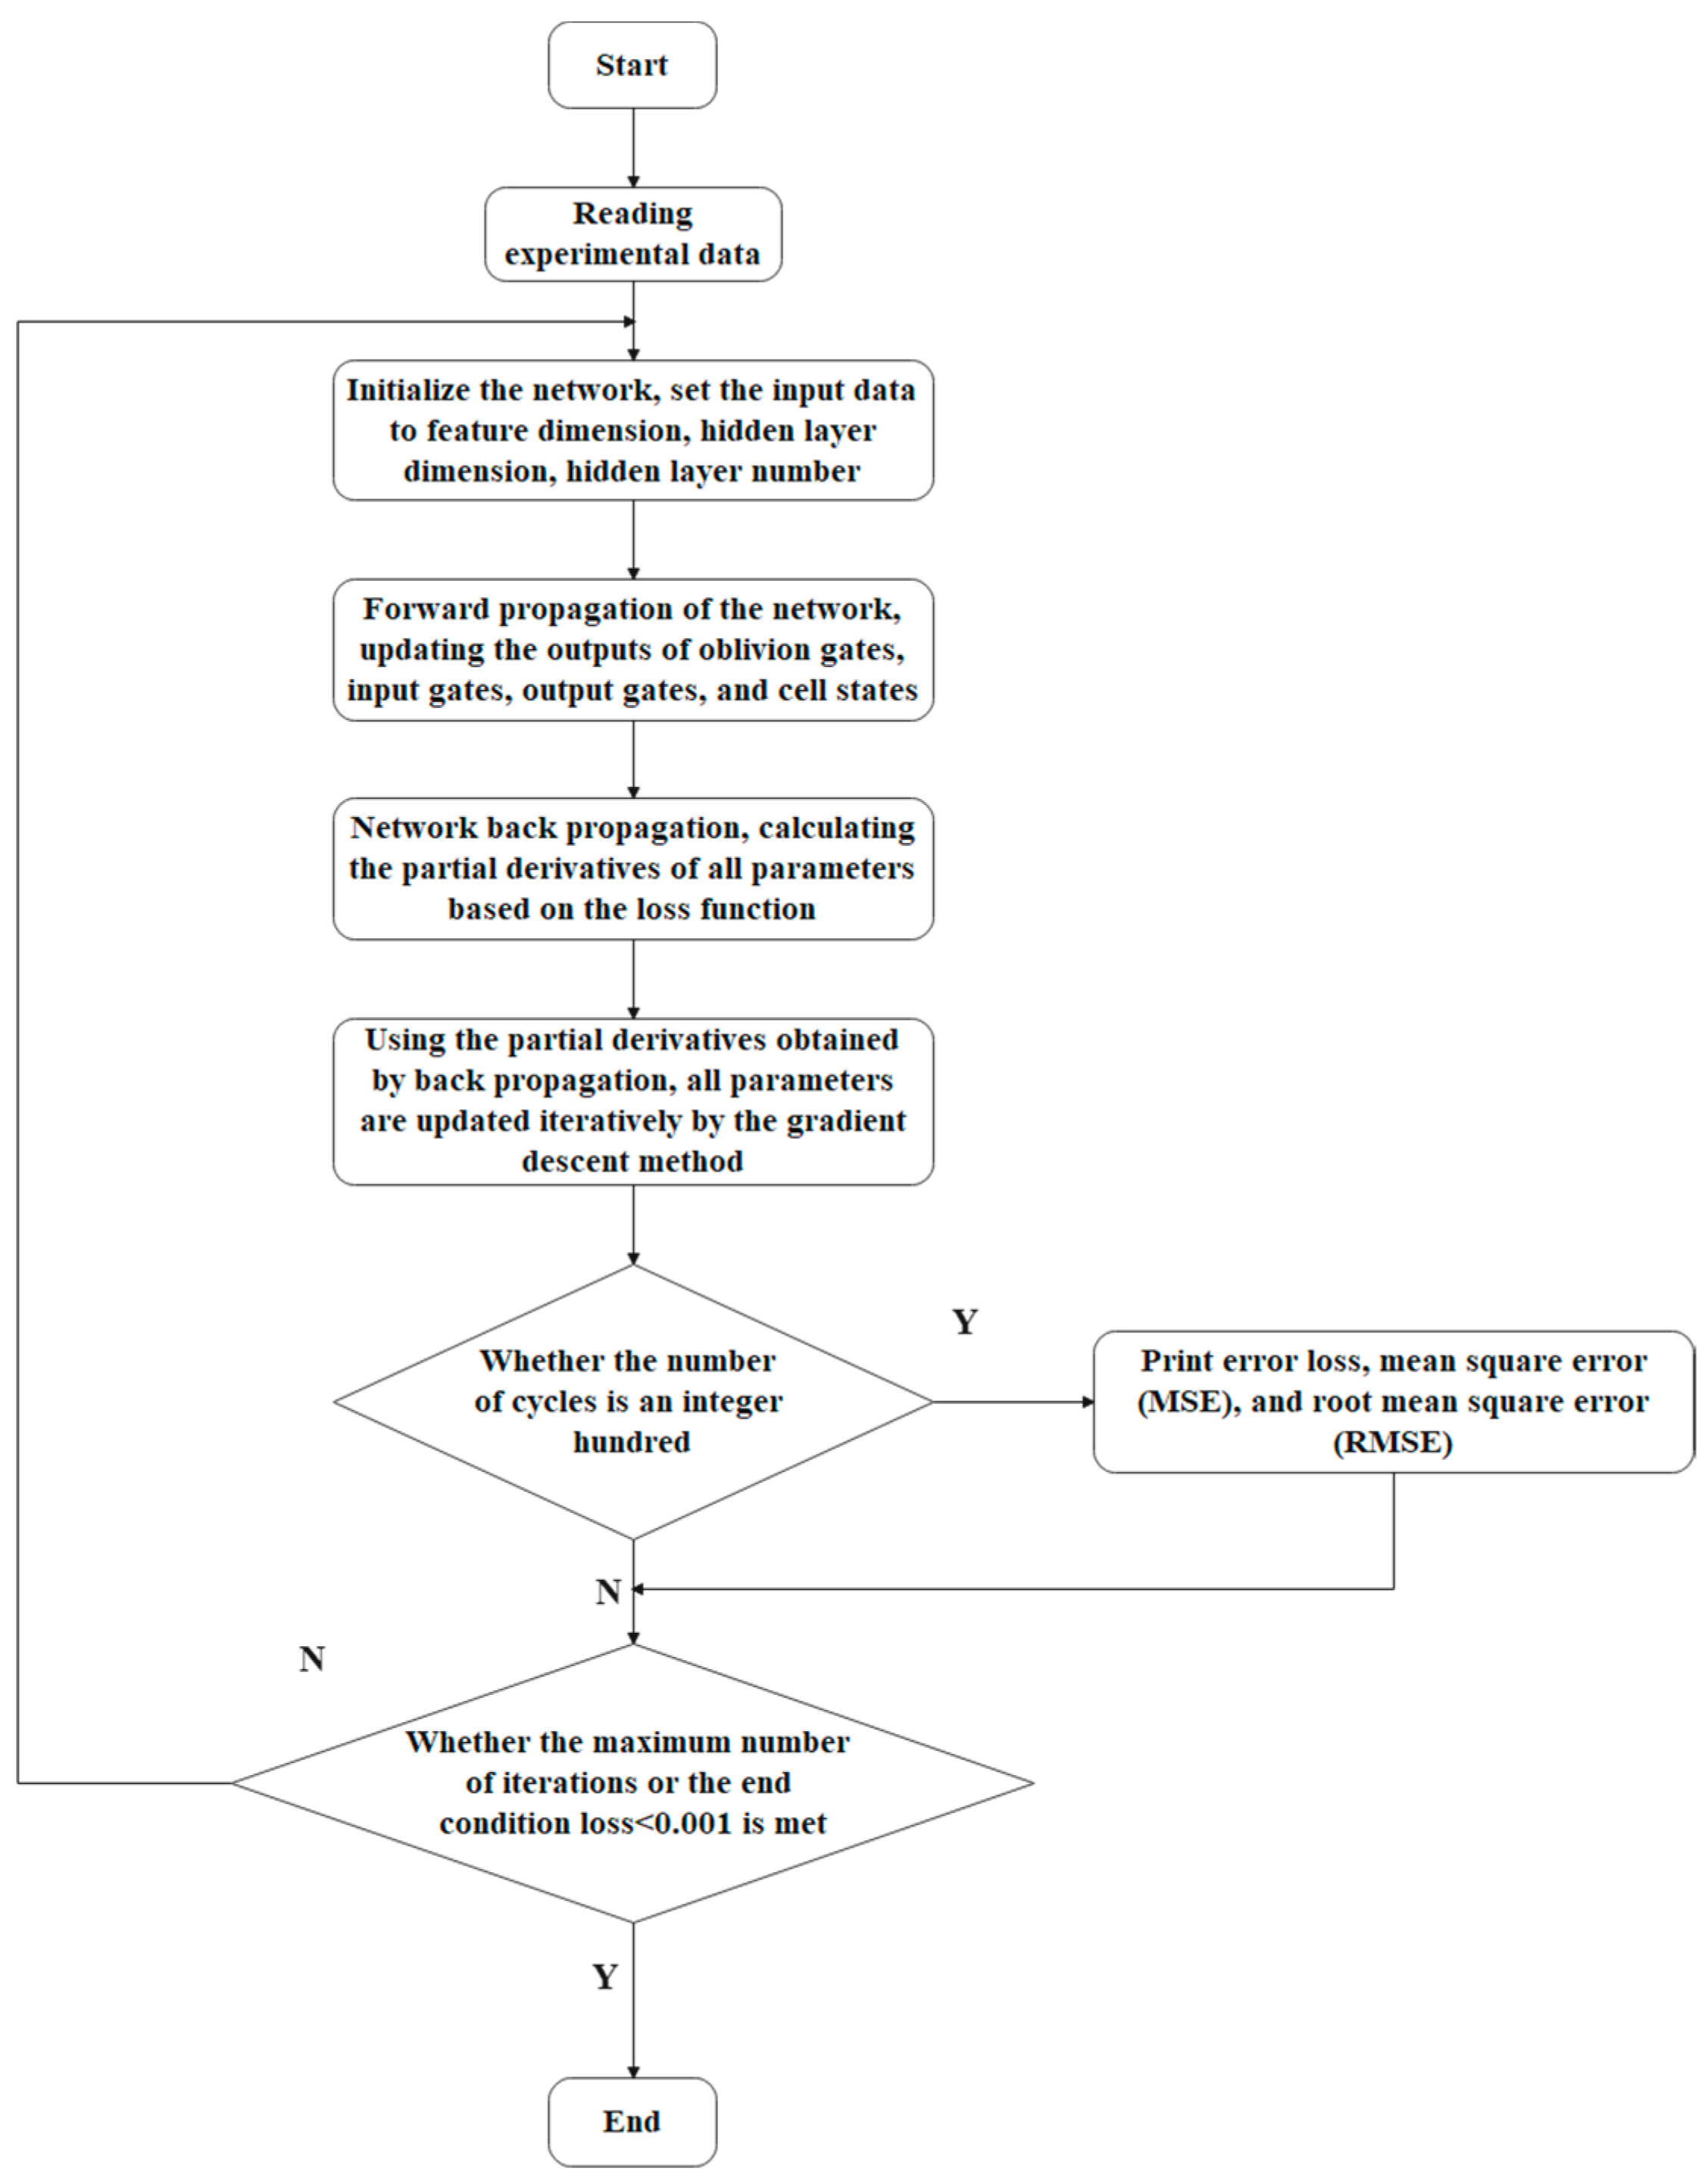
3.2. Building an LSTM Model for Predicting Actual Battery Capacity

Considering that the LSTM neural network model performs well in dealing with long-time series problems, we chose to use this model to predict the actual capacity of the battery. Figure 7 shows the LSTM model for estimating the battery’s actual capacity, including the input layer, hidden layer, and output layer. When defining the network of the model, the primary purpose is to define the feature dimension of the input data, the dimension of the hidden layer, the number of layers of the hidden layer, and the dimension of the output data. The input data feature dimension is the size of the data intercepted by the sliding window from the input data each time; the hidden layer dimension indicates the number of nodes used to remember and store the past states; the output data dimension is 1 because of the actual capacity of the final output result battery of this model. We set the initial state of the hidden layer state h 0 and the cell state C 0 to 0.
Figure 8 presents the LSTM training flowchart; the files in the NASA-Battery Data Set were mat files and could not be read directly by PyCharm software; so, when reading the experimental data, it needed to be converted to time format first, and the string was converted to data time format. The prediction was re-run every 100 iterations during the model training process, i.e., the prediction result was output every 100 times along with the error loss, Mean Absolute Error (MAE), and Root Mean Square Error (RMSE). At the end of model training, the optimal training model was saved and used to predict the actual battery capacity.
We used the Mean Square Error (MSE) as a loss of function in the rearward propagation process of the model.
M S E = 1 M i = 1 M ( y i y ^ i ) 2
This test described the estimated actual battery capacity by MAE and RMSE
M A E = 1 n T t = T + 1 n x t x ^ t
R M S E = 1 n T t = T + 1 n ( x t x ^ t ) 2

4. Experiment and Analysis

Two sets of battery data from the NASA-Battery Data Set were selected for comparison tests, and the SOC of the selected batteries was estimated by two ampere-hour integral methods, where the improved ampere-hour integral method was used to predict the actual capacity of the batteries through an LSTM model. The test results showed that the error values of the SOC estimated by the improved ampere-hour integral method were much smaller than those estimated by the traditional ampere-hour integral method, and they were all within the error tolerance, which shows that the improved ampere-hour integral method is more accurate.

4.1. Test Environment Construction and Test Process

At the stage of predicting the battery’s power, the NASA-Battery Data Set was selected as the training set and test set of the neural network, it was also used to compare the accuracy of the SOC estimation, using the traditional ampere-hour integral method and the improved ampere-hour integral method respectively.
The test environment was PyCharm, and this experiment was based on PyCharm software to build a neural network model, which was used as an LSTM model for estimating the actual battery capacity; we set the sliding window size to 16, the hidden layer dimension to 256, the learning efficiency to 0.001, and the number of iterations to 50,000.
After setting the parameters, we performed data training on the established model. This paper used the No.5 and No.25 batteries in the NASA-Battery Data Set as the test set and the remaining battery data as the training set. The No.5 and No.25 battery data were both collected at room temperature (24 °C), the No.5 battery was discharged to 2.7 V at 1 C, and the No.25 battery was discharged to 2 V at 2 C; during charging, both batteries were charged to 4.2 V with 1.5 A constant current mode, then charged with a constant voltage until the current was 20 mA.
Two ampere-hour integral method estimation models were built in MATLAB, and the final comparison experiment was completed.
The implementation steps of the SOC estimation model based on the improved ampere-hour integral method proposed in this paper were as follows:
Step 1: Obtain the training data. The input data of the LSTM model were voltage, current, temperature, and the number of battery cycles; the output data were the actual battery capacity that the battery could output under the current situation.
Step 2: Build an LSTM model and build an improved ampere-hour integral model by MATLAB. The LSTM model included input layers, hidden layers, and output layers. It was also necessary to set the learning efficiency and the sliding window size of the network, select the appropriate activation function, objective function, optimization algorithm, and evaluation function, and initialize the weight values and bias amounts as appropriate. The ampere-hour integral method model established in MATLAB required the battery voltage and current in the data set as input data and used the actual battery capacity predicted by the LSTM for the SOC estimation.
Step 3: Train an LSTM model for estimating actual battery capacity. The LSTM model used to estimate the amount of power was trained, and the network parameters such as the objective function and learning efficiency were modified according to the results until the training result error was less than the preset value or the set number of cycles was reached.

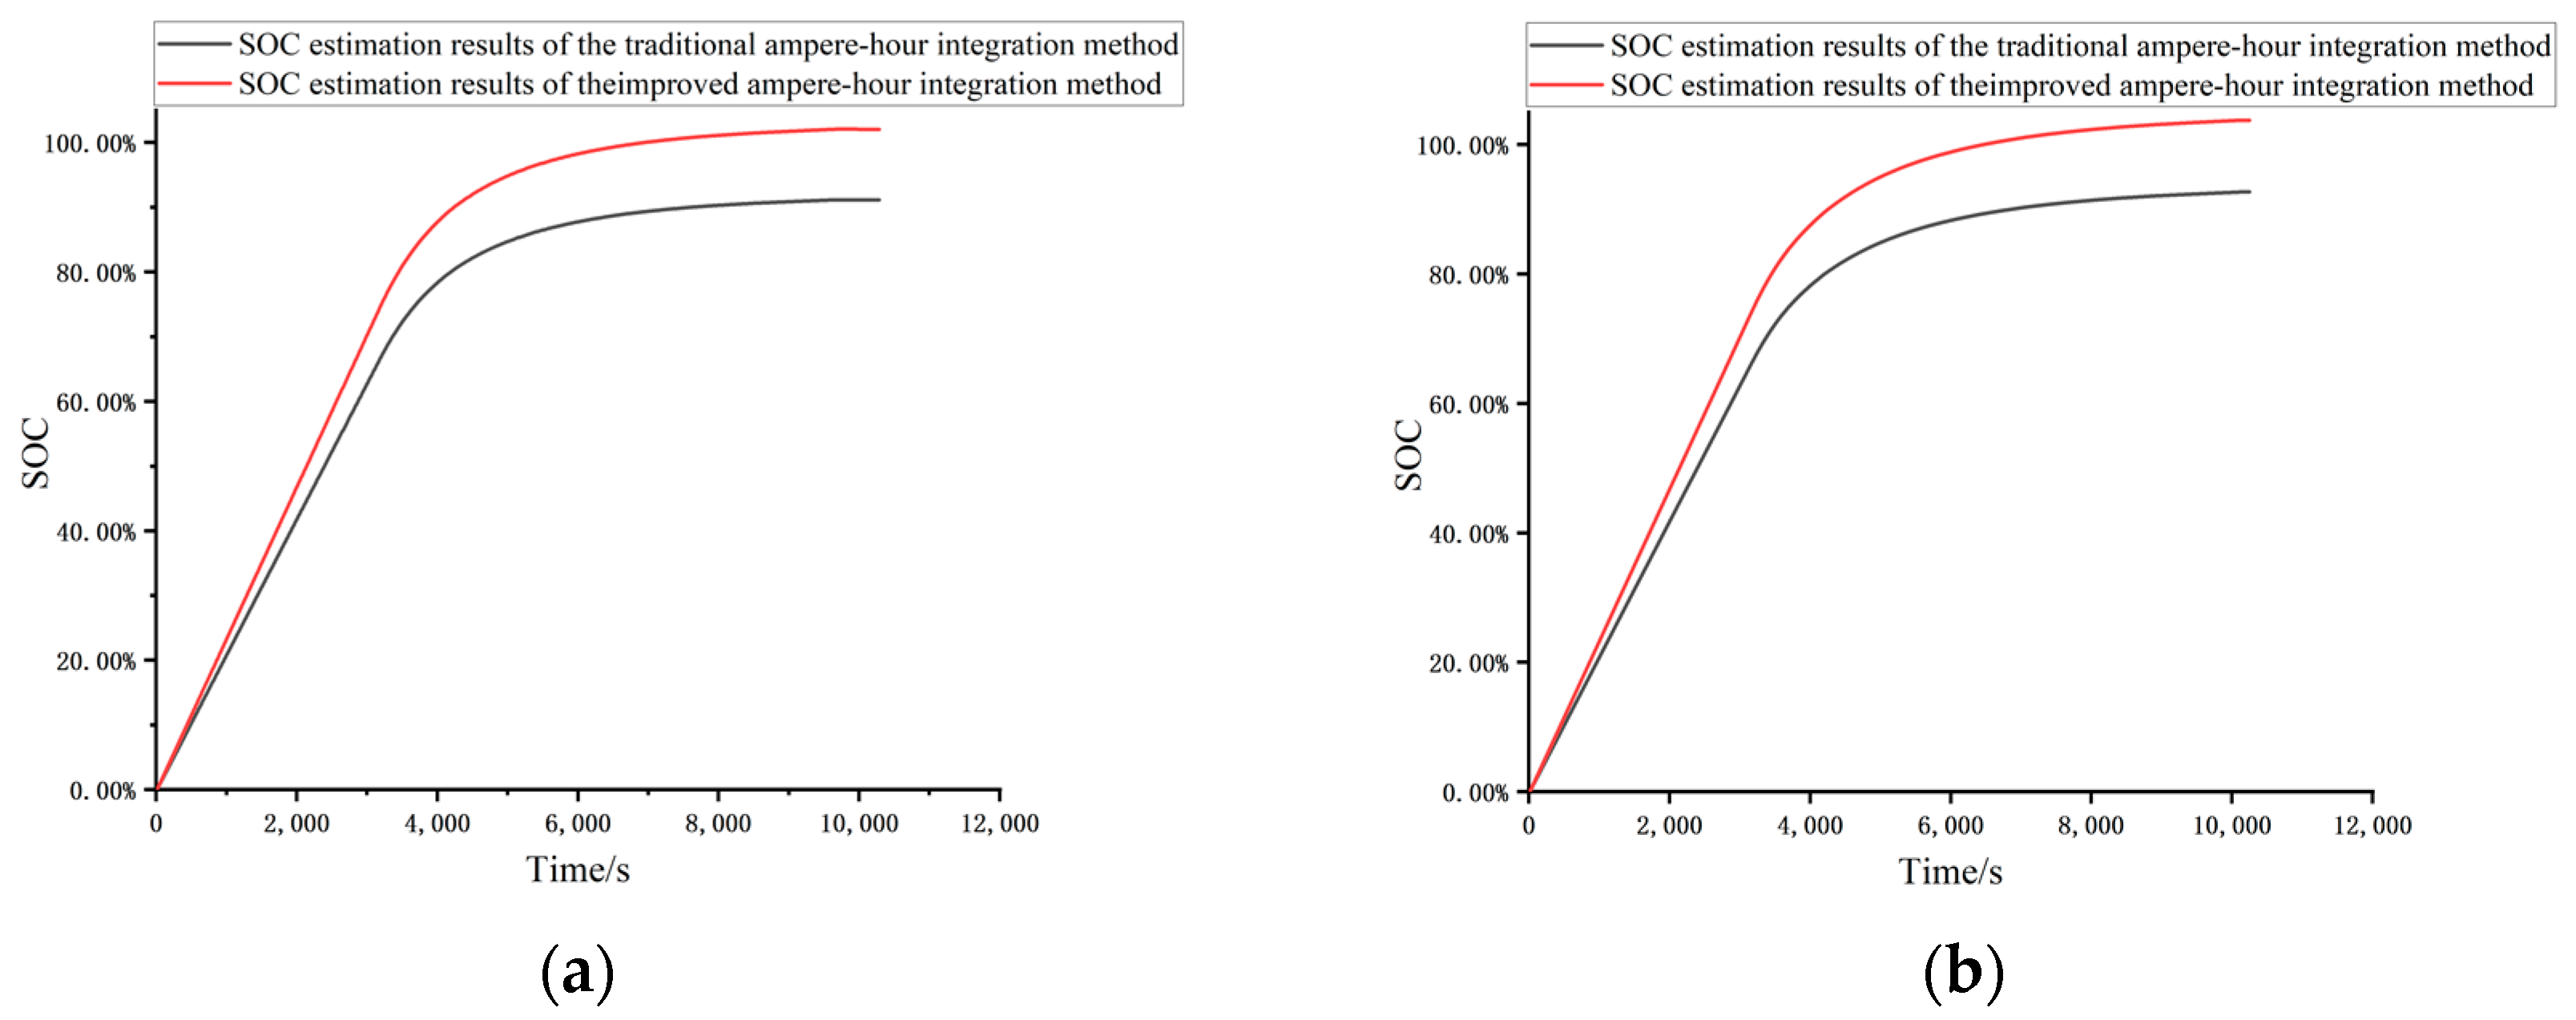
4.2. Analysis of Test Results

To verify the accuracy of the improved ampere-hour integral method proposed in this paper, this paper used the NASA-Battery Data Set as the experimental data to complete the SOC estimation through two ampere-hour integral methods. Finally, the errors caused by using these two ampere-hour integral methods for SOC estimation were compared.
The final error of the result of the actual capacity of battery No.5 estimated by the trained LSTM model was loss = 0.001, MAE = 0.0865, RMSE = 0.0984; the error of the result of the actual capacity of battery No.25 was loss = 0.0004, MAE = 0.0266, RMSE = 0.0282. The error of the actual capacity of the battery estimated by the two groups reached the ideal state; so, they were used as the subsequent comparison test.
The charging data for each cycle of cell 5 from the first set of data in the NASA-Battery Data Set were taken and brought into two separate ampere-hour integral methods for the SOC estimation. Figure 9 shows the error between the two SOC estimation results and the actual SOC value.
In the national standard QC/T897-2011 “Technical Conditions for Battery Management Systems for Electric Vehicles”, it is indicated that the SOC estimation error should not be greater than 10%. It can be seen from the SOC estimation error curve of the traditional ampere-hour integral method in Figure 9, after a given initial SOC value of the battery, if the change in the actual capacity of the battery was not considered, the error of the estimated SOC value increased with the number of times the battery was used and exceeded the allowable error range after a certain number of uses. In any cycle, the error of the SOC value estimated by the improved ampere-hour integral method was smaller than the national standard, reducing the error caused by the traditional ampere-hour integral method.
Figure 10 compares the results of the SOC estimation using the two ampere-hour integral methods, respectively, during the 20th cycle of charging of battery No.5 and battery No.25. By analyzing the above figure, after the battery was fully charged, the SOC value estimated by the improved ampere-hour integral method reached the theoretical value, while the traditional ampere-hour integral method could not achieve this. Therefore, it could be considered that the SOC estimation accuracy of the improved ampere-hour integral method proposed in this paper was higher than that of the traditional ampere-hour integral method.

5. Conclusions

The accuracy of SOC estimation is studied, which is based on the traditional ampere-hour integral method. The main problem with this traditional method is that the actual capacity of the battery, which changes dynamically with environmental factors, is calculated as a constant, causing a certain degree of error. In order to solve this problem, this paper used an improved ampere-hour integral method to estimate the battery SOC; this improved method was based on the LSTM model to predict the actual battery capacity.
Firstly, the correlation between the actual battery capacity and parameters such as battery voltage, current, temperature, and cycle times was analyzed, and the dynamic change rule of the actual battery capacity was found. Secondly, the LSTM model was established to predict the actual battery capacity, and an LSTM model was trained using extensive battery data under different usage conditions, so the LSTM model could give full play to its advantages in processing time series data. Then, the actual battery capacity prediction value was used to replace the battery rated capacity in the traditional ampere-hour integral method, and the value was brought into the improved ampere-hour integral method for SOC estimation. Finally, using the NASA-Battery Data Set, the errors generated by the improved ampere-hour integral method and the traditional ampere-hour integral method for battery SOC estimation were compared. The results showed that the error generated by using the traditional ampere-hour integral method for SOC estimation increased with the aging of the battery and exceeded the allowable range after a certain number of uses. In any battery use cycle, the error of the SOC estimation value obtained by the improved ampere-hour integral method was less than 10%. This method is suitable for batteries under different usage conditions and improves the accuracy of SOC estimation.
In future studies, we will introduce a generalized diagnostic framework to quantify battery aging. With this framework, we can describe battery aging more clearly, optimize the neural network training process, and reduce the test cost and training time.

Author Contributions

Conceptualization, X.Z., J.H. and Y.J.; methodology, X.Z., J.H. and Y.J.; software, J.H.; Validation, X.Z., J.H. and Z.W.; Formal analysis, X.Z. and J.H.; Investigation, J.H. and Z.W; Writing—original draft preparation, J.H.; Writing—review and editing, X.Z., J.H., Z.W. and Y.J.; Supervision, X.Z.; project administration, X.Z.; Funding acquisition, X.Z. All authors have read and agreed to the published version of the manuscript.

Funding

The authors would like to acknowledge support from the following projects: Liaoning Province Basic Research Projects of Higher Education Institutions (Grant No. LG202107, LJKZ0239). the construction plan of scientific research and innovation team of Shenyang Ligong University (Grant No. SYLU202101), Comprehensive reform project of graduate education of Shenyang Ligong University (Grant No. 2021DSTD004, 2021PYPT006).

Data Availability Statement

The data used to support the findings of this study are included within the article.

Acknowledgments

The authors sincerely appreciate all financial and technical support.

Conflicts of Interest

The authors declare no conflict of interest.

References

  1. Liu, K.; Li, K.; Peng, Q.; Zhang, C. A brief review on key technologies in the battery management system of electric vehicles. Front. Mech. Eng. 2019, 14, 47–64. [Google Scholar] [CrossRef] [Green Version]
  2. Luo, Y.; Qi, P.; Huang, H.; Wang, J.; Wang, Y.; Li, P. Research on SOC estimation method of ampere-time integral based on capacity correction. Automot. Eng. 2020, 42, 681–687. [Google Scholar]
  3. Yang, Q.; Ma, K.; Xu, L.; Song, L.; Li, X.; Li, Y. A Joint Estimation Method Based on Kalman Filter of Battery State of Charge and State of Health. Coatings 2022, 12, 1047. [Google Scholar] [CrossRef]
  4. Li, C.; Xiao, F.; Fan, Y.; Tang, X.; Yang, G. Joint estimation of SOC and SOH for lithium-ion batteries based on deep learning. Chin. J. Electr. Eng. 2021, 41, 681–692. [Google Scholar]
  5. Ahmed, M.S.; Balasingam, B. A scaling approach for improved open circuit voltage modeling in Li-ion batteries. In Proceedings of the 2019 IEEE Electrical Power and Energy Conference (EPEC), Montréal, QC, Canada, 16–18 October 2019; pp. 1–6. [Google Scholar]
  6. Wei, Z.; Zhao, D.; He, H.; Cao, W.; Dong, G. A noise-tolerant model parameterization method for lithium-ion battery management system. Appl. Energy 2020, 268, 114932. [Google Scholar] [CrossRef]
  7. Jin, G.; Li, L.; Xu, Y.; Hu, M.; Fu, C.; Qin, D. Comparison of SOC Estimation between the Integer-Order Model and Fractional-Order Model Under Different Operating Conditions. Energies 2020, 13, 1785. [Google Scholar] [CrossRef] [Green Version]
  8. Hou, E.; Xu, Y.; Qiao, X.; Liu, G.; Wang, Z. State of power estimation of echelon-use battery based on adaptive dual extended Kalman filter. Energies 2021, 14, 5579. [Google Scholar] [CrossRef]
  9. Zhou, W.; Ma, X.; Wang, H.; Zheng, Y. SOC Estimation Based on Hysteresis Characteristics of Lithium Iron Phosphate Battery. Machines 2022, 10, 658. [Google Scholar] [CrossRef]
  10. Qiao, X.; Wang, Z.; Hou, E.; Liu, G.; Cai, Y. Online Estimation of Open Circuit Voltage Based on Extended Kalman Filter with Self-Evaluation Criterion. Energies 2022, 15, 4373. [Google Scholar] [CrossRef]
  11. Ding, Z.T.; Deng, T.; Li, Z.F.; Yin, Y.L. Research on SOC estimation method for lithium-ion batteries based on ampere-time integral and traceless Kalman filter. China Mech. Eng. 2020, 31, 1823–1830. [Google Scholar]
  12. Zhou, J.; Sun, X.; Liu, K.; Wang, M.; Yang, X.; Liu, G. Research on SOC estimation algorithm of sliding mode observer with joint extended Kalman filter. Chin. J. Electr. Eng. 2021, 41, 692–703. [Google Scholar]
  13. Pham, N.N.; Leuchter, J.; Pham, K.L.; Dong, Q.H. Battery Management System for Unmanned Electric Vehicles with CAN BUS and Internet of Things. Vehicles 2022, 4, 37. [Google Scholar] [CrossRef]
  14. Liu, Z.; Li, Z.; Zhang, J.; Su, L.; Ge, H. Accurate and Efficient Estimation of Lithium-Ion Battery State of Charge with Alternate Adaptive Extended Kalman Filter and Ampere-Hour Counting Methods. Energies 2019, 12, 757. [Google Scholar] [CrossRef] [Green Version]
  15. Jafari, S.; Shahbazi, Z.; Byun, Y.-C.; Lee, S.-J. Lithium-Ion Battery Estimation in Online Framework Using Extreme Gradient Boosting Machine Learning Approach. Mathematics 2022, 10, 888. [Google Scholar] [CrossRef]
  16. Lin, C.T.; Qiu, B.; Chen, Q.S. A comparative study of equivalent circuit models for electric vehicle battery power input. Automot. Eng. 2006, 3, 229–234. [Google Scholar]
  17. Ruan, H.; Chen, J.; Ai, W.; Wu, B. Generalised diagnostic framework for rapid battery degradation quantification with deep learning. Energy AI 2022, 9, 100158. [Google Scholar] [CrossRef]
  18. Shankar, K.; Kumar, S.; Dutta, A.K.; Alkhayyat, A.; Jawad, A.J.M.; Abbas, A.H.; Yousif, Y.K. An Automated Hyperparameter Tuning Recurrent Neural Network Model for Fruit Classification. Mathematics 2022, 10, 2358. [Google Scholar] [CrossRef]
  19. Feng, Z.; Hu, P.; Li, S.; Mo, D. Prediction of Significant Wave Height in Offshore China Based on the Machine Learning Method. J. Mar. Sci. Eng. 2020, 10, 836. [Google Scholar] [CrossRef]
Figure 1. Results of the SOC estimation of the traditional ampere-hour integral method. (a) Estimation results of the SOC during the charging process of the No.5 battery in the 1st cycle. (b) Estimation results of the SOC during the charging process of the No.5 battery in the 50th cycle. (c) Estimation results of the SOC during the charging process of the No.5 battery in the 100th cycle. (d) Estimation results of the SOC during the charging process of the No.5 battery in the 150th cycle.
Batteries 08 00170 g001
Figure 2. NASA-Battery Data Set No.7 and No.54 battery capacity change.
Batteries 08 00170 g002
Figure 3. NASA-Battery Data Set No.46 and No.54 battery capacity change.
Batteries 08 00170 g003
Figure 4. RNN chain structure.
Batteries 08 00170 g004
Figure 5. Structural units of RNN and LSTM. (a) Structural unit of RNN. (b) Structural unit of LSTM.
Batteries 08 00170 g005
Figure 6. Cell state of LSTM.
Batteries 08 00170 g006
Figure 7. Network structure.
Batteries 08 00170 g007
Figure 8. Model training framework.
Batteries 08 00170 g008
Figure 9. Error curve of SOC estimation for each cycle of the No.5 battery.
Batteries 08 00170 g009
Figure 10. SOC estimation curve under the 20th cycle of the No.5 and No.25 batteries. (a) SOC estimation for the 20th charge cycle of No.5 battery. (b) SOC estimation for the 20th charge cycle of No.25 battery.
Batteries 08 00170 g010
Publisher’s Note: MDPI stays neutral with regard to jurisdictional claims in published maps and institutional affiliations.

