Abstract
Graphite as a commercial anode for lithium-ion batteries has significant safety concerns owing to lithium dendrite growth at low operating voltages. Li4Ti5O12 is a potential candidate to replace graphite as the next-generation anode of lithium-ion batteries. In this work, fluoride-doped Li4Ti5O12 was successfully synthesized with a direct double coating of carbon and nitrogen using a solid-state method followed by the pyrolysis process of polyaniline. X-ray diffraction (XRD) results show that the addition of fluoride is successfully doped to the spinel-type structure of Li4Ti5O12 without any impurities being detected. The carbon and nitrogen coating are distributed on the surface of Li4Ti5O12 particles, as shown in the Scanning Electron Microscopy–Energy Dispersive X-ray Spectroscopy (SEM-EDS) image. The Transmission Electron Microscopy (TEM) image shows a thin layer of carbon coating on the Li4Ti5O12 surface. The fluoride-doped Li4Ti5O12 has the highest specific discharge capacity of 165.38 mAh g−1 at 0.5 C and capacity fading of 93.51% after 150 cycles compared to other samples, indicating improved electrochemical performance. This is attributed to the synergy between the appropriate amount of carbon and nitrogen coating, which induced a high mobility of electrons and larger crystallite size due to the insertion of fluoride to the spinel-type structure of Li4Ti5O12, enhancing lithium-ion transfer during the insertion/extraction process.
1. Introduction
Today, a lithium-ion battery is a secondary battery that is most widely used as an energy source. Especially in the modern era of transportation that prioritizes environmentally friendly energy consumption such as hybrid or fully electric vehicles, lithium-ion batteries are the only reliable energy source because of several advantages, namely high capacity, large power density and long service life [1]. One of the important factors in designing lithium-ion batteries relates to ensuring safety. Currently, commercial lithium-ion batteries still use carbon as the anode material, which has potential safety concerns. Graphite still has problems related to dendritic lithium growth (atomic lithium deposition) during the charging process at low current density [2,3]. Moreover, the application of lithium-ion batteries for a long duration and a high current density has a higher risk. Various strategies (such as capacity balancing between anode and cathode) [4] and new alternative designs for anode materials are continuously being promoted to overcome this problem without sacrificing their capacity and stability capabilities. To date, many alternative anode materials have been investigated, especially in the aspect of high-rate capability applications; one of them is Li4Ti5O12 (LTO) [5].
LTO is a strong candidate for the future anode of lithium-ion batteries as a carbon replacement because of several advantages, including its fast lithium-ion insertion capability, excellent cycle reversibility, high thermodynamic stability and almost zero-percent change in crystal volume during the charge–discharge process, for which it is well known as a “zero-strain” material [6,7]. In addition, LTO can prevent the growth of lithium dendrites on the surface of the electrode material because of its working potential of 1.55 V vs. Li/Li+, which is higher than that of carbon; thus, LTO can avoid the occurrence of a reduction reaction in the electrolyte so it can finally increase the safety factor of using LTO as an anode for lithium-ion batteries, for both long-term and high-rate capability [8,9]. The milder conditions of 1.55 V have more advantages. For example, a wider spectrum of electrolyte materials can be considered for application; for example, butyronitrile-based electrolyte [10]. However, this working potential conversely results in a decrease in the specific energy of LTO compared to carbon-based anode materials.
Unfortunately, LTO still has several disadvantages of being used directly as a commercial anode, and the most crucial is its low electronic conductivity and lithium diffusion coefficient, thus causing a decrease in electrochemical performance in lithium-ion battery applications [11,12,13]. Several strategies have been utilized to overcome this problem. Coating with conductive materials, doping with metal ions in the Li or Ti positions and replacing oxygen with non-metal ions are only a few of them.
Doping with several metal cations has been reported previously, such as Zn2+, Mg2+, Al3+, etc.; replacing Li or Ti ions has been shown to increase the rate capability and cycling ability of LTO [14,15,16]. In addition, doping with non-metal anions such as Cl−, F− and Br− was reported to improve the electrochemical performance of the LTO anode [17,18,19]. Previous research reported Br doping to LTO using a solid-state method. Br-doped LTO showed a high specific discharge capacity of 172 mAh g−1 at 0.5 C, which is almost the same as the theoretical capacity of LTO [17]. Cl-doped LTO has been successfully synthesized by a similar method, with specific discharge capacity of 148.7 mAh g−1 at 0.5 C [19]. It was also reported that F-doped LTO was successfully synthesized by solid-state reaction and showed improved electrochemical performance after 1000 cycles with a successful discharge capacity of 116.8 mAh g−1 at 11.4 C [20]. Although, the rate performance obtained the highest specific discharge capacity for the sample Li4Ti5O11.7F0.3 of about 80 mAh g−1 at 5 C, the average electrochemical performance was degraded when tested at a high-rate charge–discharge measurement from all the above experimental results.
In addition to using cation and anion doping, another strategy to improve the electrochemical performance of LTO is to use a coating technique to coat the particle surface with conductive agents such as carbon, CNT, graphene, conductive polymer, etc. [21,22,23,24]. Conductive polymers such as polyaniline (PANI) and polypyrole (PPy) are polymer types widely used for the N-doped porous carbon synthesis process because the pyrolysis results of the two polymers show a distinctive morphology and controlled nitrogen content in the carbon-coating process [25,26]. As reported, the N-doped carbon-coated LTO-TO microspheres showing specific discharge capacities of 184 and 123 mAh g−1 were obtained at 0.2 C and 20 C, respectively [27]. It is even able to withstand a specific discharge capacity of 121 mAh g−1 after 300 cycles at 5 C. This shows that N-doped carbon has a high potential to increase the rate capability and cycling ability performance. However, to date the use of the carbon and nitrogen double-coating technique combined with ion-doped LTO has rarely been discussed.
In this study, F-doped LTO was synthesized by the solid-state method, which was then double-coated with carbon and nitrogen by the pyrolysis of polyaniline. N-doped porous carbon succeeded in coating the surface of F-doped LTO by forming a thin layer with a thickness of several nanometers. The results of the galvanostatic charge–discharge tests using a combination of coating and doping techniques succeeded in significantly improving electrochemical performance, especially when testing charge–discharge at a high-rate current density.
2. Results
Figure 1a depicts the XRD pattern of pure LTO with doping variations of 0.1, 0.15 and 0.2 mol fluoride calcined at 700 °C. The XRD peaks were successfully indexed as lithium titanate spinel structure with the JCPDS card No. 49-0207. The diffraction peak of LTO was formed at 2θ around 18° (111), 35° (311), 43° (222), 47° (400), 57° (331), 63° (333), 66° (440), 74° (531), 75° (533), 79° (622) and 82° (444).
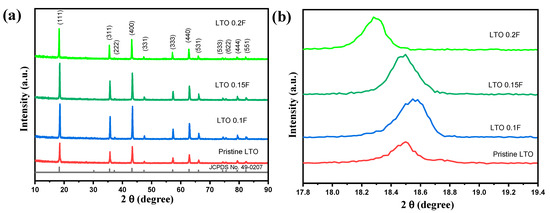
Figure 1.
(a) XRD pattern of LTO with doping variation F and (b) magnified (111) peaks of LTO and F-doped LTO at a temperature of 700 °C.
Figure 1b shows the magnified XRD pattern observations on plane (111), one of the highest peaks of LTO with a 2θ from 17.0° to 20.0°. It can be clearly seen that the doping of fluoride has been shifted the peak of the F-doped LTO to a lower degree. It indicates that atom F was successfully inserted into the crystal structure of LTO. The addition of the fluoride has shifted the diffraction peak to the lower degree of diffraction, affecting a change in the lattice parameter and the cell volume of the F-doped LTO samples. The calculated lattice parameter and cell volume are presented in Table 1.

Table 1.
Lattice parameter and cell volume for all LTO samples.
SEM images present the morphology transformation of the pristine LTO, LTO 0.1F, LTO 0.15F and LTO 0.2F, as seen in Figure 2a–d. All LTO samples have irregular grain-shaped particles with a homogeneous particle size distribution, as shown in Figure 2a–d. TEM images (Figure 2e,f) show morphological details and the results of carbon coating on the surface of LTO 0.2F. It is clearly observed that the thin layer-surrounded particle could be a carbon layer with a thickness of about 5–10 nm, as presented in Figure 2f.
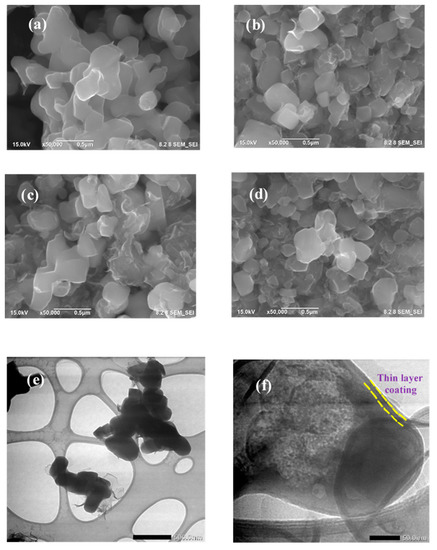
Figure 2.
SEM images of (a) pristine LTO, (b) LTO 0.1F, (c) LTO 0.15F, (d) LTO 0.2F; TEM images of LTO 0.2F (e) low and (f) high magnification.
To ensure the presence of elements C, N and F, Energy Dispersive X-ray Spectroscopy (EDS) was carried out, which showed that the elements of C, N and F were distributed over the entire LTO 0.2F surface, as seen in Figure 3a–e. In this EDS, the presence of N from the pyrolysis of polyaniline process was successfully observed (Figure 3d). Meanwhile, to calculate the percentage of carbon that was successfully coated on the surface of LTO, thermogravimetric analysis (TGA) was performed on the LTO 0.2F where the curve was obtained, as shown in Figure 3f.
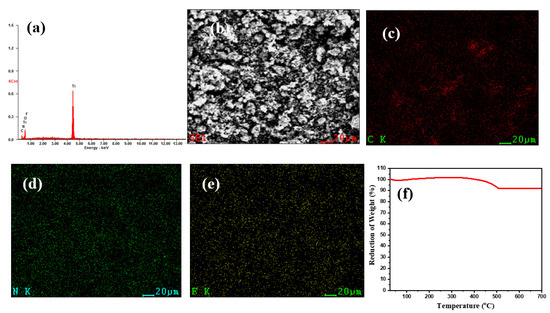
Figure 3.
(a) EDS spectra, (b–e) SEM–EDS images and elemental mapping and (f) TGA of LTO 0.2F.
The electrochemical performance of pristine LTO and LTO 0.2F was evaluated using cyclic voltammetry (CV) and galvanostatic charge–discharge cycling tests, as shown in Figure 4a,b. Figure 4a,b shows the initial two cycles of the CV of the LTO and LTO 0.2F samples with a potential window range from 1.0 to 3.0 V.
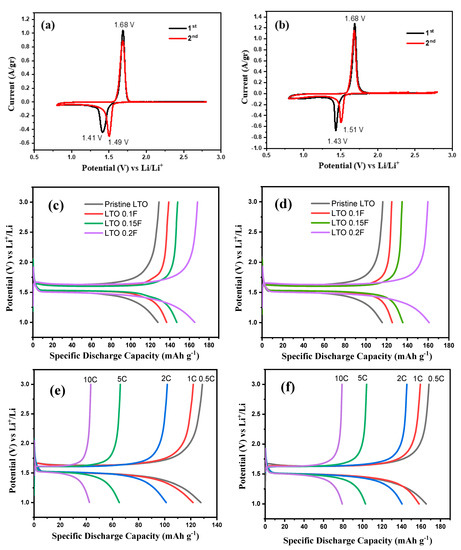
Figure 4.
Cyclic voltammetry (a) pristine LTO, (b) LTO 0.2F; charge–discharge curve profile of all LTO samples at 0.5 C (c) initial cycle, (d) 10th cycle; high-rate charge–discharge curve of (e) pristine LTO and (f) LTO 0.2F.
Figure 4c,d shows the charge–discharge curve profiles of all LTO samples in the first and tenth cycles at 0.5 C in the potential window range of 1.0–3.0 V. All LTO samples present a flat discharge plateau of around 1.5 V, which matches with the CV results. In the initial cycle, pristine LTO delivers a specific discharge capacity of 127.74 mAh g−1, LTO 0.1F (136.71 mAh g−1), LTO 0.15F (147.10 mAh g−1) and LTO 0.2F (165.38 mAh g−1). Next, in the tenth cycle, pristine LTO has a specific discharge capacity of 115.77 mAh g−1, LTO 0.1 F (125.47 mAh g−1), LTO 0.15F (135.57 mAh g−1) and LTO 0.2F (160.91 mAh g−1).
Figure 4e,f presents the profile of the pristine LTO and LTO 0.2F charge–discharge curve at varying current densities of 0.5 C, 1 C, 2 C, 5 C and 10 C. With increasing current density, the discharge curve tends to decrease steadily because of increased ohmic polarization and polarization concentration [28]. The pristine LTO delivers specific discharge capacity of 127.74, 121.71, 101.19, 65.25 and 42.35 mAh g−1 with currents of 0.5 C, 1 C, 2 C, 5 C and 10 C, respectively, whereas LTO 0.2F delivers specific discharge capacity of 165.38, 157.95, 140.24, 103.02 and 80.15 mAh g−1 with currents of 0.5 C, 1 C, 2 C, 5 C and 10 C, respectively.
Figure 5a represents the rate performance of the pristine LTO and LTO 0.2F, where it is clear that LTO 0.2F has higher specific discharge capacities of 165.38, 157.95, 140.24, 103.02 and 80.15 mAh g−1 with currents of 0.5 C, 1 C, 2 C, 5 C and 10 C compared to pristine LTO. In the long-term cycling performance test, as shown in Figure 5b, LTO 0.2F has a stable performance of a specific discharge capacity of 140.42 mAh g−1 at 1 C after 150 cycles with a retention capacity of 93.51%, which is higher than that of pristine LTO.
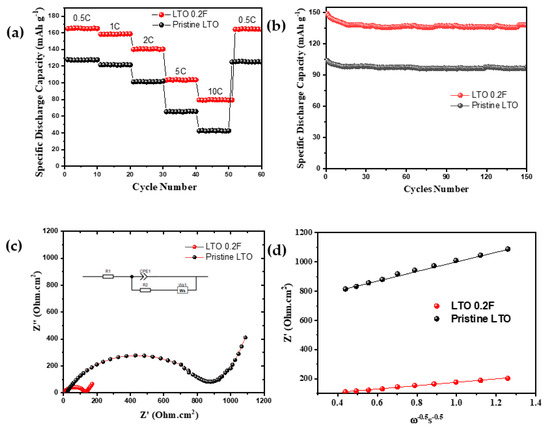
Figure 5.
High−rate capability (a), cyclability (b), Nyquist plot with inserted equivalent circuit (c) and Li+ diffusion profile (d) of pristine LTO and LTO 0.2F.
To explore the reaction kinetics of LTO and LTO 0.2F, electrochemical impedance spectroscopy (EIS) was applied. The Nyquist plot and equivalent circuit are shown in Figure 5c, which shows the single semicircle and inclined line from the high- to low-frequency range. Figure 5d shows the diffusion rate of Li (D) ions; calculations are carried out using the following formula [29,30]:
Meanwhile, the Warburg factor (the slope of the line curve) is found using the following formula:
The detailed description D is the diffusion coefficient (cm2 s−1); R, gas constant (J mol−1 K−1); T, absolute temperature (K); A, surface area of electrode (cm2); F, Faraday’s constant; C, the molar concentration of Li+ ions (1 × 10⁻³ mol cm−3); and ω is the angular frequency at low frequency (s−1) [31].
3. Discussion
No impurities were found in all LTO samples. The presence of carbon in the XRD pattern around 25° was not observed; this could be because of the lower amount of carbon as shown in the TGA results. Table 1 shows that the lattice parameter increases with the increasing mol of fluoride. The increase in the lattice parameter may occur because of the F− ion occupying the position of the O2− ion. However, the ion size of F− (0.133 nm) is smaller than that of O2− (0.140 nm), which is opposite to Vegard’s rule for substitution [32]. The increase in the crystal size and lattice parameter for F-doped LTO could be described as follows: when the F− ion substitutes the position of the O2− ion at the 32e site position, Ti3+ at the 16d site position will move randomly at the 8b, 48f or 16c positions, causing charge compensation, which ultimately causes an increase in the lattice parameter [33]. Therefore, the lattice parameter of F-doped LTO would increase with the addition of F− ions.
In the SEM images, the grain size of F-doped LTO does not seem too different from that of the pristine LTO sample. Many grains have a diameter range of 300–500 nm in size, as presented in Figure 2e, and the carbon coating appears to form a thin layer on the surface of LTO 0.2F, as seen in TEM images in Figure 2f. In the TGA results, as shown in Figure 3f, the weight loss before the temperature of 150 °C could be due to the evaporation process of the water absorbed in the sample, and then drastic weight loss occurs in the temperature range of 300–500 °C, which is the range at which the combustion process of carbon occurs [34]. Next, the curve undergoes a flat slope, indicating a stable process of sample oxidation to a temperature of 700 °C, at which the combustion residue is formed. From this curve, the percentage C is calculated to be approximately below 8.0 wt.%.
In Figure 4a,b, the first curve of the CV has a slightly different shape from the second CV curve, which shows the decomposition of the electrolyte and the solid electrode interface (SEI) formation process [35]. It can also be seen that the reduction curves from the first and second cycles have shifted to a greater potential, indicating an electrochemical activation process. The first cathodic curves of LTO and LTO 0.2F are located at 1.41 V and 1.43 V, which can be considered a gradual process of Li ions inserting into the LTO crystal structure to form LiO [36]. Next, the overlap between the anodic peaks at 1.68 V of both the CV curves shows the stability of the reversible process from the electrochemical reactions that occur in LTO and LTO 0.2F. To see the effect of fluoride addition, compared to the CV of the pristine LTO curve, the peak intensity of the LTO 0.2F CV curve is much higher and sharper than that of the pristine LTO. As can be seen in Figure 4b, LTO 0.2F has higher and sharper redox peaks, with a potential difference of 0.25 V less than pristine LTO, which indicates the low polarization degree of LTO 0.2F. F-doping on LTO is thought to be particularly beneficial for minimizing electrode polarization. Furthermore, for LTO 0.2F, a higher peak current suggests increased conductivity, which could be due to the substitution of O ions with F ions, resulting in an excess charge as compensation for the difference in the charge of Ti4+ turning into Ti3+, which generates electrons that ultimately increase the electronic conductivity of LTO 0.2F [37].
The galvanostatic charge–discharge profile in Figure 4c,d shows that pristine LTO experiences a drastic decrease in specific discharge capacity, followed by LTO 0.1F and LTO 0.15F samples, whereas LTO 0.2F does not experience a significant decrease in its specific discharge capacity. The increase in—and stable discharge capacity of—LTO 0.2F are probably due to the addition of coatings as well as fluoride doping, which can increase the conductivity of LTO 0.2F. Therefore, the LTO 0.2F sample was selected for further experiments and compared to the pristine LTO sample.
Figure 4e,f presents the rate-performance of pristine LTO and LTO 0.2F, of which the latter has a higher specific discharge capacity than pristine LTO. This could be due to F-doping on the LTO crystal structure, causing an increase in lattice parameters and cell volume, as shown in Table 1, which is a wider path for the mobility of Li+ ions during the insertion and extraction process [38]. It is beneficial for enhancing Li+ ion transport during the charge–discharge process. In addition, LTO’s electronic conductivity increased because of the carbon and nitrogen coating, which provides an additional channel for electrons to move faster, thereby increasing the electronic conductivity of the LTO [39].
In EIS, fitting results in an equivalent circuit, where Rs represents the resistance of the electrolyte, separator and electrodes which for LTO 0.2F is smaller than that of pristine LTO. Meanwhile, at high and moderate frequencies, Rct is represented by the diameter of a semicircle, whereas at low frequencies, the inclined line is related to Warburg impedance. From the fitting results, it is found that the Rct of LTO 0.2F is smaller than that of LTO. This shows that the high charge transfer capability of LTO 0.2F is higher, which causes the fast kinetic insertion and extraction process of lithium ions. This may be due to the synergy effect of F-doping on the LTO structure, which produces excess charge and carbon-nitrogen coating on the surface of LTO 0.2F.
From the calculation results of the plotted curve as shown in Figure 5d, the diffusion coefficients for LTO and LTO 0.2F are 1.64 × 10⁻¹⁵ cm−2 s−1 and 2.82 × 10⁻¹⁴ cm−2 s−1, respectively. This provides evidence that F-doping on the LTO structure can increase the diffusion rate of Li+ ions. This may be due to the wider path opening in the crystal structure of LTO 0.2F (Table 1) for the Li+ ion transport during the insertion and extraction process [40]. In addition, Table 2 compares the electrochemical performance for the current F-doping on the LTO with similar works. It shows that the LTO 0.2F sample has competitive electrochemical performance in terms of capacity and rate capability.
Table 2.
Summary of the F-doped LTO materials and their electrochemical performance.
4. Materials and Methods
4.1. Preparation of Double-Coated F-Doped LTO
Li2CO3 (Merck, Darmstadt, Germany, 99%), TiO2 (Merck, 99%) and LiF (Merck, 99%) powders were used as precursor materials. All precursor powders were weighed according to the mol variation in which 1 mol of LTO is mixed with 0.1, 0.15 and 0.2 mol of LiF. The mass of 1 mol of LTO is equivalent to 4.6 g, and the mol of LiF with 0.1, 0.15 and 0.2 mol is 0.0259, 0.0389 and 0.0519 g, respectively. The precursor powders were then put into a chamber of a ball mill, and 8 mL of ethanol (99%) was added as solvent. All precursor powders were mixed and ground for 6 h in a high-energy ball mill at 600 rpm. Following the ball-milling operation, the powder was placed in an alumina crucible and calcined for 10 h at 700 °C. The preparation of the F-doped LTO sample was completed. Moreover, the LTO sample without doping F was also prepared by the same method, then all the samples were labeled as pristine LTO, LTO 0.1F, LTO 0.15F and LTO 0.2F. Finally, the as-prepared material after calcination was coated with carbon and nitrogen by the pyrolysis of Polyaniline (Merck, 99%) at temperature 700 °C in an Argon gas tube furnace for 1 h.
4.2. Material Characterization
X-ray Diffraction (XRD) tests were performed utilizing PANAnalythical equipment (Phillips, The Netherlands) at an angle range of 10°–90° and CuKα wavelength of 1.54056 Ǻ to analyze the phases of all samples. Phillips-Inspect S50 Scanning Electron Microscopy–Energy Dispersive X-ray Spectroscopy (SEM–EDS) with 20 kV energy (FEI Technologies Inc., Hillsboro, OR, USA) was used to study the morphology of LTO. Thermogravimetric Analysis (TGA) was carried out to measure the percentage of carbon by TGA 2 Mettler Toledo (Mettler-Toledo International Inc., Switzerland). High-resolution of Transmission Electron Microscopy (TEM) images were obtained by Talos™ F200X TEM (Thermo Scientific™, Waltham, MA, USA).
4.3. Electrochemical Measurement
Electrochemical performance testing was carried out with a half-cell system using a CR2032 coin cell. The cell assembly process was carried out in a glove box filled with argon gas (Vigor Tech, Houston, TX, USA). The slurry of the electrode material consisted of a mixture of active material, acetylene black and polyvinylidene fluoride with a weight ratio of 80:10:10 dissolved in N-methyl-2-pyrrolidinone (NMP). The slurry was then coated with sufficient thickness on the current collector of a copper foil cut with area of 1 cm2 and dried in a vacuum oven at a temperature of 80 °C for 12 h. Li metal was used as a reference, as well as a counter electrode, and the separator was polypropylene microporous membrane (Celgard®, Charlotte, NC, USA). LiPF6 (1 M) was dissolved in ethyl methyl carbonate and ethylene carbonate solvents to make the electrolyte for the test (7:3 volume ratio). The Neware CT-4008 instrument (Neware Technology Limited, Shenzhen, China) was used to perform a galvanostatic charge–discharge test in the voltage range 1.0–3.0 V with C-rates of 0.5 C, 1 C, 2 C, 5 C and 10 C. The CorrTest CS310 electrochemical workstation (Wuhan Corrtest Instruments Corp., Ltd., Wuhan, China) was used to conduct a cyclic voltammetry (CV) test at a voltage range of 1.0–3.0 V vs. Li/Li+ at a scan rate of 0.1 mV/s. The CorrTest CS310 electrochemical workstation was used to perform an electrochemical impedance spectroscopy (EIS) test on the sample using a sine wave of 10 mV amplitude across a frequency range of 0.1–100 kHz.
5. Conclusions
A direct double coating of F-doped LTO was successfully synthesized by the solid-state method, followed by the pyrolysis process of polyaniline. The carbon content was confirmed at about 8.0 wt.%. XRD results showed that the increased F ion enhanced the cell volume of LTO. LTO 0.2F particles are an irregularly shaped, with the carbon coating covering the surface of the LTO sample. With the highest specific discharge capacity of 165.38 mAh g−1 at 0.5 C and capacity fading of 93.51% after 150 cycles, LTO 0.2F has the best electrochemical performance. The electronic conductivity and mobility of Li+ ions in the LTO 0.2F are improved because of the synergy effect of the carbon-nitrogen coating and F-doping.
Author Contributions
Conceptualization and writing—original draft, L.N.; methodology, A.S.; validation, B.P.; investigation, A.T.W.; resources, W.; writing—review and editing, W.C.; funding acquisition, L.N. and W.C. All authors have read and agreed to the published version of the manuscript.
Funding
This research was financially supported by WCR 2021 scheme (No. 1048/PKS/ITS/2021). The Article Processing Charge (APC) for the publication was provided by Wahyu Caesarendra.
Institutional Review Board Statement
Not applicable.
Informed Consent Statement
Not applicable.
Data Availability Statement
The data presented in this study are available on request from the corresponding author.
Conflicts of Interest
The authors declare no conflict of interest.
References
- Sun, X.; Radovanovic, P.V.; Cui, B. Advances in spinel Li4Ti5O12 anode materials for lithium-ion batteries. New J. Chem. 2015, 39, 38–63. [Google Scholar] [CrossRef]
- Fong, R.; von Sacken, U.; Dahn, J.R. Studies of Lithium Intercalation into Carbons Using Nonaqueous Electrochemical Cells. J. Electrochem. Soc. 1990, 137, 2009–2013. [Google Scholar] [CrossRef]
- Bai, P.; Li, J.; Brushett, F.R.; Bazant, M.Z. Transition of lithium growth mechanisms in liquid electrolytes. Energy Environ. Sci. 2016, 9, 3221–3229. [Google Scholar] [CrossRef] [Green Version]
- Kasnatscheew, J.; Placke, T.; Streipert, B.; Rothermel, S.; Wagner, R.; Meister, P.; Laskovic, I.C.; Winter, M. A Tutorial into Practical Capacity and Mass Balancing of Lithium Ion Batteries. J. Electrochem. Soc. 2017, 164, A2479–A2486. [Google Scholar] [CrossRef]
- Vikram Babu, B.; Vijaya Babu, K.; Tewodros Aregai, G.; Seeta Devi, L.; Madhavi Latha, B.; Sushma Reddi, M.; Samatha, K.; Veeraiah, V. Structural and electrical properties of Li4Ti5O12 anode material for lithium-ion batteries. Results Phys. 2018, 9, 284–289. [Google Scholar] [CrossRef]
- Chen, M.; Li, W.; Shen, X.; Diao, G. Fabrication of Core–Shell α-Fe2O3@ Li4Ti5O12 Composite and Its Application in the Lithium Ion Batteries. ACS Appl. Mater. Interfaces 2014, 6, 4514–4523. [Google Scholar] [CrossRef]
- Shen, L.; Uchaker, E.; Zhang, X.; Cao, G. Hydrogenated Li4Ti5O12 Nanowire Arrays for High Rate Lithium Ion Batteries. Adv. Mater. 2012, 24, 6502–6506. [Google Scholar] [CrossRef]
- Kang, E.; Jung, Y.S.; Kim, G.-H.; Chun, J.; Wiesner, U.; Dillon, A.C.; Kim, J.K.; Lee, J. Highly Improved Rate Capability for a Lithium-Ion Battery Nano-Li4Ti5O12 Negative Electrode via Carbon-Coated Mesoporous Uniform Pores with a Simple Self-Assembly Method. Adv. Funct. Mater. 2011, 21, 4349–4357. [Google Scholar] [CrossRef]
- Jung, H.-G.; Myung, S.-T.; Yoon, C.S.; Son, S.-B.; Oh, K.H.; Amine, K.; Scrosati, B.; Sun, Y.-K. Microscale spherical carbon-coated Li4Ti5O12 as ultra high power anode material for lithium batteries. Energy Environ. Sci. 2011, 4, 1345–1351. [Google Scholar] [CrossRef]
- Kasnatscheew, J.; Streipert, B.; Röser, S.; Wagner, R.; Cekic Laskovic, I.; Winter, M. Determining oxidative stability of battery electrolytes: Validity of common electrochemical stability window (ESW) data and alternative strategies. Phys. Chem. Chem. Phys. 2017, 19, 16078–16086. [Google Scholar] [CrossRef]
- Li, B.; Han, C.; He, Y.-B.; Yang, C.; Du, H.; Yang, Q.-H.; Kang, F. Facile synthesis of Li4Ti5O12/C composite with super rate performance. Energy Environ. Sci. 2012, 5, 9595–9602. [Google Scholar] [CrossRef]
- Zhu, G.-N.; Liu, H.-J.; Zhuang, J.-H.; Wang, C.-X.; Wang, Y.-G.; Xia, Y.-Y. Carbon-coated nano-sized Li4Ti5O12 nanoporous micro-sphere as anode material for high-rate lithium-ion batteries. Energy Environ. Sci. 2011, 4, 4016–4022. [Google Scholar] [CrossRef]
- Zhu, G.-N.; Wang, Y.-G.; Xia, Y.-Y. Ti-based compounds as anode materials for Li-ion batteries. Energy Environ. Sci. 2012, 5, 6652–6667. [Google Scholar] [CrossRef]
- Yi, T.-F.; Liu, H.; Zhu, Y.-R.; Jiang, L.-J.; Xie, Y.; Zhu, R.-S. Improving the high rate performance of Li4Ti5O12 through divalent zinc substitution. J. Power Sources 2012, 215, 258–265. [Google Scholar] [CrossRef]
- Ji, S.; Zhang, J.; Wang, W.; Huang, Y.; Feng, Z.; Zhang, Z.; Tang, Z. Preparation and effects of Mg-doping on the electrochemical properties of spinel Li4Ti5O12 as anode material for lithium ion battery. Mater. Chem. Phys. 2010, 123, 510–515. [Google Scholar] [CrossRef]
- Zhao, H.; Li, Y.; Zhu, Z.; Lin, J.; Tian, Z.; Wang, R. Structural and electrochemical characteristics of Li4−xAlxTi5O12 as anode material for lithium-ion batteries. Electrochim. Acta 2008, 53, 7079–7083. [Google Scholar] [CrossRef]
- Qi, Y.; Huang, Y.; Jia, D.; Bao, S.-J.; Guo, Z.P. Preparation and characterization of novel spinel Li4Ti5O12−xBrx anode materials. Electrochim. Acta 2009, 54, 4772–4776. [Google Scholar] [CrossRef]
- Ma, Y.; Ding, B.; Ji, G.; Lee, J.Y. Carbon-Encapsulated F-Doped Li4Ti5O12 as a High Rate Anode Material for Li+ Batteries. ACS Nano 2013, 7, 10870–10878. [Google Scholar] [CrossRef]
- Huang, Y.; Qi, Y.; Jia, D.; Wang, X.; Guo, Z.; Cho, W. Il Synthesis and electrochemical properties of spinel Li4Ti5O12−xClxanode materials for lithium-ion batteries. J. Solid State Electrochem. 2012, 16, 2011–2016. [Google Scholar] [CrossRef]
- Chen, Y.; Qian, C.; Zhang, P.; Zhao, R.; Lu, J.; Chen, M. Fluoride doping Li4Ti5O12 nanosheets as anode materials for enhanced rate performance of lithium-ion batteries. J. Electroanal. Chem. 2018, 815, 123–129. [Google Scholar] [CrossRef]
- Chen, Y.; Zhang, H.; Li, Y.; Chen, Y.; Luo, T. Electrochemical performance of Li4Ti5O12/carbon nanotubes/graphene composite as an anode material in lithium-ion batteries. Int. J. Hydrogen Energy 2017, 42, 7195–7201. [Google Scholar] [CrossRef]
- Wei, A.; Li, W.; Zhang, L.; Ren, B.; Bai, X.; Liu, Z. Enhanced electrochemical performance of a LTO/N-doped graphene composite as an anode material for Li-ion batteries. Solid State Ion. 2017, 311, 98–104. [Google Scholar] [CrossRef]
- Mo, L.; Zheng, H. Solid coated Li4Ti5O12 (LTO) using polyaniline (PANI) as anode materials for improving thermal safety for lithium ion battery. Energy Rep. 2020, 6, 2913–2918. [Google Scholar] [CrossRef]
- Zhao, L.; Hu, Y.-S.; Li, H.; Wang, Z.; Chen, L. Porous Li4Ti5O12 Coated with N-Doped Carbon from Ionic Liquids for Li-Ion Batteries. Adv. Mater. 2011, 23, 1385–1388. [Google Scholar] [CrossRef]
- Yanhua, L.; Tan, N.; Huo, D.; Ding, M.; Zhang, Y.; Liu, T.; Yu, R.; Cheng, S.; Fan, R. Fabrication of Porous N-rich Carbon Electrocatalysts from Pyrolysis of PANI-Encapsulated CeO2 for Enhanced Oxygen Reduction Reaction. J. Electrochem. Soc. 2021, 168, 44516. [Google Scholar] [CrossRef]
- Jiang, Z.; Yu, J.; Huang, T.; Sun, M. Recent Advance on Polyaniline or Polypyrrole-Derived Electrocatalysts for Oxygen Reduction Reaction. Polymers 2018, 10, 1397. [Google Scholar] [CrossRef] [Green Version]
- Jiang, C.; Liu, S.; Lian, Q.; Zhao, J.; Ding, W.; Yu, Z.; Huang, R.; Zou, Z. Nitrogen-doped carbon-coated hierarchical Li4Ti5O12-TiO2 hybrid microspheres as excellent high rate anode of Li-ion battery. Ceram. Int. 2017, 43, 11354–11360. [Google Scholar] [CrossRef]
- Xu, X.; Liu, J.; Liu, Z.; Wang, Z.; Hu, R.; Liu, J.; Ouyang, L.; Zhu, M. FeP@C Nanotube Arrays Grown on Carbon Fabric as a Low Potential and Freestanding Anode for High-Performance Li-Ion Batteries. Small 2018, 14, 1800793. [Google Scholar] [CrossRef]
- Qian, D.; Gu, Y.; Chen, Y.; Liu, H.; Wang, J.; Zhou, H. Ultra-high specific capacity of Cr3+-doped Li4Ti5O12 at 1.55 V as anode material for lithium-ion batteries. Mater. Lett. 2019, 238, 102–106. [Google Scholar] [CrossRef]
- Shu, H.; Wang, X.; Wu, Q.; Ju, B.; Liu, L.; Yang, X.; Wang, Y.; Bai, Y.; Yang, S. Ammonia Assisted Hydrothermal Synthesis of Monodisperse LiFePO4/C Microspheres as Cathode Material for Lithium Ion Batteries. J. Electrochem. Soc. 2011, 158, A1448–A1454. [Google Scholar] [CrossRef]
- Noerochim, L.; Caesarendra, W.; Habib, A.; Widyastuti; Suwarno; Ni’mah, Y.L.; Subhan, A.; Prihandoko, B.; Kosasih, B. Role of TiO2 Phase Composition Tuned by LiOH on The Electrochemical Performance of Dual-Phase Li4Ti5O12-TiO2 Microrod as an Anode for Lithium-Ion Battery. Energies 2020, 13, 5251. [Google Scholar] [CrossRef]
- Kahrizi, M.; Ghaffarinejad, A.; Daneshtalab, R. Preparation and effects of F-doping on electrochemical properties of Li4Ti5O12 as anode material for Li-ion battery. Ionics 2021, 27, 1929–1937. [Google Scholar] [CrossRef]
- Scharner, S.; Weppner, W.; Schmid-Beurmann, P. Evidence of Two-Phase Formation upon Lithium Insertion into the Li1.33Ti1.67O4 Spinel. J. Electrochem. Soc. 1999, 146, 857–861. [Google Scholar] [CrossRef]
- Qiu, Y.; Zhang, C.; Zhang, C.; Xie, Q.; Qiao, Z.; Zeng, X.; Xu, W.; Zheng, H.; Li, S.; Lin, J.; et al. CNTs-intertwined and N-doped porous carbon wrapped silicon anode for high performance lithium-ion batteries. J. Alloys Compd. 2021, 877, 160240. [Google Scholar] [CrossRef]
- Yuan, T.; Yu, X.; Cai, R.; Zhou, Y.; Shao, Z. Synthesis of pristine and carbon-coated Li4Ti5O12 and their low-temperature electrochemical performance. J. Power Sources 2010, 195, 4997–5004. [Google Scholar] [CrossRef]
- Yuan, T.; Cai, R.; Wang, K.; Ran, R.; Liu, S.; Shao, Z. Combustion synthesis of high-performance Li4Ti5O12 for secondary Li-ion battery. Ceram. Int. 2009, 35, 1757–1768. [Google Scholar] [CrossRef]
- Zhao, Z.; Xu, Y.; Ji, M.; Zhang, H. Synthesis and electrochemical performance of F-doped Li4Ti5O12 for lithium-ion batteries. Electrochim. Acta 2013, 109, 645–650. [Google Scholar] [CrossRef]
- Tsai, P.; Nasara, R.N.; Shen, Y.; Liang, C.; Chang, Y.; Hsu, W.-D.; Thuy Tran, N.T.; Lin, S. Ab initio phase stability and electronic conductivity of the doped-Li4Ti5O12 anode for Li-ion batteries. Acta Mater. 2019, 175, 196–205. [Google Scholar] [CrossRef]
- Shen, L.; Zhang, X.; Uchaker, E.; Yuan, C.; Cao, G. Li4Ti5O12 Nanoparticles Embedded in a Mesoporous Carbon Matrix as a Superior Anode Material for High Rate Lithium Ion Batteries. Adv. Energy Mater. 2012, 2, 691–698. [Google Scholar] [CrossRef]
- Huang, S.; Wen, Z.; Gu, Z.; Zhu, X. Preparation and cycling performance of Al3+ and F− co-substituted compounds Li4AlxTi5−xFyO12−y. Electrochim. Acta 2005, 50, 4057–4062. [Google Scholar] [CrossRef]
- Bai, X.; Li, W.; Wei, A.; Chang, Q.; Zhang, L.; Liu, Z. Preparation and electrochemical performance of F-doped Li4Ti5O12 for use in the lithium-ion batteries. Solid State Ion. 2018, 324, 13–19. [Google Scholar] [CrossRef]
Publisher’s Note: MDPI stays neutral with regard to jurisdictional claims in published maps and institutional affiliations. |
© 2022 by the authors. Licensee MDPI, Basel, Switzerland. This article is an open access article distributed under the terms and conditions of the Creative Commons Attribution (CC BY) license (https://creativecommons.org/licenses/by/4.0/).