
Lithium-Ion Battery Thermal Management Systems: A Survey and New CFD Results

 ,
, 

Abstract
:
1. Introduction
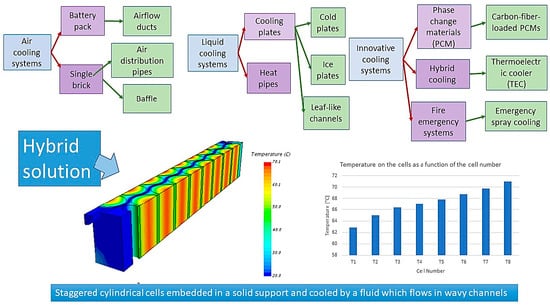
2. A Survey of the Battery Thermal Management Systems
2.1. Air Cooling—Prismatic Cells
Air Cooling—Cylindrical Cells
2.2. Liquid Cooling
2.2.1. Cooling Plate Technology
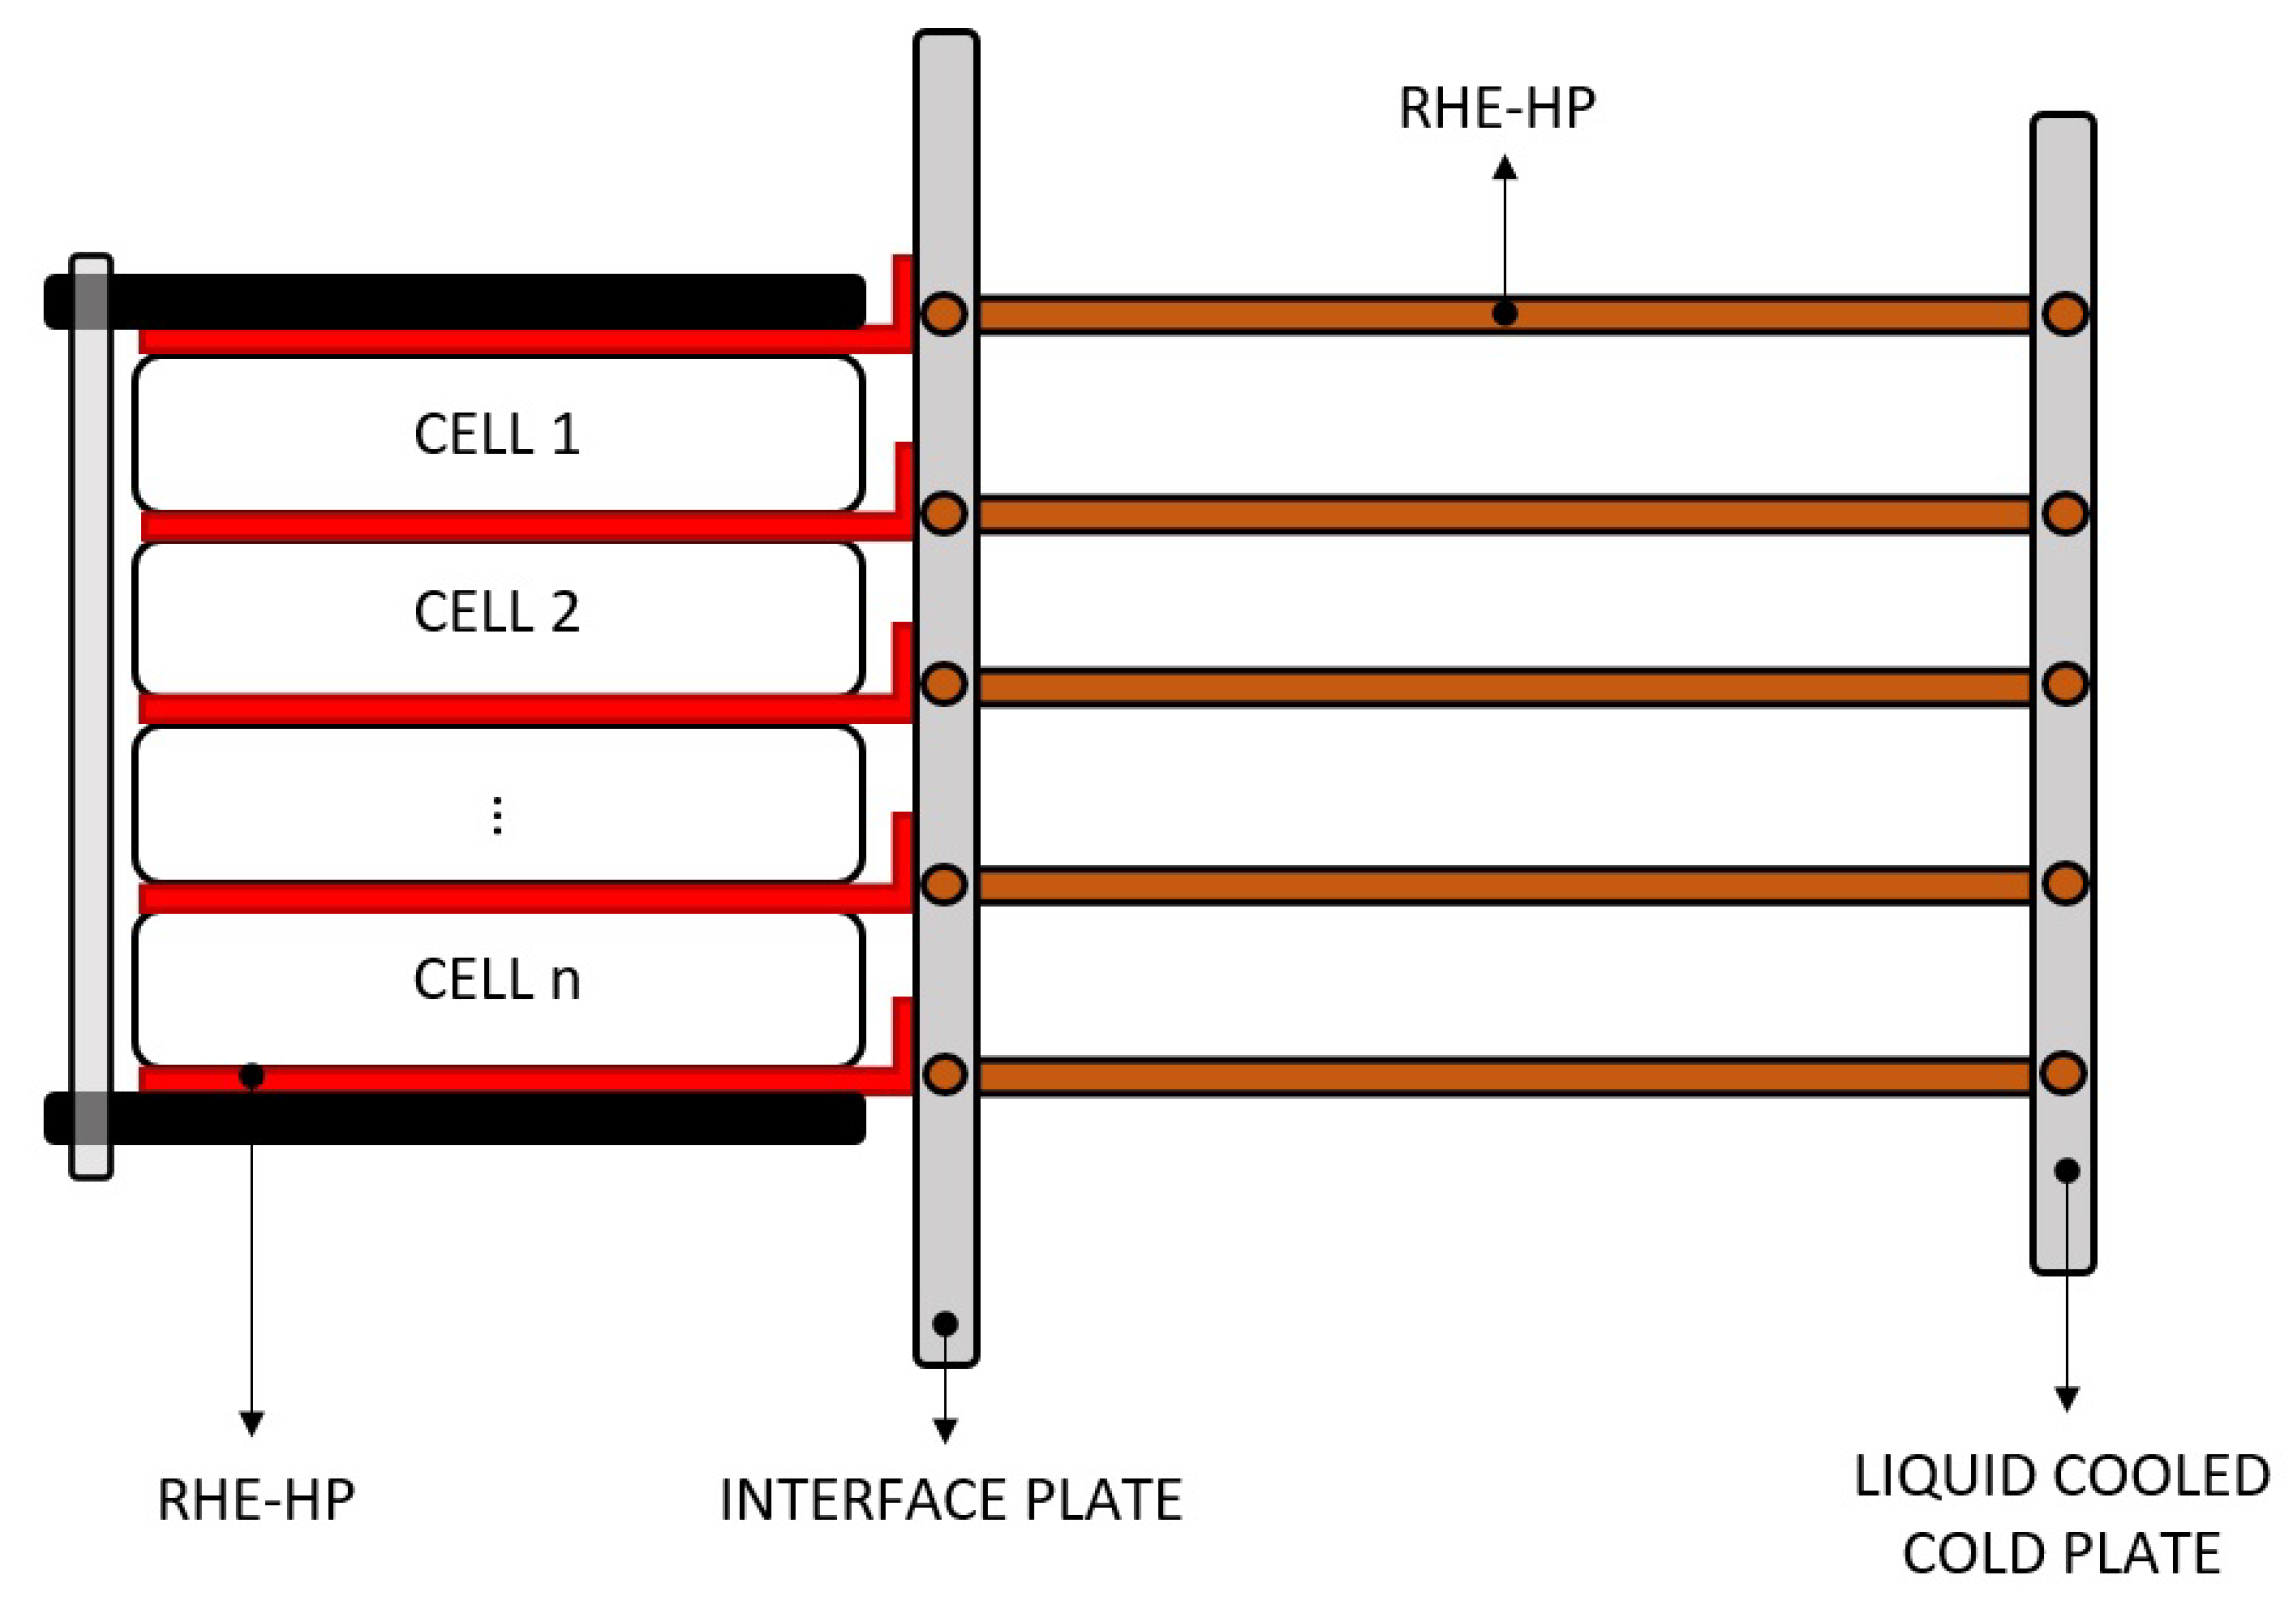
2.2.2. Heat Pipes
2.2.3. Immersive Solutions
2.3. Innovative Cooling Strategies
Phase Change Materials
2.4. Hybrid Cooling Systems
2.5. Fire-Prevention Strategies
2.5.1. Methods to Prevent Thermal Runaway
- Cell-to-cell. This is the highest level of protection using engineered materials between every single cell. Obviously, if we consider space constraints, this represents a challenge but the advantages are relevant: in case of thermal runaway, the material surrounding the cells absorbs heat and minimize the propagation of thermal effects to the adjacent cells [47]. Thanks to their heat-absorbing nature, phase-change materials (PCMs) are often used in cell-to-cell protection. Moreover, if they change phase from liquid to gas, they also bring with them the cell gases out from the battery modules. The shape of the cells has to be taken into account because it influences the PCM that it is possible to use. For cylindrical cells, the PCM can be solid; it is not the same for pouch batteries that need liquid phase material as they expand and contract continuously.
- Module-to-module. This kind of protection follows the same philosophy of the cell-to-cell one, but it separates the modules one from the other. This is a lower level of protection with respect to the previous one but it is lighter and easily fittable on several kinds of batteries.
- Battery pack. This represents the lowest level of protection because it does not work against the heat propagation between the cells or between the modules, but it only gives more time to the car occupants to put themselves in safe.
2.5.2. Emergency Spray Cooling
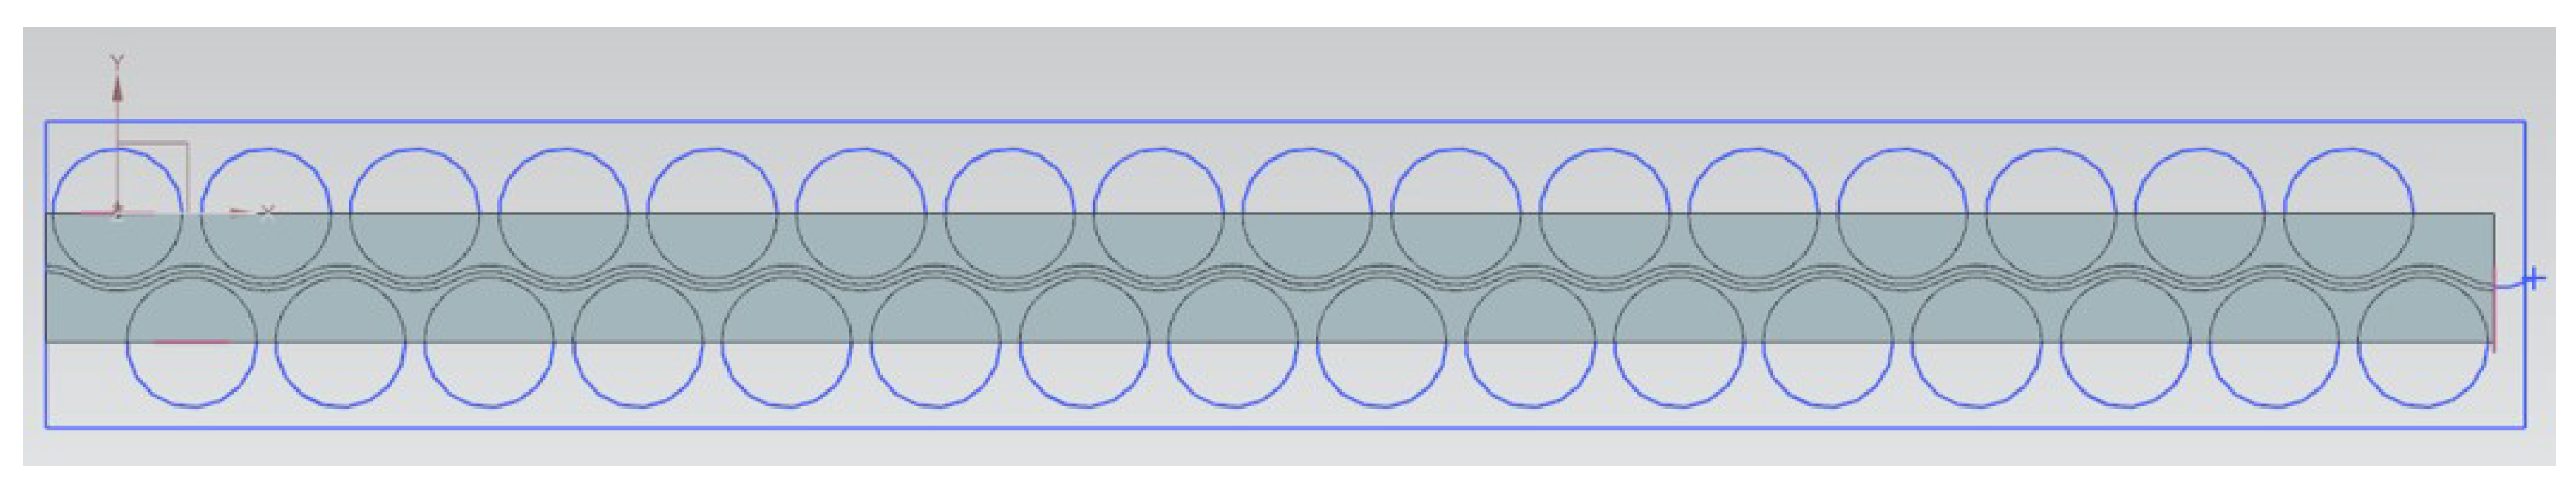
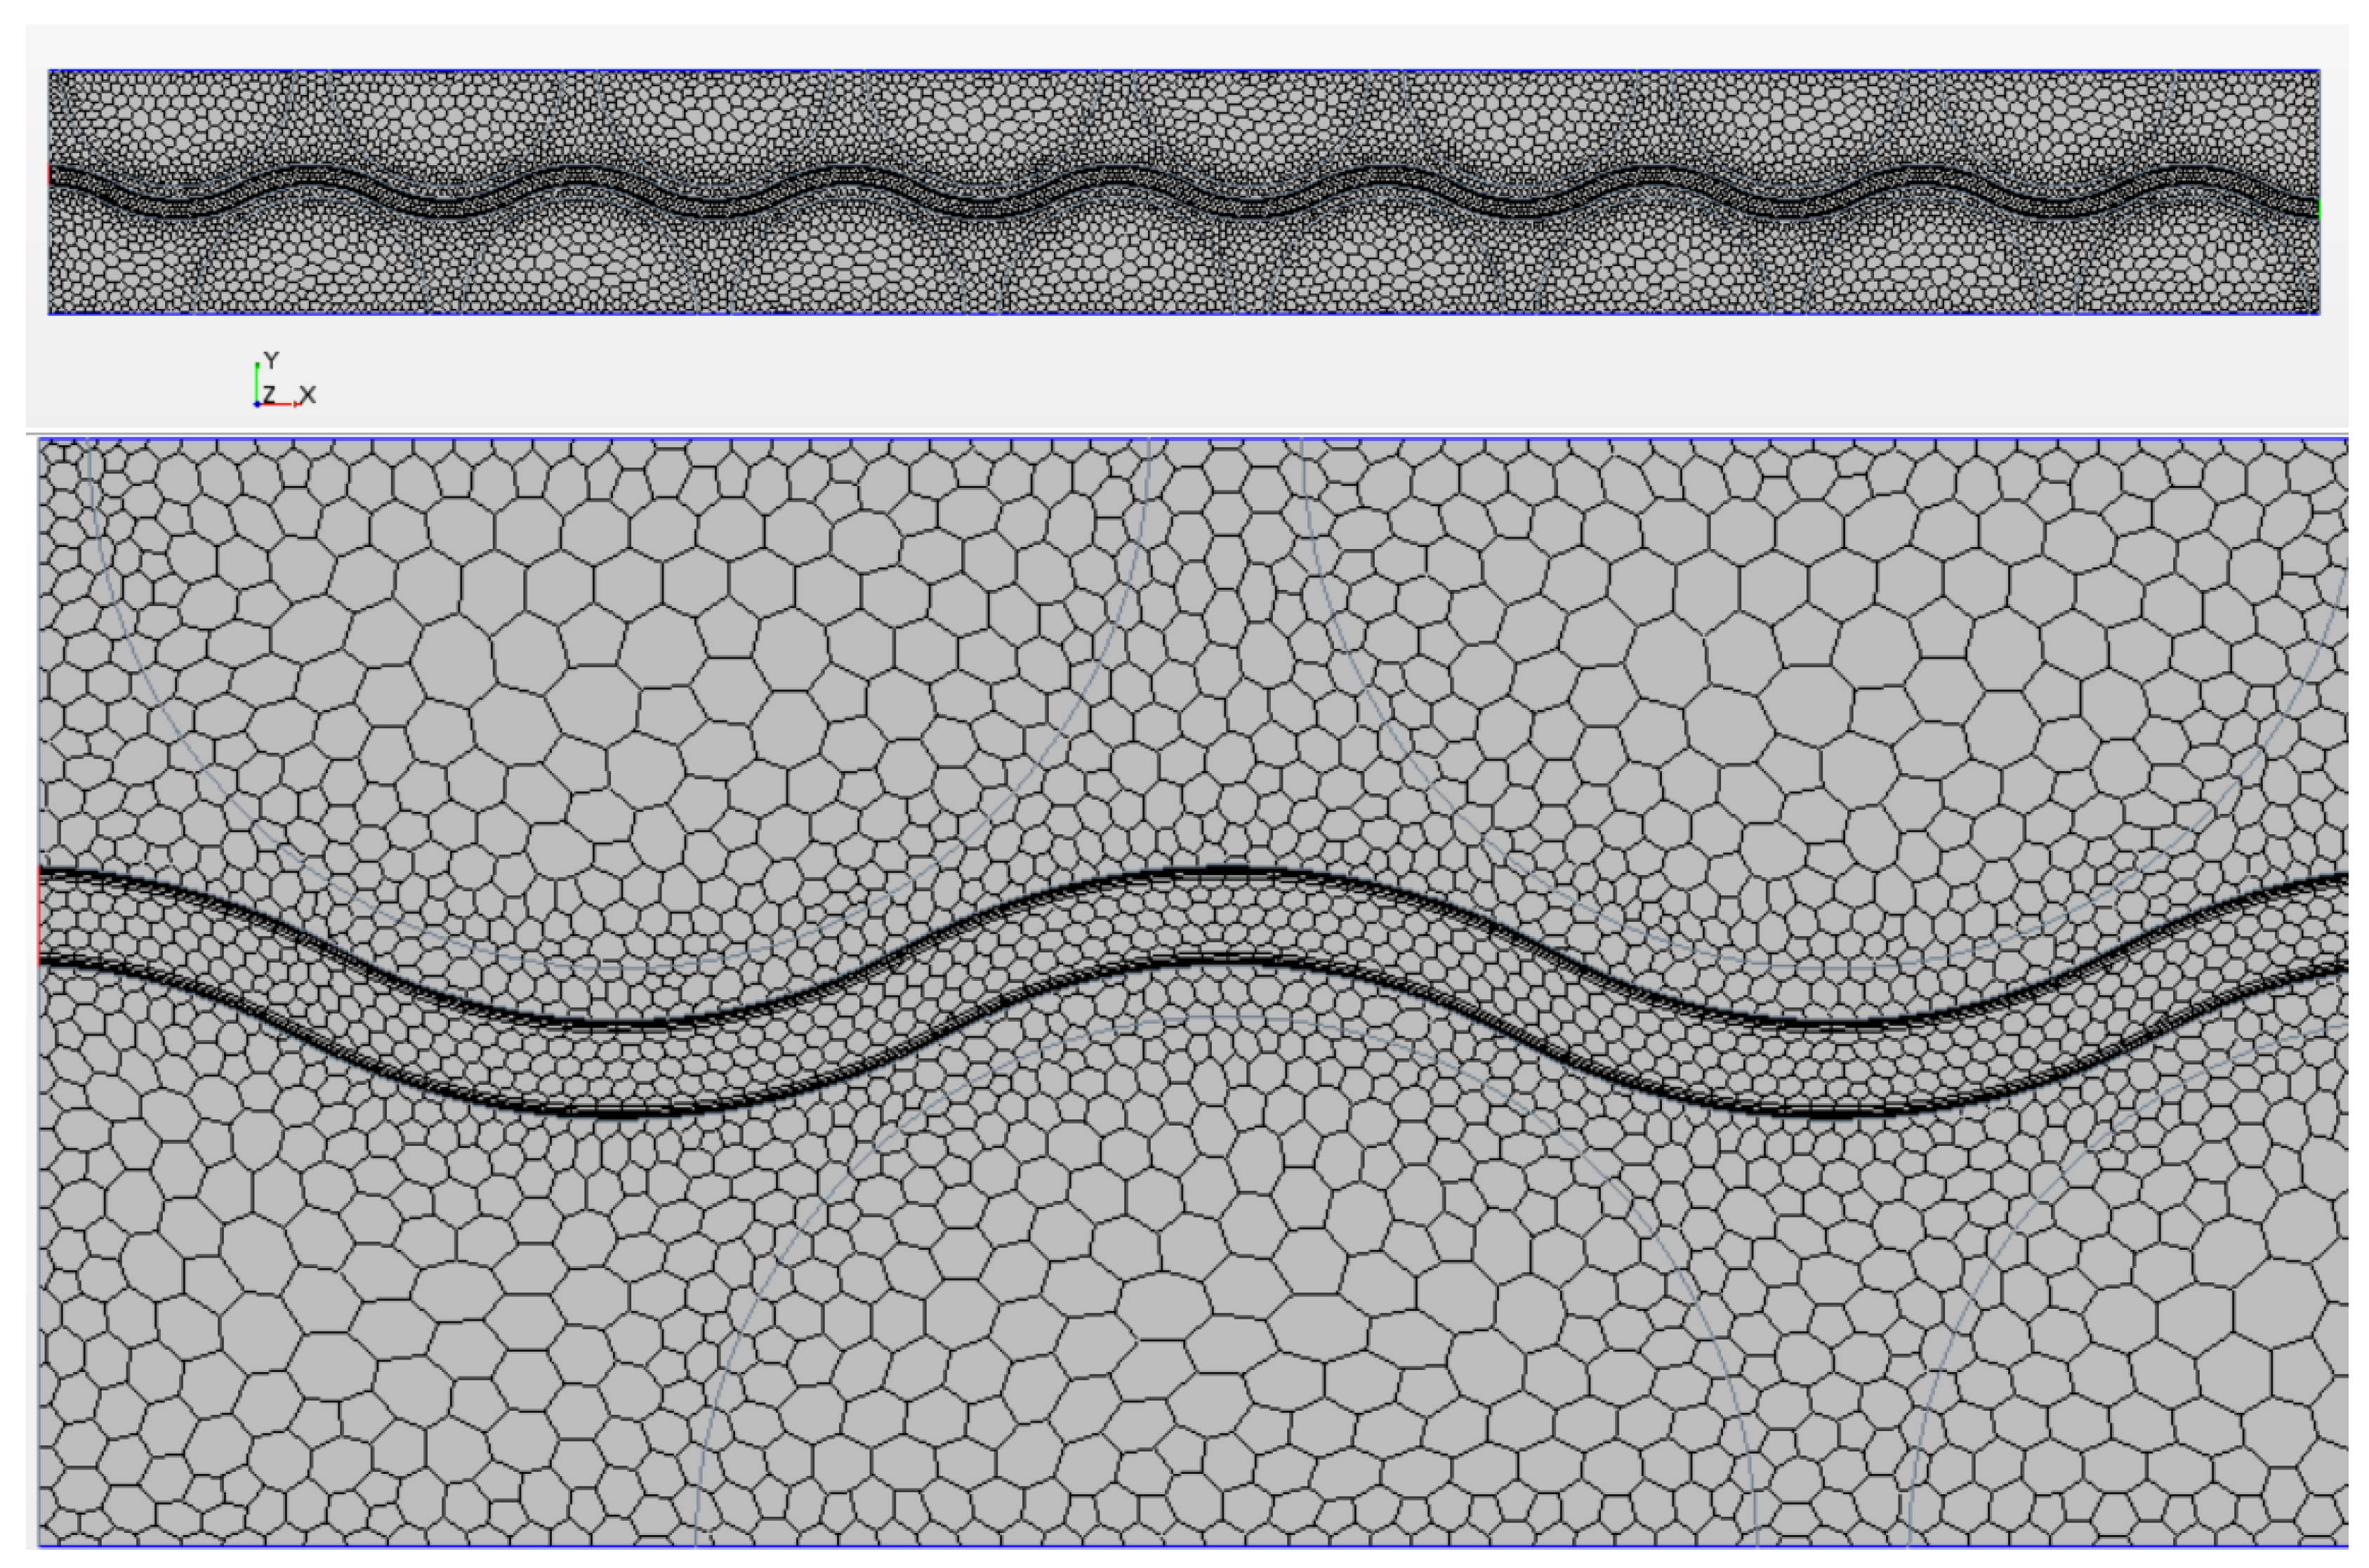
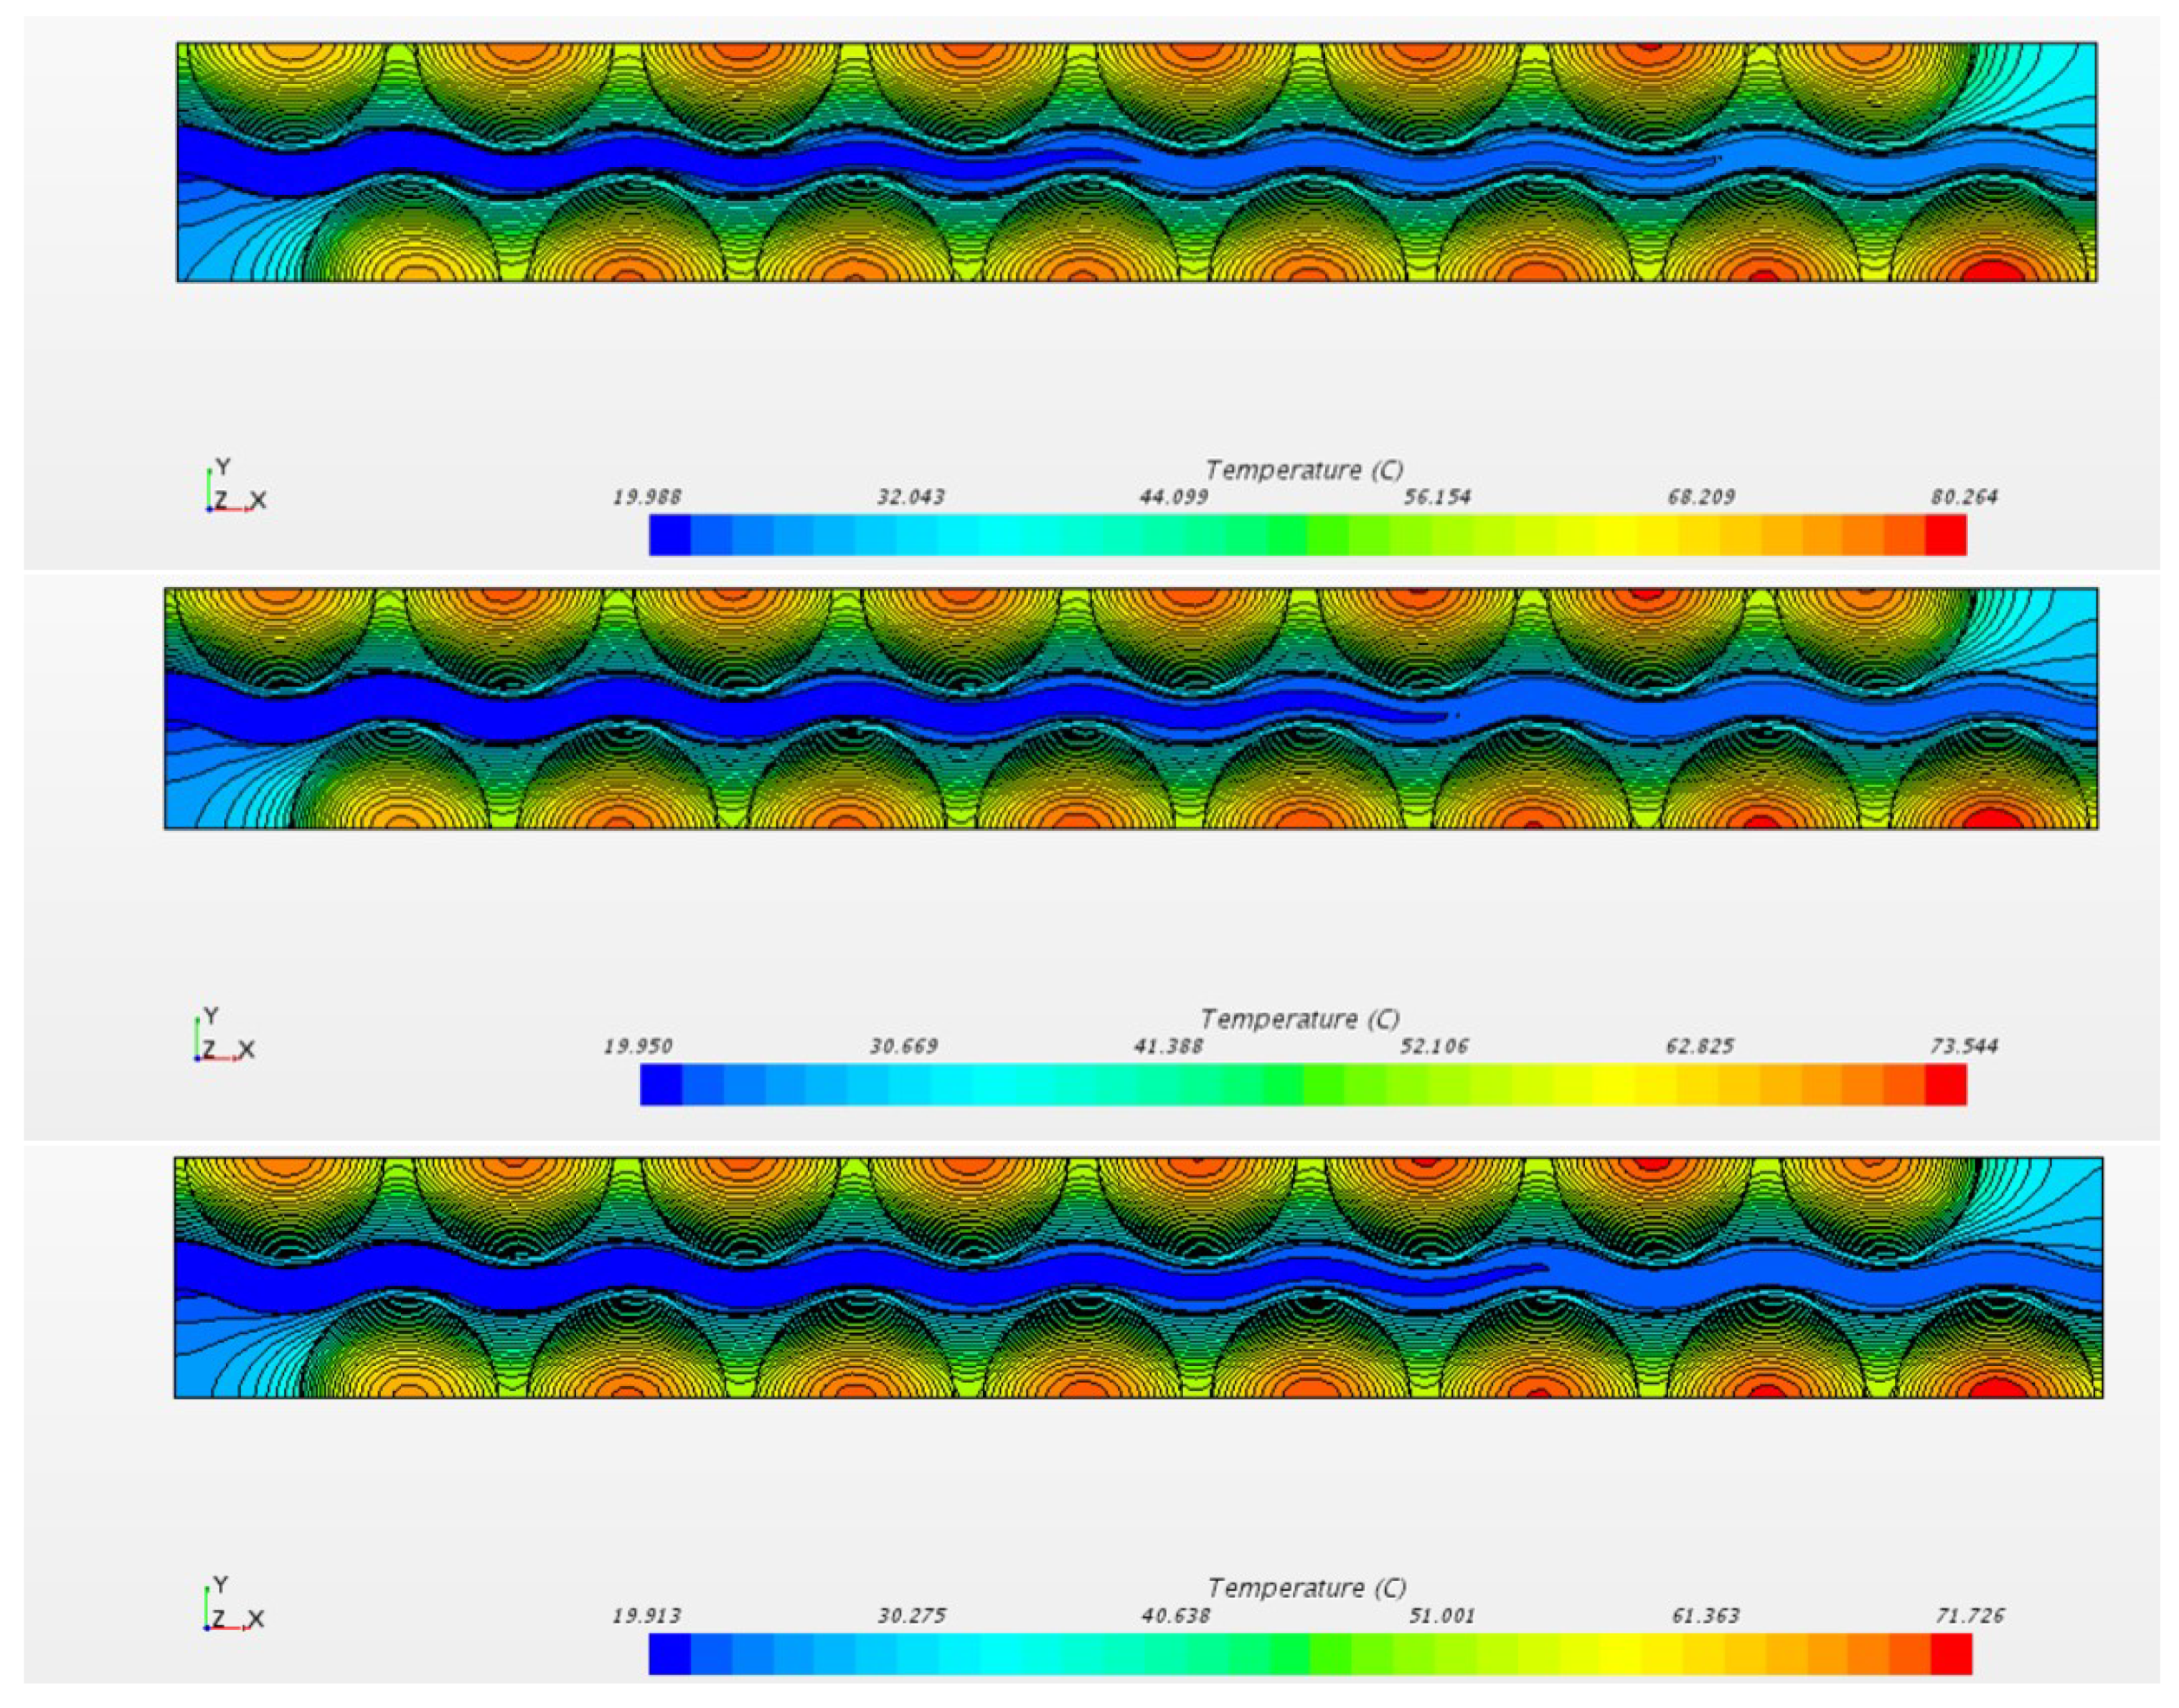
3. CFD Analysis of a Hybrid Solution
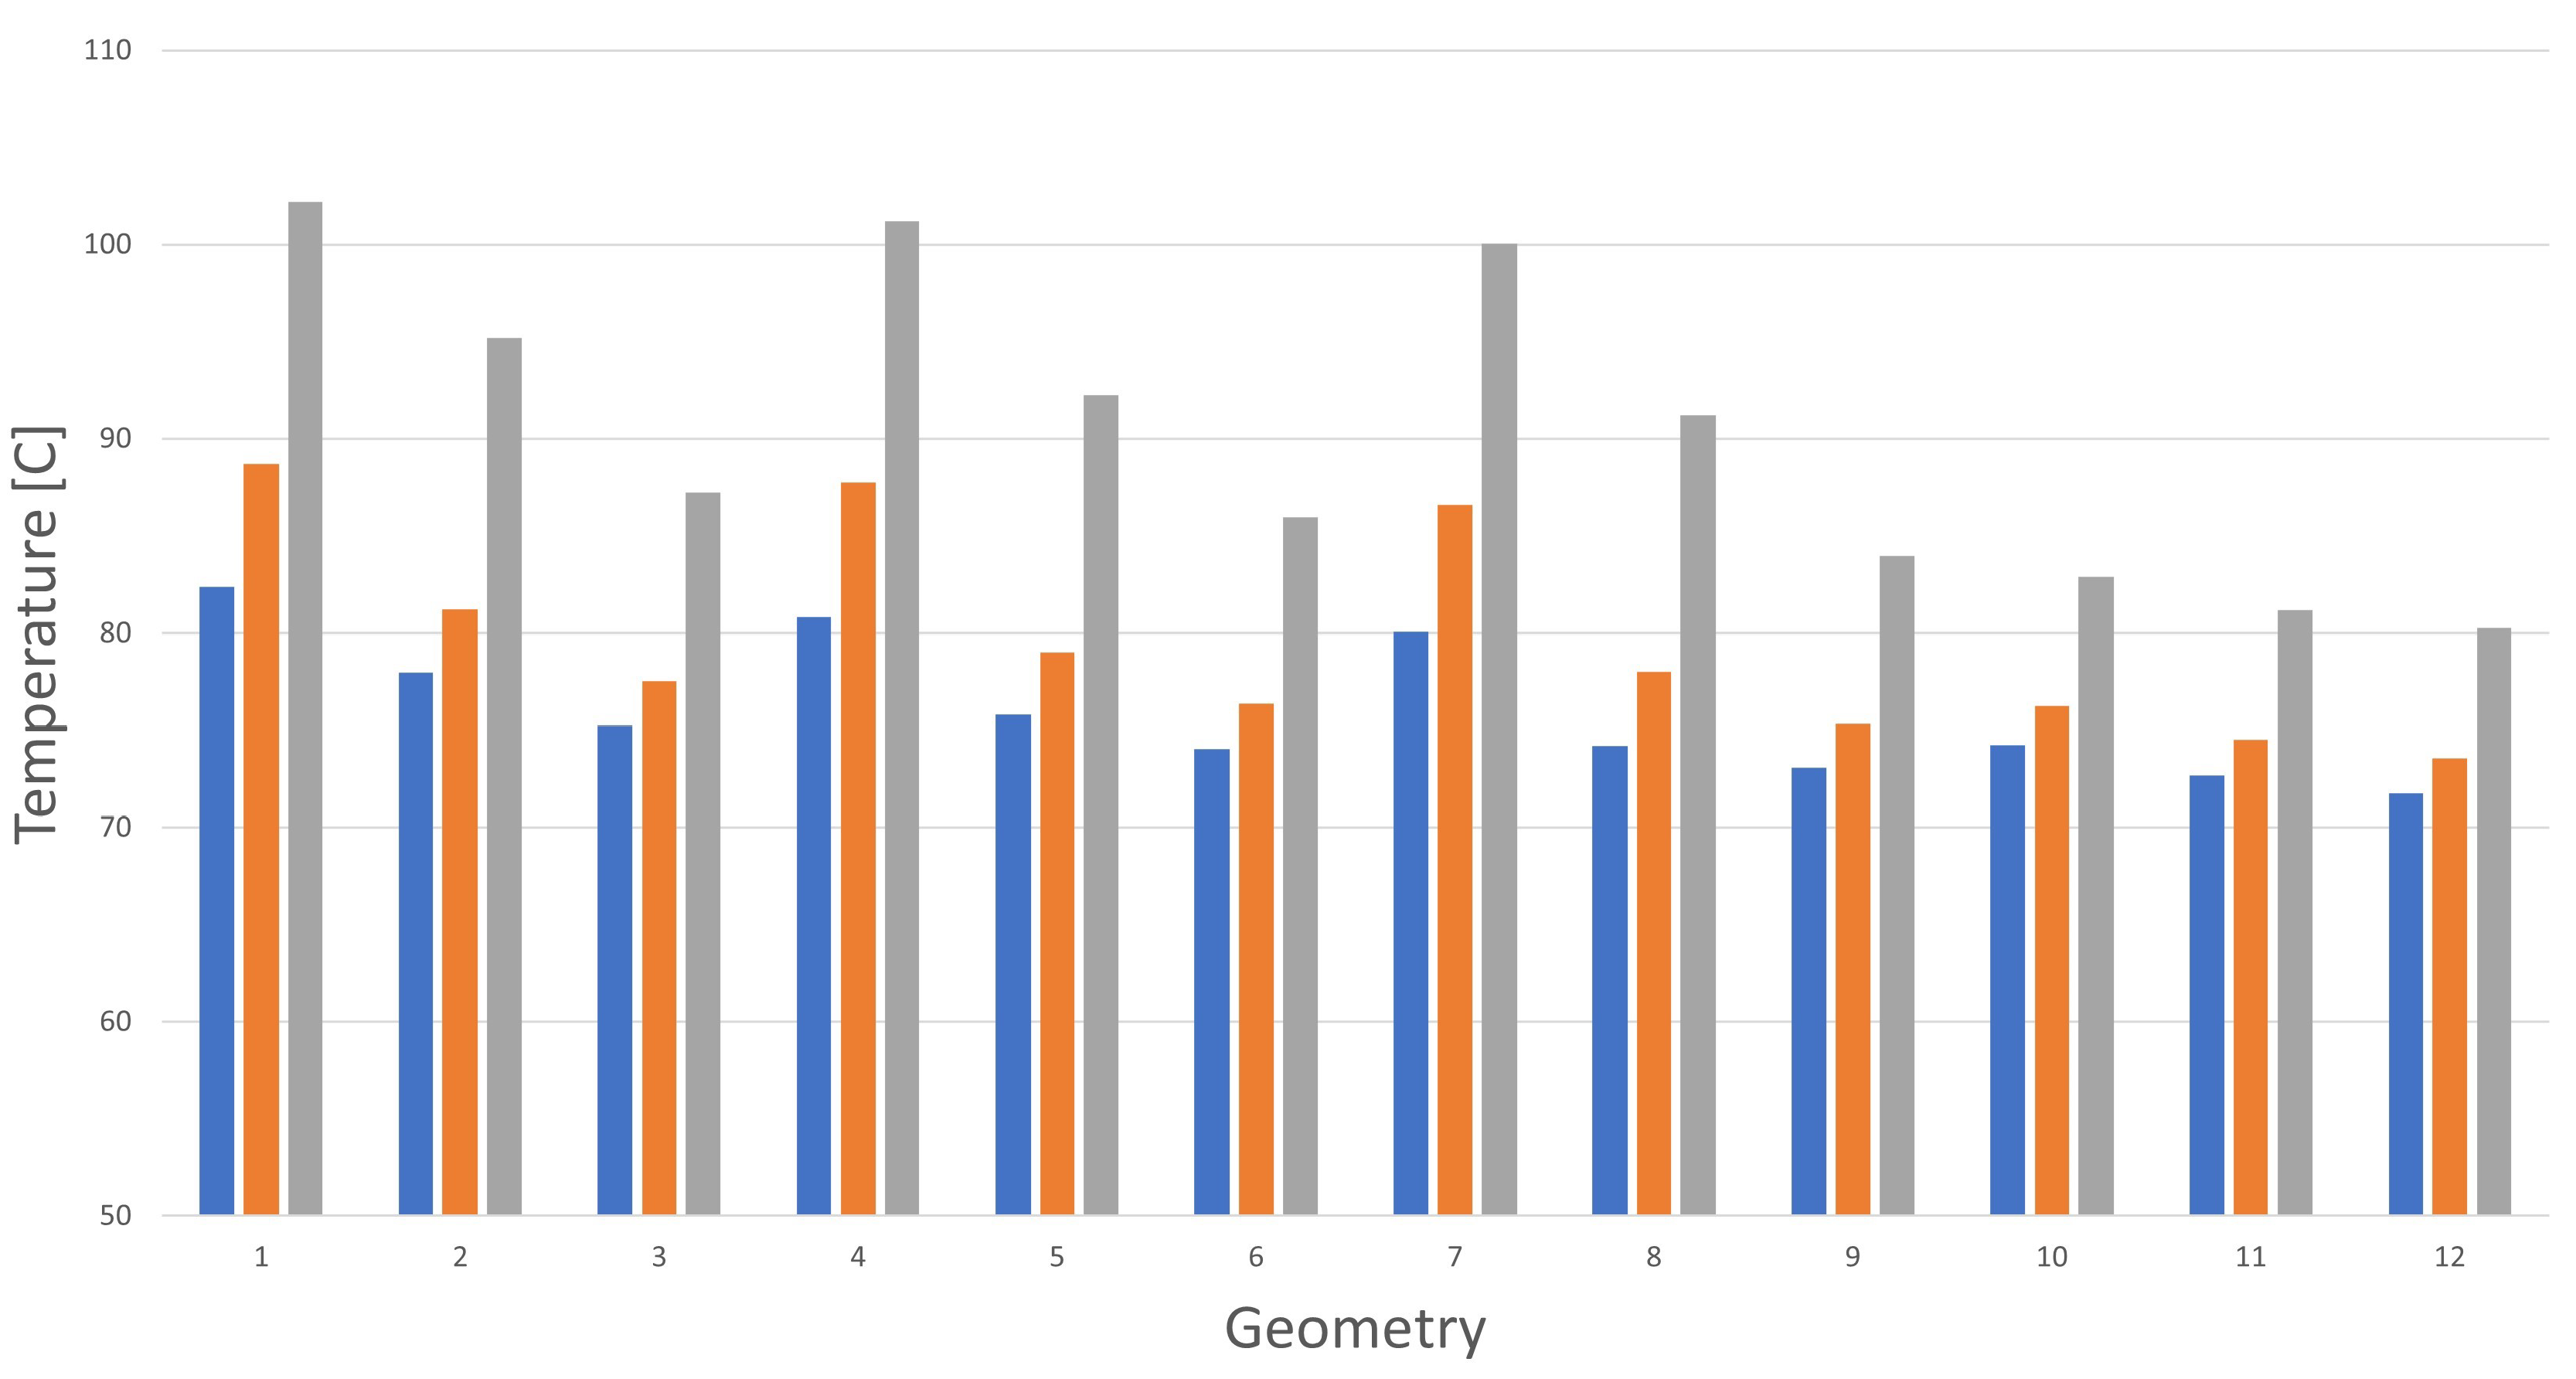
3.1. Air-Cooling
- The maximum temperature of the cells decreases weakly as the axial distance between the cells, and it strongly decreases with the channel width,
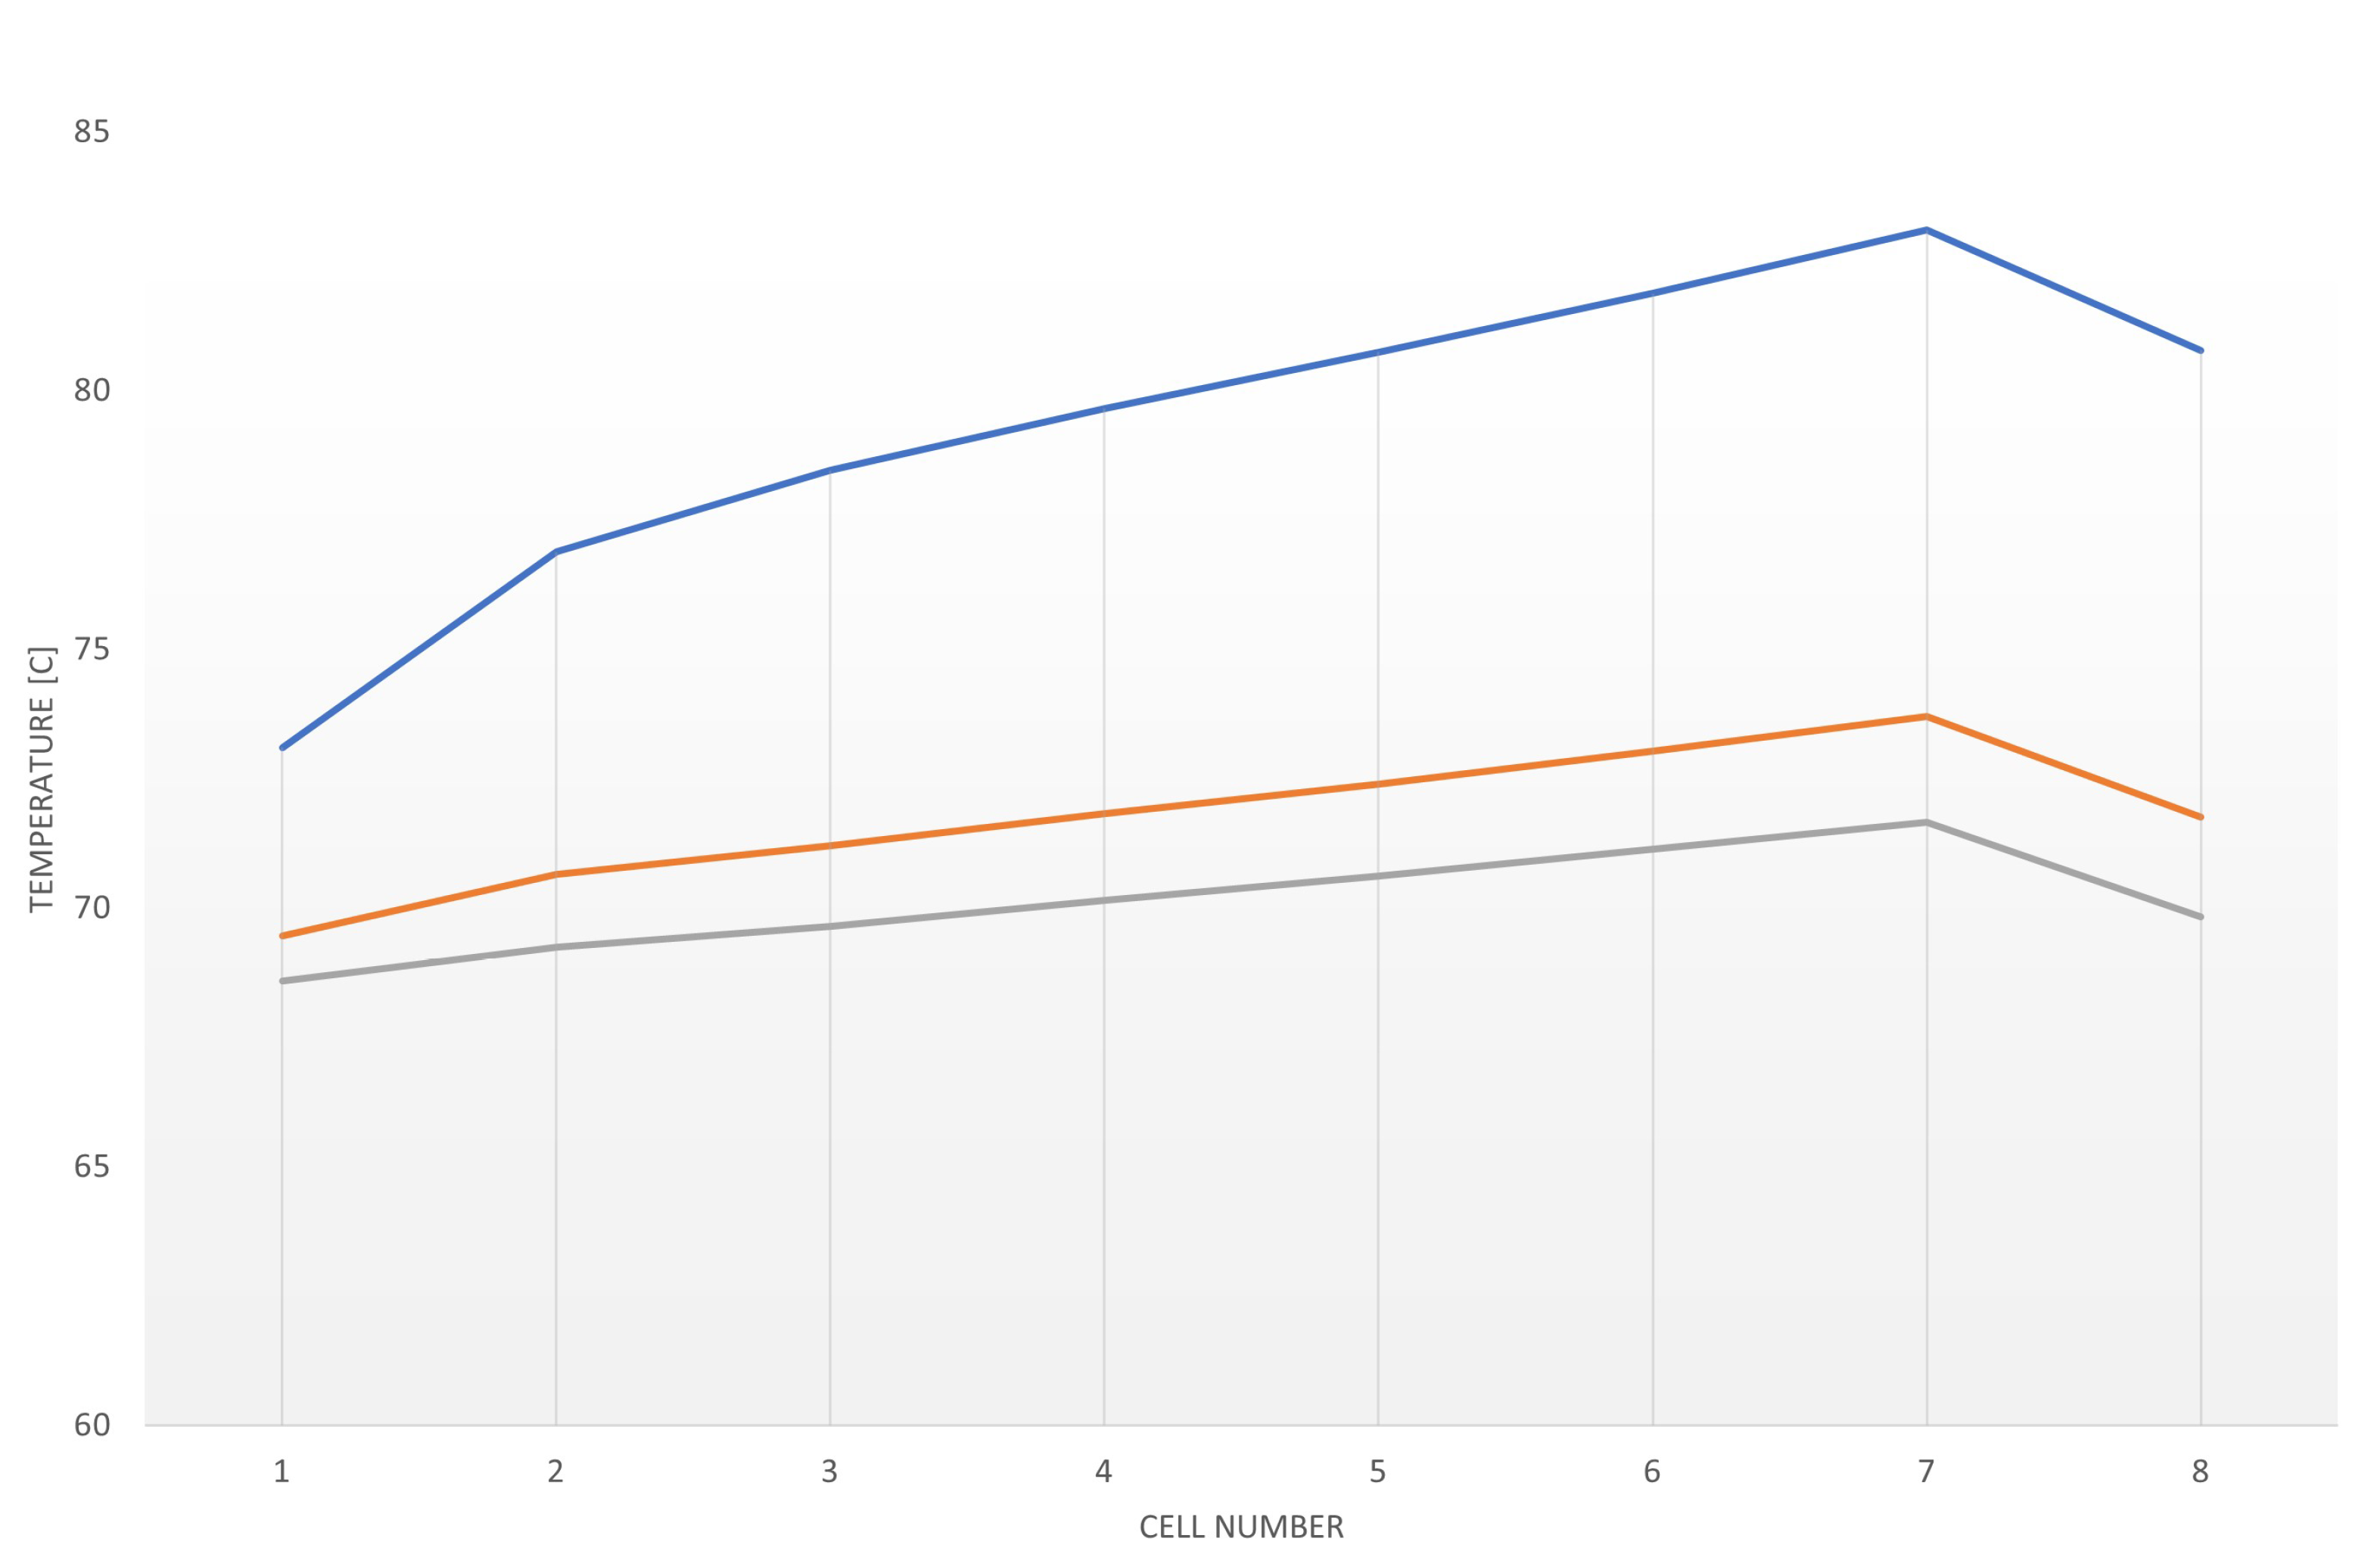
- The temperature of the cells linearly increases with the number of the cells in the direction of the flow, and the trend is a function of the air-flow velocity within the channels,
- By changing the solid material in which the cells are embedded, one obtains similar trends with lower absolute values of the temperature distribution as the thermal conductivity increases.
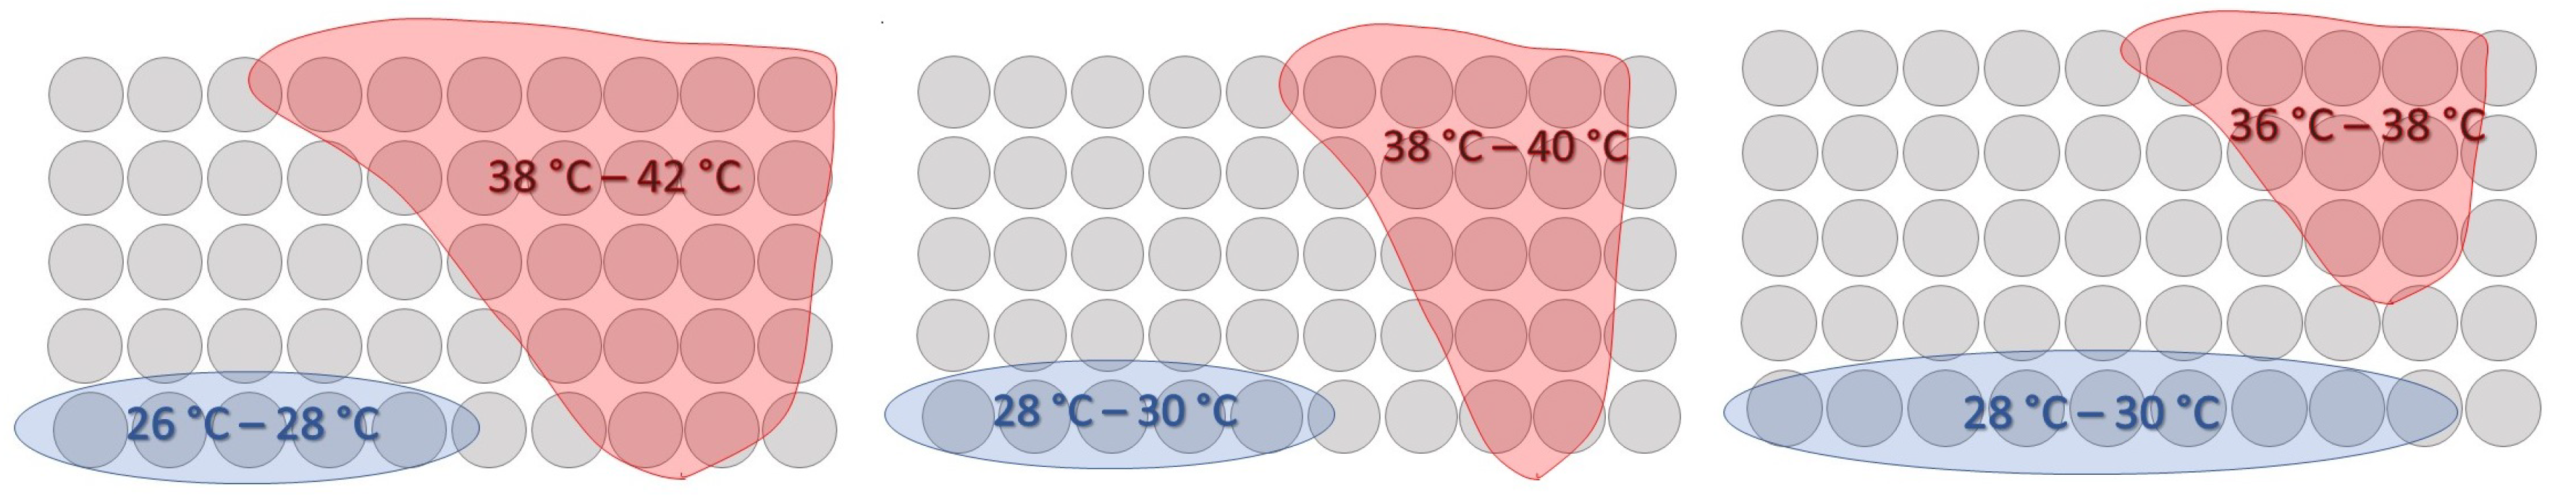
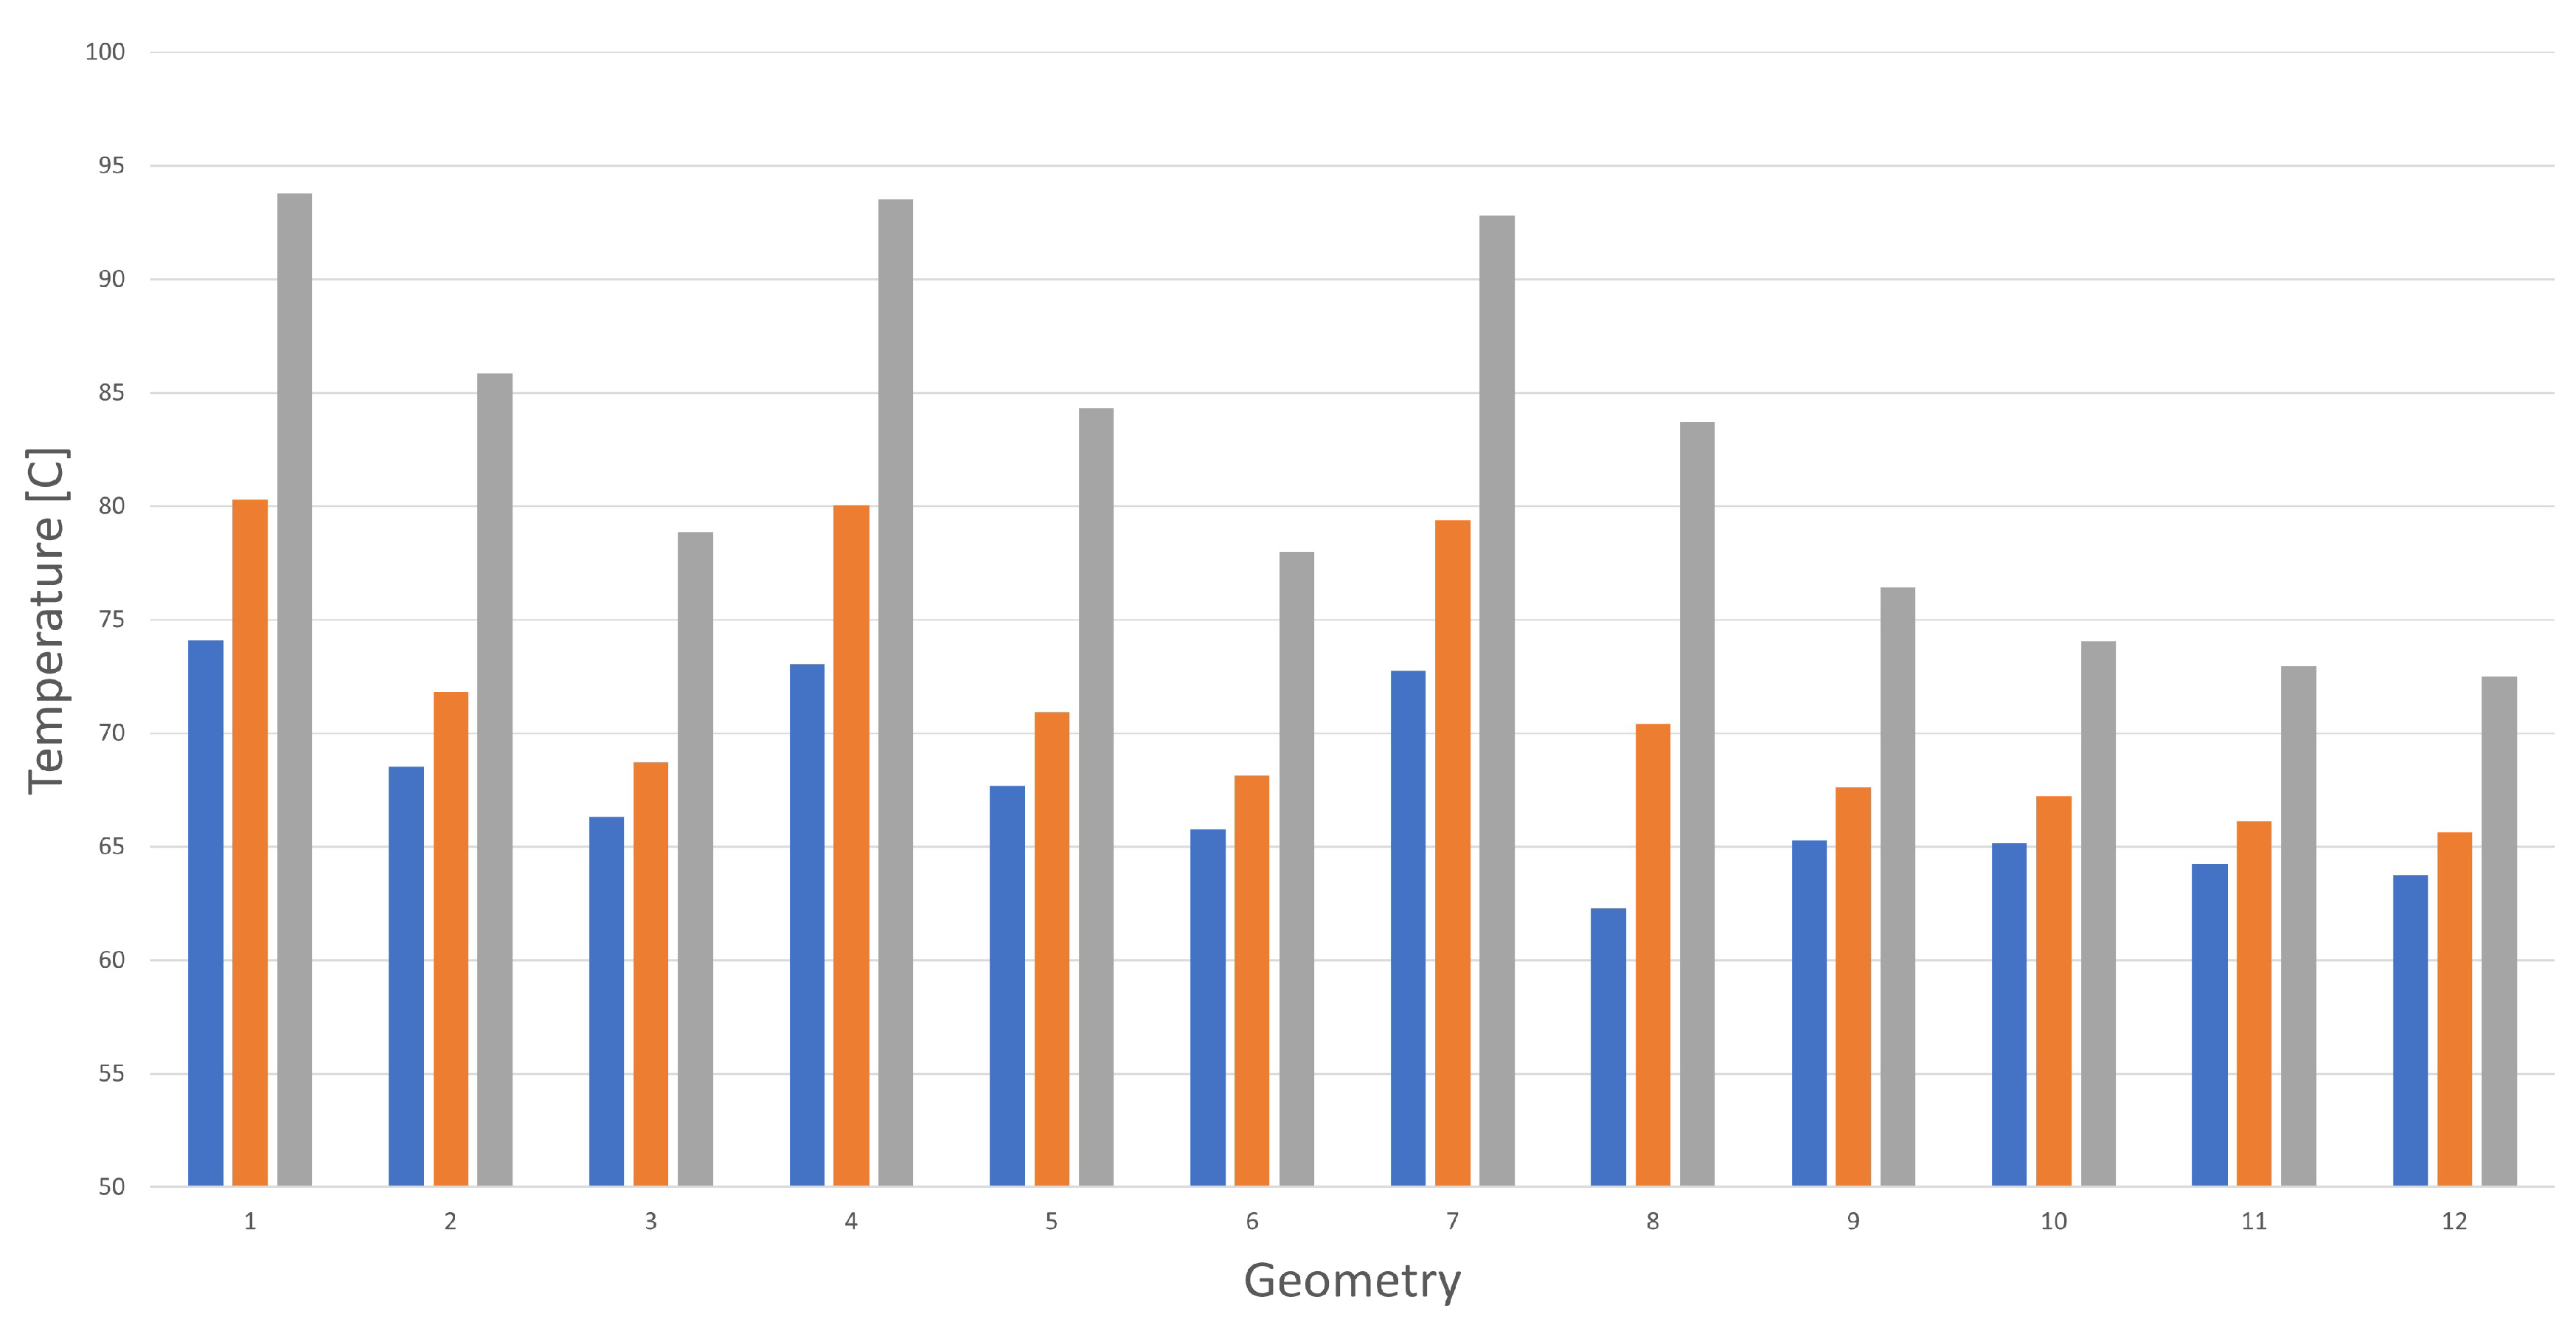
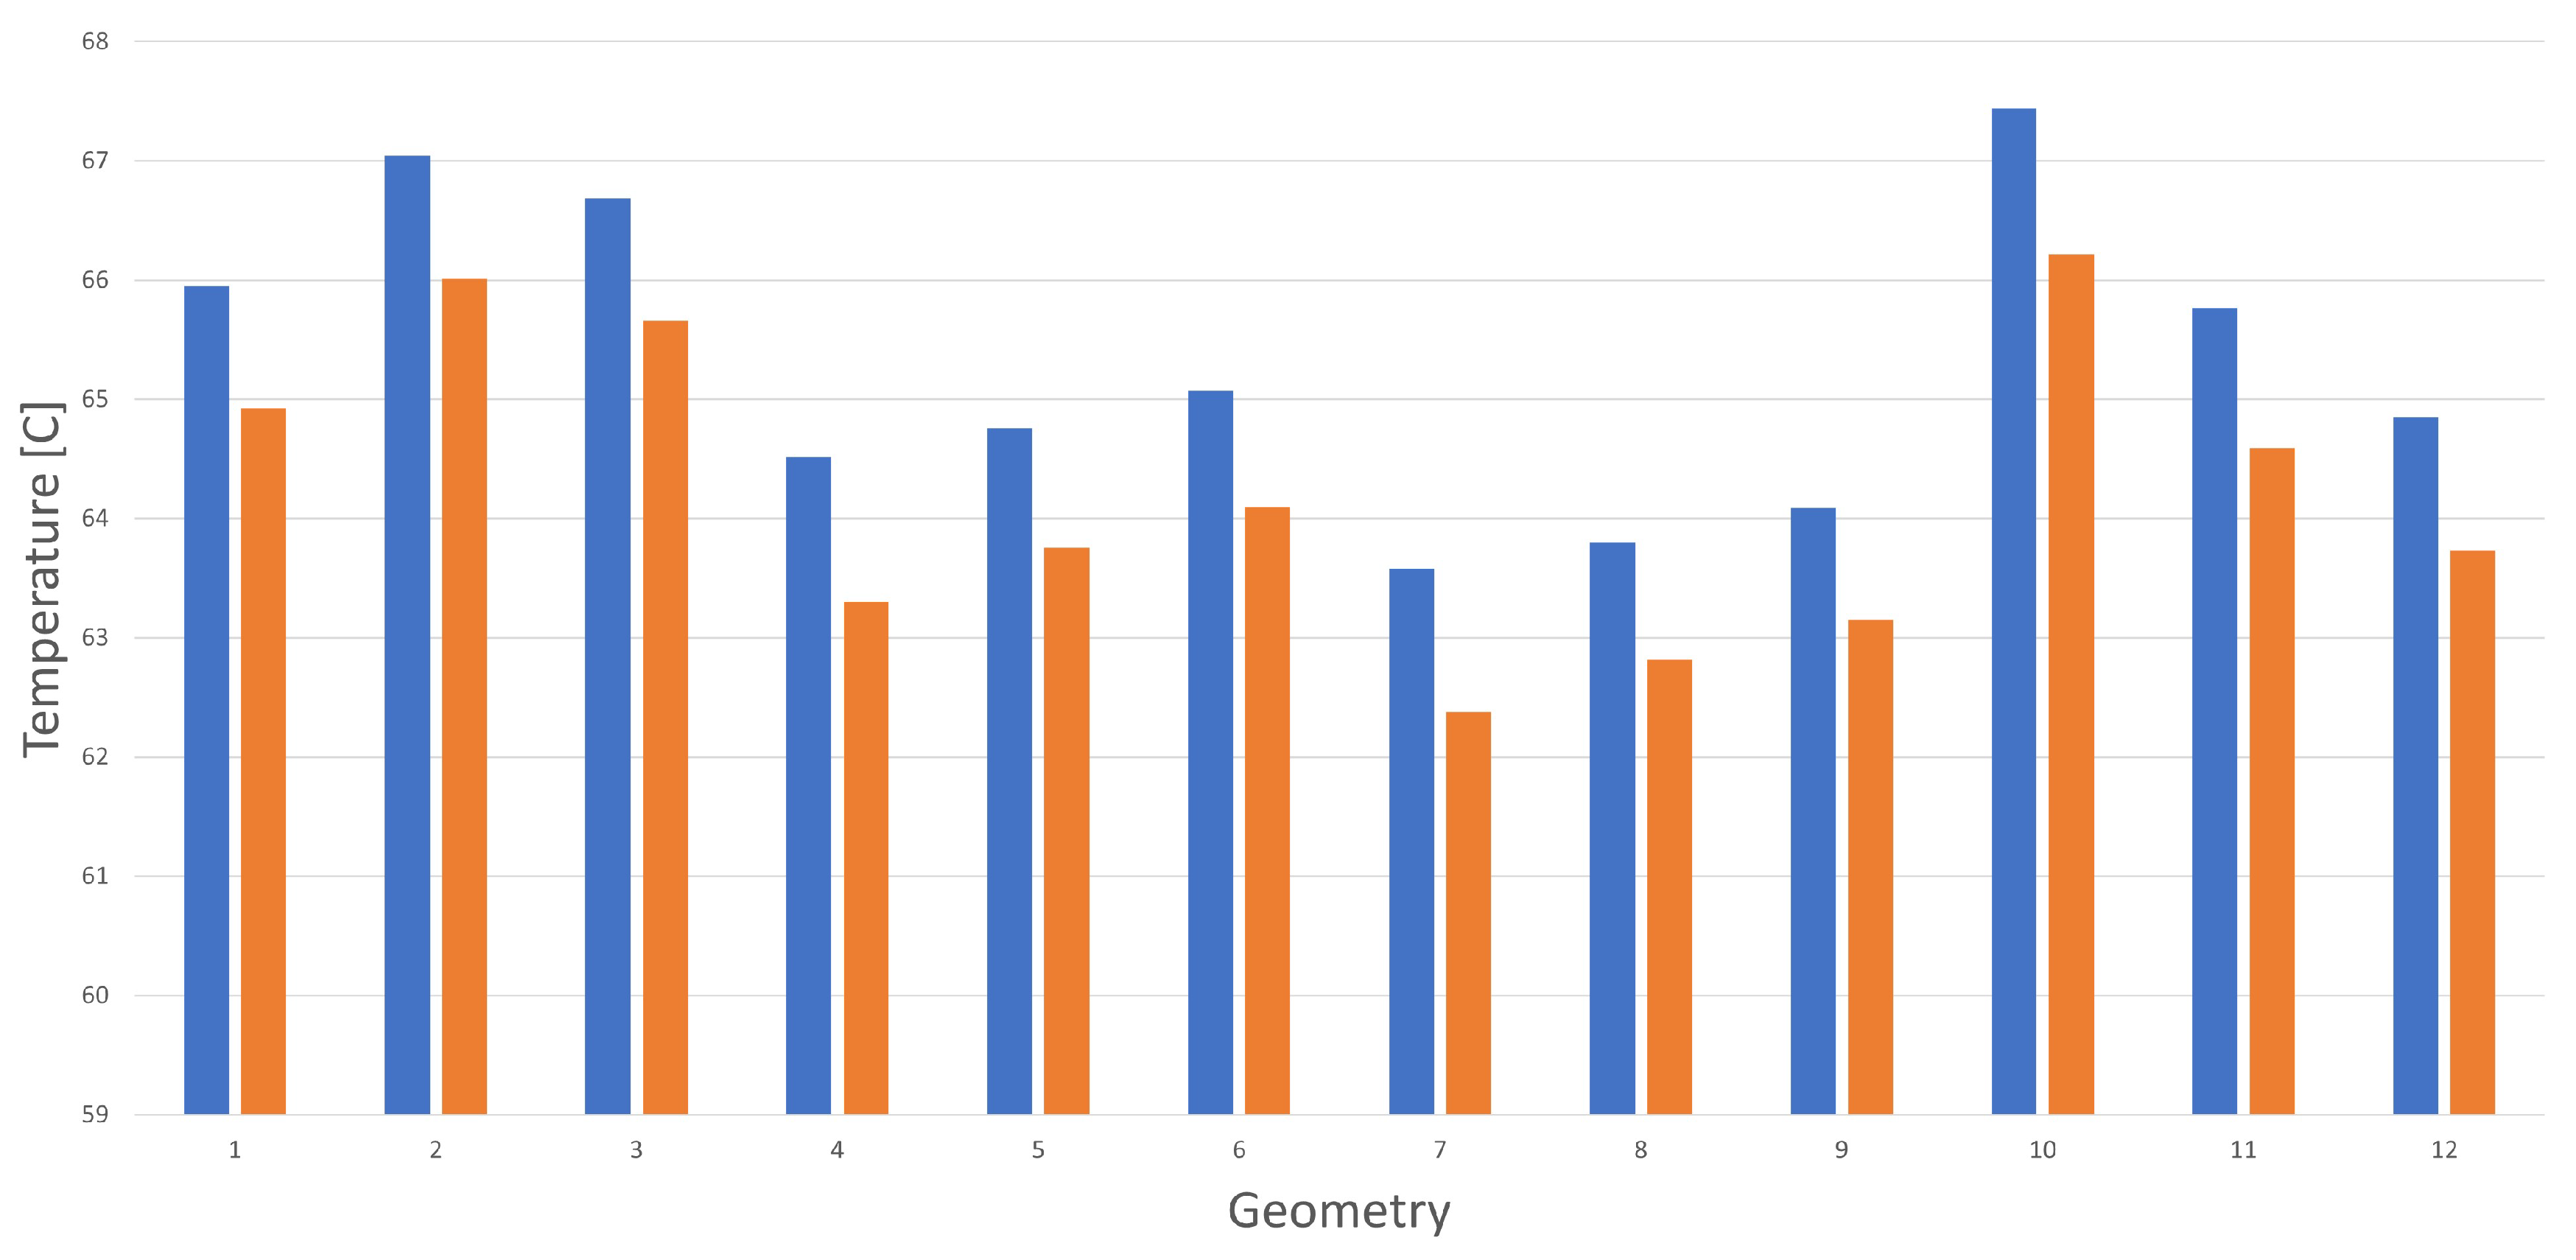
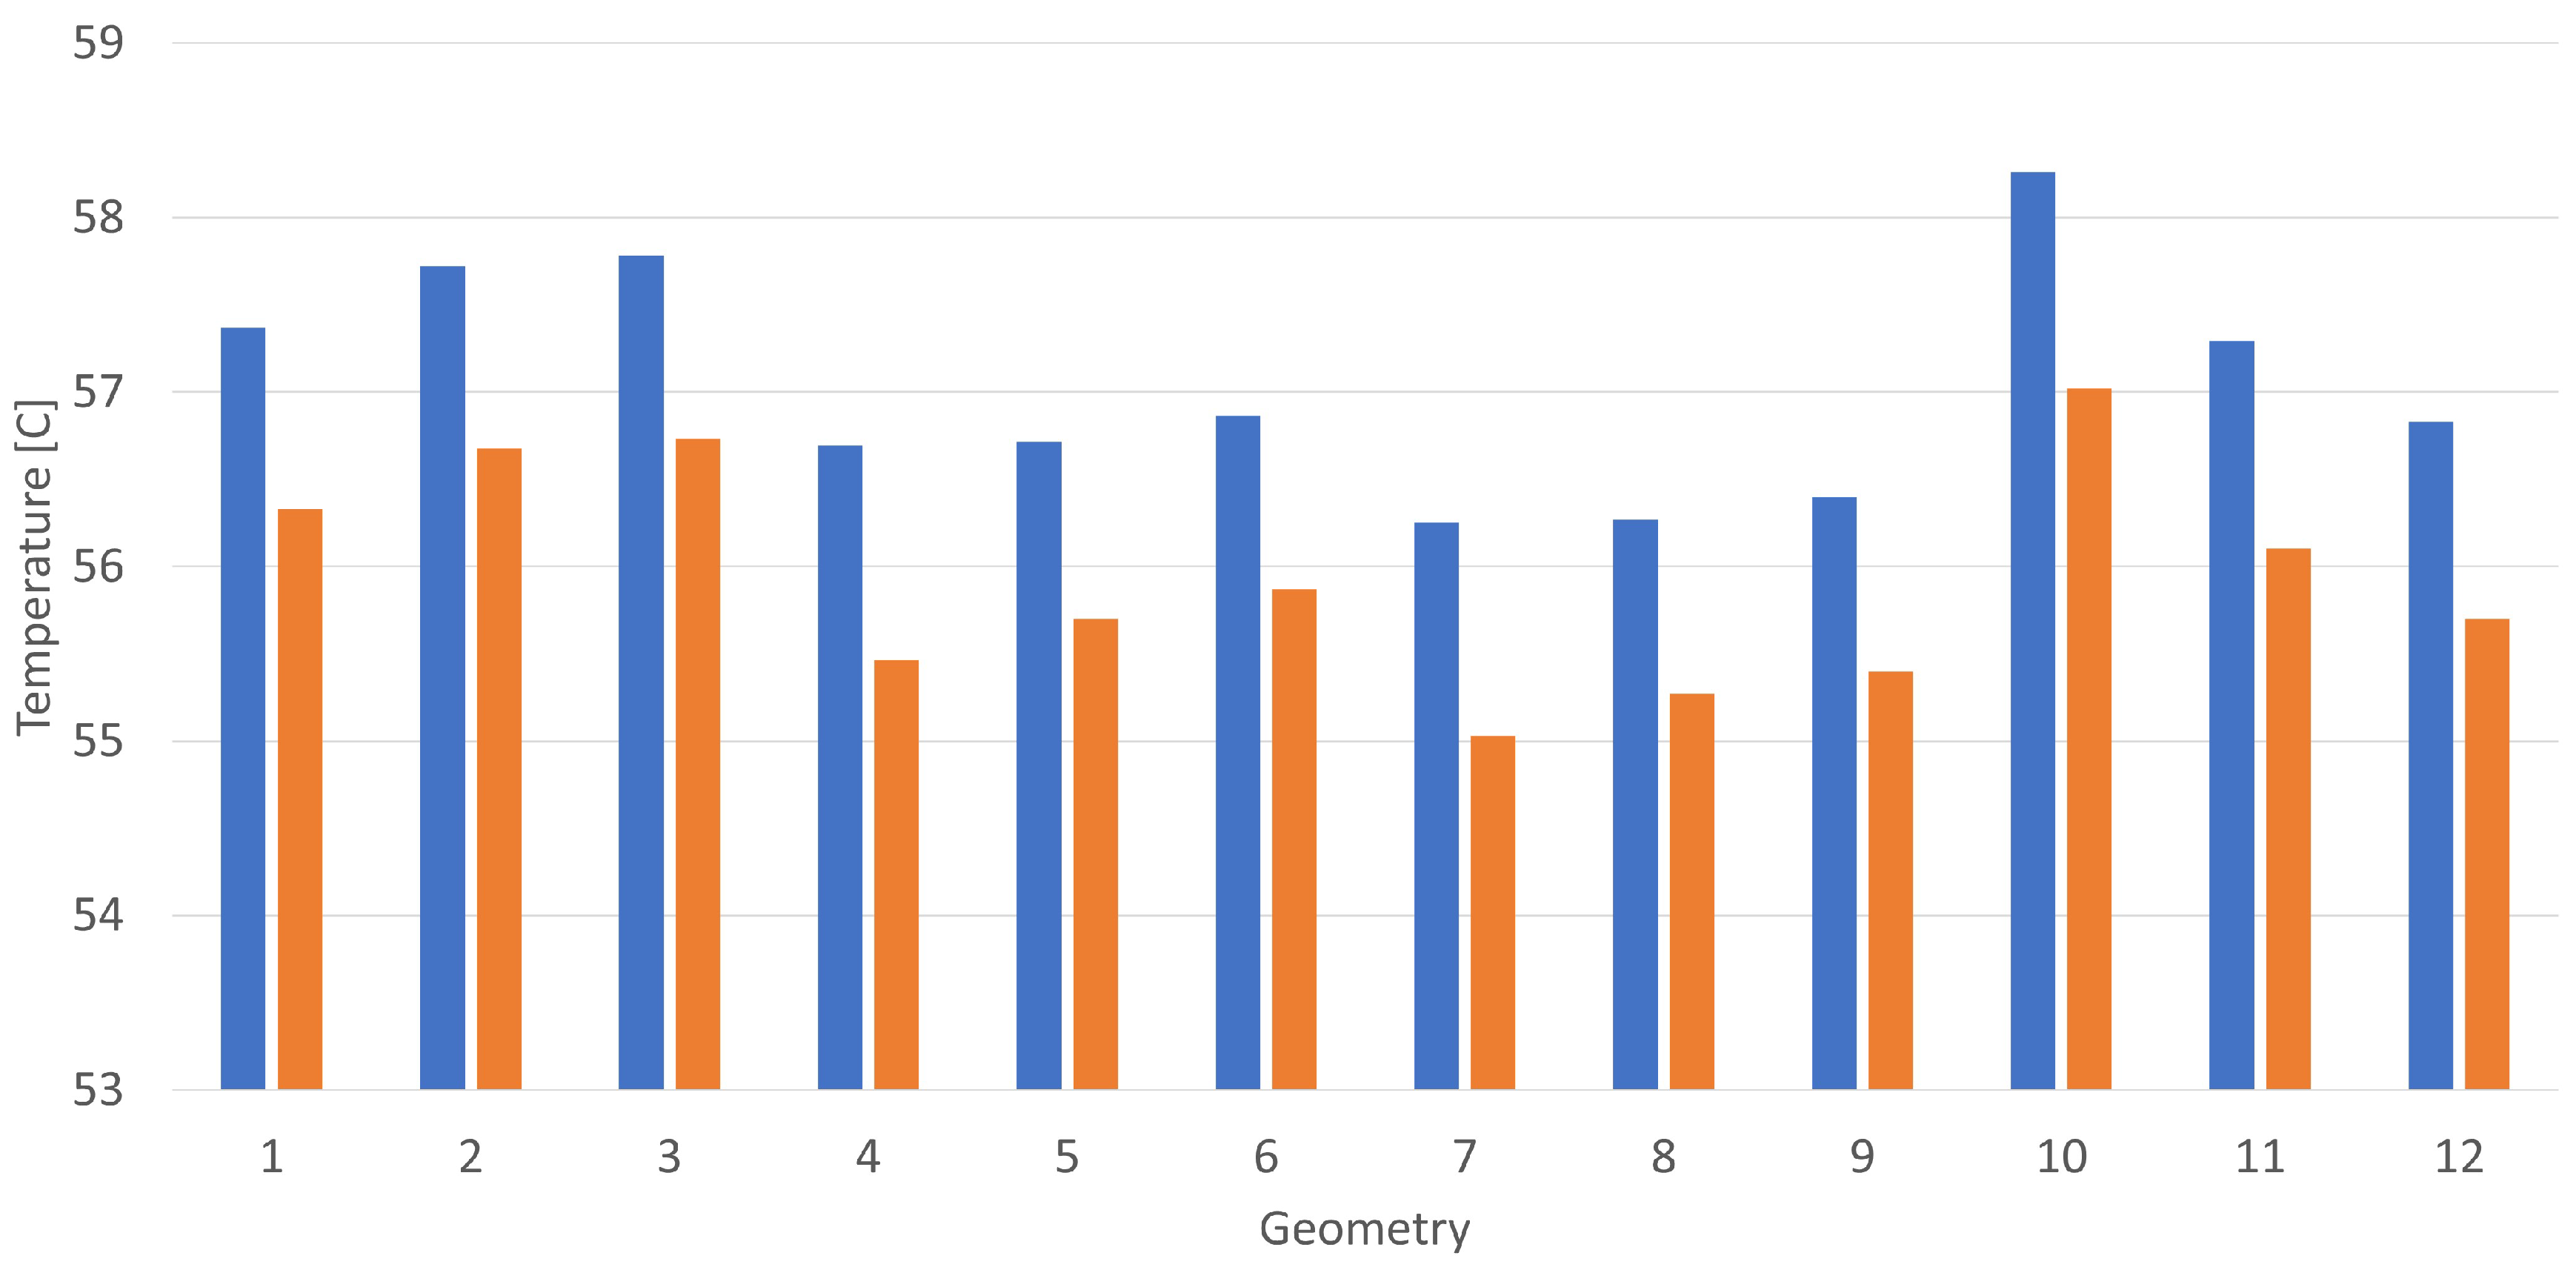
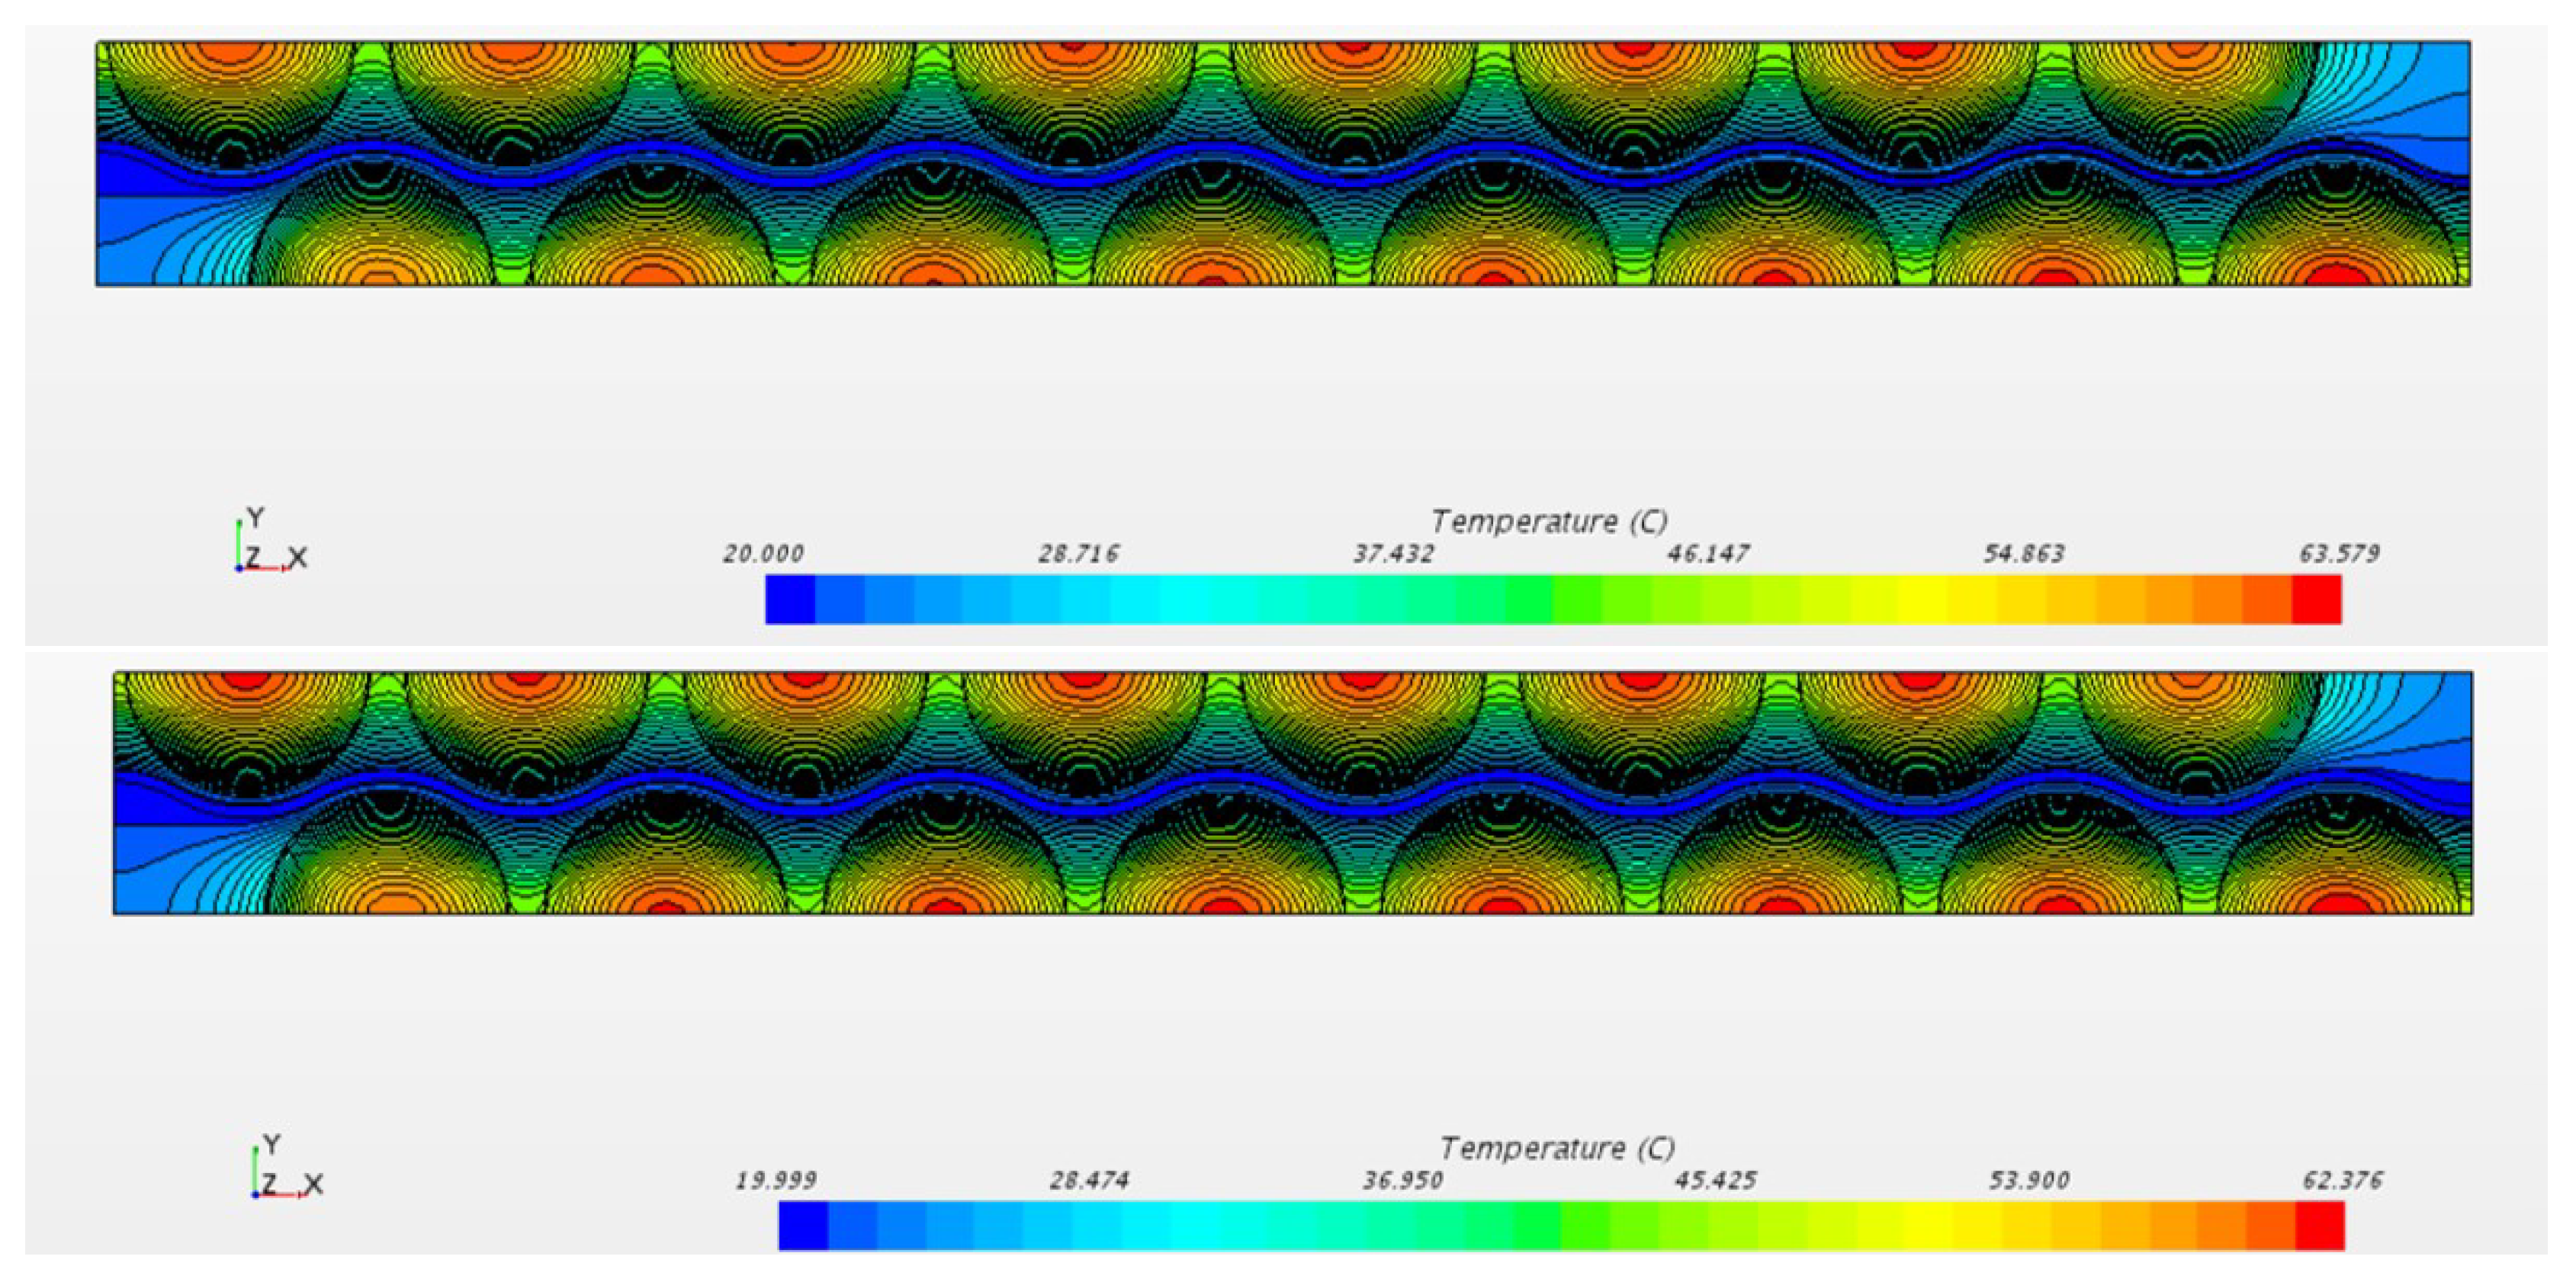
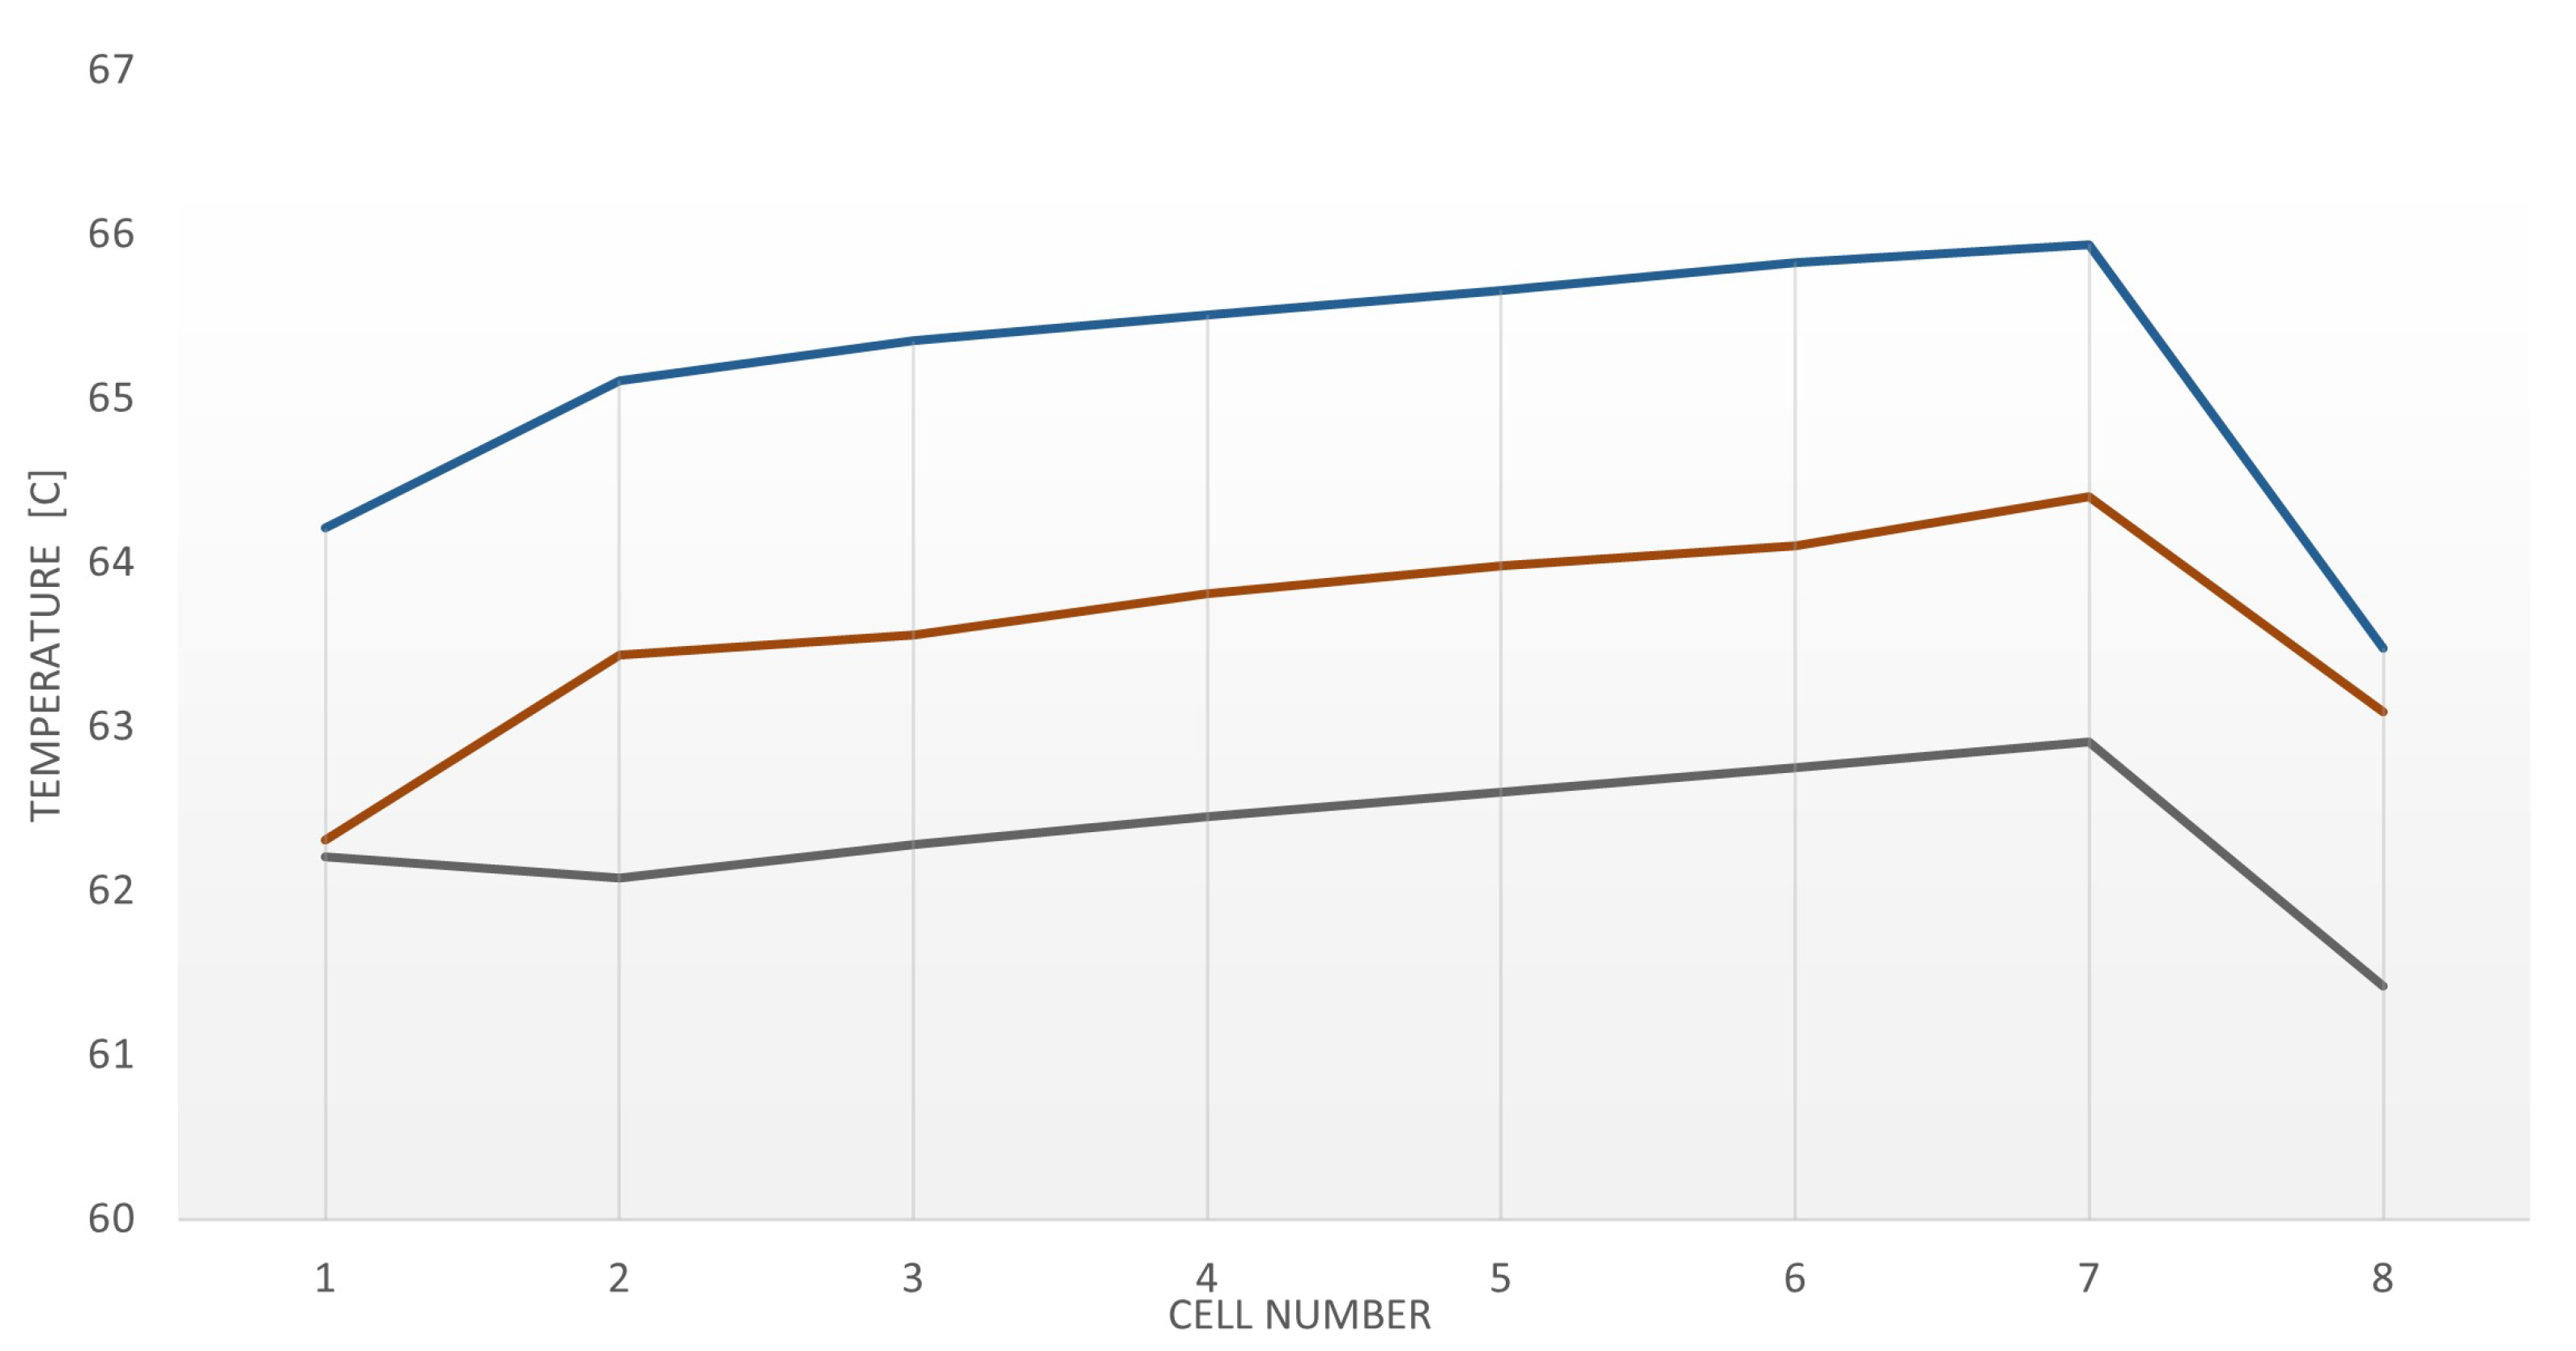
3.2. Water-Cooling
- The maximum temperature of the cells decreases as the axial distance between the cells, and it increases with the channel width;
- The temperature of the cells linearly increases with the number of the cells in the direction of the flow, and the trend is a function of the water-flow velocity within the channels and of the axial distance between the cells;
- By changing the solid material in which the cells are embedded, one obtain similar trends with lower absolute values of the temperature distribution as the thermal conductivity increases.
4. Conclusions
Author Contributions
Funding
Institutional Review Board Statement
Informed Consent Statement
Data Availability Statement
Acknowledgments
Conflicts of Interest
References
- Liu, H.; Wei, Z.; He, W.; Zhao, J. Thermal issues about Li-ion batteries and recent progress in battery thermal management systems: A review. Energy Convers. Manag. 2017, 150, 304–330. [Google Scholar] [CrossRef]
- Kim, J.; Oh, J.; Lee, H. Review on battery thermal management system for electric vehicles. Appl. Therm. Eng. 2019, 149, 192–212. [Google Scholar] [CrossRef]
- Lowe, M.; Tokuoka, S.; Trigg, T.; Gereffi, G. Lithium-ion Batteries for Electric Vehicles: The U.S. Value Chain; Center on Globalization, Governance and Competitiveness; Duke University: Durham, NC, USA, 2010. [Google Scholar]
- Bolsinger, C.; Birke, K.P. Effect of different cooling configurations on thermal gradients inside cylindrical battery cells. J. Energy Storage 2019, 21, 222–230. [Google Scholar] [CrossRef]
- An, Z.; Shah, K.; Jia, L.; Ma, Y. Modeling and analysis of thermal runaway in Li-ion cell. Appl. Therm. Eng. 2019, 160, 113960. [Google Scholar] [CrossRef]
- Berdichevsky, G.; Kelty, K.; Straubel, J.B.; Toomre, E. The Tesla Roadster Battery System; Testa Motors: Palo Alto, CA, USA, 2006. [Google Scholar]
- Opitz, A.; Badami, P.; Shen, L.; Vignarooban, K.; Kannan, A.M. Can Li-Ion batteries be the panacea for automotive applications? Renew. Sustain. Energy Rev. 2017, 68, 685–692. [Google Scholar] [CrossRef] [Green Version]
- Huang, Y.; Lu, Y.; Huang, R.; Chen, J.; Chen, F.; Liu, Z.; Yu, X.; Roskilly, A.P. Study on the thermal interaction and heat dissipation of cylindrical Lithium-Ion Battery cells. Energy Procedia 2017, 142, 4029–4036. [Google Scholar] [CrossRef]
- Erb, D.; Kumar, S.; Carlson, E.; Ehrenberg, I.; Sarma, S. Analytical methods for determining the effects of lithium-ion cell size in aligned air-cooled battery packs. J. Energy Storage 2017, 10, 39–47. [Google Scholar] [CrossRef]
- Wang, T.; Tseng, K.; Zhao, J.; Wei, Z. Thermal investigation of lithium-ion battery module with different cell arrangement structures and forced air-cooling strategies. Appl. Energy 2014, 134, 229–238. [Google Scholar] [CrossRef]
- Lu, Z.; Yu, X.; Wei, L.; Qiu, Y.; Zhang, L.; Meng, X.; Jin, L. Parametric study of forced air cooling strategy for lithium-ion battery pack with staggered arrangement. Appl. Therm. Eng. 2018, 136, 28–40. [Google Scholar] [CrossRef]
- Subramanian, M.; Hoang, A.T.; Kalidasan, B.; Nižetić, S.; Solomon, J.M.; Balasubramanian, D.C.S.; Metghalchi, H.; Nguyen, X.P. A technical review on composite phase change material based secondary assisted battery thermal management system for electric vehicles. J. Clean. Prod. 2021, 322, 129079. [Google Scholar] [CrossRef]
- Sharma, D.K.; Prabhakar, A. A review on air cooled and air centric hybrid thermal management techniques for Li-ion battery packs in electric vehicles. J. Energy Storage 2021, 41, 102885. [Google Scholar] [CrossRef]
- Wang, Q.; Jiang, B.; Li, B.; Yan, Y. A critical review of thermal management models and solutions of lithium-ion batteries for the development of pure electric vehicles. Renew. Sustain. Energy Rev. 2016, 64, 106–128. [Google Scholar] [CrossRef]
- Sato, N. Thermal behavior analysis of lithium-ion batteries for electric and hybrid vehicles. J. Power Sources 2001, 99, 70–77. [Google Scholar] [CrossRef]
- Zhou, H.; Zhou, F.; Xu, L.; Kong, J.; Yang, Q. Thermal performance of cylindrical Lithium-ion battery thermal management system based on air distribution pipe. Int. J. Heat Mass Transf. 2019, 131, 984–998. [Google Scholar] [CrossRef]
- Zhang, S.S.; Xu, K.X.; Jow, T.R. The low temperature performance of Li-ion batteries. J. Power Sources 2003, 225, 137–140. [Google Scholar] [CrossRef]
- Shabani, B.; Biju, M. Theoretical Modelling Methods for Thermal Management of Batteries. Energies 2015, 8, 10153–10177. [Google Scholar] [CrossRef]
- Moghaddam, H.; Mazyar, S. Designing Battery Thermal Management Systems (BTMS) for Cylindrical Lithium-Ion Battery Modules Using CFD; KTH School of Industrial Engineering and Management: Stockholm, Sweden, 2019. [Google Scholar]
- Wu, W.; Wang, S.; Wu, W.; Chen, K.; Hong, S.; Lai, Y. A critical review of battery thermal performance and liquid based battery thermal management. Energy Convers. Manag. 2019, 182, 262–281. [Google Scholar] [CrossRef]
- Jiang, J.; Ruan, H.; Sun, B.; Wang, L.; Gao, W.; Zhang, W. A low-temperature internal heating strategy without lifetime reduction for large-size automotive lithium-ion battery pack. Appl. Energy 2018, 230, 257–266. [Google Scholar] [CrossRef]
- Xu, X.; He, R. Research on the heat dissipation performance of battery pack based on forced air cooling. J. Power Sources 2013, 240, 33–41. [Google Scholar] [CrossRef]
- Zhao, G.; Wang, X.; Negnevitsky, M.; Zhang, H. A review of air-cooling battery thermal management systems for electric and hybrid electric vehicles. J. Power Sources 2021, 501, 230001. [Google Scholar] [CrossRef]
- Xie, J.; Ge, Z.; Zang, M.; Wang, S. Structural optimization of lithium-ion battery pack with forced air cooling system. Appl. Therm. Eng. 2017, 126, 583–593. [Google Scholar] [CrossRef]
- Fan, Y.; Zhan, D.; Tan, X.; Lyu, P.; Rao, J. Optimization of cooling strategies for an electric vehicle in high-temperature environment. Appl. Therm. Eng. 2021, 195, 117088. [Google Scholar] [CrossRef]
- E, J.; Yue, M.; Chen, J.; Zhu, H.; Deng, Y.; Zhu, Y.; Zhang, F.; Wen, M.; Zhang, B.; Kang, S. Effects of the different air cooling strategies on cooling performance of a lithium-ion battery module with baffle. Appl. Therm. Eng. 2018, 144, 231–241. [Google Scholar] [CrossRef]
- Chen, K.; Wang, S.; Song, M.; Chen, L. Configuration optimization of battery pack in parallel air-cooled battery thermal management system using an optimization strategy. Appl. Therm. Eng. 2017, 123, 177–186. [Google Scholar] [CrossRef]
- Hong, S.; Zhang, X.; Chen, K.; Wang, S. Design of flow configuration for parallel air-cooled battery thermal management system with secondary vent. Int. J. Heat Mass Transf. 2018, 116, 1204–1212. [Google Scholar] [CrossRef]
- Shahid, S.; Agelin-Chaab, M. Experimental and numerical studies on air cooling and temperature uniformity in a battery pack. Int. J. Energy Res. 2018, 42, 2246–2262. [Google Scholar] [CrossRef]
- Yang, T.; Yang, N.; Zhang, X.; Li, G. Investigation of the thermal performance of axial-flow air cooling for the lithium-ion battery pack. Int. J. Therm. Sci. 2016, 108, 132–144. [Google Scholar] [CrossRef]
- Sefidan, A.M.; Sojoudi, S.; Saha, S.C. Nanofluid-based cooling of cylindrical lithium-ion battery packs employing forced air flow. Int. J. Therm. Sci. 2017, 177, 44–58. [Google Scholar] [CrossRef]
- Jarrett, A.; Kim, I.Y. Design optimization of electric vehicle battery cooling plates for thermal performance. J. Power Sources 2011, 196, 10359–10368. [Google Scholar] [CrossRef]
- Jarrett, A.; Kim, I.Y. Influence of operating conditions on the optimum design of electric vehicle battery cooling plates. J. Power Sources 2014, 245, 644–655. [Google Scholar] [CrossRef]
- Darcovich, K.; MacNeil, D.D.; Recoskie, S.; Cadic, Q.; Ilinca, F.; Kenney, B. Coupled Numerical Approach for Automotive Battery Pack Lifetime Estimates with Thermal Management. J. Electrochem. Energy Convers. Storage 2018, 15, 021004. [Google Scholar] [CrossRef]
- Rao, Z.; Wang, S.; Wu, M.; Lin, Z.; Li, F. Experimental investigation on thermal management of electric vehicle battery with heat pipe. Energy Convers. Manag. 2013, 65, 92–97. [Google Scholar] [CrossRef]
- Mbulu, H.; Laoonual, Y.; Wongwises, S. Experimental study on the thermal performance of a battery thermal management system using heat pipes. Case Stud. Therm. Eng. 2021, 26, 101029. [Google Scholar] [CrossRef]
- Putra, N.; Ariantara, B.; Pamungkas, R.A. Experimental investigation on performance of lithium-ion battery thermal management system using flat plate loop heat pipe for electric vehicle application. Appl. Therm. Eng. 2016, 99, 784–789. [Google Scholar] [CrossRef]
- Liang, L.; Zhao, Y.; Diao, Y.; Ren, R.; Jing, H. Inclined U-shaped flat microheat pipe array configuration for cooling and heating lithium-ion battery modules in electric vehicles. Energy 2021, 235, 121433. [Google Scholar] [CrossRef]
- Zhou, Z.; Lv, Y.; Qu, J.; Sun, Q.; Grachev, D. Performance evaluation of hybrid oscillating heat pipe with carbon nanotube nanofluids for electric vehicle battery cooling. Appl. Therm. Eng. 2021, 196, 117300. [Google Scholar] [CrossRef]
- Hong, S.H.; Jang, D.S.; Park, S.; Yun, S.; Kim, Y. Thermal performance of direct two-phase refrigerant cooling for lithium-ion batteries in electric vehicles. Appl. Therm. Eng. 2020, 173, 115213. [Google Scholar] [CrossRef]
- Tang, X.; Guo, Q.; Li, M.; Wei, C.; Pan, Z.; Wang, Y. Performance analysis on liquid-cooled battery thermal management for electric vehicles based on machine learning. J. Power Sources 2021, 494, 229727. [Google Scholar] [CrossRef]
- Al-Zareer, M.; Dincer, I.; Rosen, M.A. Performance assessment of a new hydrogen cooled prismatic battery pack arrangement for hydrogen hybrid electric vehicles. Energy Convers. Manag. 2018, 173, 303–319. [Google Scholar] [CrossRef]
- Alipour, M.; Hassanpouryouzband, A.; Kizilel, R. Investigation of the Applicability of Helium-Based Cooling System for Li-Ion Batteries. Electrochem 2021, 2, 135–148. [Google Scholar] [CrossRef]
- Al-Zareer, M.; Dincer, I.; Rosen, M.A. Electrochemical modeling and performance evaluation of a new ammonia-based battery thermal management system for electric and hybrid electric vehicles. Electrochim. Acta 2017, 247, 171–182. [Google Scholar] [CrossRef]
- Lyu, Y.; Siddique, A.R.M.; Majid, S.H.; Biglarbegian, M.; Gadsden, S.A.; Mahmud, S. Electric vehicle battery thermal management system with thermoelectric cooling. Energy Rep. 2019, 5, 822–827. [Google Scholar] [CrossRef]
- Lyu, Y.; Siddique, A.R.M.; Gadsden, S.A.; Mahmud, S. Experimental investigation of thermoelectric cooling for a new battery pack design in a copper holder. Results Eng. 2021, 10, 100214. [Google Scholar] [CrossRef]
- Liebscher, A. Preventing Thermal Runaway in Electric Vehicle Batteries. 2018. Available online: www.machinedesign.com/materials/article/21837402/preventing-thermal-runaway-in-electric-vehicle-batteries (accessed on 1 December 2021).
- Gao, Q.; Liu, Y.; Wang, G.; Deng, F.; Zhu, J. An experimental investigation of refrigerant emergency spray on cooling and oxygen suppression for overheating power battery. J. Power Sources 2019, 415, 33–43. [Google Scholar] [CrossRef]
- Kong, L.; Li, C.; Jiang, J.; Pecht, M.G. Li-Ion Battery Fire Hazards and Safety Strategies. Energies 2018, 11, 2191. [Google Scholar] [CrossRef] [Green Version]
- Darcovich, K.; MacNeil, D.; Recoskie, S.; Cadic, Q.; Ilinca, F. Comparison of cooling plate configurations for automotive battery pack thermal management. Appl. Therm. Eng. 2019, 155, 185–195. [Google Scholar] [CrossRef]
- Deng, T.; Ran, Y.; Zhang, G.; Yin, Y. Novel leaf-like channels for cooling rectangular lithium ion batteries. Appl. Therm. Eng. 2019, 150, 1186–1196. [Google Scholar] [CrossRef]
- Smith, J.; Singh, R.; Hinterberger, M.; Mochizuki, M. Battery thermal management system for electric vehicle using heat pipes. Int. J. Therm. Sci. 2018, 134, 517–529. [Google Scholar] [CrossRef]
- Wang, J.; Gan, Y.; Liang, J.; Tan, M.; Li, Y. Sensitivity analysis of factors influencing a heat pipe-based thermal management system for a battery module with cylindrical cells. Appl. Therm. Eng. 2019, 151, 475–485. [Google Scholar] [CrossRef]
- Sutterlin, W.R. A Phase Change Materials Comparison: Vegetable-Based vs. Paraffin-Based PCMs. 2015. Available online: www.chemicalonline.com/doc/a-phase-change-materials-comparison-vegetable-based-vs-paraffin-based-pcms-0001 (accessed on 1 December 2021).
- Babapoor, A.; Azizi, M.; Karimi, G. Thermal management of a Li-ion battery using carbon fiber-PCM composites. Appl. Therm. Eng. 2015, 85, 281–290. [Google Scholar] [CrossRef]
- Samimi, F.; Babapoor, A.; Azizi, M.; Karimi, G. Thermal management analysis of a Li-ion battery cell using phase change material loaded with carbon fibers. Energy 2016, 96, 355–371. [Google Scholar] [CrossRef]
- Rossi, C.; Pontara, D.; Falcomer, C.; Bertoldi, M. Simplified parameters estimation forthe dual polarization model of lithium-ion cell. In Lecture Notes in Electrical Engineering, Proceedings of the 13th International Conference of the IMACS TC1 Committee, Electrimacs 2019, Salerno, Italy, 21–23 May 2019; Springer: Berlin/Heidelberg, Germany, 2020; Volume 697, pp. 129–144. [Google Scholar]


| Environmental Temperature (C) | 20 | 27 | 40 | |
|---|---|---|---|---|
| Parallel flow | Maximum temperature rise (C) | A20 | A27 | A40 |
| Maximum temperature difference (C) | B20 | B27 | B40 | |
| Cross-flow | Maximum temperature rise (C) | −2.25% | −1.98% | −1.50% |
| Maximum temperature difference (C) | −7.91% | −7.27% | −5.75% | |
| Double passage | Maximum temperature rise (C) | −36.80% | −37.04% | −37.55% |
| Maximum temperature difference (C) | −63.83% | −63.84% | 63.87% | |
| U-passage | Maximum temperature rise (C) | −38.38% | −39.03% | −38.97 % |
| Maximum temperature difference (C) | −72.58% | −73.03% | −72.15% |
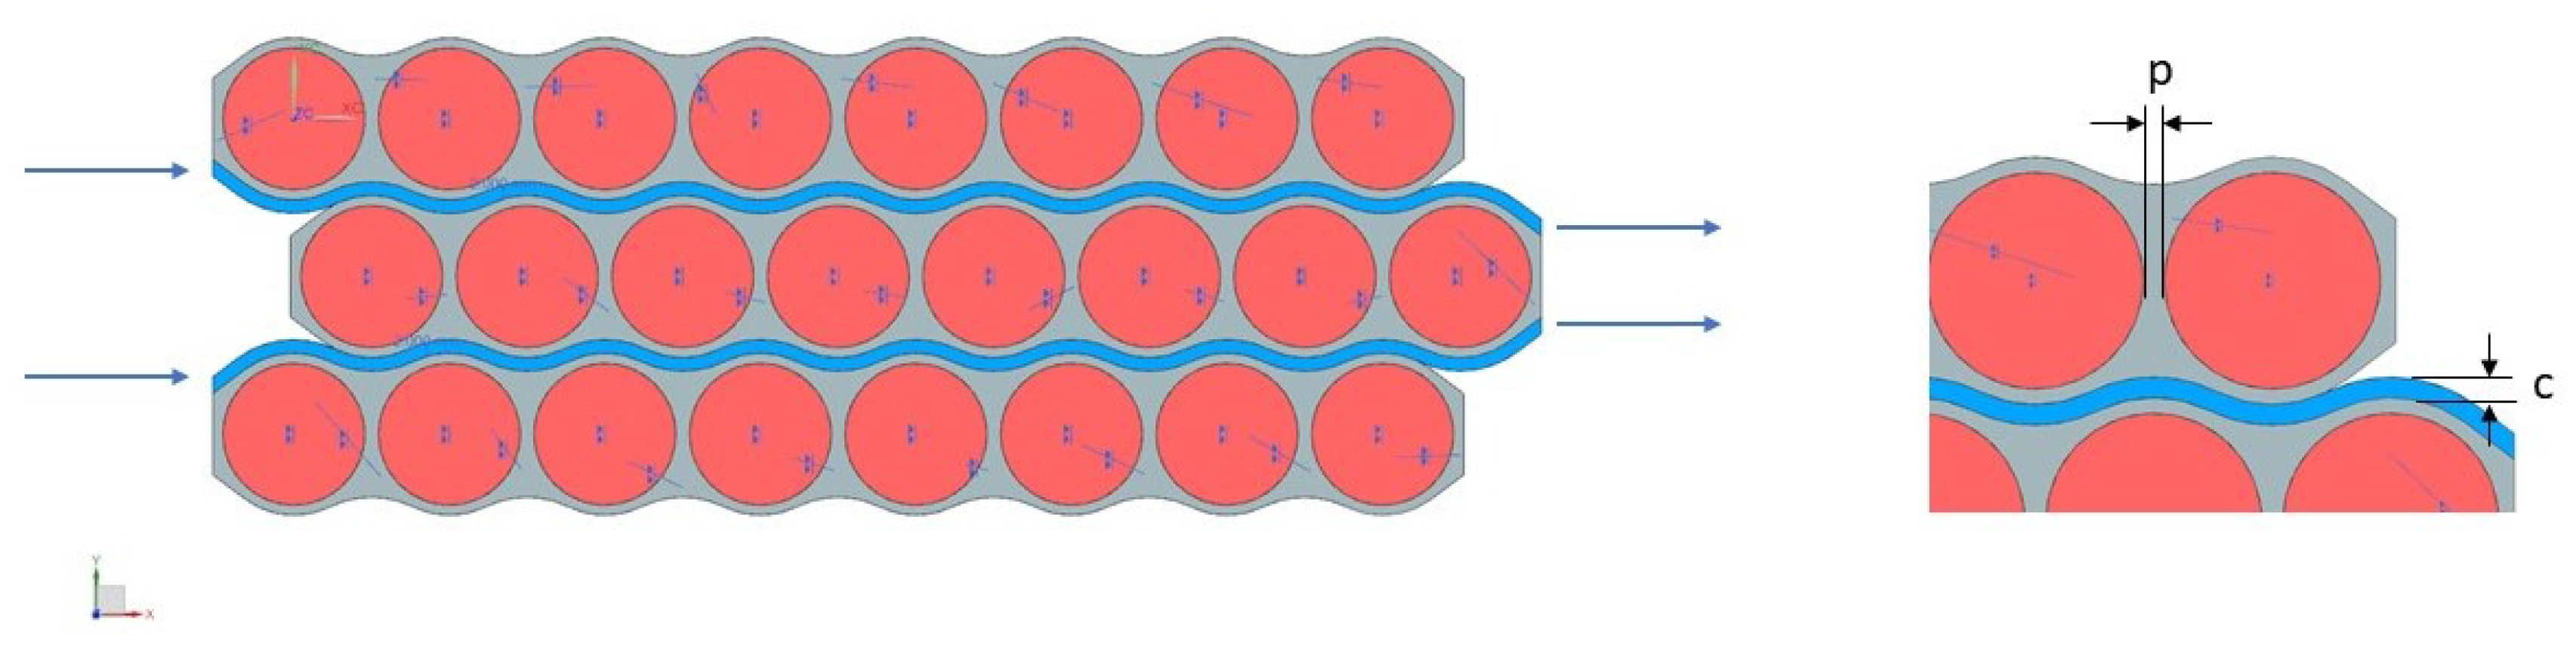
| Geometry Number | p (mm) | c (mm) |
|---|---|---|
| 1 | 1 | 1 |
| 2 | 1 | 2 |
| 3 | 1 | 3 |
| 4 | 2 | 1 |
| 5 | 2 | 2 |
| 6 | 2 | 3 |
| 7 | 3 | 1 |
| 8 | 3 | 2 |
| 9 | 3 | 3 |
| 10 | 1 | 5 |
| 11 | 2 | 5 |
| 12 | 3 | 5 |
Publisher’s Note: MDPI stays neutral with regard to jurisdictional claims in published maps and institutional affiliations. |
© 2021 by the authors. Licensee MDPI, Basel, Switzerland. This article is an open access article distributed under the terms and conditions of the Creative Commons Attribution (CC BY) license (https://creativecommons.org/licenses/by/4.0/).
Share and Cite
Falcone, M.; Palka Bayard De Volo, E.; Hellany, A.; Rossi, C.; Pulvirenti, B. Lithium-Ion Battery Thermal Management Systems: A Survey and New CFD Results. Batteries 2021, 7, 86. https://doi.org/10.3390/batteries7040086
Falcone M, Palka Bayard De Volo E, Hellany A, Rossi C, Pulvirenti B. Lithium-Ion Battery Thermal Management Systems: A Survey and New CFD Results. Batteries. 2021; 7(4):86. https://doi.org/10.3390/batteries7040086
Chicago/Turabian StyleFalcone, Morena, Eleonora Palka Bayard De Volo, Ali Hellany, Claudio Rossi, and Beatrice Pulvirenti. 2021. "Lithium-Ion Battery Thermal Management Systems: A Survey and New CFD Results" Batteries 7, no. 4: 86. https://doi.org/10.3390/batteries7040086
APA StyleFalcone, M., Palka Bayard De Volo, E., Hellany, A., Rossi, C., & Pulvirenti, B. (2021). Lithium-Ion Battery Thermal Management Systems: A Survey and New CFD Results. Batteries, 7(4), 86. https://doi.org/10.3390/batteries7040086