
Virtual Detection of Mechanically Induced Short Circuits in a Cylindrical Lithium-Ion Battery Cell Based on Finite Element Simulation

Abstract
:1. Introduction
1.1. State of the Art
1.1.1. Battery Cell Mechanical Deformation, Testing and FE Simulation
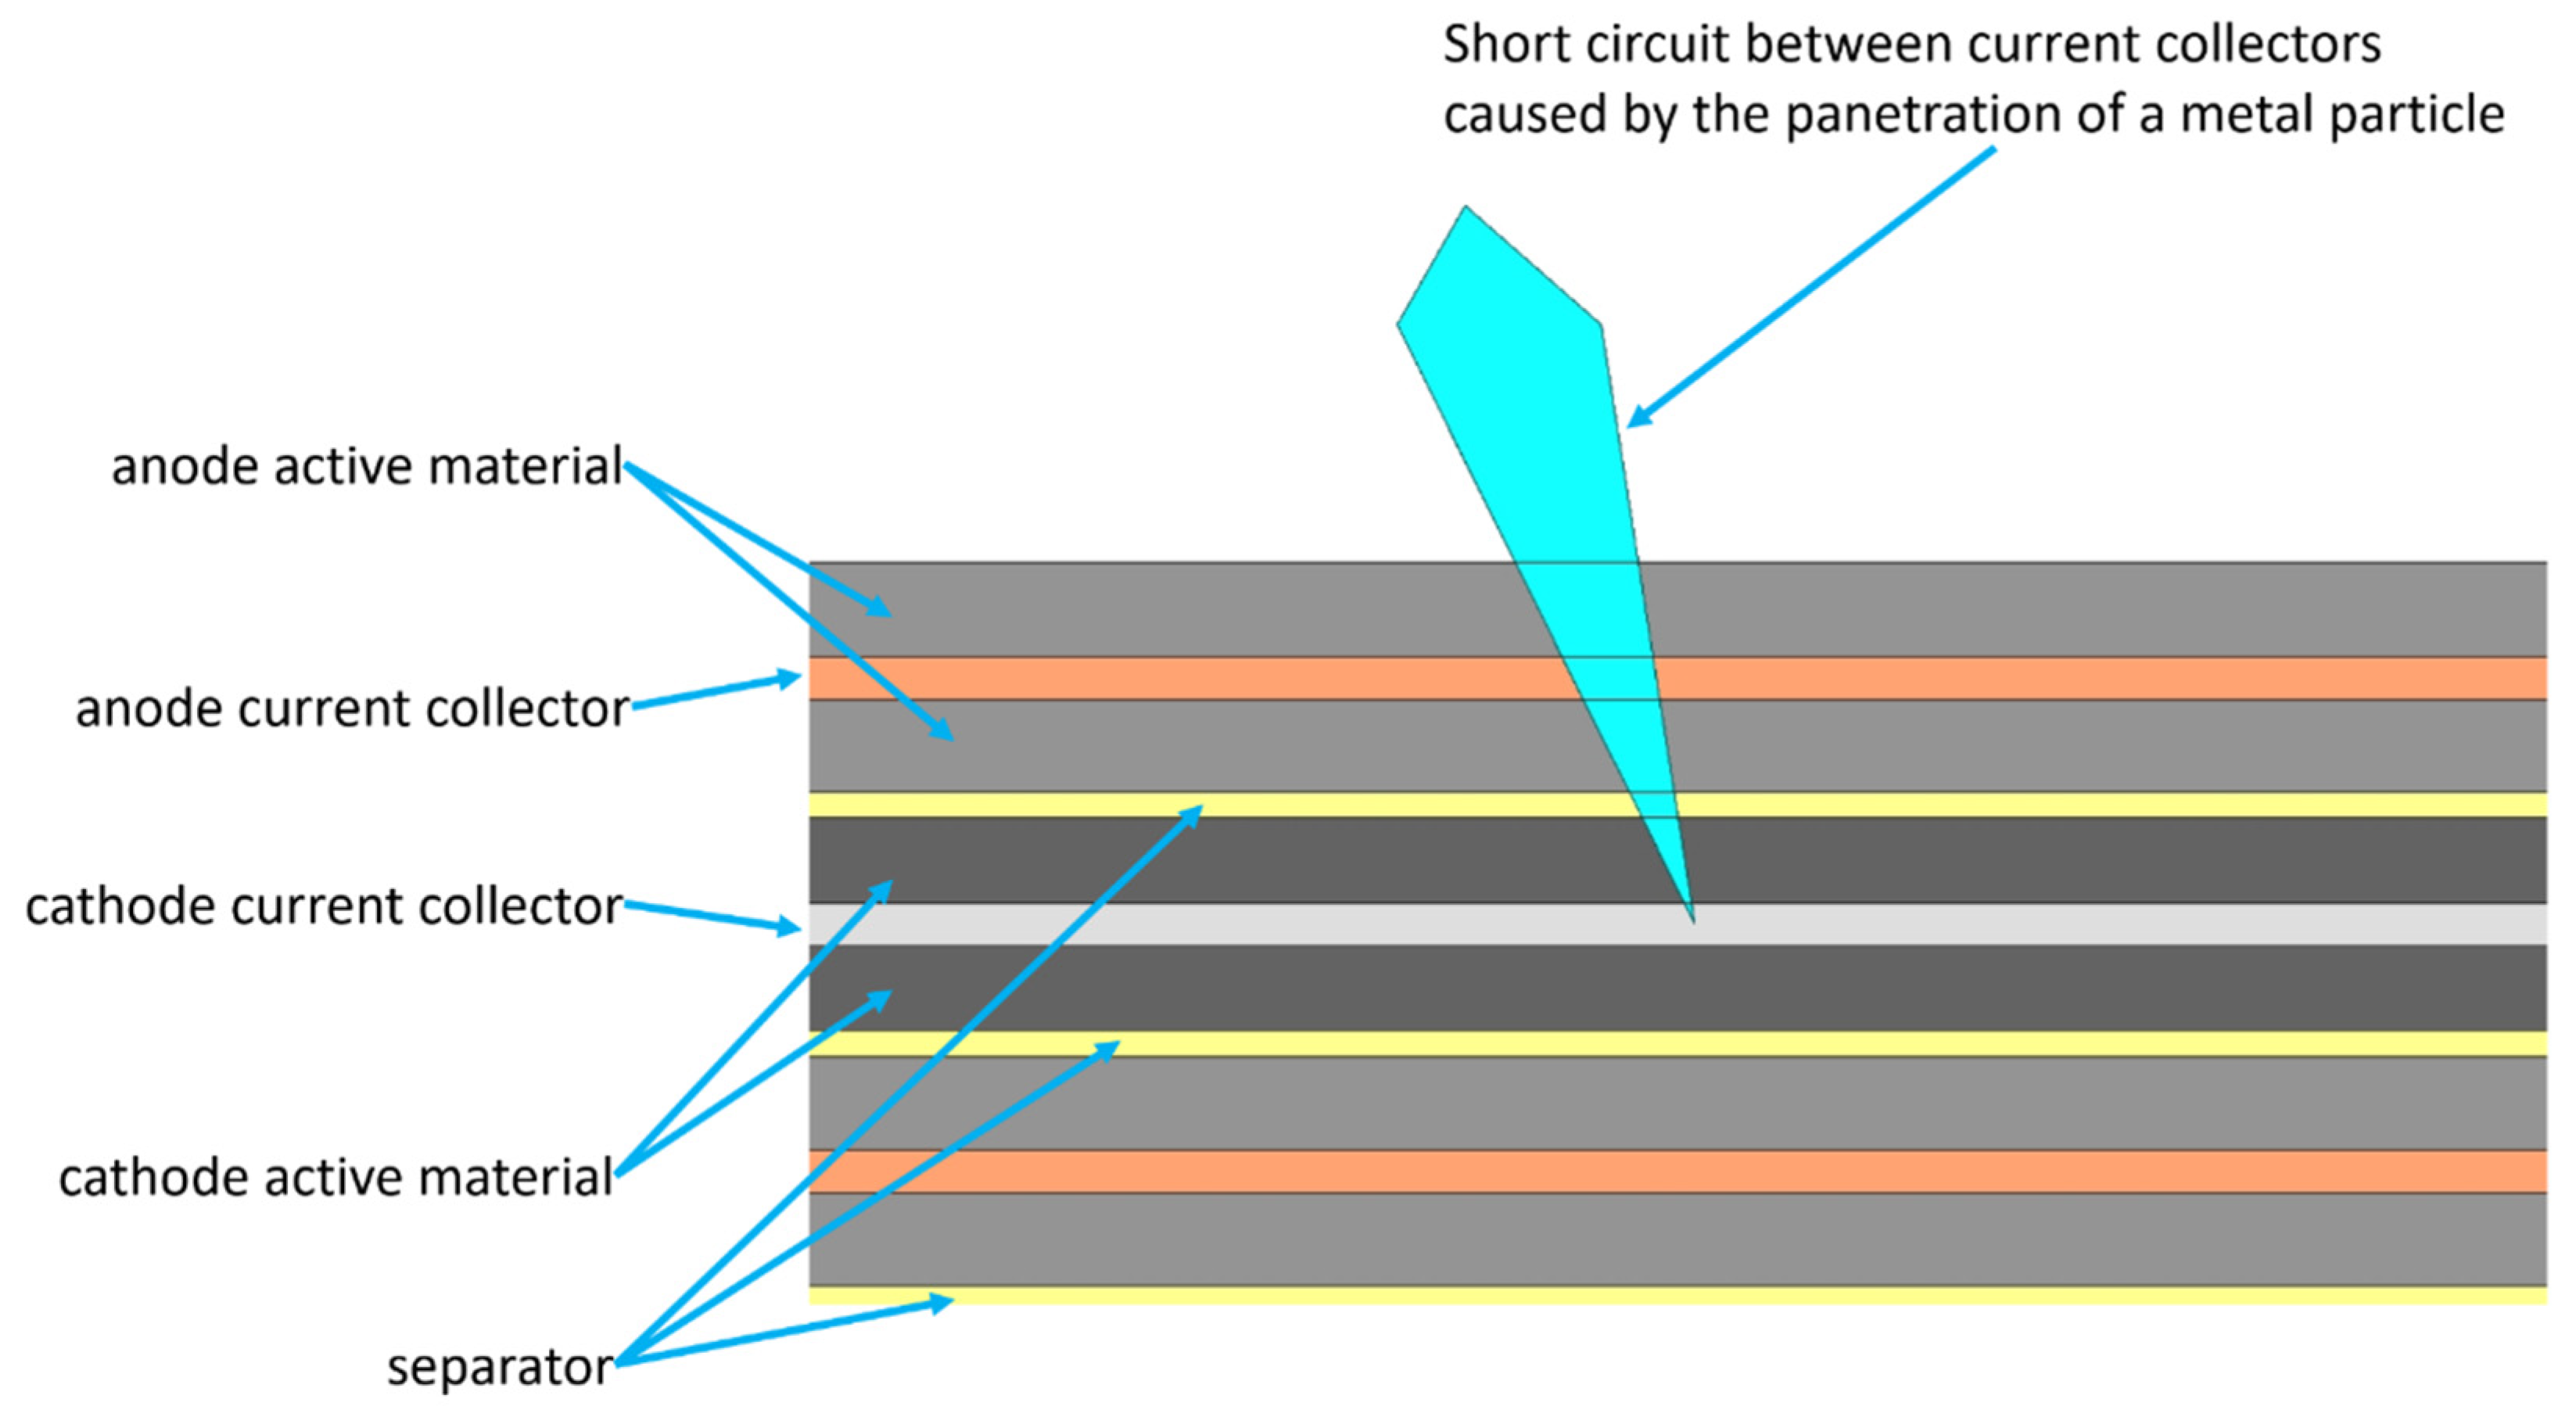
1.1.2. Virtual Internal Short Circuit Prediction
- Mohr–Coulomb failure criterion
- force drop criterion
- criterion based on unified strength theory
- criterion based on von Mises equivalent strain
- criterion based on volumetric strain
- criterion based on main normal strain
- criterion based on maximum principal stress
- criterion based on von Mises equivalent stress
- criterion based on deformation in length and diameter
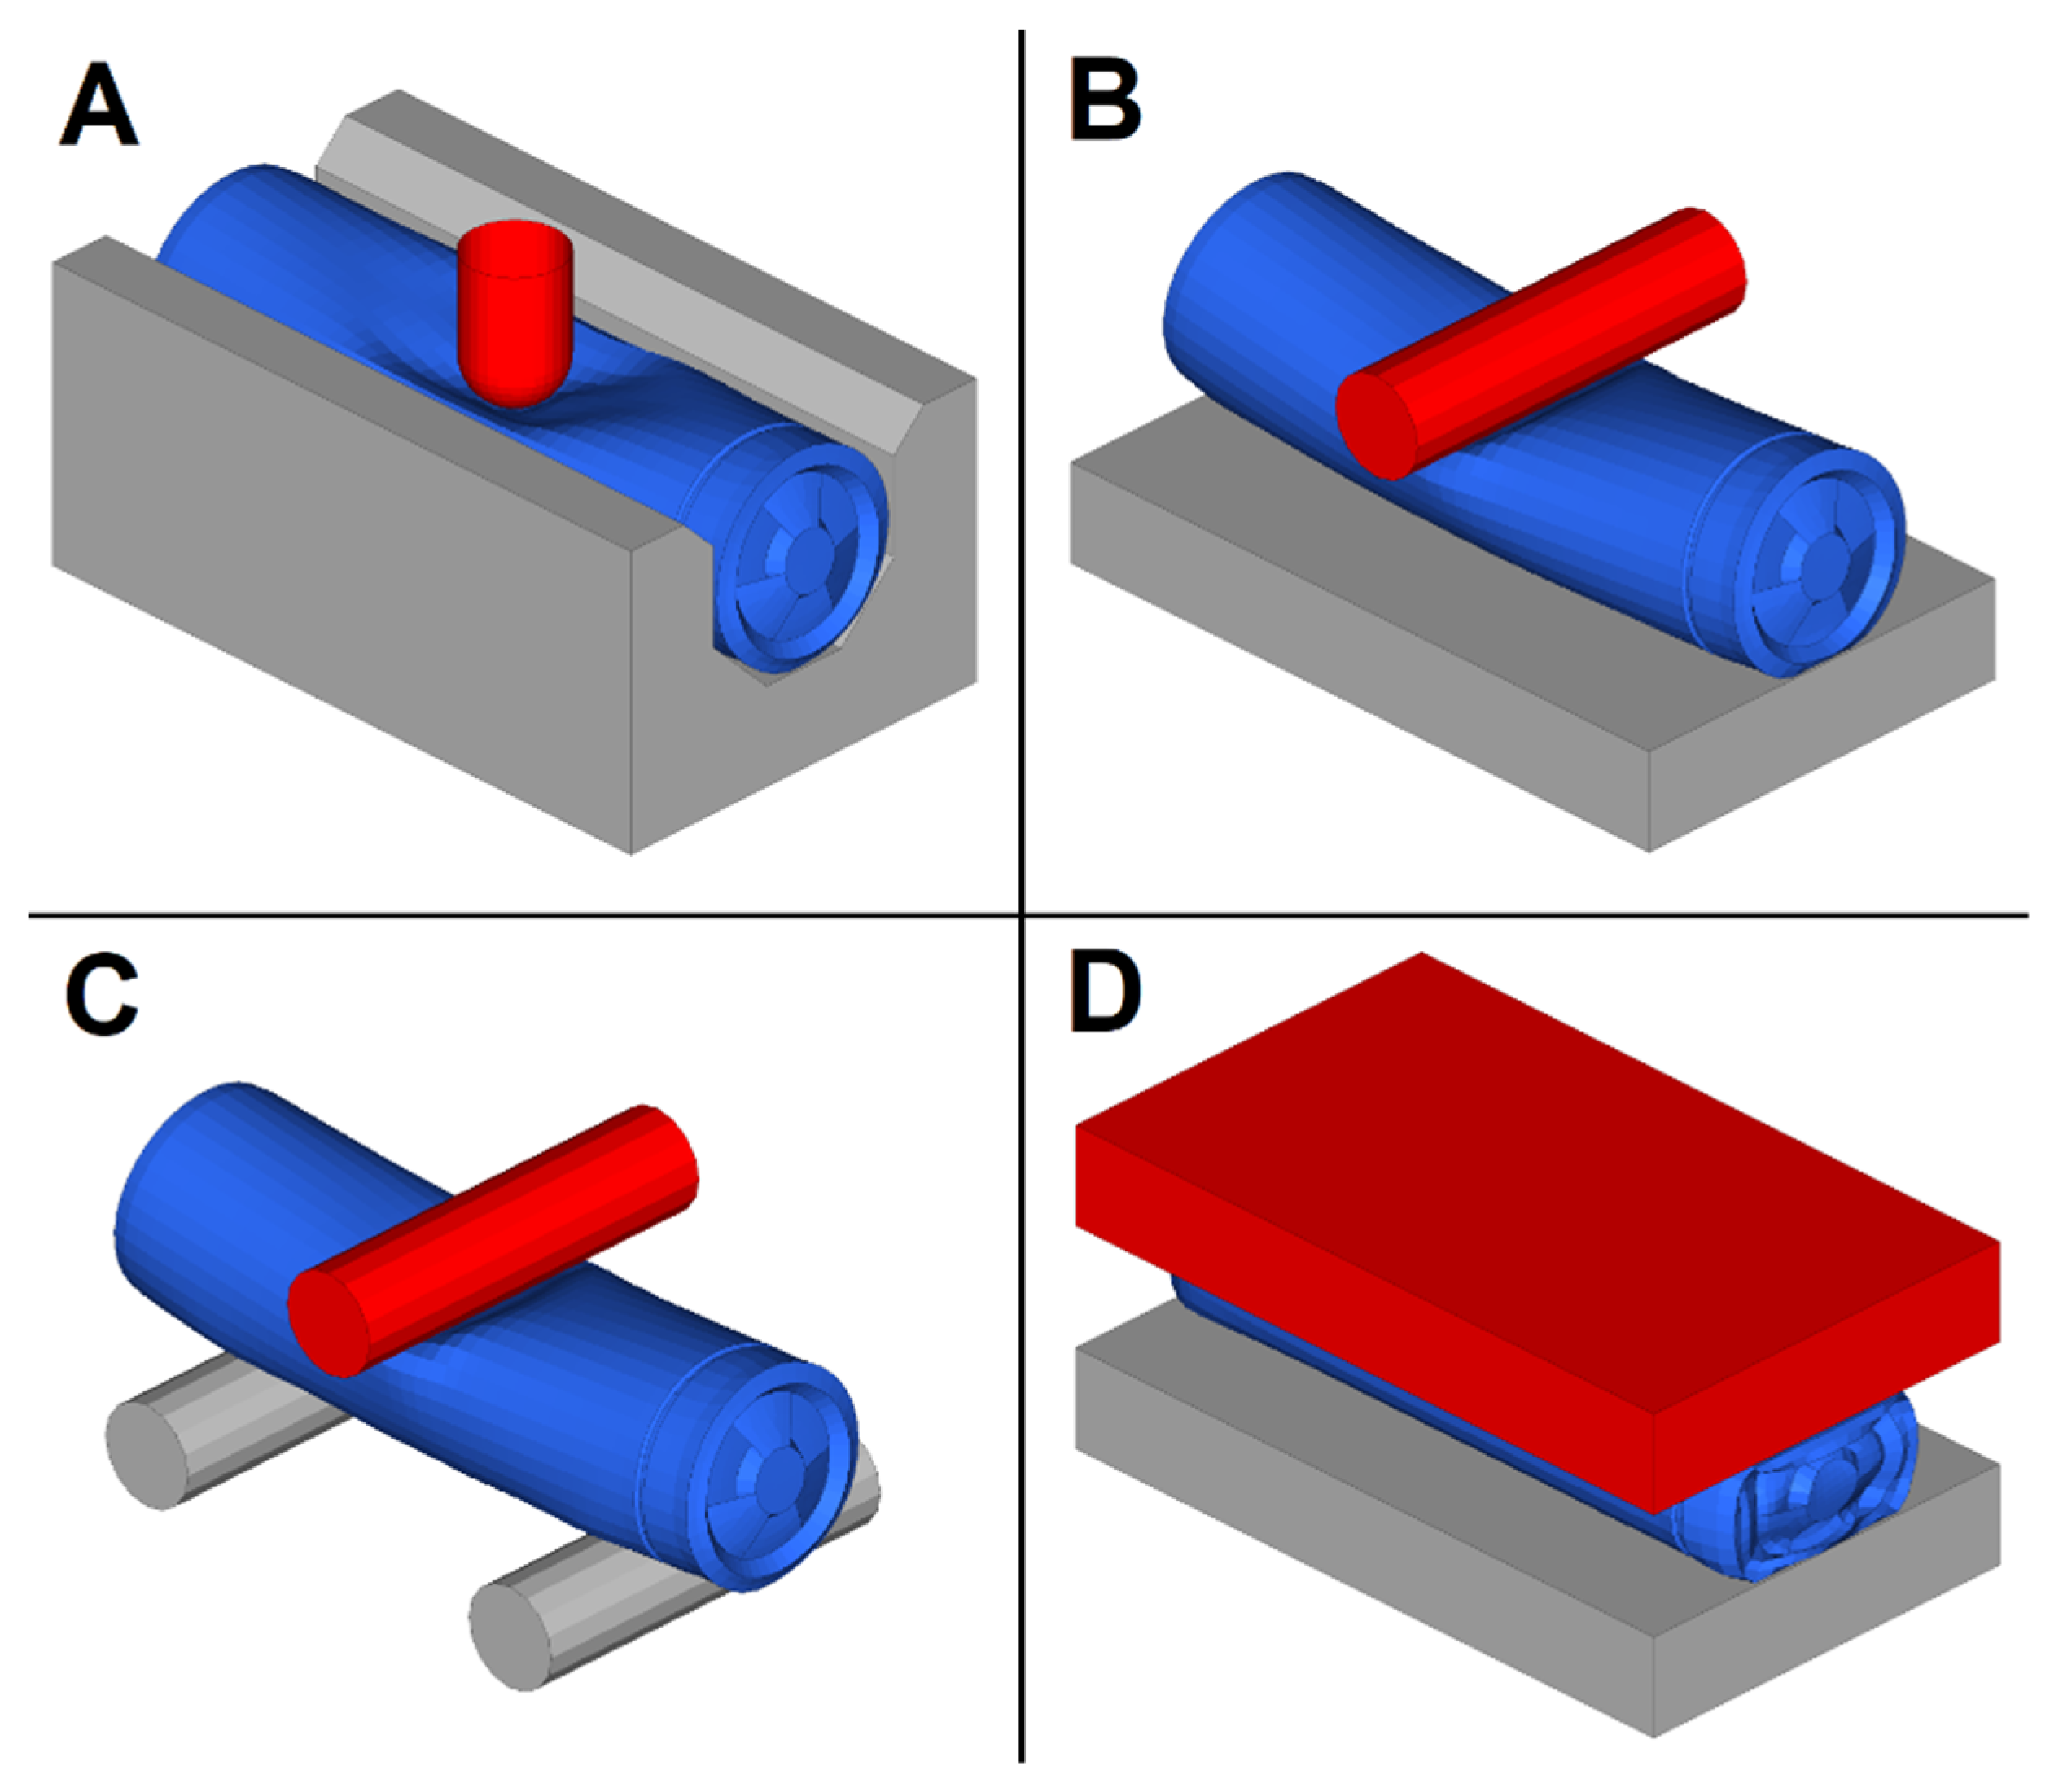
2. Mechanical Abuse Testing
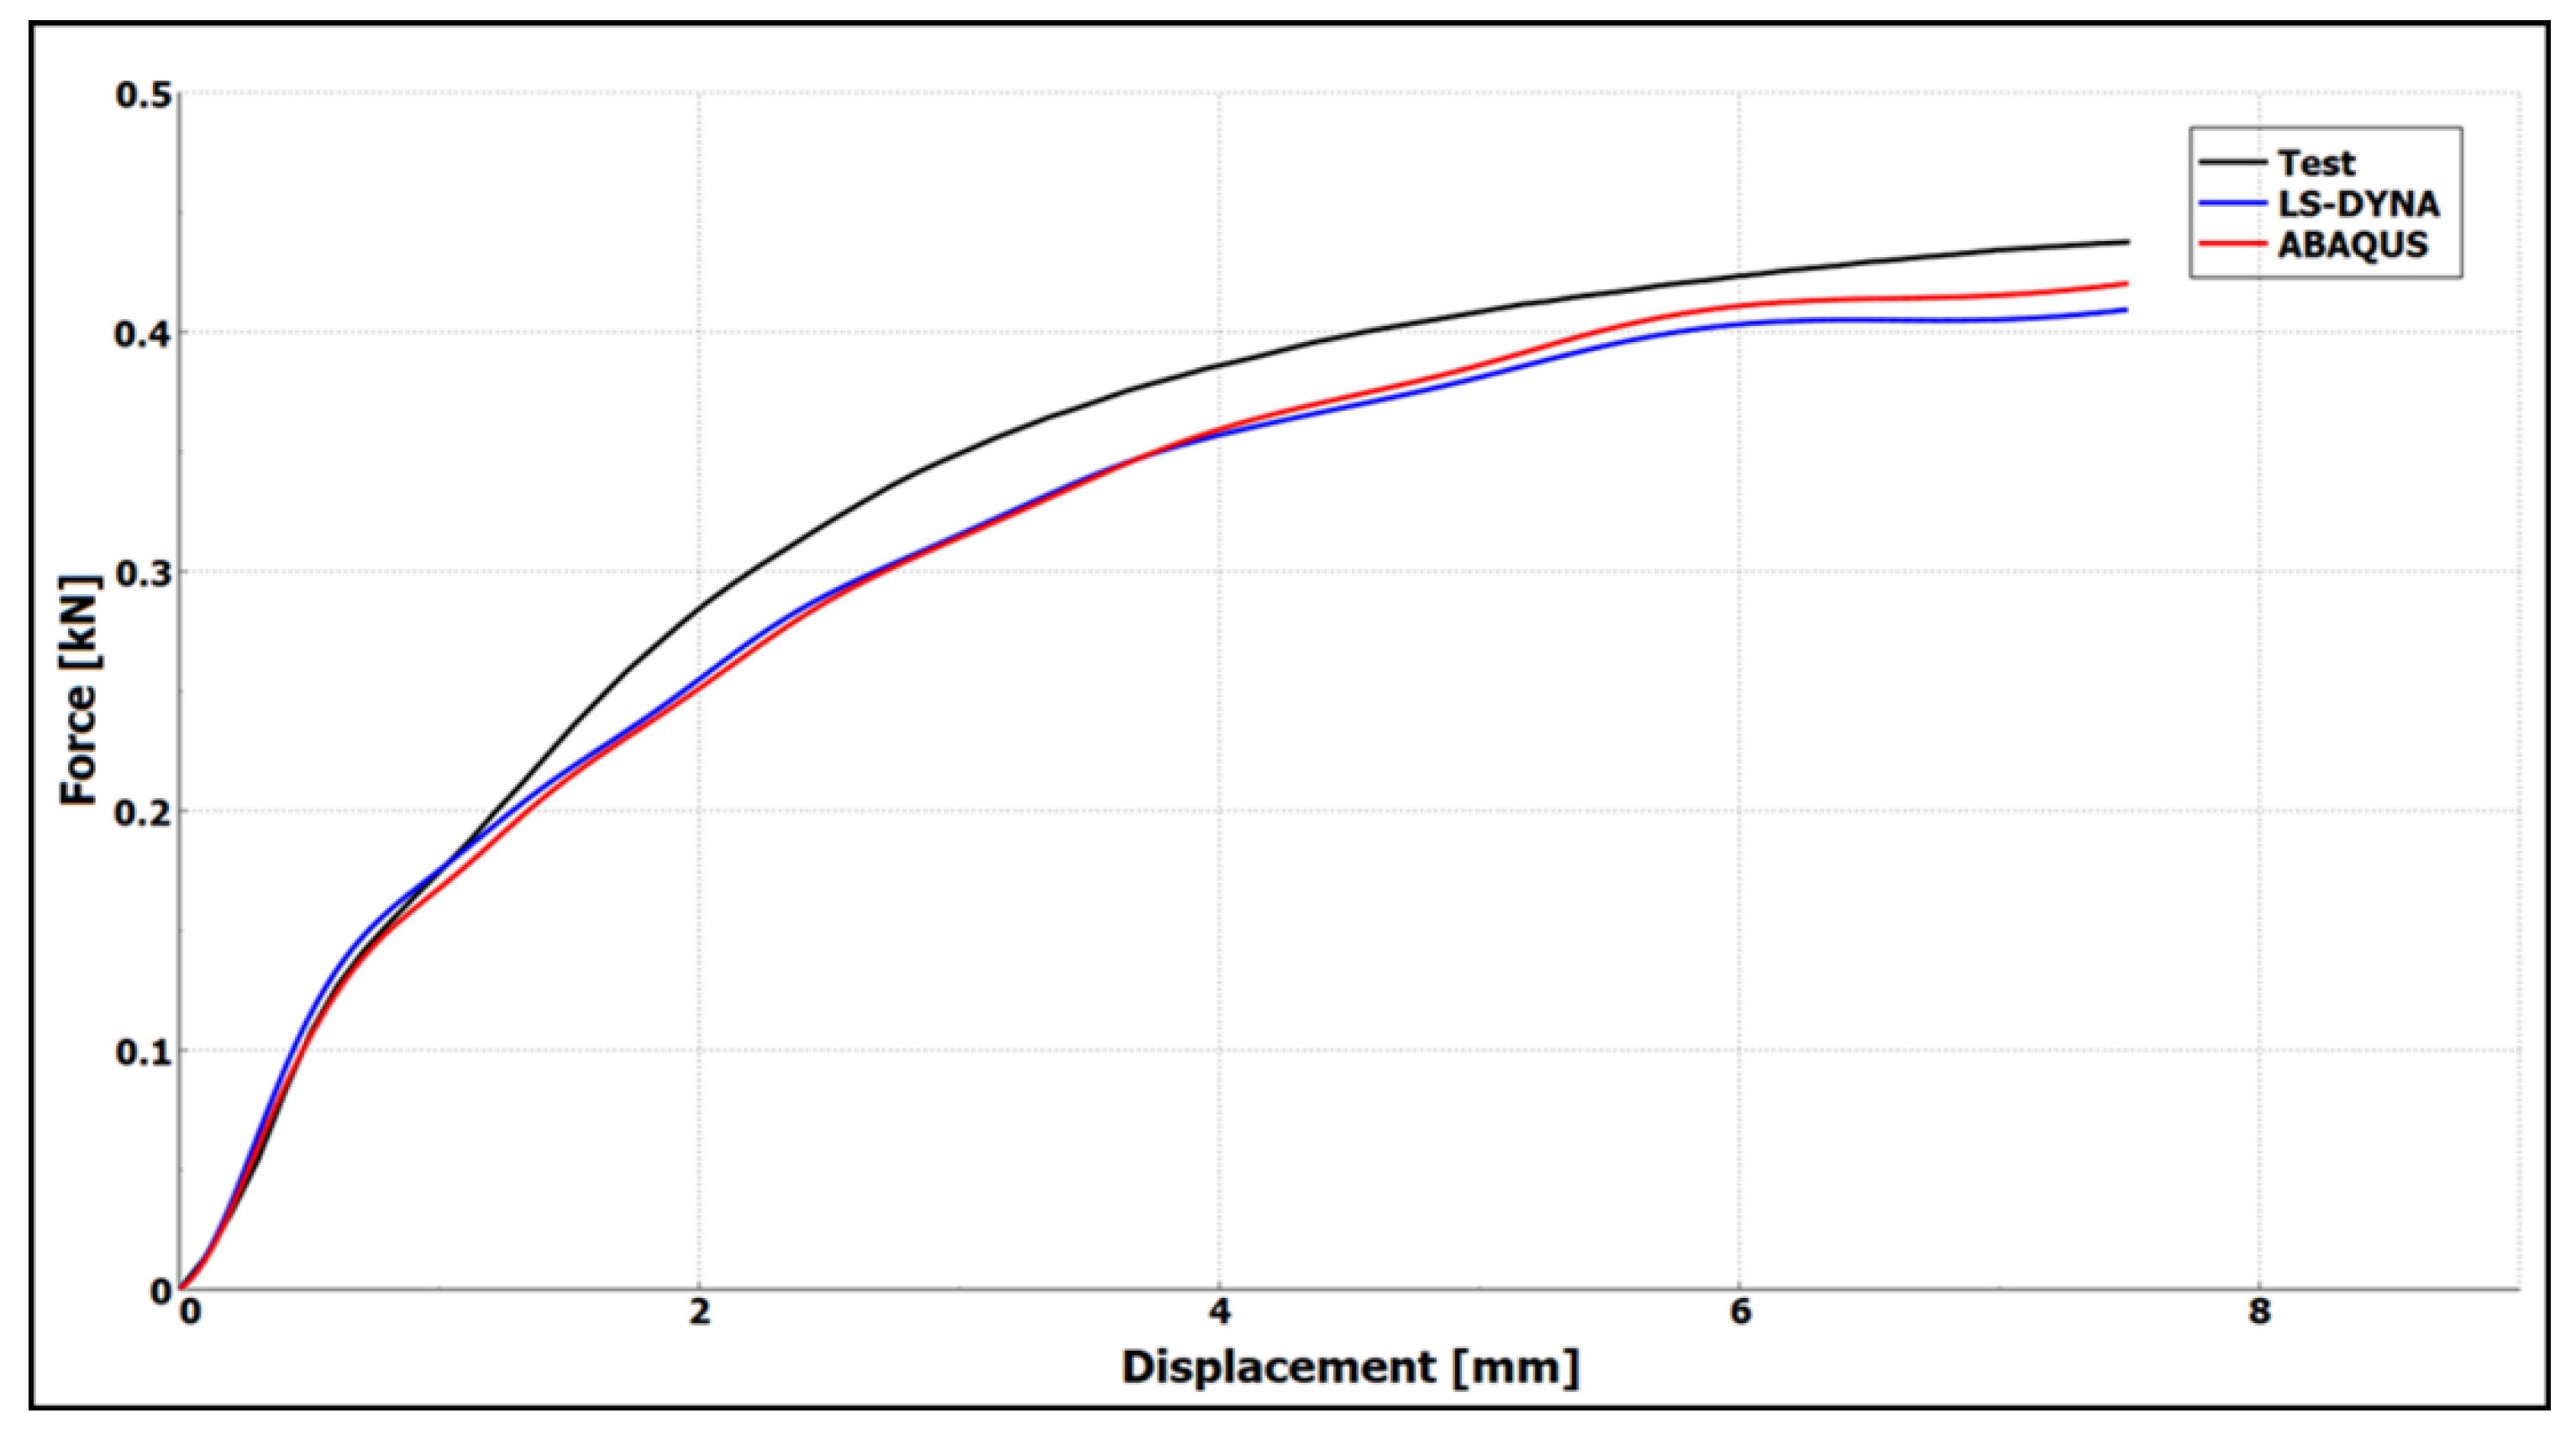
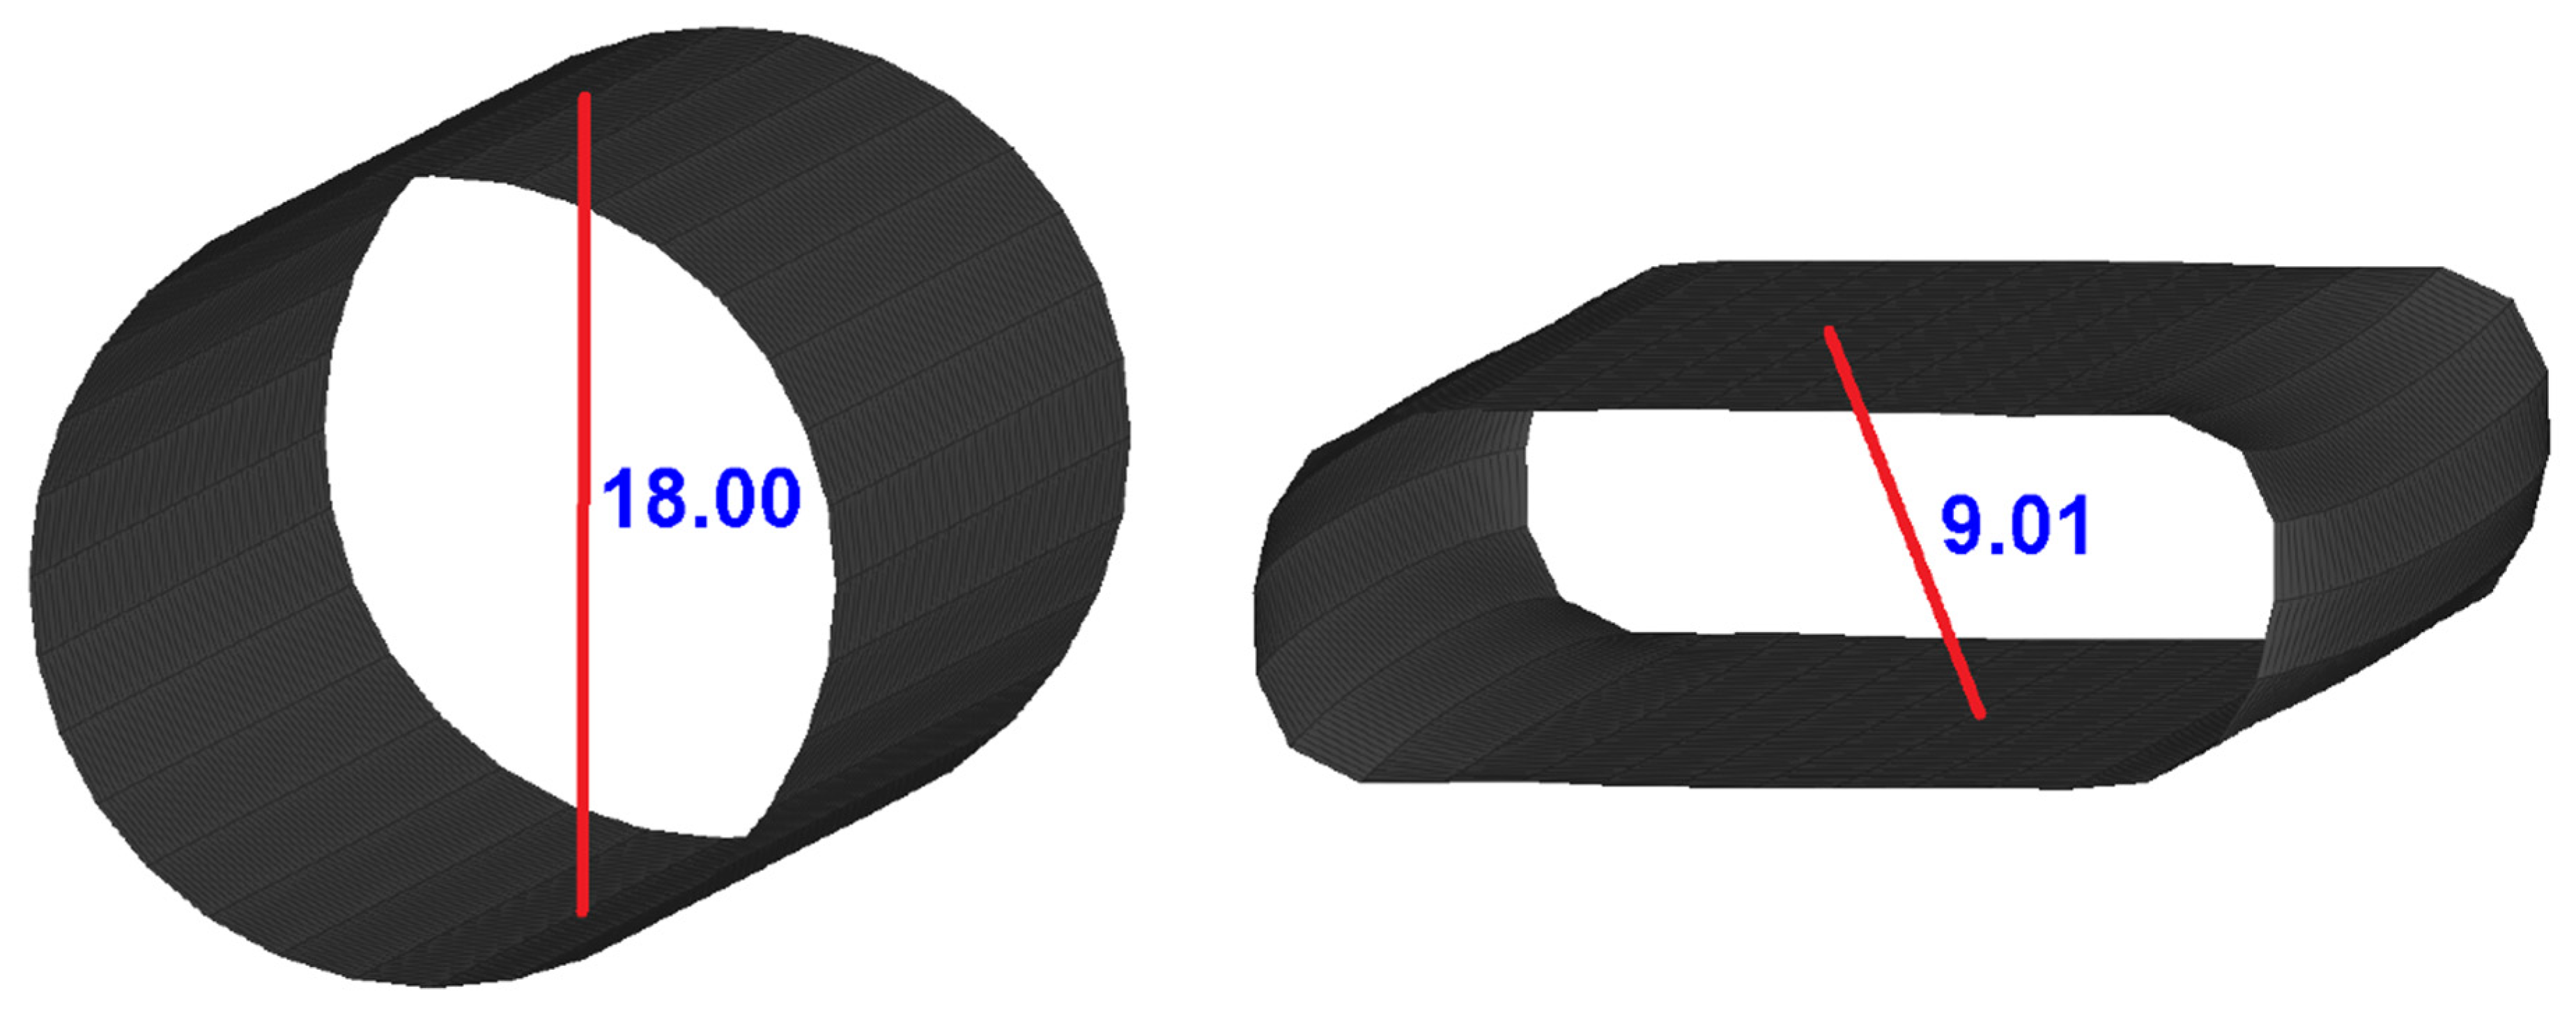
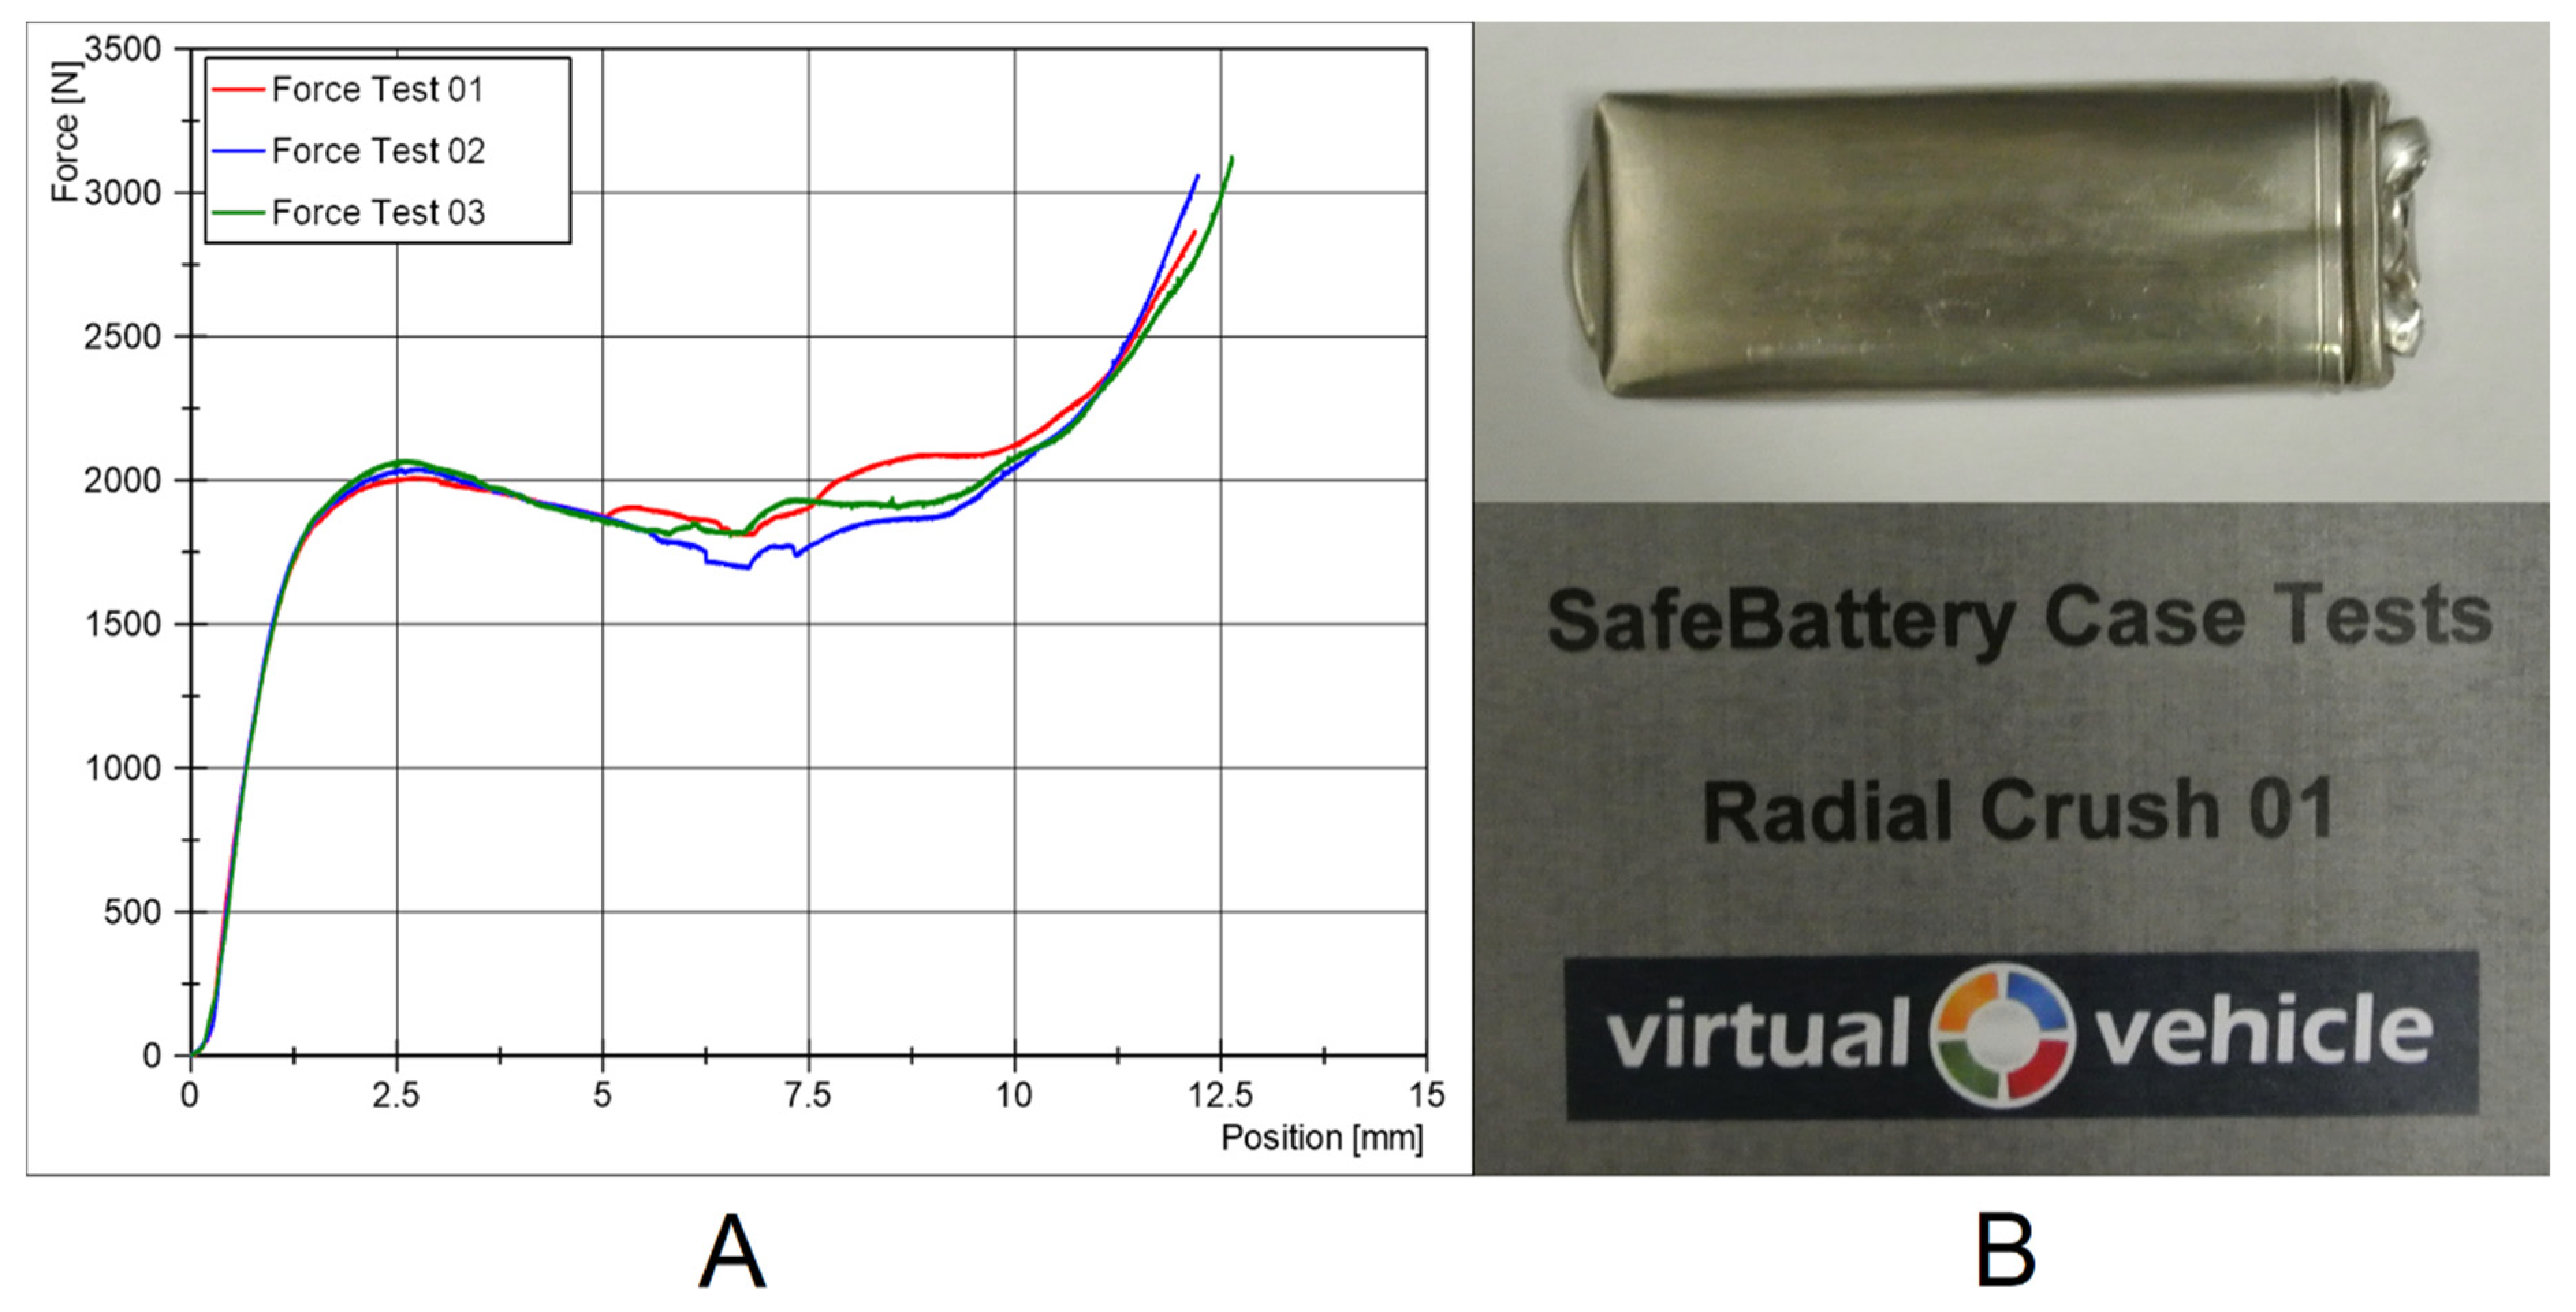
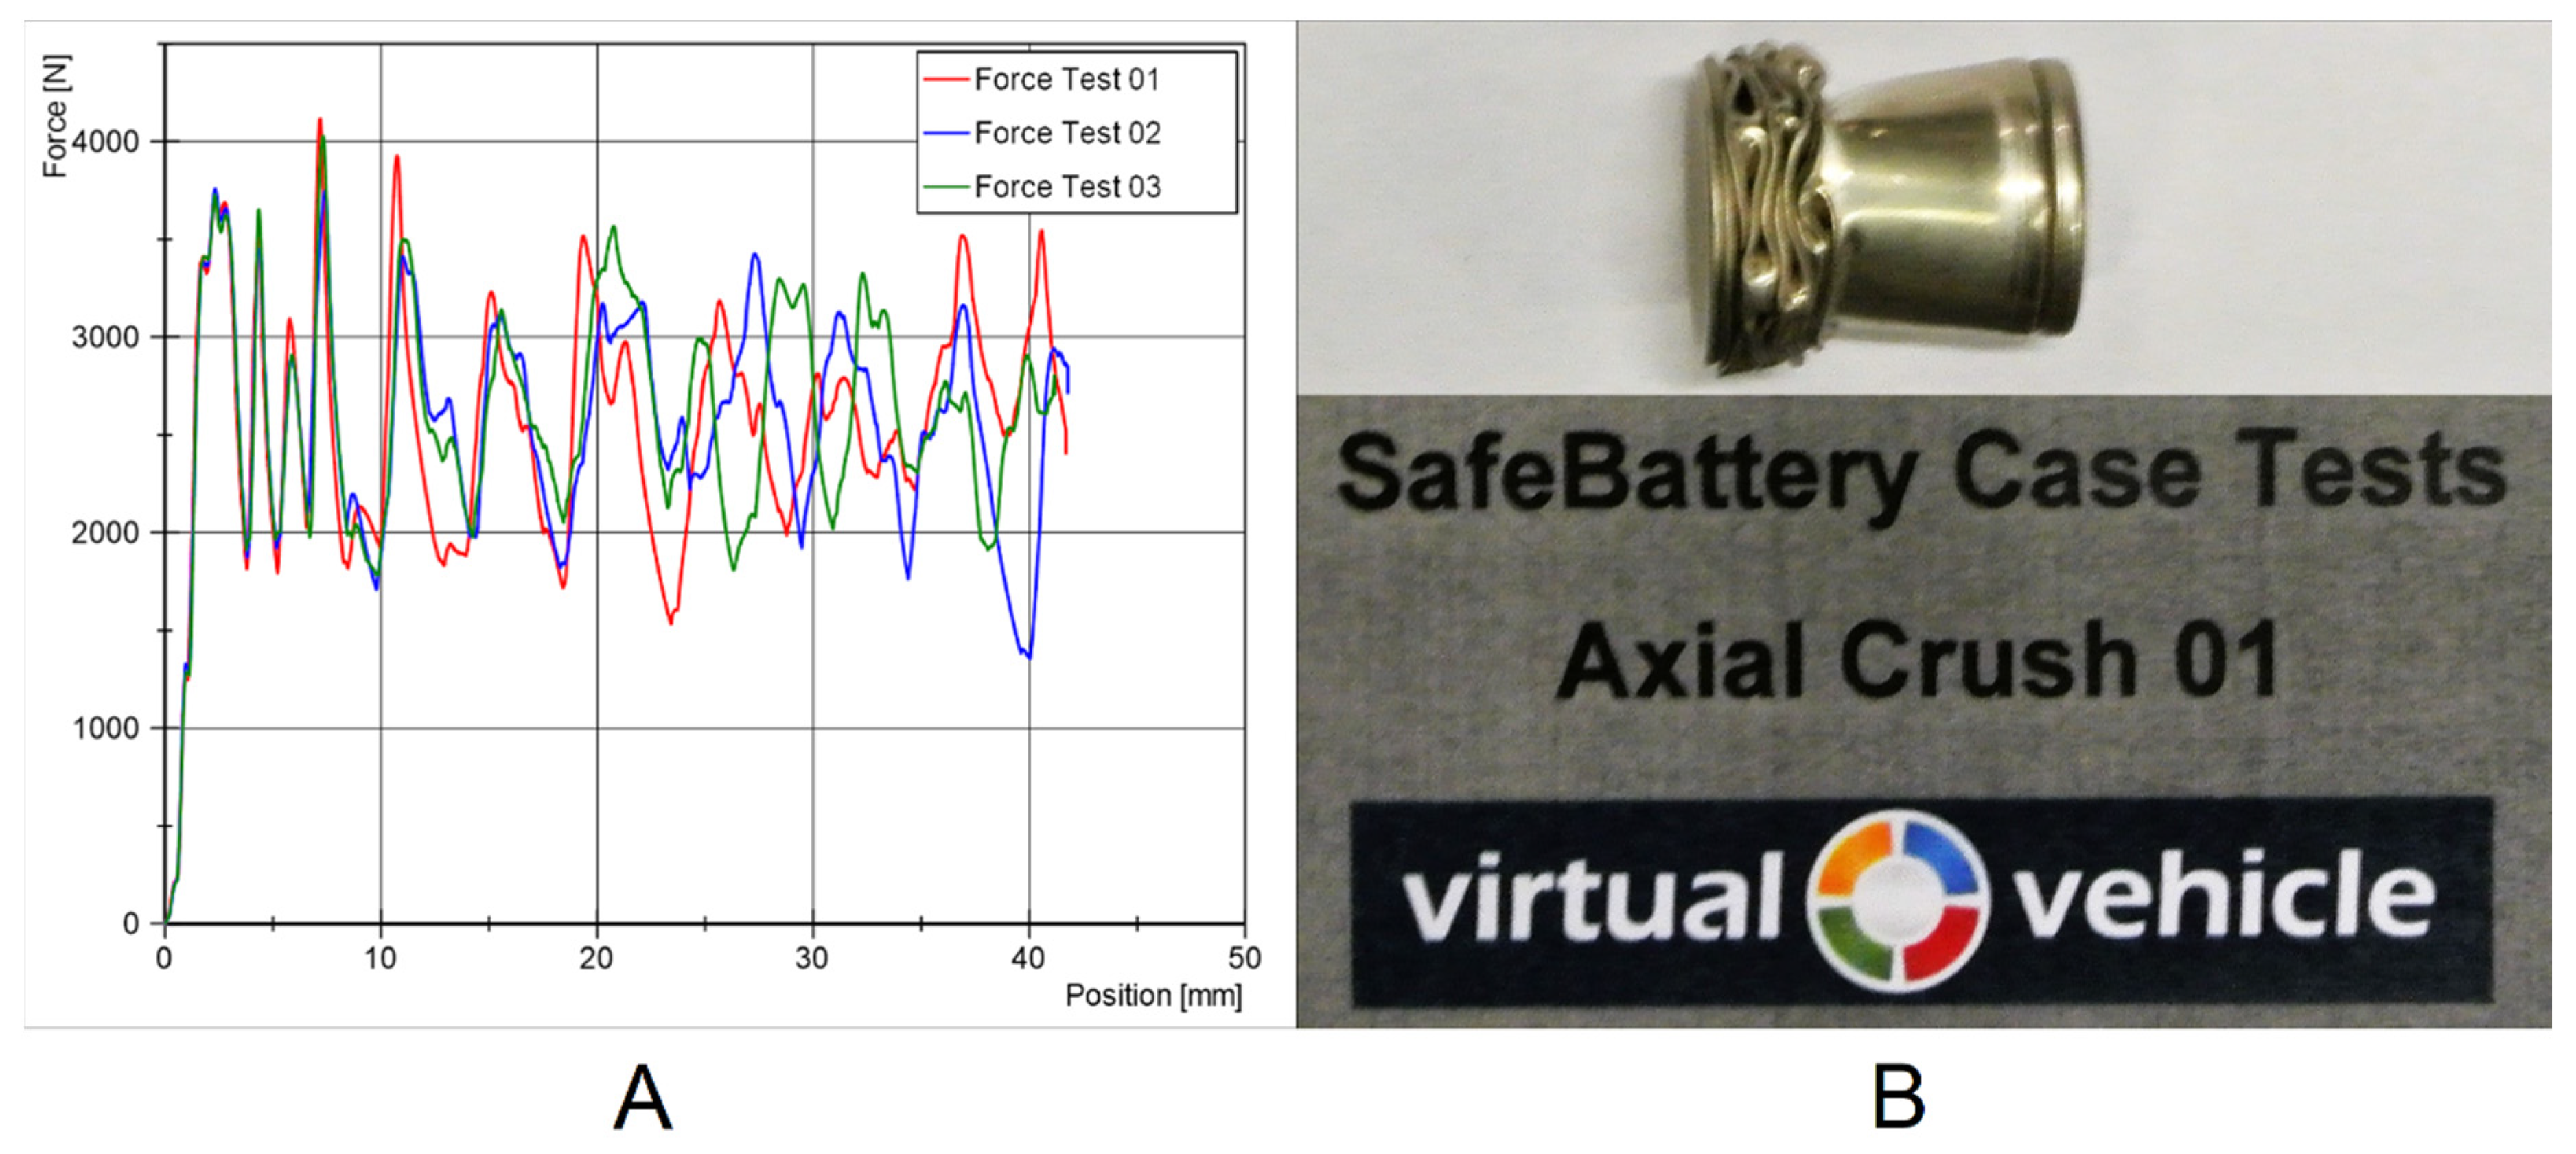
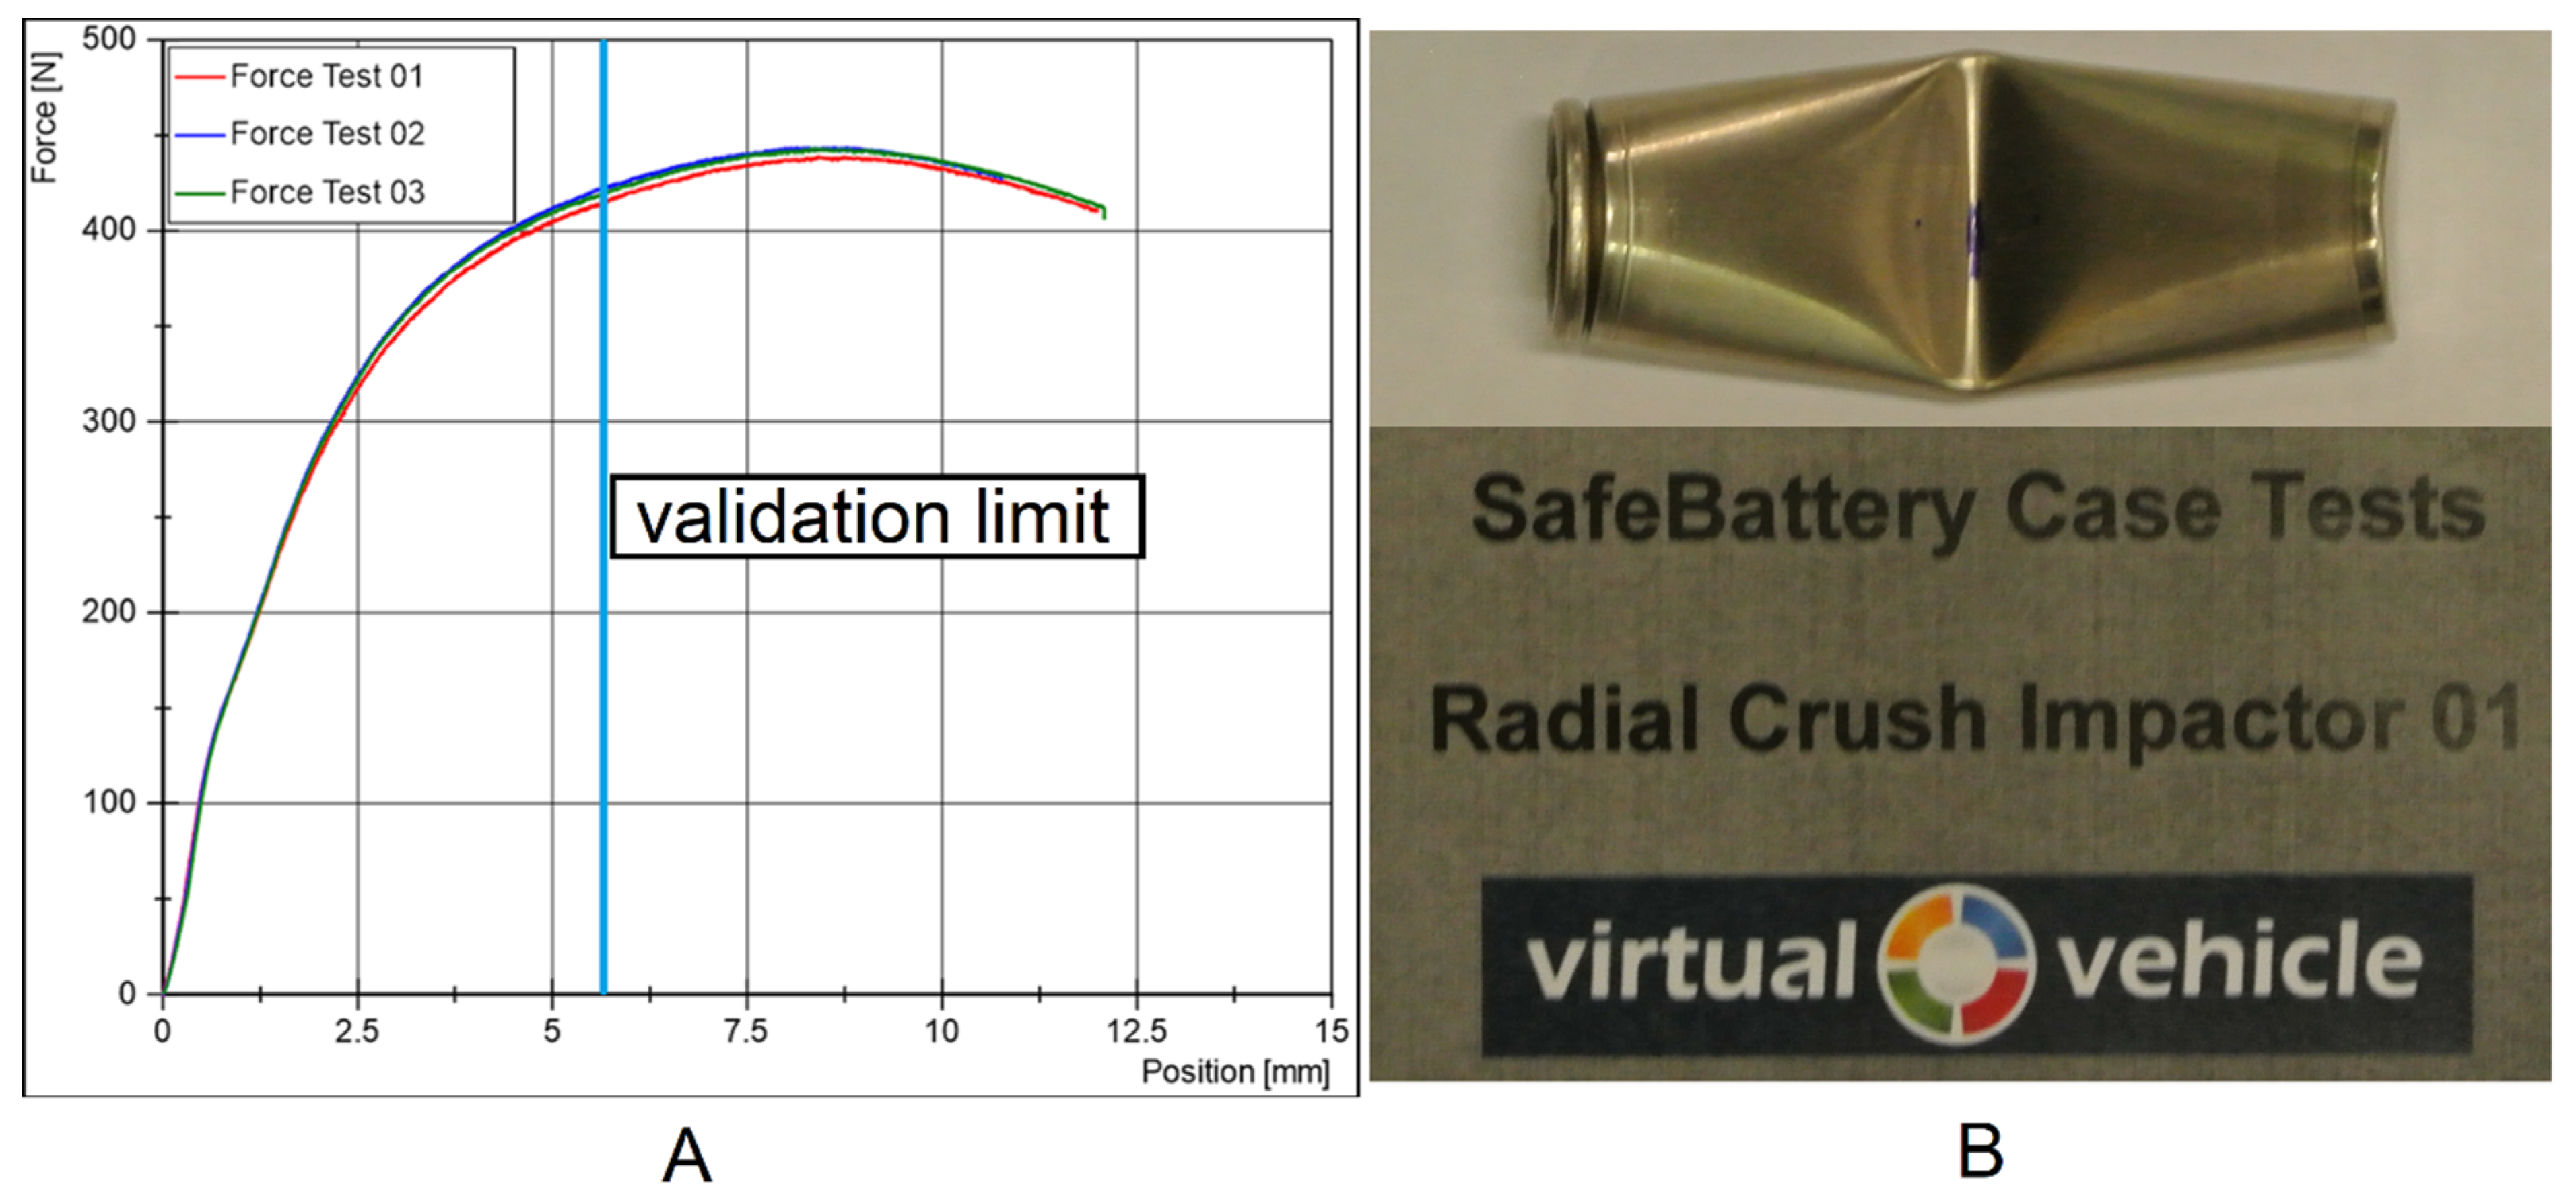
2.1. Cell Case Testing
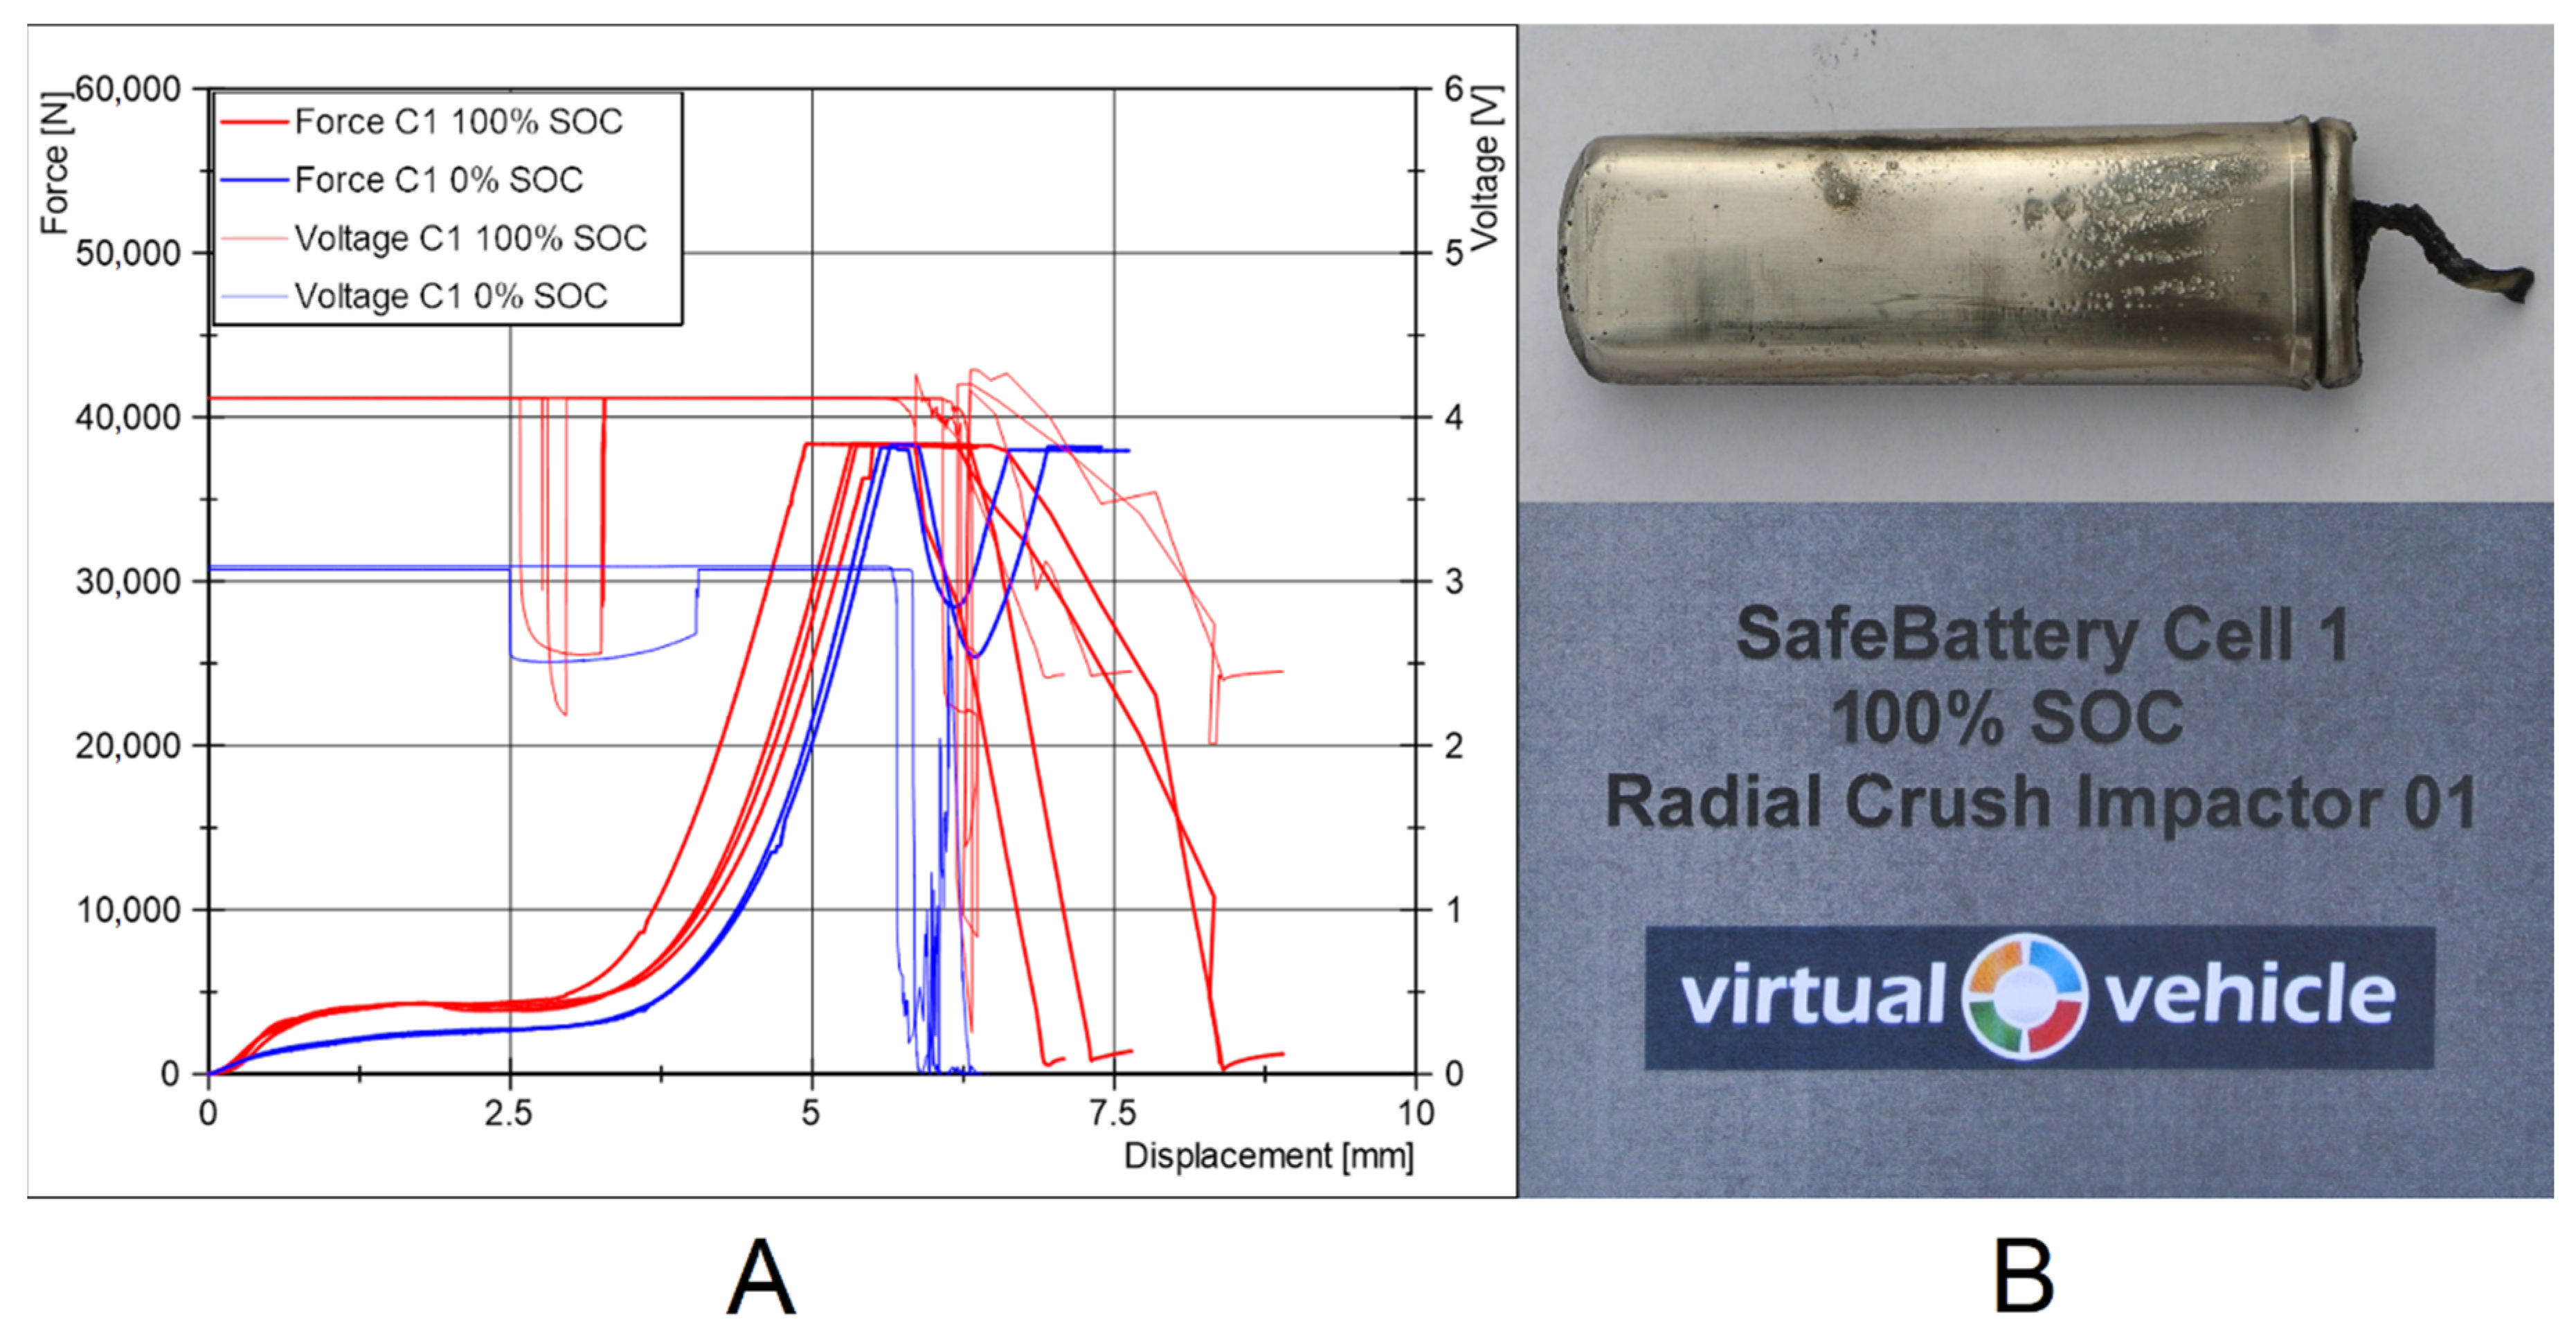
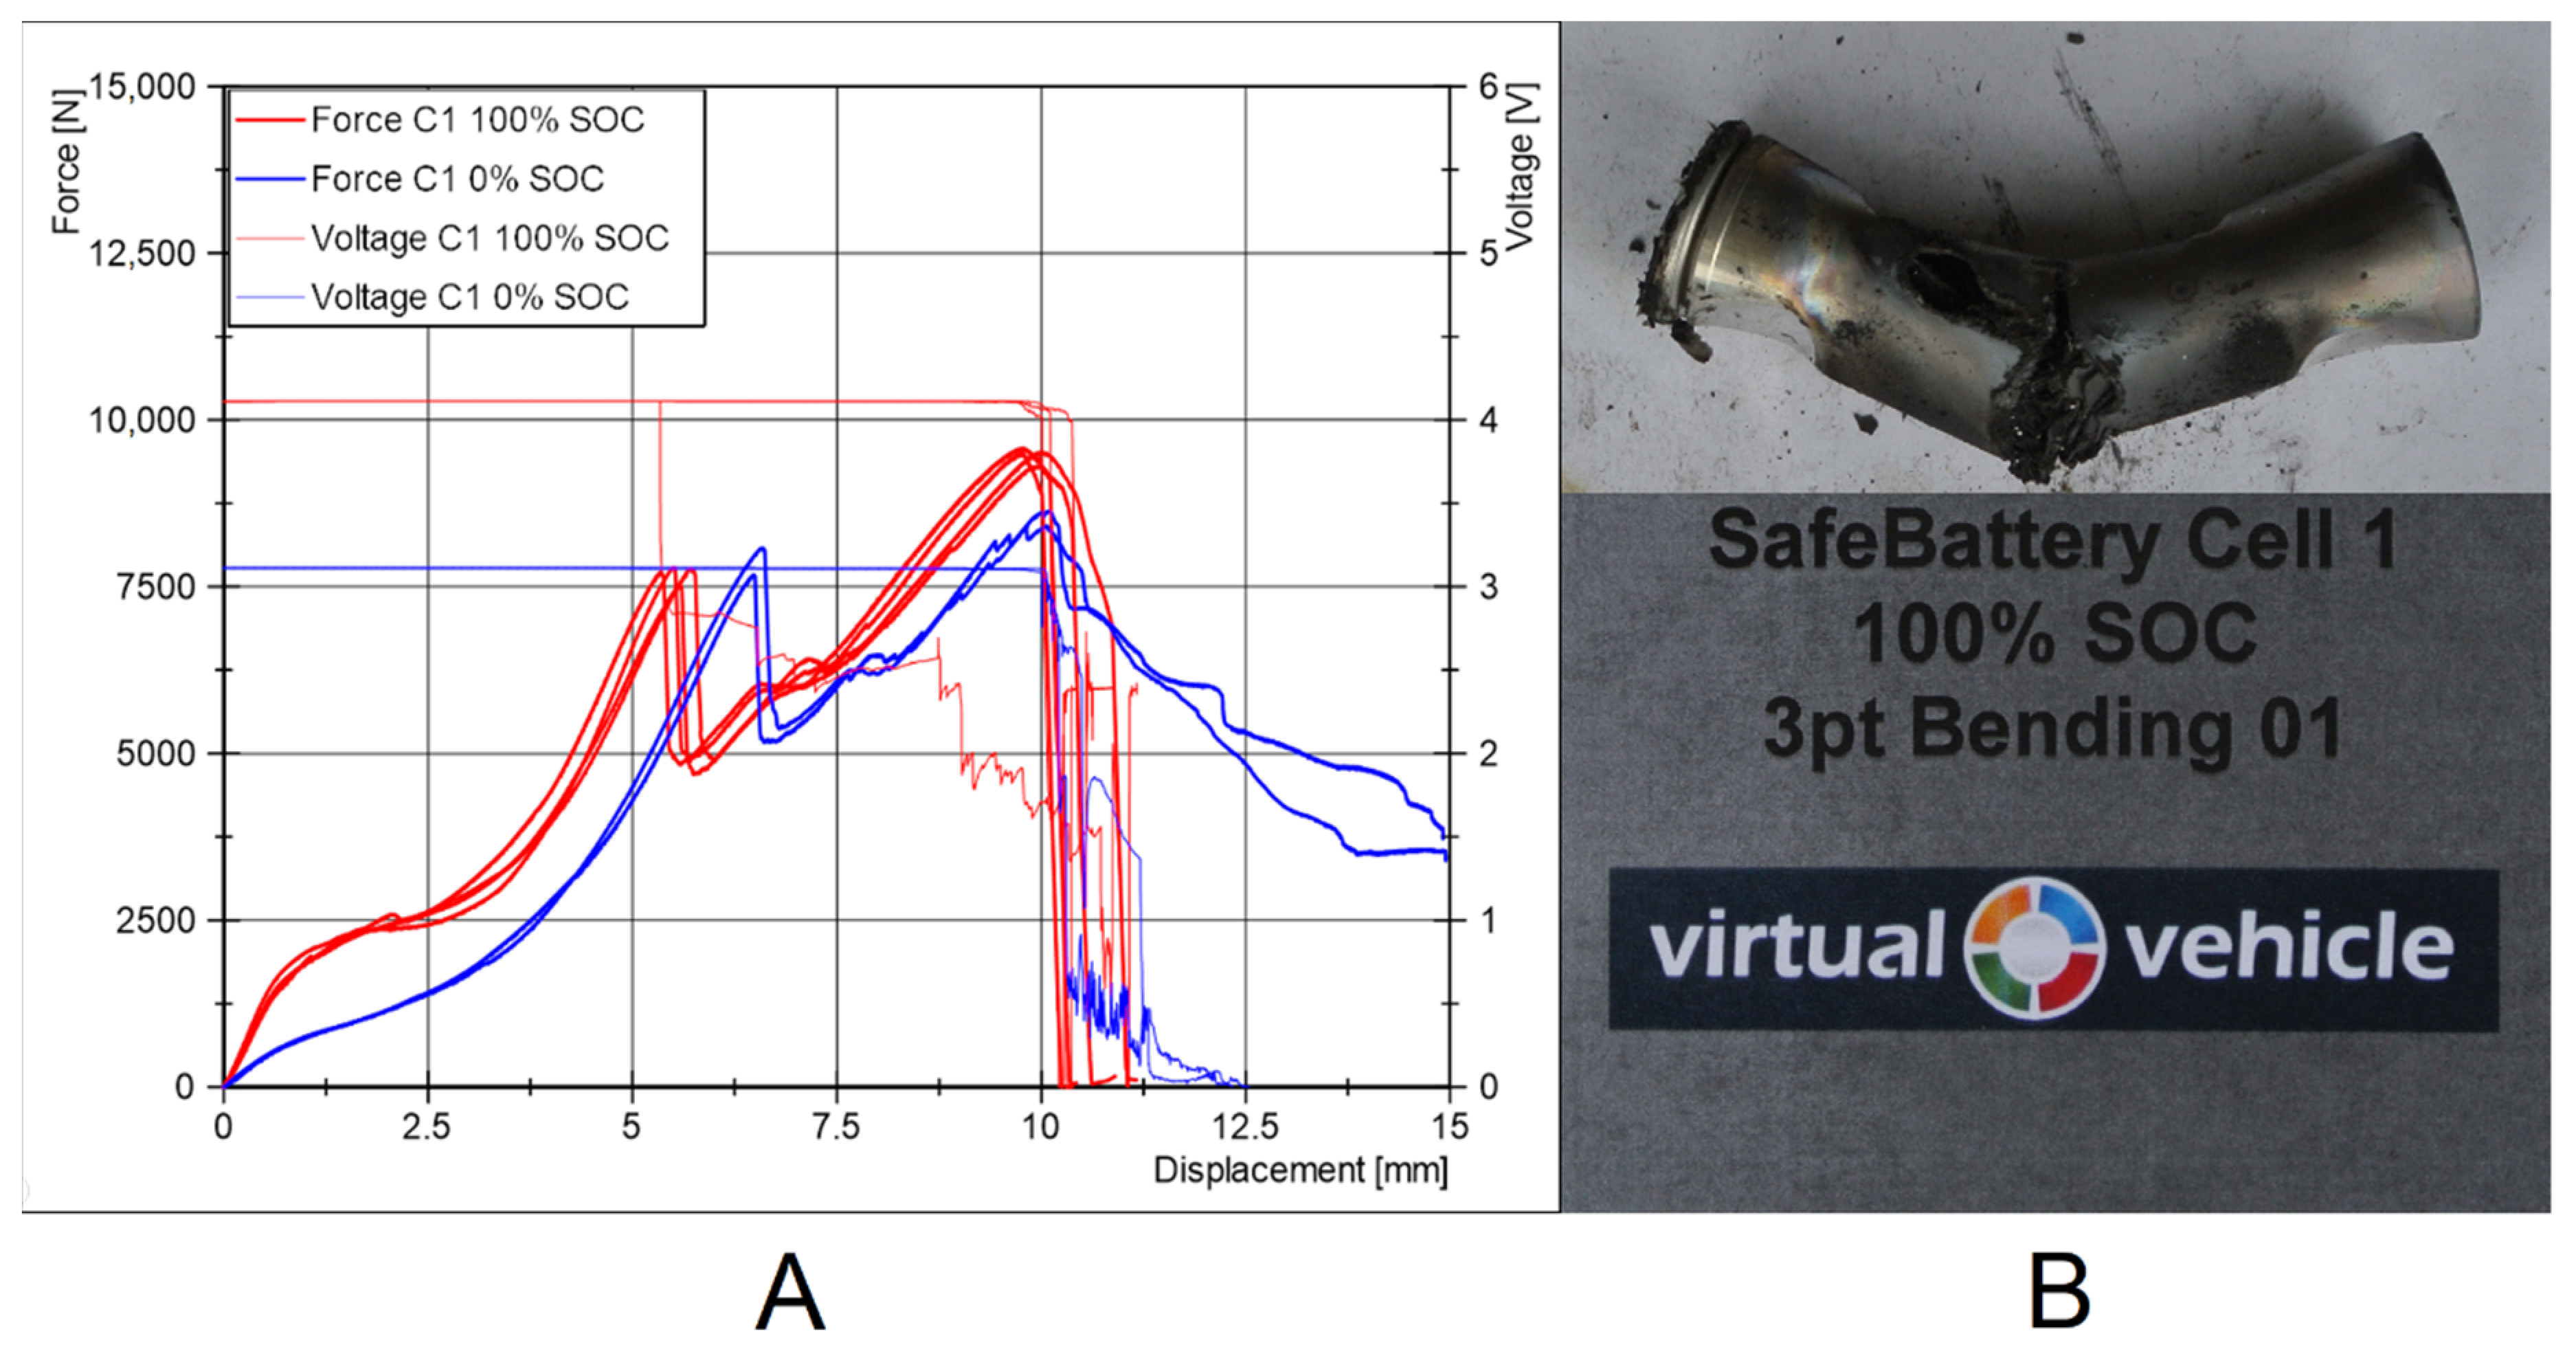
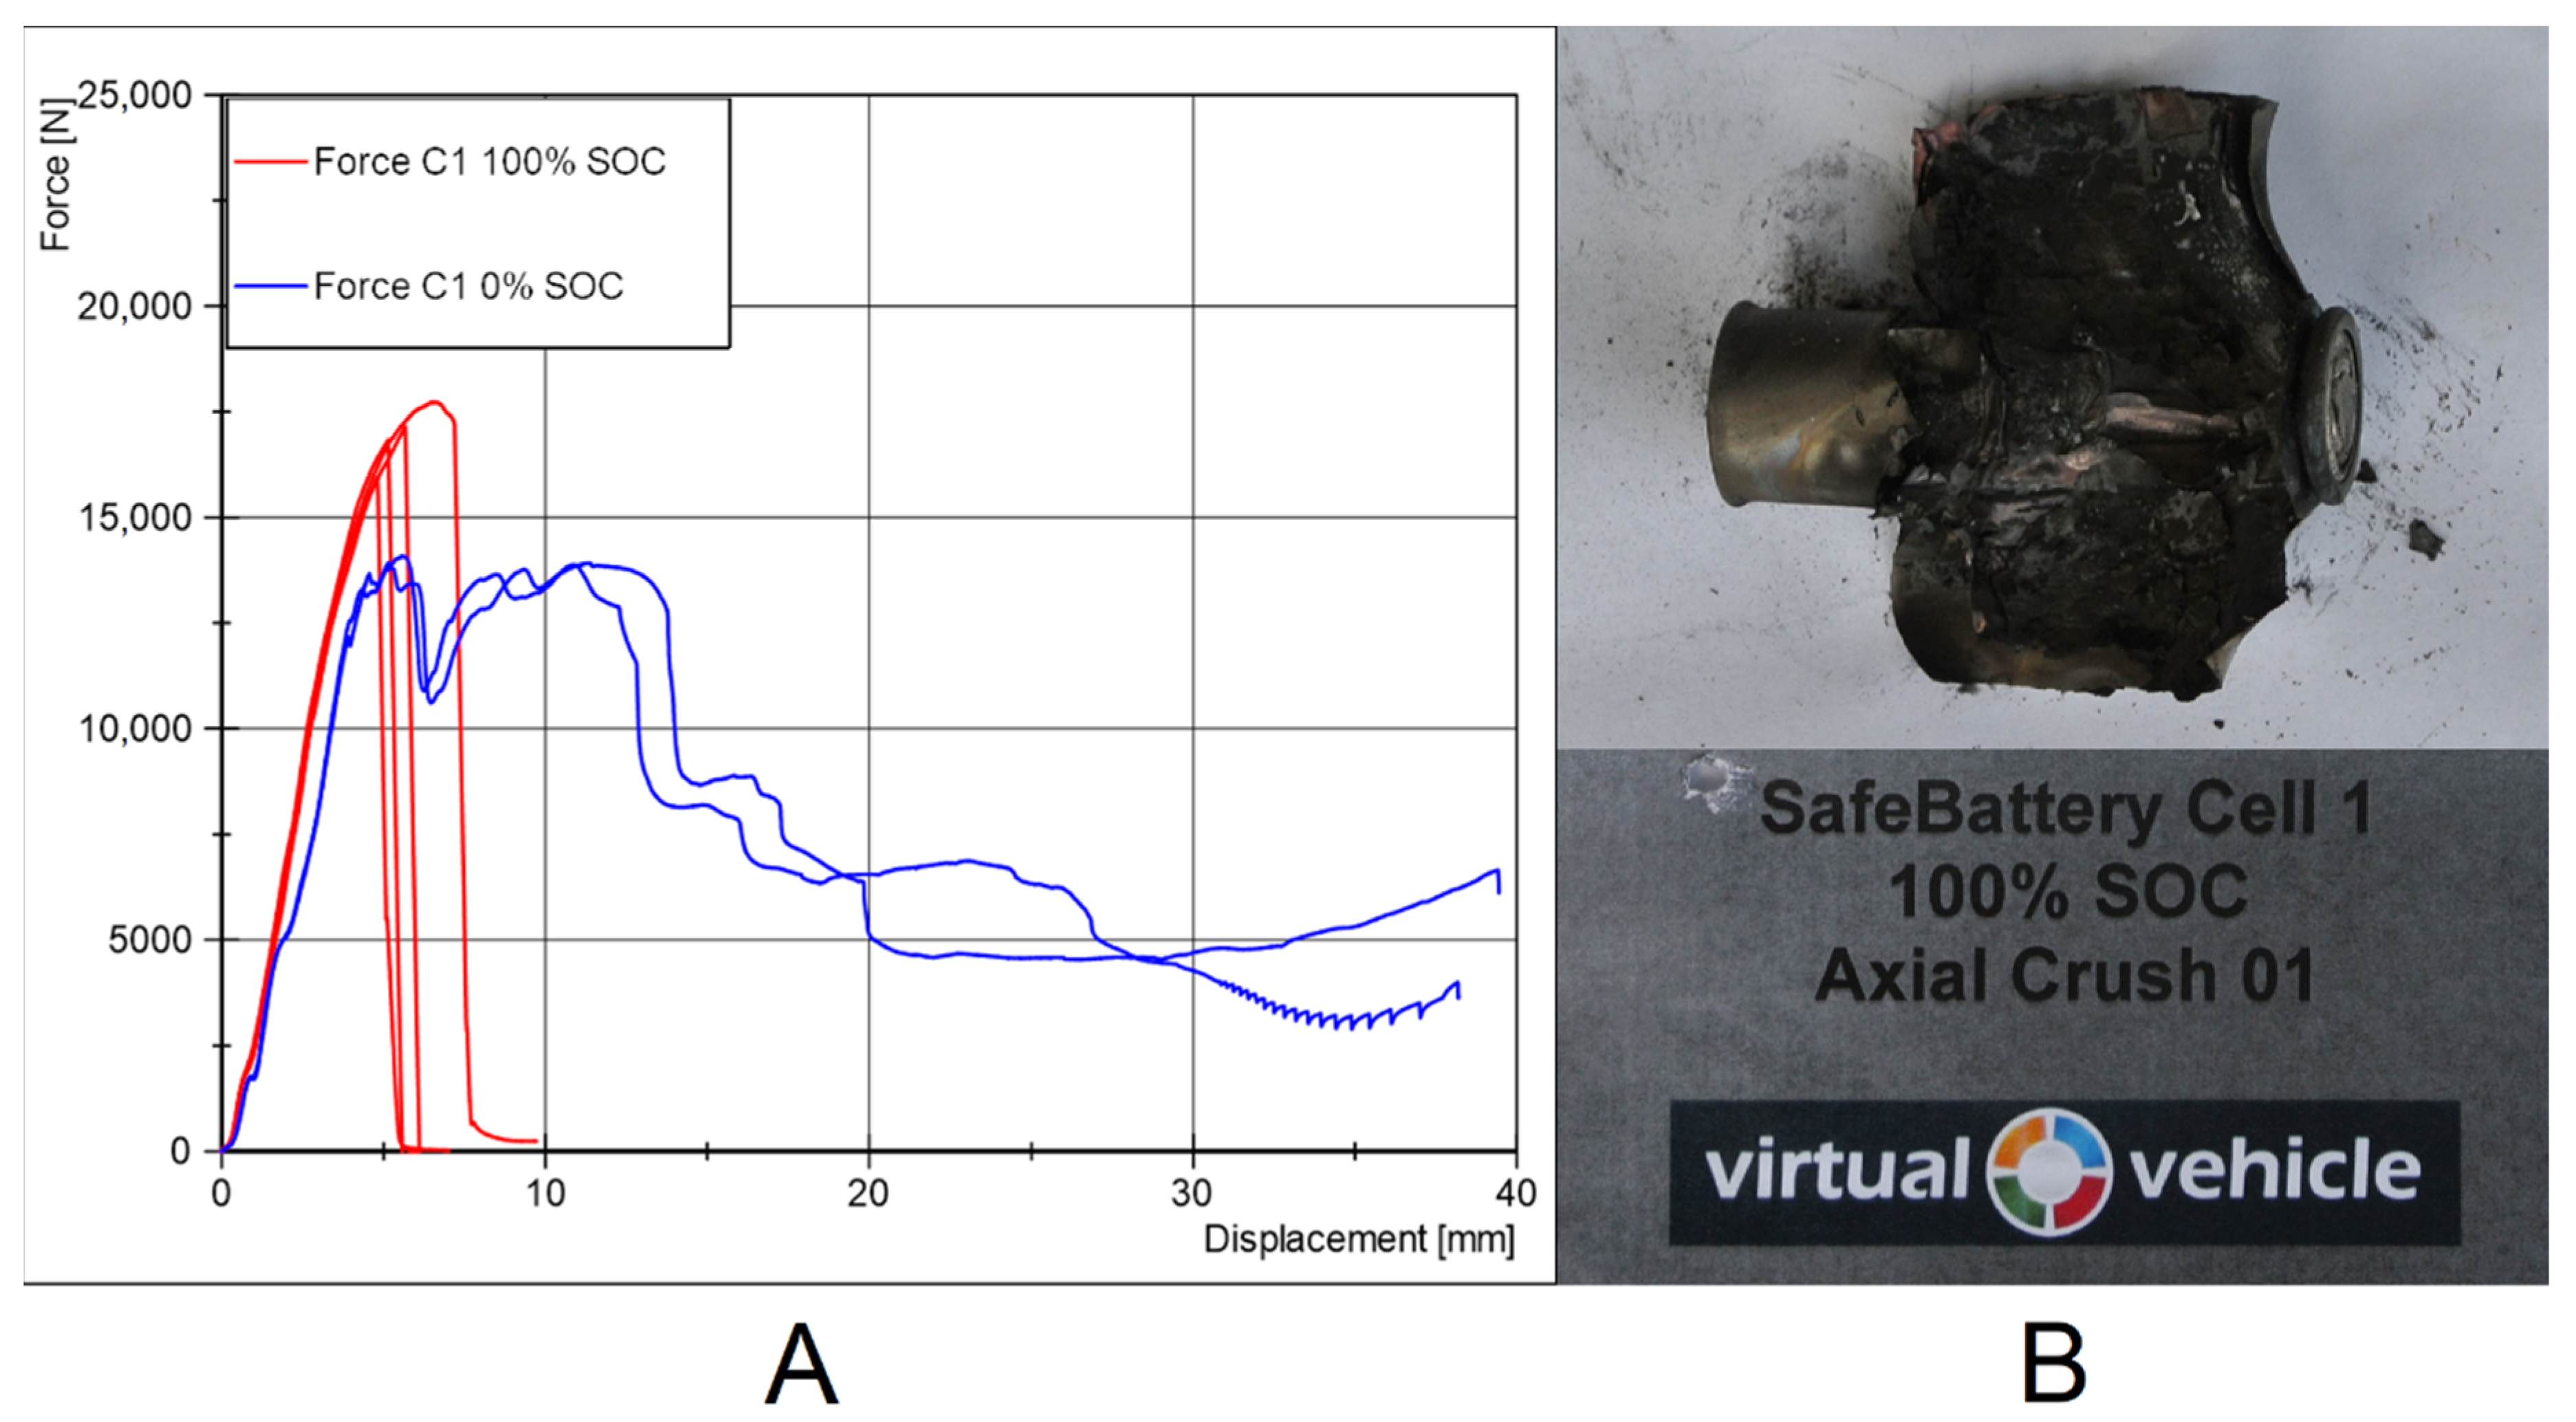
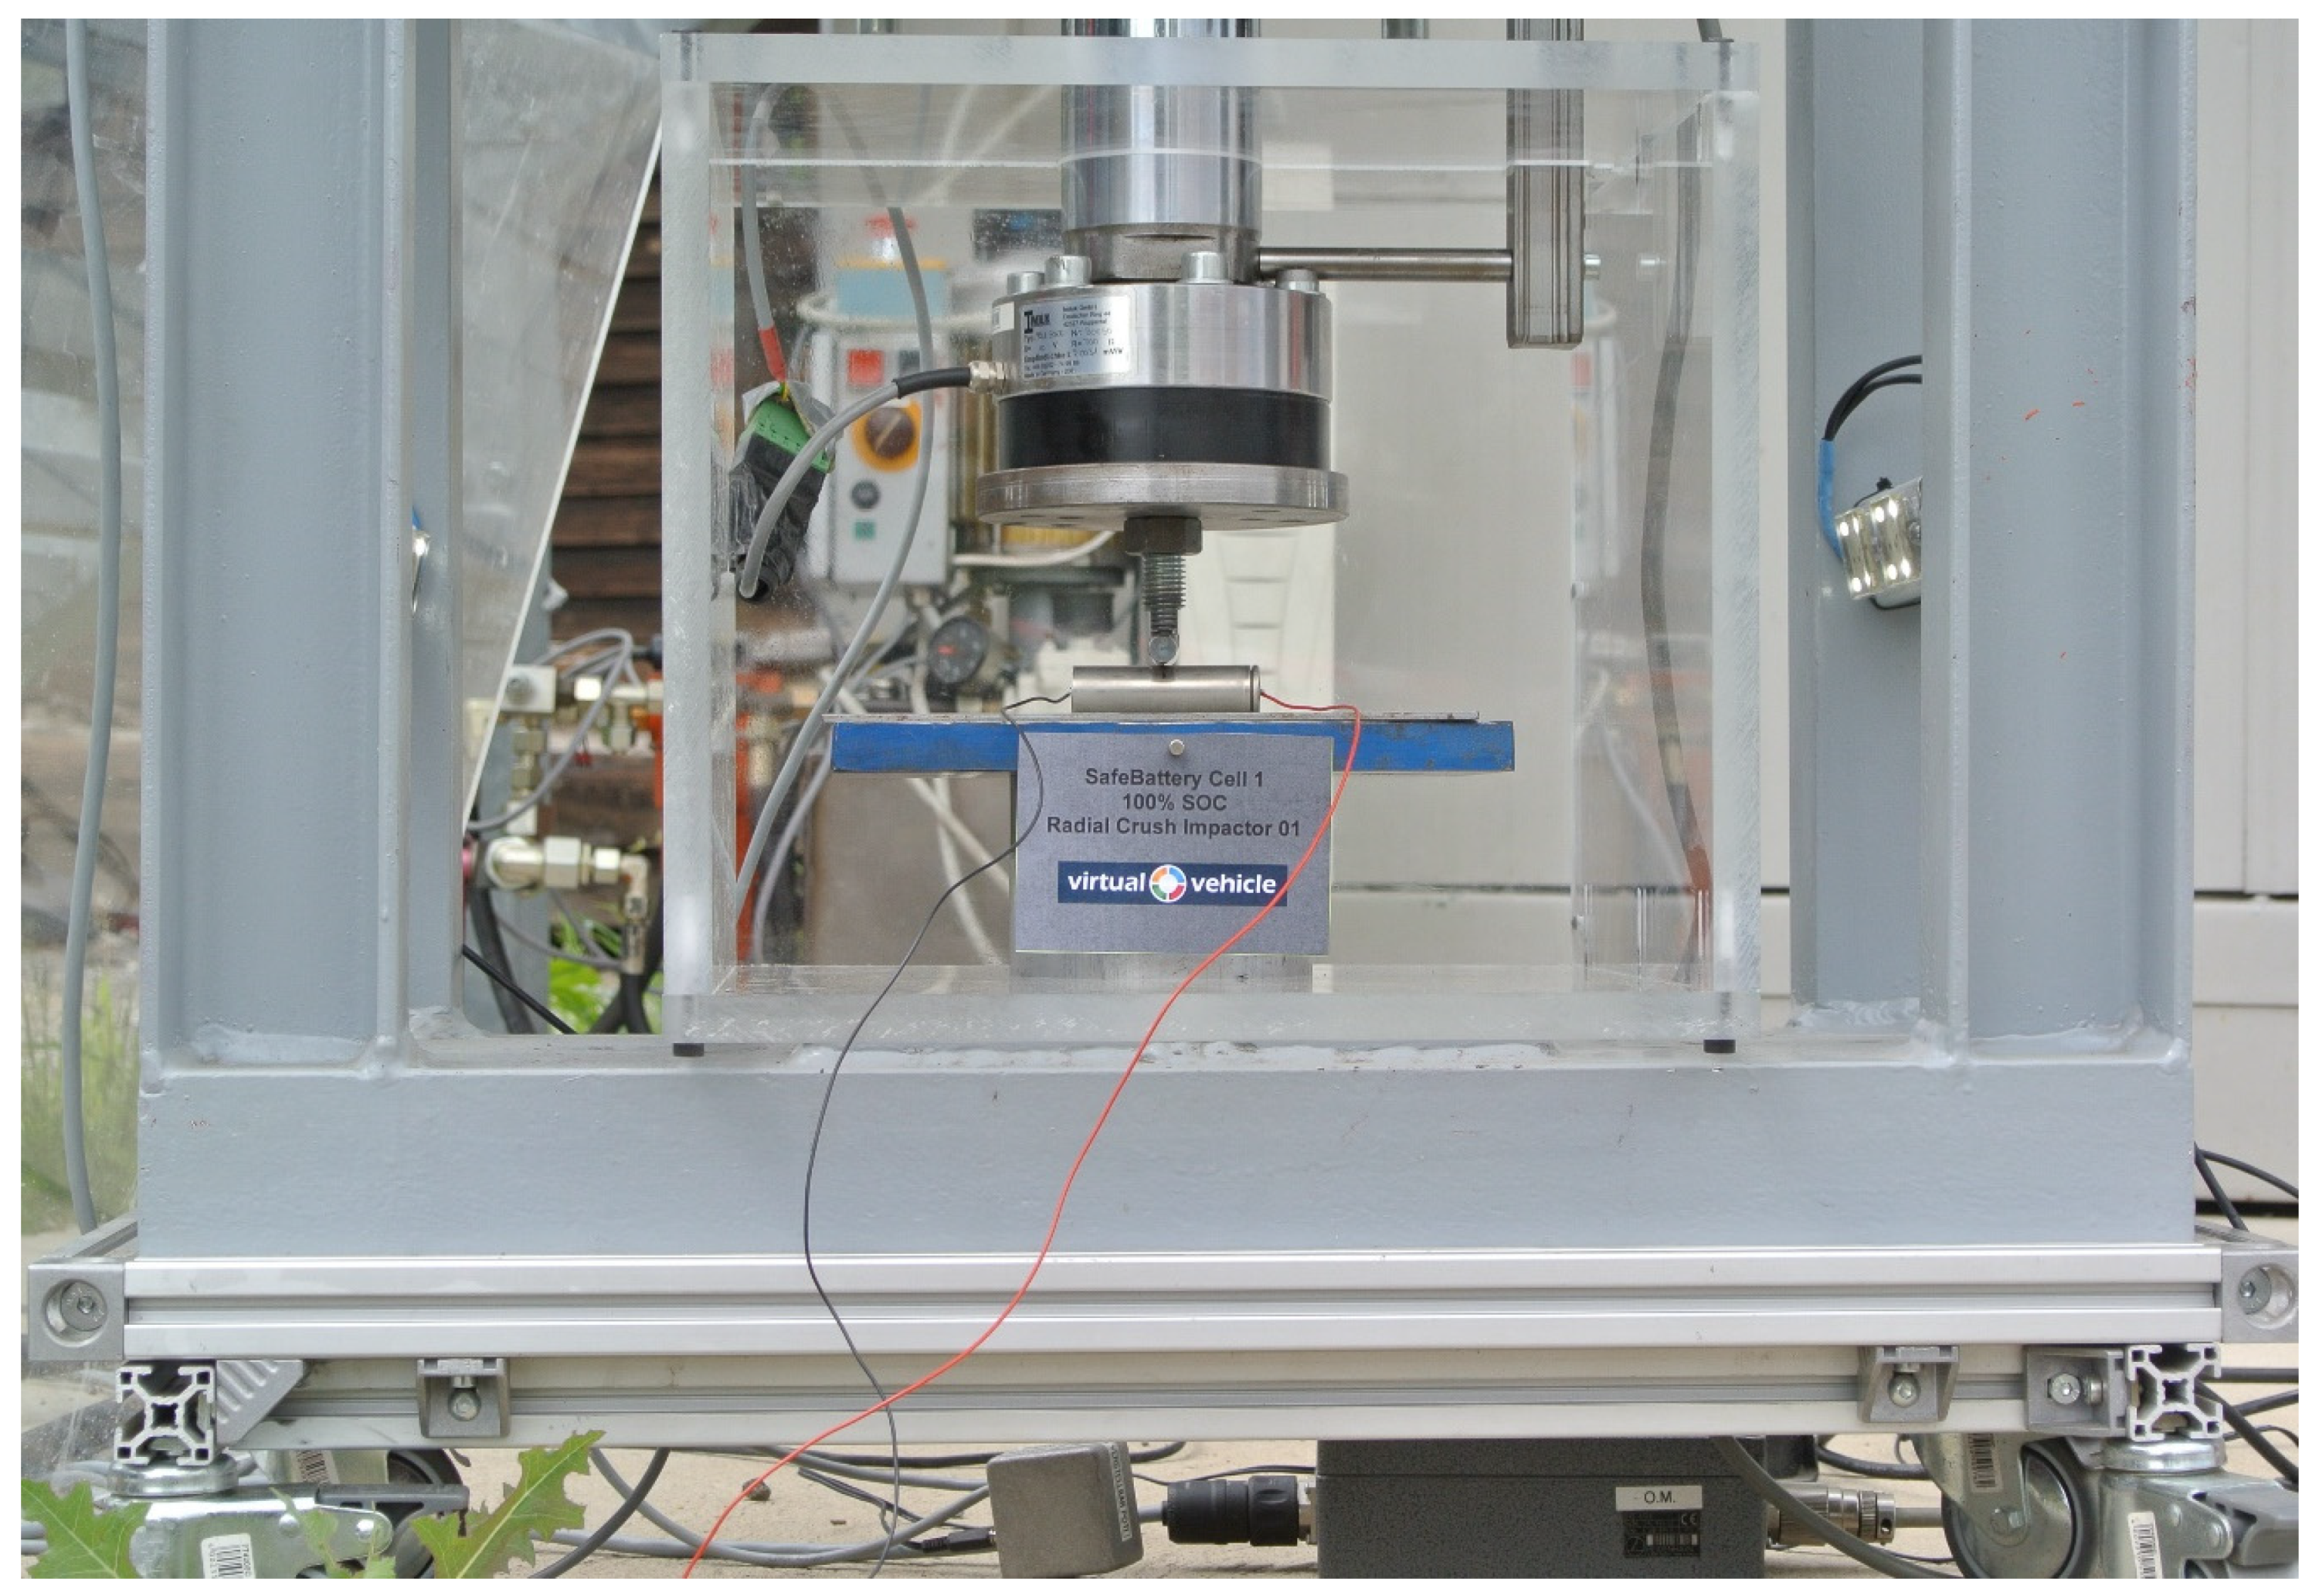
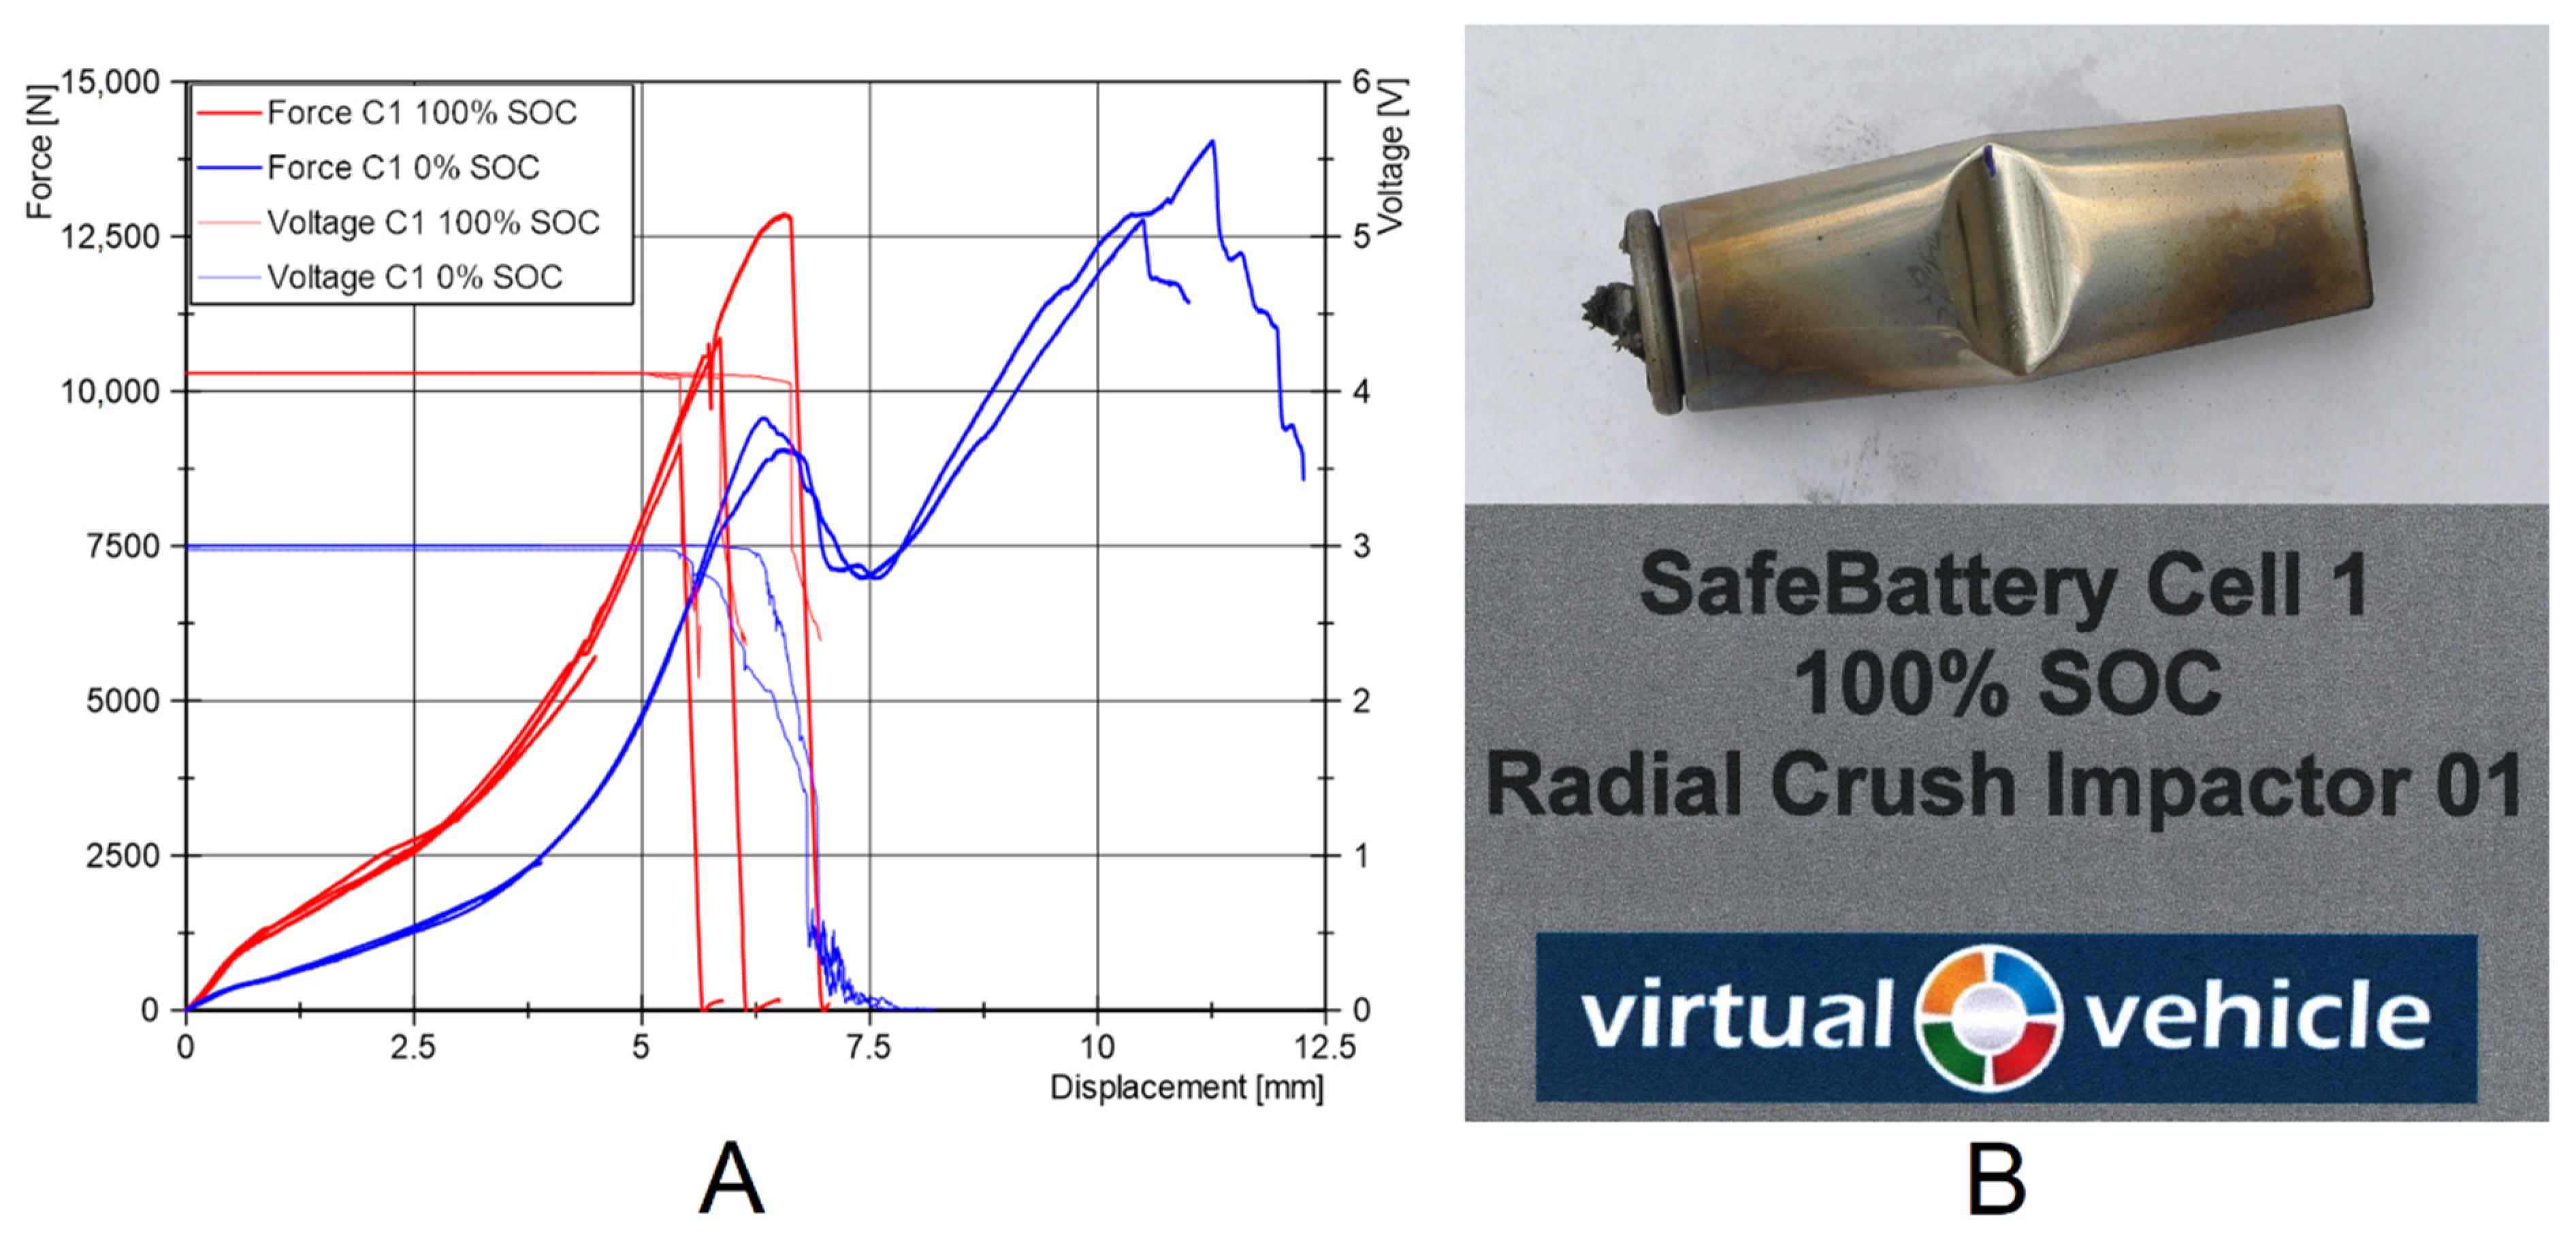
2.2. Cell Testing
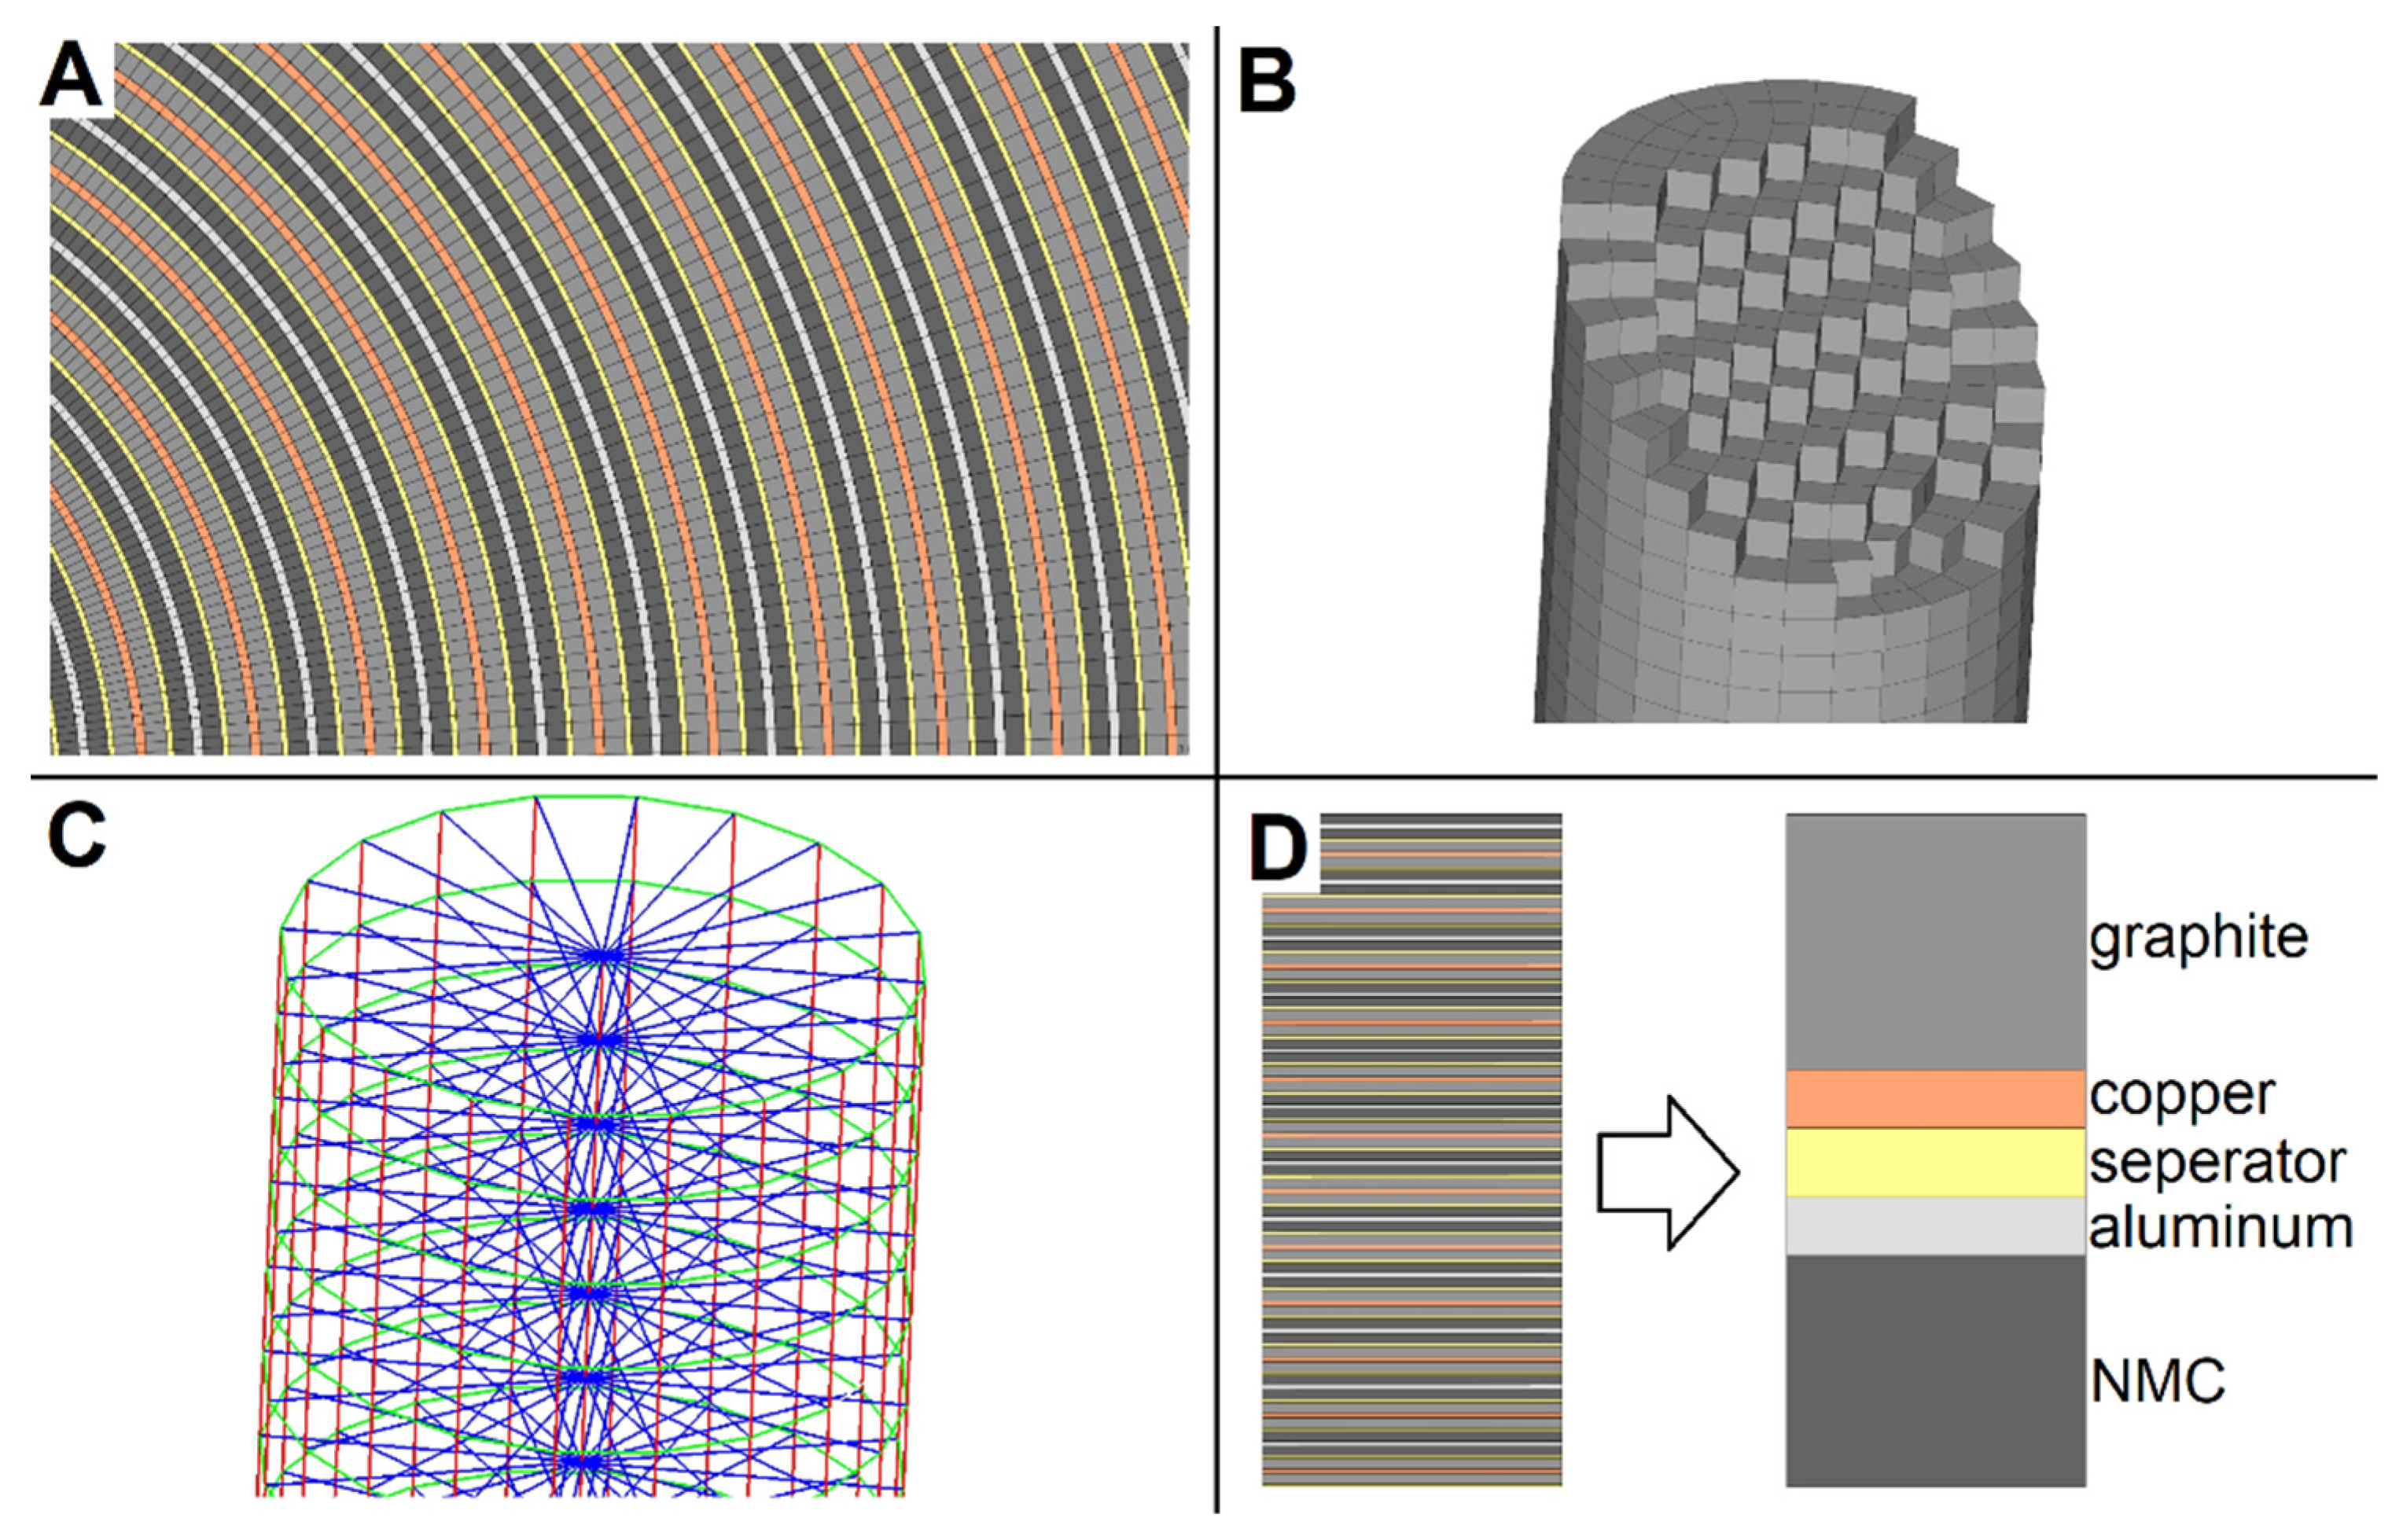
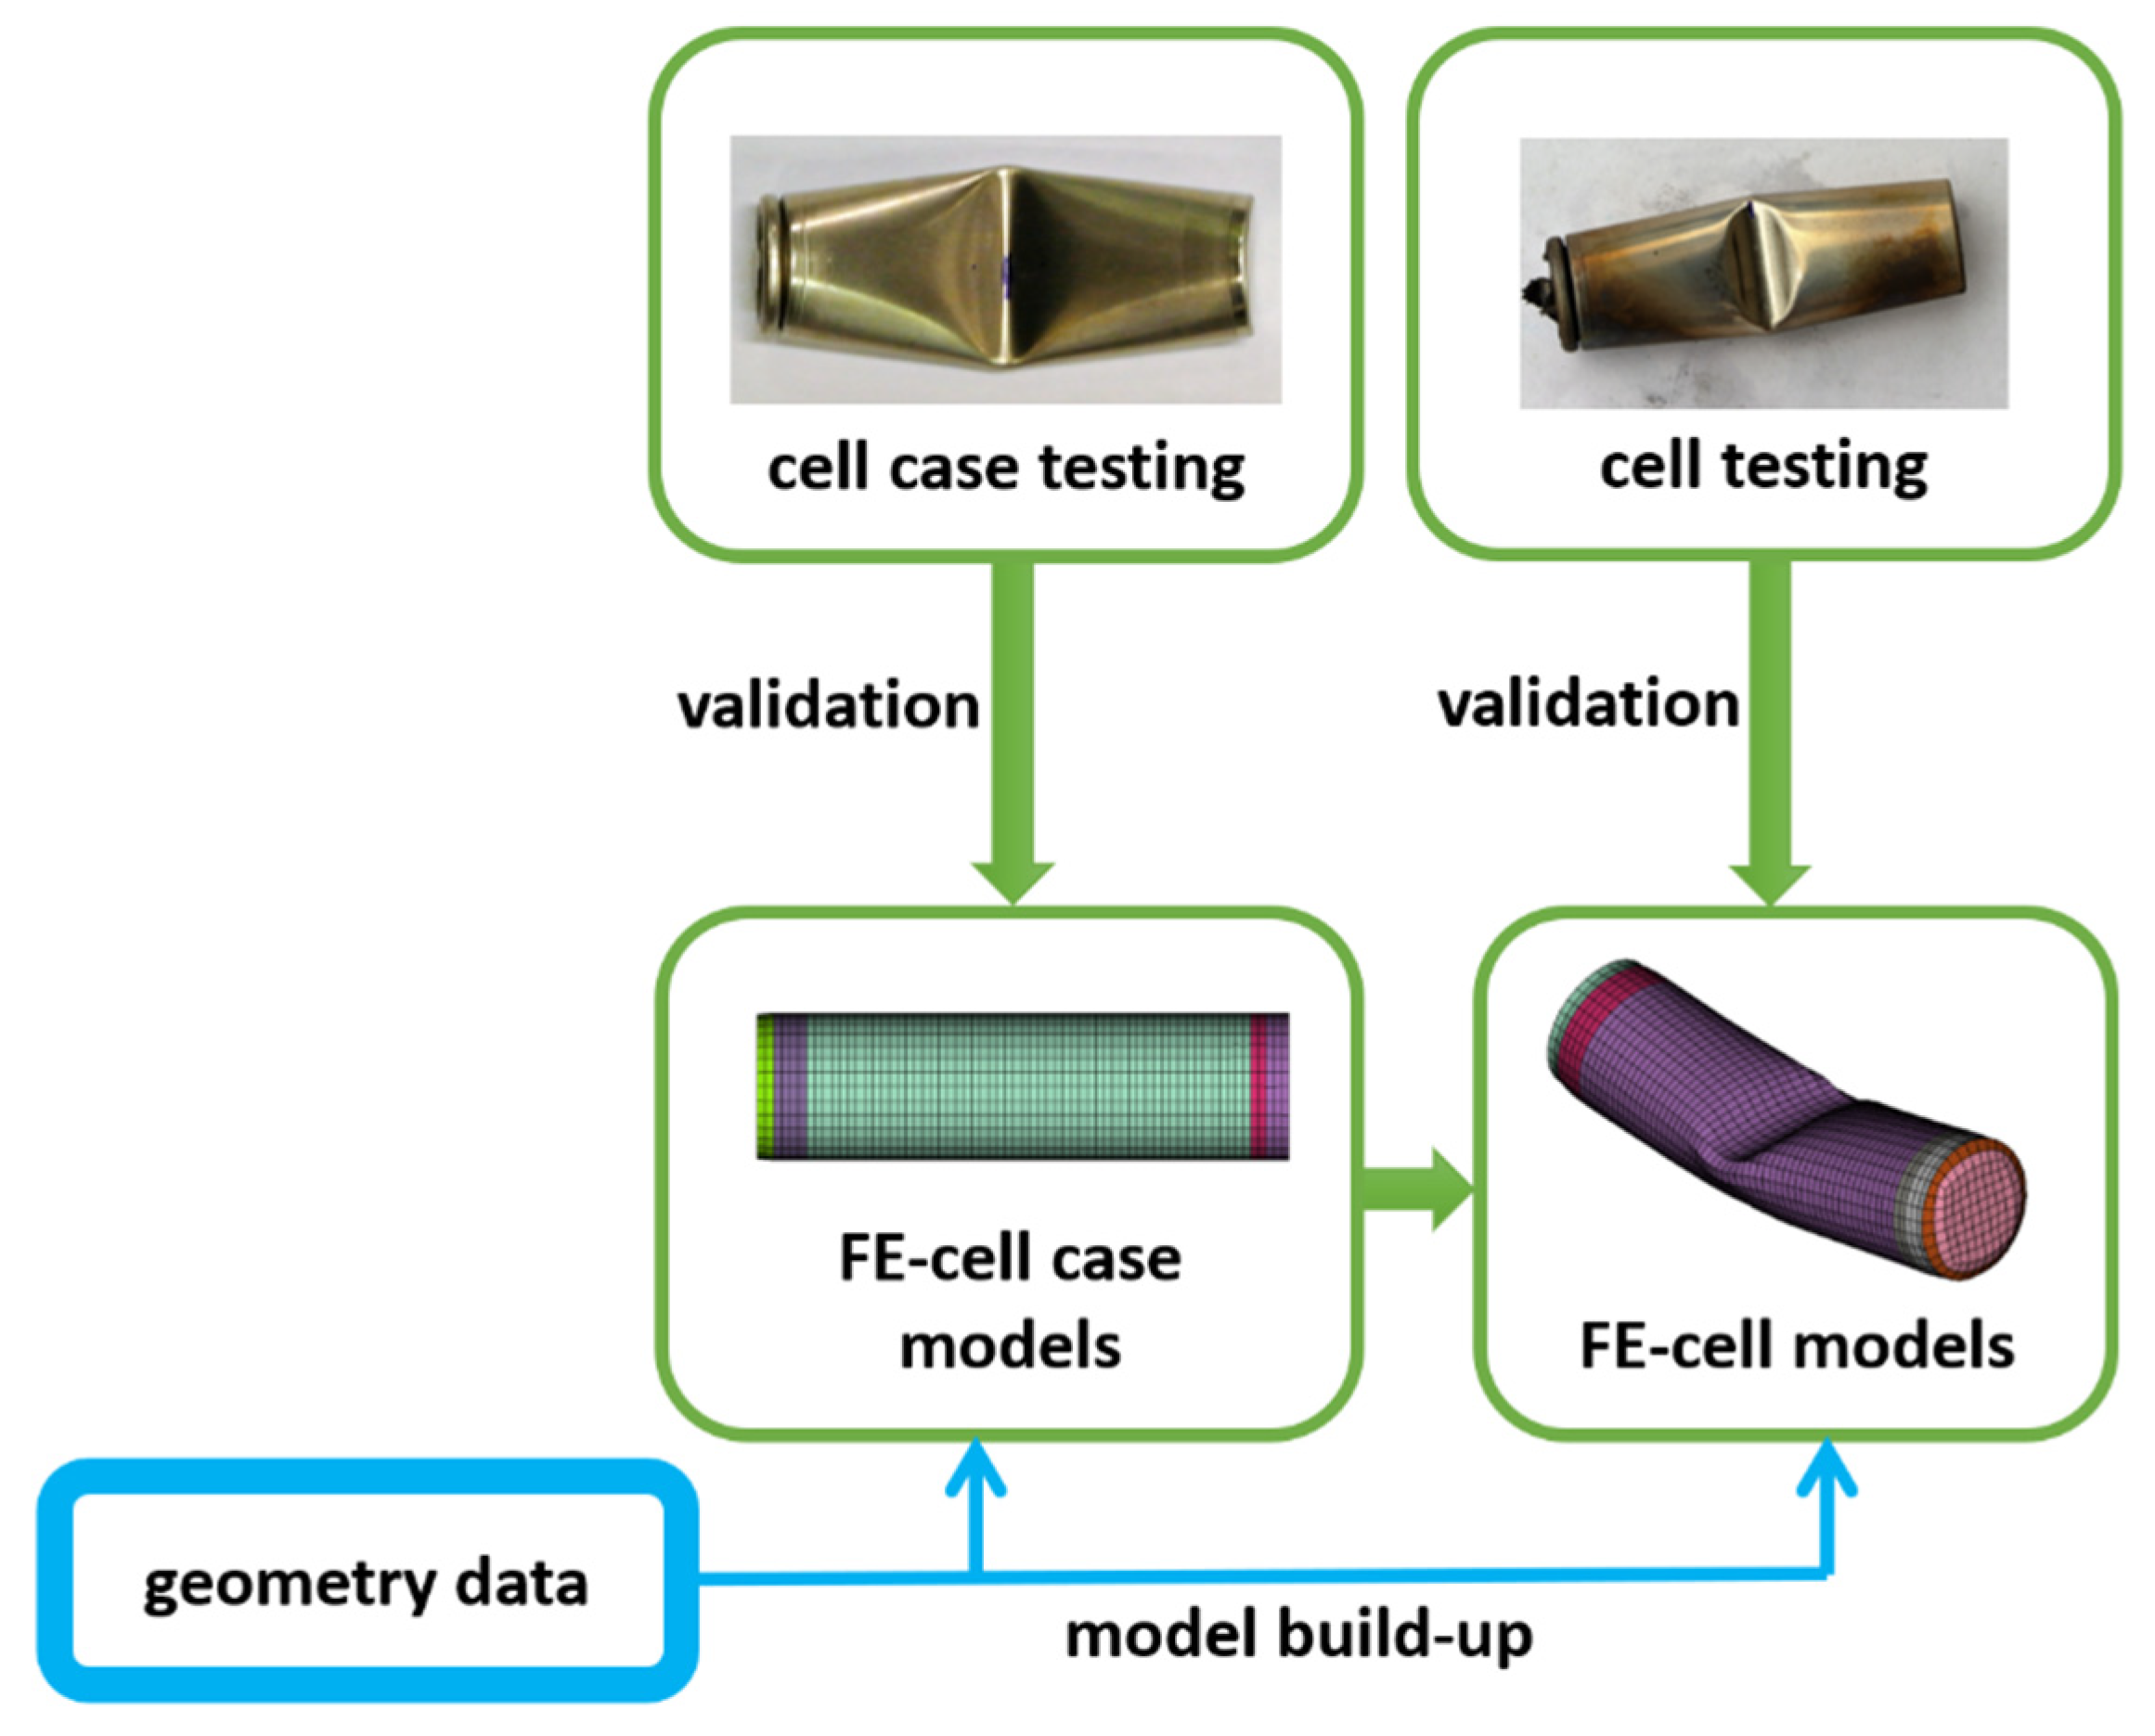
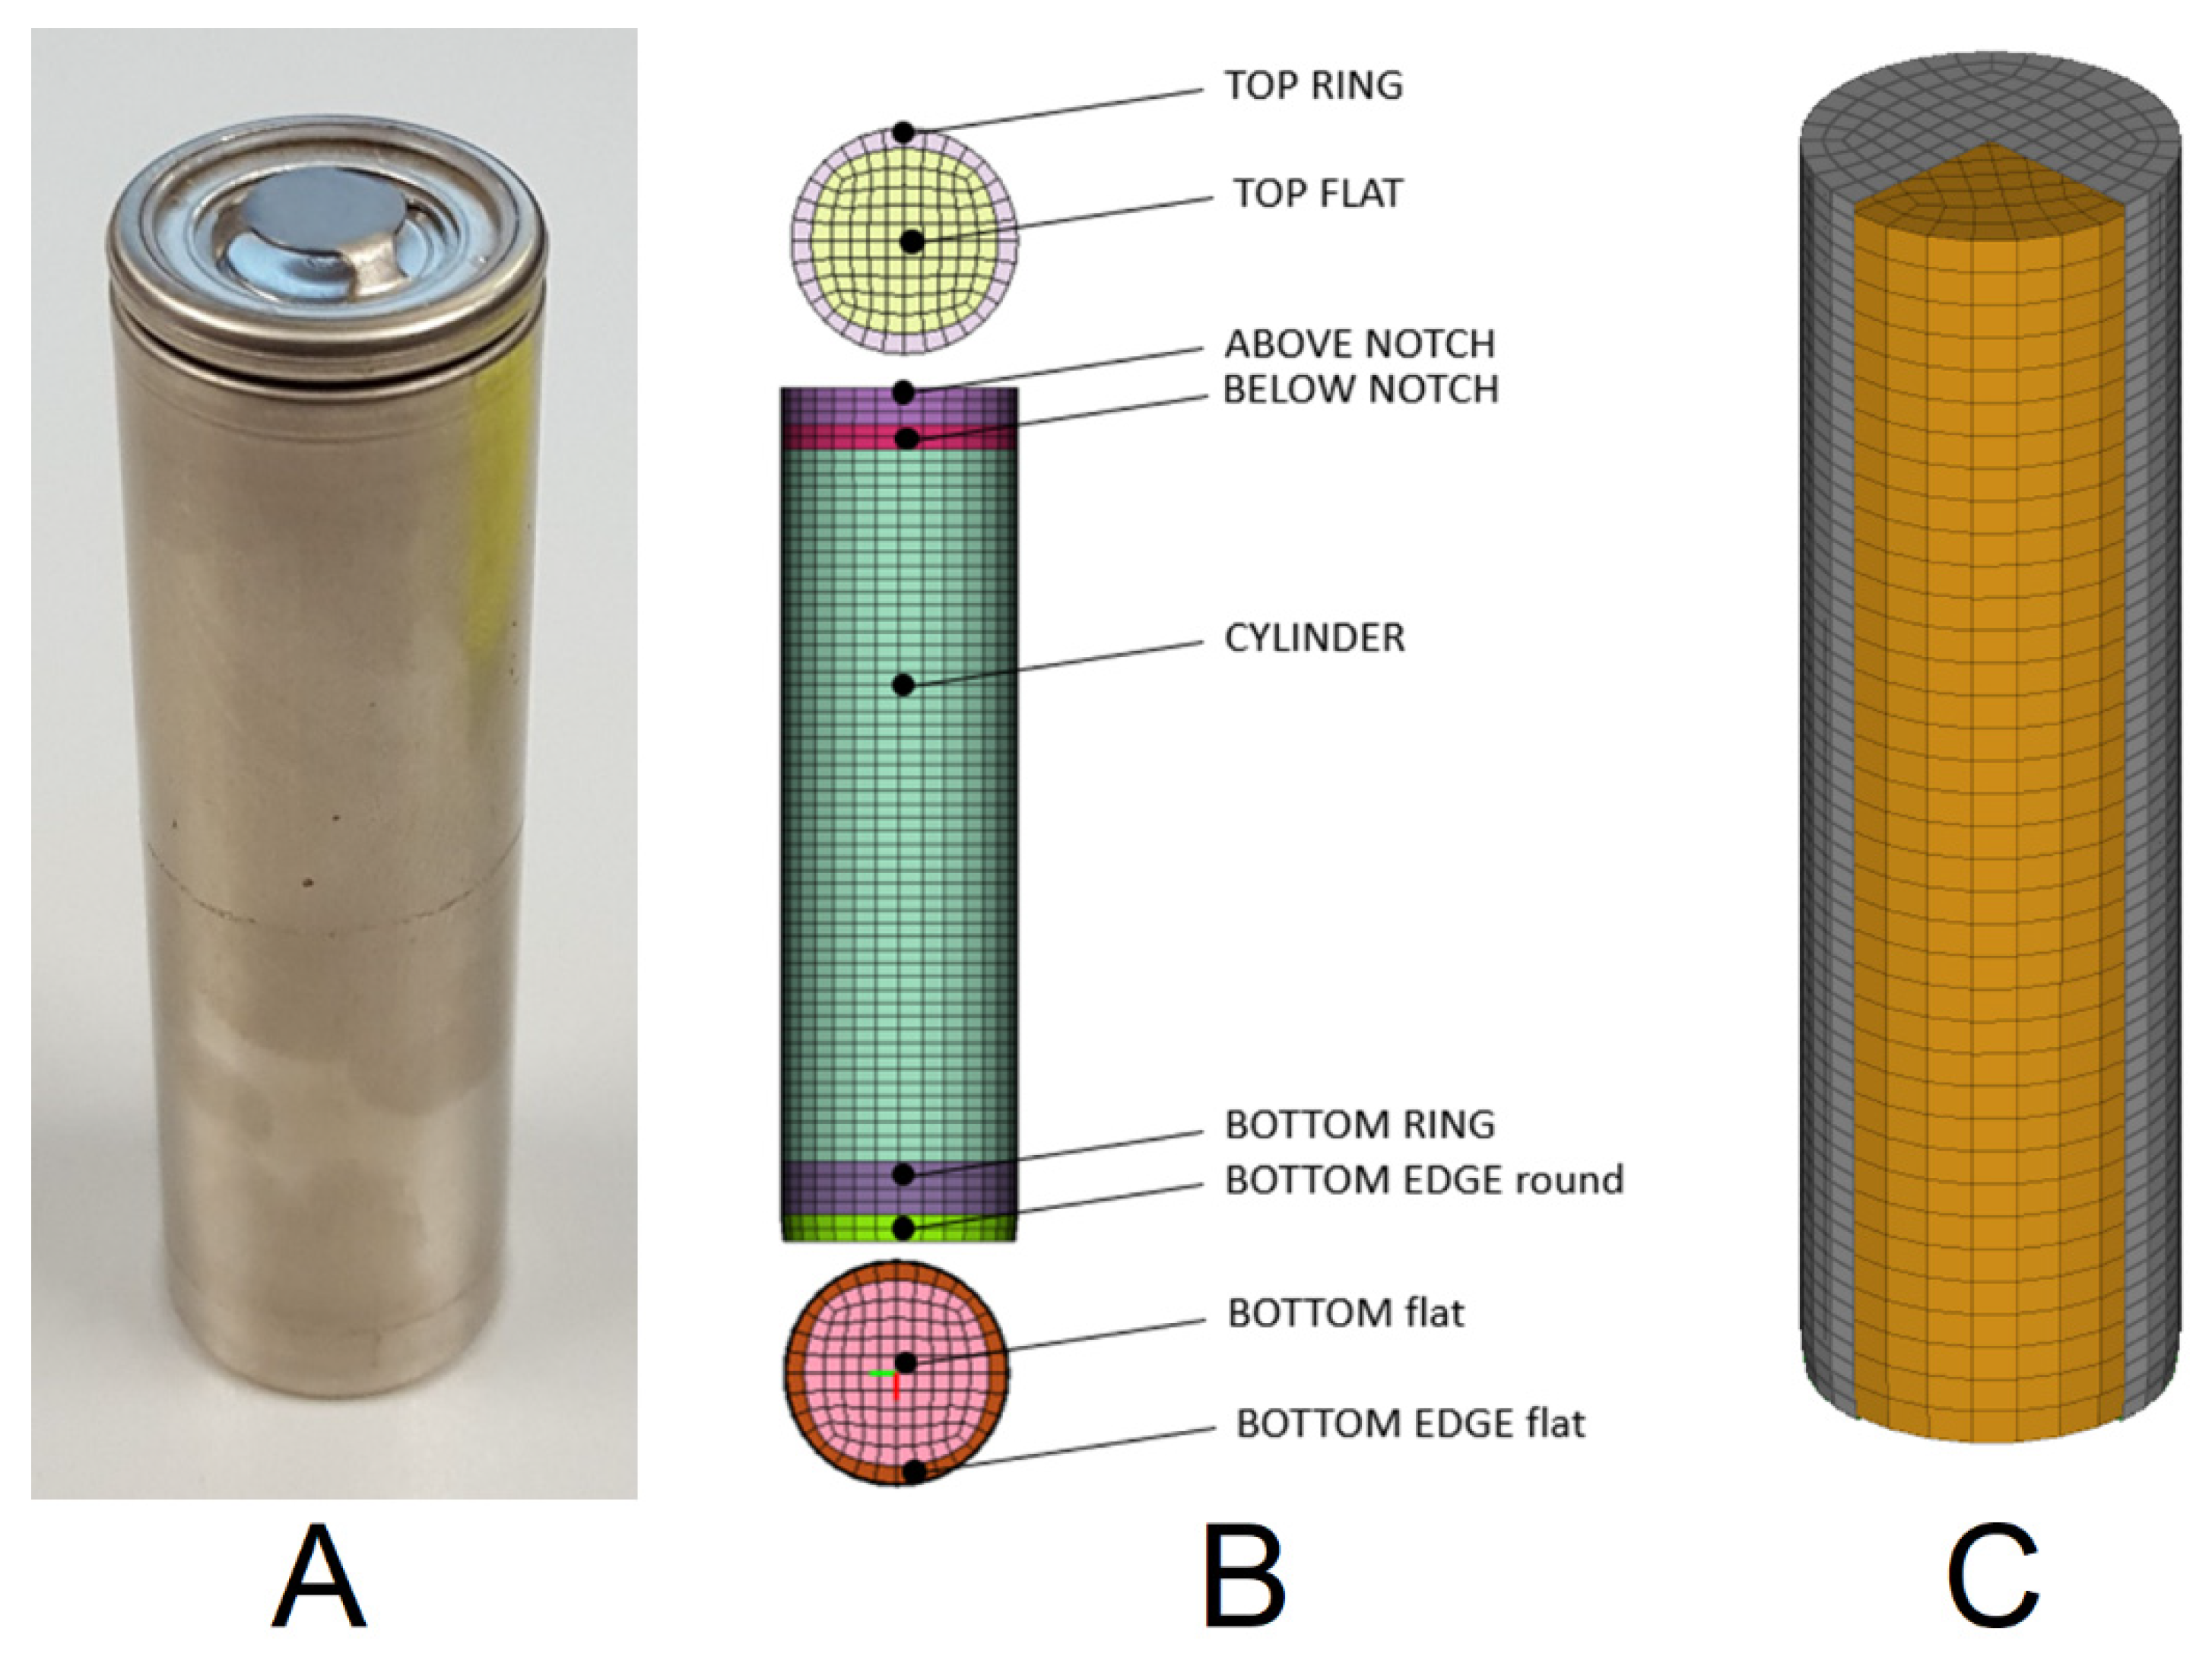
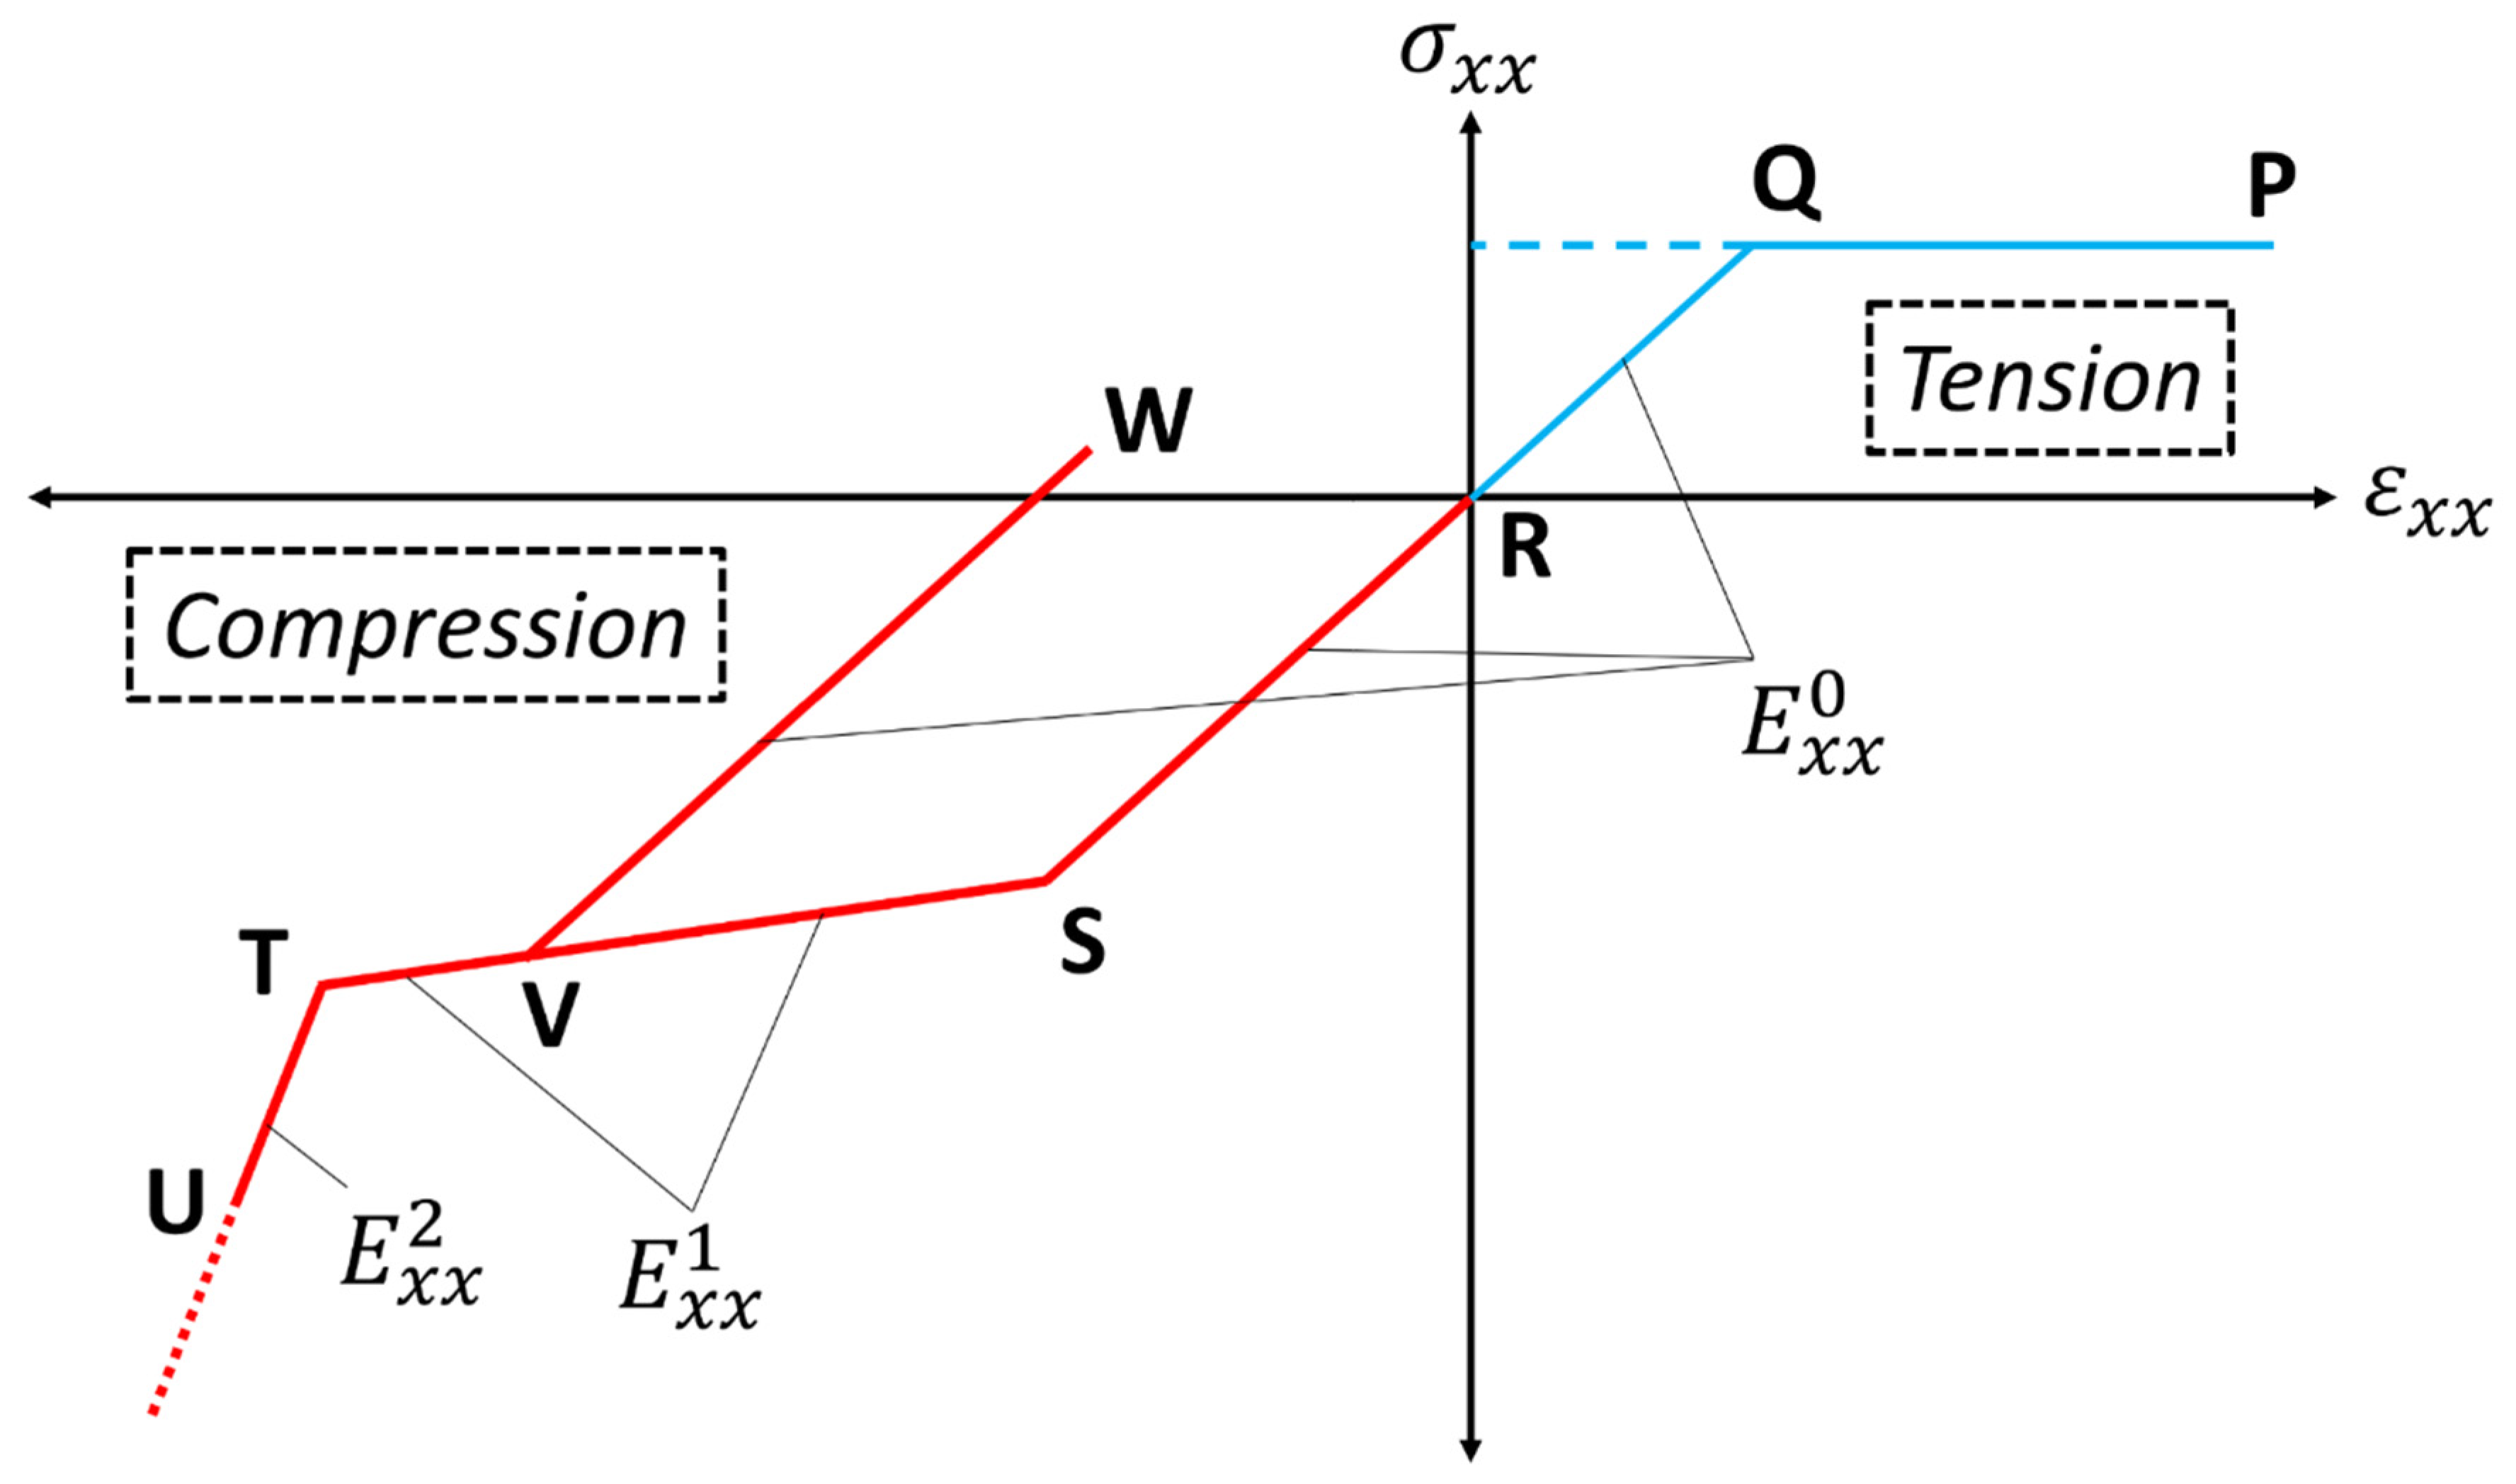
3. Mechanical Modelling of an 18650 Lithium-Ion Battery Cell
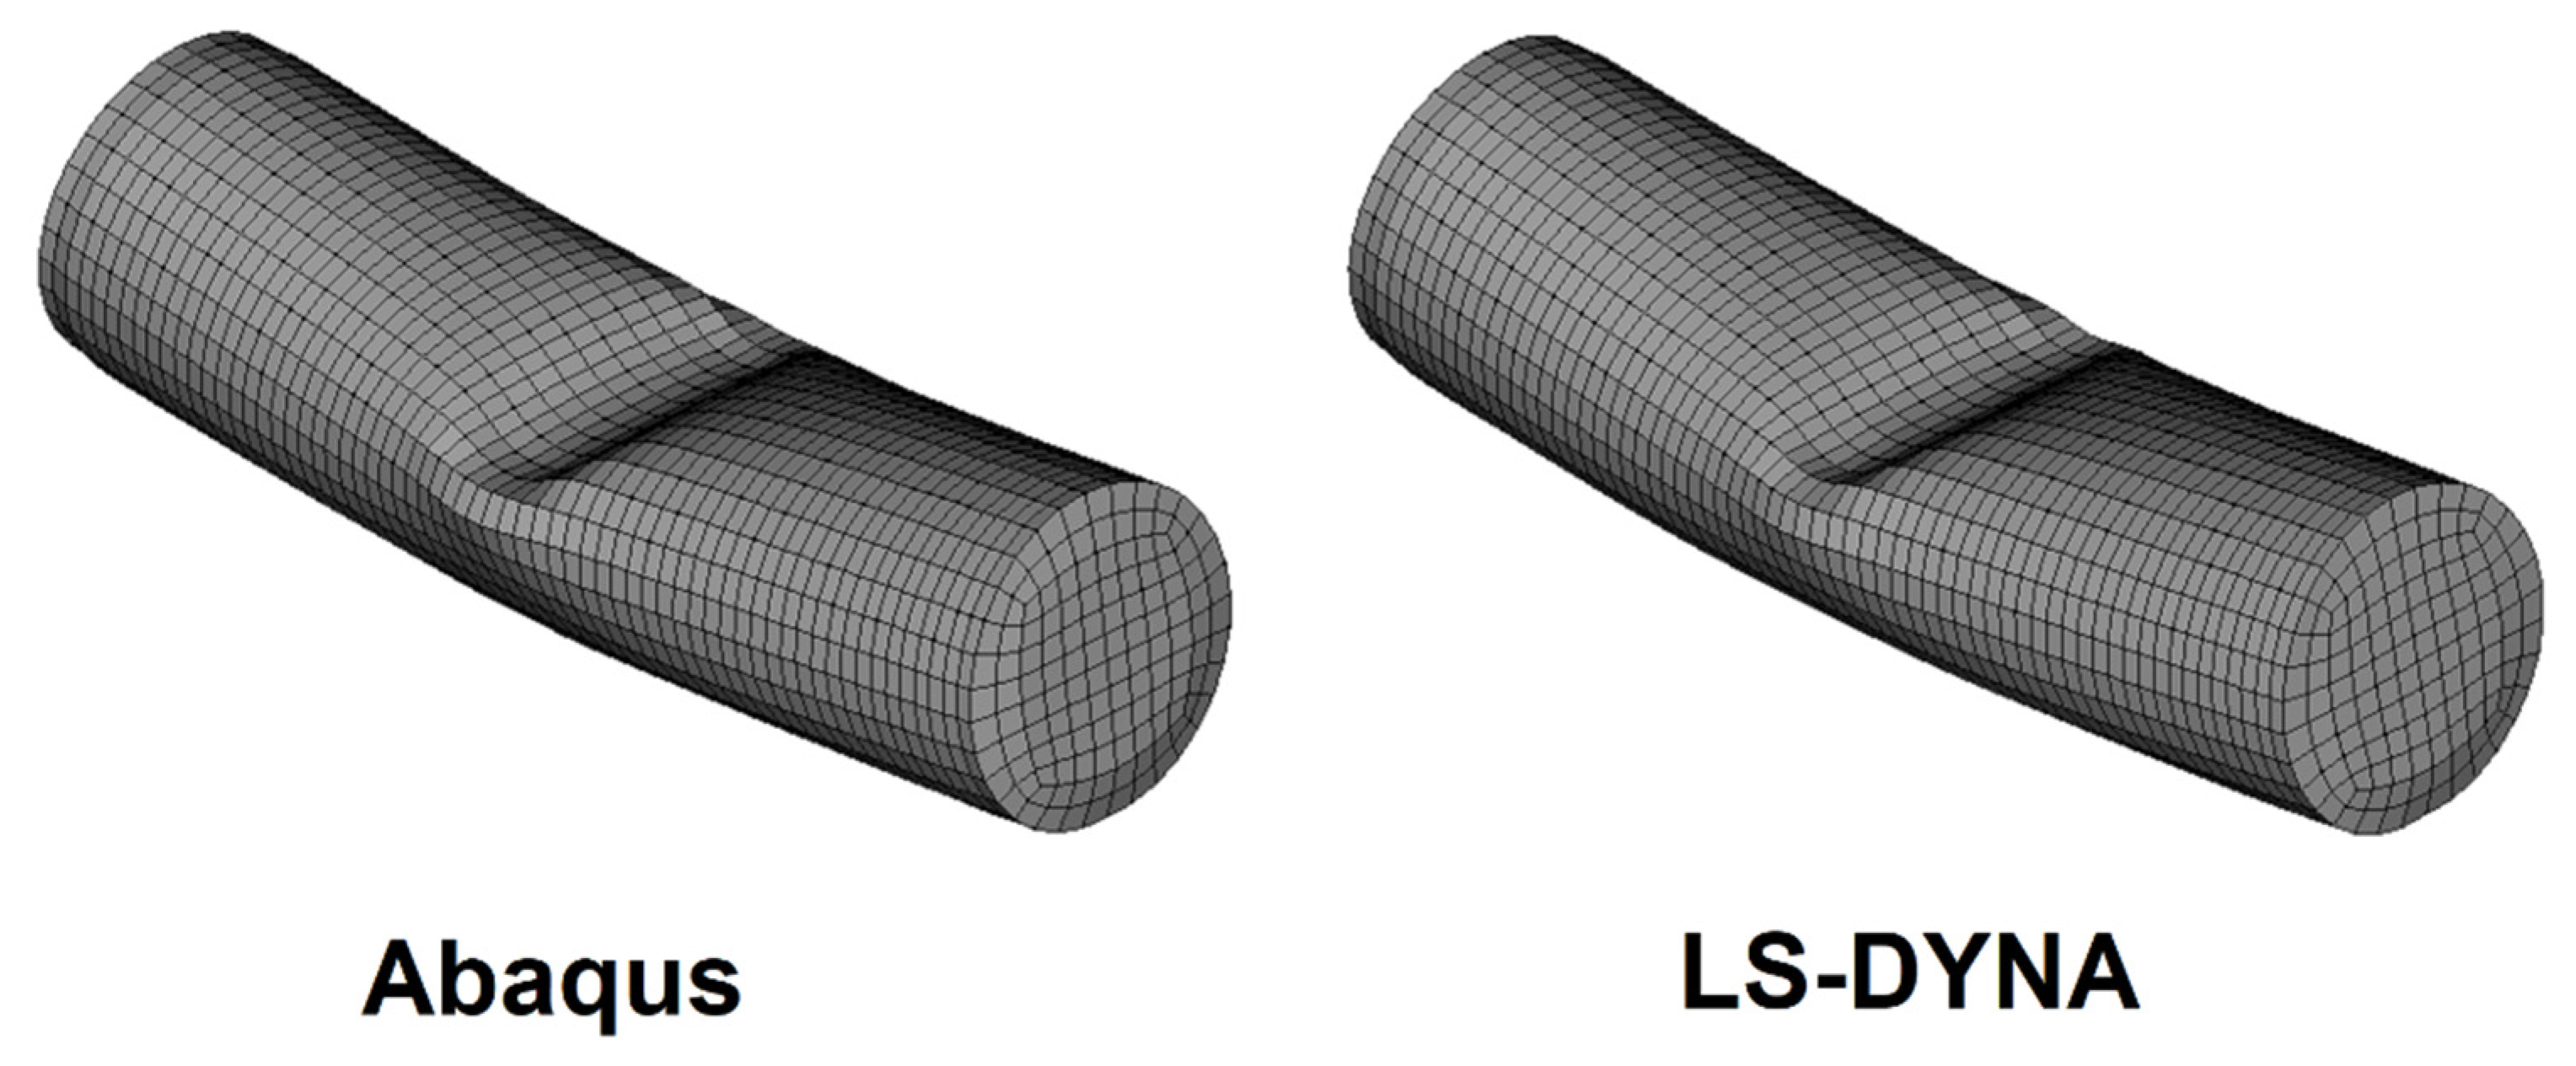
Model Build-Up and Validation
4. Virtual Short Circuit Detection
4.1. Strain Based Short Circuit Criteria
4.2. Stress Based Short-Circuit Criteria
4.3. Geometric Short Circuit Criteria
5. Results
6. Conclusions
Author Contributions
Funding
Acknowledgments
Conflicts of Interest
Appendix A

| Publications | Cell Type | Lateral Indentation Cylindrical Rod | Radial Compression Flat Plates | Indentation Hemispherical Punch | Three-Point Bending | Axial Compression | Others | SOC | FE-Platform | Model Scale | Results |
|---|---|---|---|---|---|---|---|---|---|---|---|
| E. Sahraei et al., 2012 [3] | cylindrical cell 18650 | x | x | x | x | 10% | LS-DYNA | meso-scale | A very good correlation has been obtained between the test results and numerical simulation. | ||
| L. Greve et al., 2012 [10] | cylindrical nickel–cobalt oxide (NCA) cell, (GAIA, HP 602030 NCA-45 Ah/162 Wh) | x | x | x | 0% | virtual performance solution (VPS) | macro-scale | A very good correlation was obtained between the test results and numerical simulation. | |||
| T. Wierzbicki, E. Sahraei 2013 [4] | cylindrical cell 18650 | x | x | 10% | LS-DYNA | RVE | Good agreement between simulation and corresponding tests | ||||
| Y. Xia et al., 2014 [17] | cylindrical cell 18650 | x | -- | LS-DYNA | meso-scale | The jellyroll failure began at about 4–5 mm of displacement. | |||||
| The outer shell developed an axisymmetric fold. No internal failure point in the jellyroll. | |||||||||||
| After 14 mm of deformation, jellyroll elements started to fail, ultimately forming two longitudinal cracks at a 15-mm punch intrusion | |||||||||||
| J. Xu et al., 2015 [11] | cylindrical nickel–cobalt oxide (NCA) cell, (GAIA, HP 602030 NCA-45 Ah/162 Wh) | x | x | x | ABAQUS | meso-scale | A good agreement between experiment and simulation results | ||||
| J. Zhu et al., 2016 [23] | cylindrical cell 18650 | x | 0% | ABAQUS/Explicit | meso-scale | Good agreement between tests and simulation. | |||||
| L. Tang et al., 2017 [24] | cylindrical cell 18650 | x | x | -- | ABAQUS/Explicit | macro-scale | Good agreement between tests and simulation. | ||||
| B. Liu et al., 2018 [12] | cylindrical cell 18650 | x | x | ABAQUS | meso-scale | Good agreement between tests and simulation. | |||||
| W. Wang et al., 2018 [25] | cylindrical cell 18650 | x | x | different SOC | LS-DYNA | meso-scale | Good agreement between tests and simulation. | ||||
| L. Wang et al., 2019 [22] | cylindrical cell 18650 (NCA) | x | x | x | x | 0% | LS-DYNA | meso-scale | Good agreement between tests and simulation. | ||
| M. Sheikh et al., 2020 [26] | cylindrical cell 18650 Samsung 2200 mAh | x | x | x | x | different SOC (0%, 25%, 50% and 75%) | LS-DYNA | meso-scale | The model is capable of capturing cell mechanical response. |
| Publications | Cell Type | Lateral Indentation by a Cylindrical Rod | Radial Compression Flat Plates | Indentation Hemispherical Punch | Three-Point Bending | Axial Compression | Short Circuit Criterion | Results | Remarks |
|---|---|---|---|---|---|---|---|---|---|
| E. Sahraei et al., 2012 [3] | cylindrical cell 18650 | x | x | x | x | force peak | A good correlation between the test and simulation values was obtained | For each load case the output voltage, force, displacement, and temperature versus time were recorded. | |
| L. Greve et al., 2012 [10] | cylindrical nickel–cobalt oxide (NCA) cell, (GAIA, HP 602030 NCA-45 Ah/162 Wh) | x | x | x | stress state-based criteria | SC predictions were in good agreement with the experimental observations | |||
| T. Wierzbicki, E. Sahraei 2013 [4] | cylindrical cell 18650 | x | x | SC prediction based on the drop of voltage which coincides with the drop of force | A good correlation between the test and simulation values was obtained | ||||
| J. Xu et al., 2015 [11] | cylindrical nickel–cobalt oxide (NCA) cell, (GAIA, HP 602030 NCA-45 Ah/162 Wh) | x | x | x | unified strength theory (UST) | A good correlation between the test and simulation values was obtained | |||
| J. Zhu et al., 2016 [23] | cylindrical cell 18650 | x | The cause of SC during axial compression was clarified based on the understanding and analysis of the mechanical behaviour. | A good agreement between tests and simulation. | |||||
| M. Raffler et al., 2017 [5] | cylindrical cell 18650 | x | x | x | global radial deformation of the cell model | A good correlation between the short circuit deformation of the cell and the strain values of the simulation model for the different load cases was found. | |||
| global axial deformation of the positive pole of the cell model | |||||||||
| B. Liu et al., 2018 [12] | cylindrical cell 18650 | x | x | equivalent plastic strain | A good agreement between simulation and experimental results. | ||||
| L. Wang et al., 2019 [22] | cylindrical cell 18650 (NCA) | x | x | x | stress state-based criteria | Suitable for the four loading conditions | Suitable for predicting minor and major internal short circuits | ||
| strain state-based criteria | Good prediction of the SC except for minor SC-behaviour in bending case. | Only suitable for major internal short circuits | |||||||
| M. Sheikh et al., 2020 [26] | cylindrical cell 18650 Samsung 2200 mAh | x | x | x | displacement at SC, mean temperature at SC and mean maximum temperature-change criterion | The simulation shows that quasi-static loading is suitable to predict SC. |
Appendix B


References
- Reddy, M.V.; Mauger, A.; Julien, C.M.; Paolella, A.; Zaghib, K. Brief History of Early Lithium-Battery Development. Materials 2020, 13, 1884. [Google Scholar] [CrossRef] [Green Version]
- Reddy, M.V.; Subba Rao, G.V.S.; Chowdari, B.V.R. Metal Oxides and Oxysalts as Anode Materials for Li Ion Batteries. Chem. Rev. 2013, 113, 5364–5457. [Google Scholar] [CrossRef] [PubMed]
- Sahraei, E.; Campbell, J.; Wierzbicki, T. Modeling and short circuit detection of 18650 Li-ion cells under mechanical abuse conditions. J. Power Sources 2012, 220, 360–372. [Google Scholar] [CrossRef]
- Wierzbicki, T.; Sahraei, E. Homogenized mechanical properties for the jellyroll of cylindrical Lithium-ion cells. J. Power Sources 2013, 241, 467–476. [Google Scholar] [CrossRef]
- Raffler, M.; Sevarin, A.; Ellersdorfer, C.; Heindl, S.F.; Breitfuss, C.; Sinz, W. Finite element model approach of a cylindrical lithium ion battery cell with a focus on minimization of the computational effort and short circuit prediction. J. Power Sources 2017, 360, 605–617. [Google Scholar] [CrossRef]
- Zhang, C.; Santhanagopalan, S.; Sprague, M.A.; Pesaran, A.A. A representative-sandwich model for simultaneously coupled mechanical-electrical-thermal simulation of a lithium-ion cell under quasi-static indentation tests. J. Power Sources 2015, 298, 309–321. [Google Scholar] [CrossRef] [Green Version]
- Santhanagopalan, S.; Ramadass, P.; Zhang, J. Analysis of internal short-circuit in a lithium ion cell. J. Power Sources 2009, 194, 550–557. [Google Scholar] [CrossRef]
- Keyser, M.; Kim, G.-H.; Pesaran, A.A. Numerical and experimental investigation of internal short circuits in a Li-ion cell. In DOE Vehicle Technologies Program Review; National Renewable Energy Laboratory: Golden, CO, USA, 2011. [Google Scholar]
- Orendorff, C.J. The Role of Separators in Lithium-Ion Cell Safety. Electrochem. Soc. Interface 2012, 21, 61–65. [Google Scholar] [CrossRef]
- Greve, L.; Fehrenbach, C. Mechanical testing and macro-mechanical finite element simulation of the deformation, fracture, and short circuit initiation of cylindrical Lithium ion battery cells. J. Power Sources 2012, 214, 377–385. [Google Scholar] [CrossRef]
- Xu, J.; Liu, B.; Wang, L.; Shang, S. Dynamic mechanical integrity of cylindrical lithium-ion battery cell upon crushing. Eng. Fail. Anal. 2015, 53, 97–110. [Google Scholar] [CrossRef]
- Liu, B.; Zhang, J.; Zhang, C.; Xu, J. Mechanical integrity of 18650 lithium-ion battery module: Packing density and packing mode. Eng. Fail. Anal. 2018, 91, 315–326. [Google Scholar] [CrossRef] [Green Version]
- Ellersdorfer, C. Abbildung und Bewertung des Crashverhaltens von lithiumbasierten Batterien für Elektrisch Betriebene Motorräder. Ph.D. Thesis, Graz University of Technology, Graz, Austria, 2016. [Google Scholar]
- Li, Z.; Chen, J.; Lan, F.; Li, Y. Constitutive Behavior and Mechanical Failure of Internal Configuration in Prismatic Lithium-Ion Batteries under Mechanical Loading. Energies 2021, 14, 1219. [Google Scholar] [CrossRef]
- Ratner, A.; Beaumont, R.; Masters, I. Dynamic Mechanical Compression Impulse of Lithium-Ion Pouch Cells. Energies 2020, 13, 2105. [Google Scholar] [CrossRef]
- Lian, J.; Koch, M.; Li, W.; Wierzbicki, T.; Zhu, J. Mechanical Deformation of Lithium-Ion Pouch Cells under in-plane Loads—Part II: Computational Modeling. J. Electrochem. Soc. 2020, 167, 090556. [Google Scholar] [CrossRef]
- Xia, Y.; Wierzbicki, T.; Sahraei, E.; Zhang, X. Damage of cells and battery packs due to ground impact. J. Power Sources 2014, 267, 78–97. [Google Scholar] [CrossRef]
- Breitfuss, C.; Sinz, W.; Feist, F.; Gstrein, G.; Lichtenegger, B.; Knauder, C.; Ellersdorfer, C.; Moser, J.; Steffan, H.; Stadler, M.; et al. A ‘Microscopic’ Structural Mechanics FE Model of a Lithium-Ion Pouch Cell for Quasi-Static Load Cases. SAE Int. J. Passeng. Cars-Mech. Syst. 2013, 6, 1044–1054. [Google Scholar] [CrossRef]
- Smith, M. ABAQUS/Standard User’s Manual, Version 6.9; Dassault Systèmes Simulia Corp.: Providence, RI, USA, 2009. [Google Scholar]
- LS-Dyna Volume II Materials—LS-DYNA_Manual_Volume_II_R9.0.pdf. Available online: https://ftp.lstc.com/anonymous/outgoing/jday/manuals/LS-DYNA_Manual_Volume_II_R9.0.pdf (accessed on 16 November 2021).
- Xu, J.; Liu, B.; Wang, X.; Hu, D. Computational model of 18650 lithium-ion battery with coupled strain rate and SOC dependencies. Appl. Energy 2016, 172, 180–189. [Google Scholar] [CrossRef] [Green Version]
- Wang, L.; Yin, S.; Xu, J. A detailed computational model for cylindrical lithium-ion batteries under mechanical loading: From cell deformation to short-circuit onset. J. Power Sources 2019, 413, 284–292. [Google Scholar] [CrossRef]
- Zhu, J.; Zhang, X.; Sahraei, E.; Wierzbicki, T. Deformation and failure mechanisms of 18650 battery cells under axial compression. J. Power Sources 2016, 336, 332–340. [Google Scholar] [CrossRef]
- Tang, L.; Zhang, J.; Cheng, P. Homogenized modeling methodology for 18650 lithium-ion battery module under large deformation. PLoS ONE 2017, 12, e0181882. [Google Scholar] [CrossRef] [Green Version]
- Wang, W.; Yang, S.; Lin, C.; Li, Y. Mechanical and electrical response of cylindrical Lithium-ion cells at various State of Charge. Energy Procedia 2018, 145, 128–132. [Google Scholar] [CrossRef]
- Sheikh, M.; Elmarakbi, A.; Rehman, S. A combined experimental and simulation approach for short circuit prediction of 18650 lithium-ion battery under mechanical abuse conditions. J. Energy Storage 2020, 32, 101833. [Google Scholar] [CrossRef]


| Amount | Speed/mm/min | Abort Criterion | Boundary Condition | Test Principle | |
|---|---|---|---|---|---|
| radial crush | 3 | 5 | 50% deformation | flat plate |  |
| radial crush | 3 | 1 | 50% deformation | flat plate |  |
| radial crush impactor | 3 | 1 | 50% deformation | cylindrical impactor | 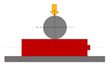 |
| Amount | SOC/% | Speed mm/min | Abort Criterion | Boundary Condition | Test Principle | |
|---|---|---|---|---|---|---|
| axial crush | 4 | 100 | 5 | short circuit 50% deformation | flat plate | |
| 2 | 0 | 5 | ||||
| radial crush | 4 | 100 | 1 | short circuit 50% deformation | flat plate | |
| 2 | 0 | 1 | ||||
| radial crush indentation | 4 | 100 | 1 | short circuit 50% deformation | cylindrical impactor | |
| 2 | 0 | 1 | ||||
| 3-point bending | 4 | 100 | 1 | short circuit force drop | reproducing installation situation | 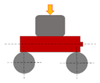 |
| 2 | 0 | 1 |
| Load Case | Impactor Displacement at Short Circuit/mm |
|---|---|
| axial crush | 5.5 |
| radial crush | 5.6 |
| radial crush impactor | 5.4 |
| three-point bending | 6.5 |
| Short Circuit Criterion | FEM Solver Used for Simulation | Displacement at SC-OccurrenceAxial Crush/mm | Displacement at SC-OccurrenceRadial Crush/mm | Displacement at SC-OccurrenceRadial Crush Impactor/mm | Displacement at SC-OccurrenceThree-Point Bending/mm | Deviation from Testing Values/mm | Maximum Deviation between Solvers/mm |
|---|---|---|---|---|---|---|---|
| volumetric strain—local | Abaqus | * | 5.62 | 3.74 | 4.56 | 1.92 | 0.09 |
| LS-DYNA | * | 5.62 | 3.83 | 4.51 | 1.97 | ||
| volumetric strain—global | Abaqus | 4.42 | 3.57 | 5.36 | 4.85 | 2.08 | 0.75 |
| LS-DYNA | 4.01 | 4.32 | 5.30 | 4.37 | 2.11 | ||
| equivalent strain—local | Abaqus | * | 5.62 | 3.78 | 5.10 | 1.58 | 1.74 |
| LS-DYNA | * | 4.23 | 5.36 | 6.84 | 1.42 | ||
| equivalent strain—global | Abaqus | * | 3.04 | 5.36 | 4.51 | 2.25 | 0.24 |
| LS-DYNA | * | 3.32 | 5.36 | 4.75 | 2.33 | ||
| equivalent stress—local | Abaqus | 4.14 | 5.46 | 2.85 | 3.36 | 3.12 | 0.65 |
| LS-DYNA | 3.49 | 5.62 | 2.66 | 3.36 | 3.12 | ||
| equivalent stress—global | Abaqus | 3.28 | 5.51 | 4.90 | 5.10 | 2.26 | 0.21 |
| LS-DYNA | 3.36 | 5.72 | 5.00 | 4.90 | 2.18 | ||
| max. principal strain—local | Abaqus | * | 5.10 | 2.70 | 3.00 | 3.48 | 3.44 |
| LS-DYNA | * | 3.96 | 5.36 | 6.44 | 1.69 | ||
| max. principal strain—global | Abaqus | 5.25 | 3.57 | 5.30 | 4.85 | 2.08 | 3.32 |
| LS-DYNA | 3.16 | 1.68 | 1.98 | 1.92 | 4.56 | ||
| max. principal stress—local | Abaqus | 4.32 | 5.41 | 2.63 | 3.04 | 3.44 | 1.04 |
| LS-DYNA | 3.28 | 5.46 | 2.56 | 3.04 | 3.44 | ||
| max. principal stress—global | Abaqus | 3.28 | 5.62 | 5.25 | 5.57 | 2.26 | 0.27 |
| LS-DYNA | 3.28 | 5.36 | 5.30 | 5.30 | 2.26 | ||
| principal strain 2D—local | Abaqus | * | 4.66 | 3.78 | 6.44 | 1.58 | 3.08 |
| LS-DYNA | * | 5.62 | 2.81 | 3.36 | 3.12 | ||
| principal strain 2D—global | Abaqus | * | 3.20 | 5.36 | 4.05 | 2.45 | 1.53 |
| LS-DYNA | * | 3.36 | 4.70 | 2.52 | 3.96 | ||
| axial and radial geometric criterion | Abaqus | 5.51 | 4.19 | 4.51 | 6.38 | 1.46 | 0.30 |
| LS-DYNA | 5.51 | 4.49 | 4.79 | 6.53 | 1.16 | ||
| testing values | 5.54 | 5.65 | 5.36 | 6.48 |
Publisher’s Note: MDPI stays neutral with regard to jurisdictional claims in published maps and institutional affiliations. |
© 2021 by the authors. Licensee MDPI, Basel, Switzerland. This article is an open access article distributed under the terms and conditions of the Creative Commons Attribution (CC BY) license (https://creativecommons.org/licenses/by/4.0/).
Share and Cite
Jantscher, K.; Breitfuß, C.; Miklau, M.; Ismail, K.; Dobusch, P. Virtual Detection of Mechanically Induced Short Circuits in a Cylindrical Lithium-Ion Battery Cell Based on Finite Element Simulation. Batteries 2021, 7, 79. https://doi.org/10.3390/batteries7040079
Jantscher K, Breitfuß C, Miklau M, Ismail K, Dobusch P. Virtual Detection of Mechanically Induced Short Circuits in a Cylindrical Lithium-Ion Battery Cell Based on Finite Element Simulation. Batteries. 2021; 7(4):79. https://doi.org/10.3390/batteries7040079
Chicago/Turabian StyleJantscher, Klemens, Christoph Breitfuß, Martin Miklau, Khaled Ismail, and Peter Dobusch. 2021. "Virtual Detection of Mechanically Induced Short Circuits in a Cylindrical Lithium-Ion Battery Cell Based on Finite Element Simulation" Batteries 7, no. 4: 79. https://doi.org/10.3390/batteries7040079
APA StyleJantscher, K., Breitfuß, C., Miklau, M., Ismail, K., & Dobusch, P. (2021). Virtual Detection of Mechanically Induced Short Circuits in a Cylindrical Lithium-Ion Battery Cell Based on Finite Element Simulation. Batteries, 7(4), 79. https://doi.org/10.3390/batteries7040079