Article

A Method for Monitoring State-of-Charge of Lithium-Ion Cells Using Multi-Sine Signal Excitation

Department of Energy and Automation Technology, Electrical Energy Storage Technology, Technical University of Berlin, Einsteinufer 11, 10587 Berlin, Germany
*
Author to whom correspondence should be addressed.
Batteries 2021, 7(4), 76; https://doi.org/10.3390/batteries7040076
Submission received: 30 July 2021 / Revised: 15 October 2021 / Accepted: 3 November 2021 / Published: 9 November 2021
(This article belongs to the Special Issue Battery Systems and Energy Storage beyond 2020)

Abstract

:
In this paper, a method for monitoring SoC of a lithium-ion battery cell through continuous impedance measurement during cell operation is introduced. A multi-sine signal is applied to the cell operating current, and the cell SoH and SoC can be simultaneously monitored via impedance at each frequency. Unlike existing studies in which cell impedance measurement is performed ex situ through EIS equipment, cell state estimation is performed in situ. The measured impedance takes into account cell temperature and cell SoH, enabling accurate SoC estimation. The measurement system configured for the experiment and considerations for the selection of measurement parameters are described, and the accuracy of cell SoC estimation is presented.

1. Introduction

A Li-ion battery is a type of secondary battery in which lithium ions move from a negative electrode to a positive electrode through an electrolyte during a discharge process. Lithium is the lightest solid element and has the lowest standard reduction potential. Therefore, when applied as an electrode material, the battery cell can obtain an electromotive force higher than 3 V, and a high energy density per weight and a high energy density per volume can be obtained. Li-ion batteries have less memory effect and less self-discharge as well. In addition to these advantages, due to their reliable performance, long life cycle, and advantages such as reduced pollution, Li-ion batteries are one of the most promising power sources for portable electronics, electric vehicles, renewable energy storage devices, et cetera [1,2]. However, high energy density batteries with low thermal stability electrode materials may have low safety performance [3,4,5]. In particular, battery failure caused by extreme conditions such as excessive external force, high temperature, low temperature, overcharge, and over-discharge becomes a serious problem [6,7,8].
Overcharging the Li-ion battery can be one of the most important safety issues. Overcharging occurs when a charging current is forced in after the battery reaches its upper cutoff voltage or state of charge (SoC) limit. It is usually caused by a malfunction of the battery charger or by an inaccurate estimate of the condition of the battery in the battery management system (BMS). When the Li-ion battery is overcharged, in addition to the increase in internal resistance, decomposition of the binder and electrolyte, formation of insoluble products, blocked electrode pores, and gas generation may occur sequentially [9]. Especially, severe expansion of the battery may occur due to gas accumulation [10], and when the internal pressure exceeds the limit, structural deformation, rupture, and an internal short circuit may occur [11,12]. Lithium metal and moisture in the air may react after the battery ruptures, and even flammable gases may ignite [8,13]. Heat generated by side reactions and internal short circuits can accelerate battery failure mechanisms through natural positive feedback, leading to thermal runaway, eventually causing battery ignition or explosion [8,14,15]. In the case of over-discharge, a significant loss of active lithium and positive electrode material occurs [16], and a decrease in battery capacity occurs [17,18]. Battery over-discharging also results in a change in the solid electrolyte interphase (SEI) on the anode surface and an increase in impedance [18]. Gas is also generated from the decomposition of the SEI, which can cause battery swelling [19].
Accurate SoC estimation has the following advantages:
  • Battery cells can be used longer by preventing overcharging and over-discharging, which can cause permanent damage.
  • It enables more aggressive cell operation. If the reliability of the SoC estimation is low, it must be operated conservatively in order to avoid overcharging and over-discharging the cell and to make the operation as safe as possible.
  • As it shows reliable estimation results for any usage profile of the cell, it improves the reliability of the use of the battery cell in the application system.
  • As the battery pack design does not have to be overengineered, it enables the production of smaller and lighter battery packs. It eventually lowers the price of the battery pack. In addition, the reliable battery system reduces battery maintenance costs.
Nonetheless, there is still no way to directly measure the SoC of a battery cell. Therefore, it must be estimated or inferred indirectly from the measured current, voltage, and temperature.
Li-ion cell SoC estimation methods can be listed as follows [20,21,22]:
  • SoC estimation method based on open circuit voltage (OCV)
In order to represent the thermodynamic state of the energy of the cell electrode, the OCV according to the chemical composition of the electrode is used. OCV is the voltage of the electrode when it has been stable for a sufficient time without flowing current. Cell voltage is related to temperature and electrode particle surface concentration, whereas cell SoC is related to particle average concentration. In other words, OCV is measured when the electrodes of an electrochemical cell reach equilibrium and there is no voltage deviation depending on the position inside the electrode, which reflects the Gibbs free energy at thermodynamic equilibrium. The OCV represents a strong dependence on SoC in most batteries. Nevertheless, it is impractical for real-time or continuous state estimation since a relaxation time of several hours is generally required to reach electrochemical equilibrium. This is especially problematic for battery applications where resting time can never exist. Furthermore, Li-ion batteries have a flatter OCV compared to lead-acid batteries, making SoC estimation difficult. In addition, cell temperature and cell state of health (SoH) can also lead to SoC estimation errors based on OCV.
  • SoC estimation method based on ampere counting
In the SoC estimation method based on ampere counting, the accumulated amount of charging and discharging current relative to the discharging capacity is defined as ∆SoC and calculated with the set initial SoC. Since only cumulative current information is used for SoC estimation, it has the advantage of requiring relatively low performance for the hardware and software of the BMS. However, this method also has weaknesses in estimating cell SoC. It becomes a problem if the SoC of the battery cell is entirely dependent on the initial SoC. Since only ∆SoC is calculated, it is unavoidable to misestimate the SoC if the initial SOC setting is incorrect. In addition, it is impossible to know exactly the total capacity and coulombic efficiency of a cell, which should be approximated, and both of these approximations contribute to the error in cell SoC estimation. Self-discharge currents and leakage currents from electronic circuits for measuring cell performance increase errors as well. Furthermore, errors in voltage, current, and temperature measurements contribute to increasing the estimation error. These errors are more integrated and intensified as battery cell operating time increases. As a result, the uncertainty in the SOC estimate is exacerbated by the accumulated measurement errors. Therefore, this method can show reliable estimation results for a short period of time only if the initial conditions are well known, unless there is a feedback mechanism for error correction.
  • SoC estimation method based on heuristic data
The heuristic based SoC estimation method is a method based on experimental data. Statistical rules or patterns found from data obtained through various cell charge and discharge experiments are used. These methods include fuzzy logic, neural networks, and support vector machines (SVM). Reliable estimation results can be obtained when the learning technique is implemented with a large amount of experimental data under different conditions. However, it takes a lot of time for the necessary experimental data to be properly secured.
  • SoC estimation method based on adaptive control
An adaptive control based SoC estimation method such as a Kalman filter (KF) [23] or a sliding mode observer [24,25] compares the actual SoC measurement result with the estimated value and gradually reduces the difference according to the feedback principle. Although this method has a high estimation performance, it is relatively complicated to implement and thus has a disadvantage of high cost.
  • SoC estimation method based on equivalent circuit model
The electrochemical impedance spectroscopy (EIS) method is a well-established technique for determining the dynamic behavior of electrochemical systems [26,27]. It is used to characterize battery impedance behavior over a wide frequency range [28,29]. Using EIS, the measured spectrum in an electrochemical system can be interpreted as an impedance spectrum of a lumped element model consisting of resistors, inductors, and capacitors. It can be used to implement dynamic simulation models [30]. The SoC [21,22,31] and SoH [28,32,33] of the battery cell can be estimated through the equivalent circuit model obtained through EIS. Moreover, the commonly used definition for battery end of life (EoL) is the predefined battery impedance increase at nominal conditions [34,35,36]. Nevertheless, EIS equipment is generally used in laboratories for general propose impedance measurements [3], which are not suitable for battery monitoring purposes. For EIS measurements, battery cells need to be detached from the operating load, and it is usually time consuming for impedance measurements in a wide frequency range. In addition, EIS equipment can be an excessive investment for battery monitoring systems, especially heavy and bulky for portable devices. Moreover, without algorithms for cell state estimation, EIS measurements alone cannot estimate cell SoH and SoC.
Unlike the method using EIS, the proposed method can be used to estimate the SoC of the cell during operation. There is a growing interest in the use of cell impedance to monitor the condition of batteries. The papers by Qahouq [37] and Waag et al. [38] deal with the impedance measurement of the operating cell but do not cover cell SoC and SoH estimation using the measured impedance. In the paper by Do et al. [39], the measured impedance is not adjusted according to the temperature change, and the computational complexity increases by using the extended KF. In addition, this paper does not deal with the method of estimating the cell SoH and SoC from the measured impedance. In the papers by Huang et al. [40] and Howey et al. [41], the cell SoC is estimated by measuring the cell impedance, but the effect of temperature on the cell impedance is not considered. The paper by Fleischer et al. [33] shows a good result of estimating the state of a cell in operation. However, a physical model and an equivalent circuit model are used, and so-called mutation algorithms are used. Since nonlinear differential equations and matrix operations are required, the complexity of the operation is increased. On the other hand, the proposed method is relatively simple but accurate. Using the cell temperature and impedance at two frequencies, SoH and SoC of the cells in operation can be estimated.

Proposed Cell State Estimation Method

Battery cell SoC can be estimated by continuously measured impedance during discharge. To estimate the cell state, a multi-sine signal with a small amplitude is applied to the cell operating current, and the cell impedance is measured through the amplitude of the voltage response. The multi-sine signal is the sum of two different frequencies, and each frequency is used to estimate the cell SoH and SoC.
If the current i expressed by Equation (1) flows through the battery cell, the cell voltage e can be expressed by Equation (2).
i = I dc + Δ I f · sin ( 2 π ft )
e = E dc + Δ E f · sin ( 2 π ft + ϕ f )
where I dc is direct current (DC) bias, Δ I f is the amplitude of the excited test frequency f , E dc is the offset voltage, Δ E f is the amplitude of the output voltage, and ϕ f is the phase difference.
Dividing the voltage by the current as Equation (3) produces a complex impedance Z f .
Z f = Δ E f Δ I f · e j ϕ f = | Z f | · e j ϕ f = Z f + j · Z f
The electrochemical impedance of batteries depends on frequency and characterized by its modulus | Z f | and phase angle e j ϕ . Another expression is given as the real and imaginary parts of the complex impedance.
EIS measurements usually use a single-sine signal in which individual frequencies are measured sequentially, which is also known as stepped sine or frequency sweep. Therefore, single-sine EIS has the disadvantage that it takes a long time to acquire impedance in a wide frequency range. This disadvantage can be overcome by measuring several frequencies simultaneously. The method of measuring multiple frequencies at the same time is called multi-sine EIS. Multi-sine signals have already been used for impedance spectroscopy and transfer function measurements in biomedical applications [42,43], material characterization [44], and other fields such as battery measurements [26,28]. Nonetheless, multi-sine EIS is not a common method for estimating the in situ state of a battery cell. In general, the multi-sine EIS, like the single-sine EIS, requires the cell to be separated from the application circuit for impedance measurements. In the proposed battery SoC monitoring method, the sum signal of two test frequencies is excited to the cell operating current and its response voltage is measured. A Fourier transform is used on the sampled cell voltage to obtain the amplitude at each test frequency. The impedance at each test frequency is obtained by substituting the amplitude of each response voltage into Equation (3).

2. Experiment

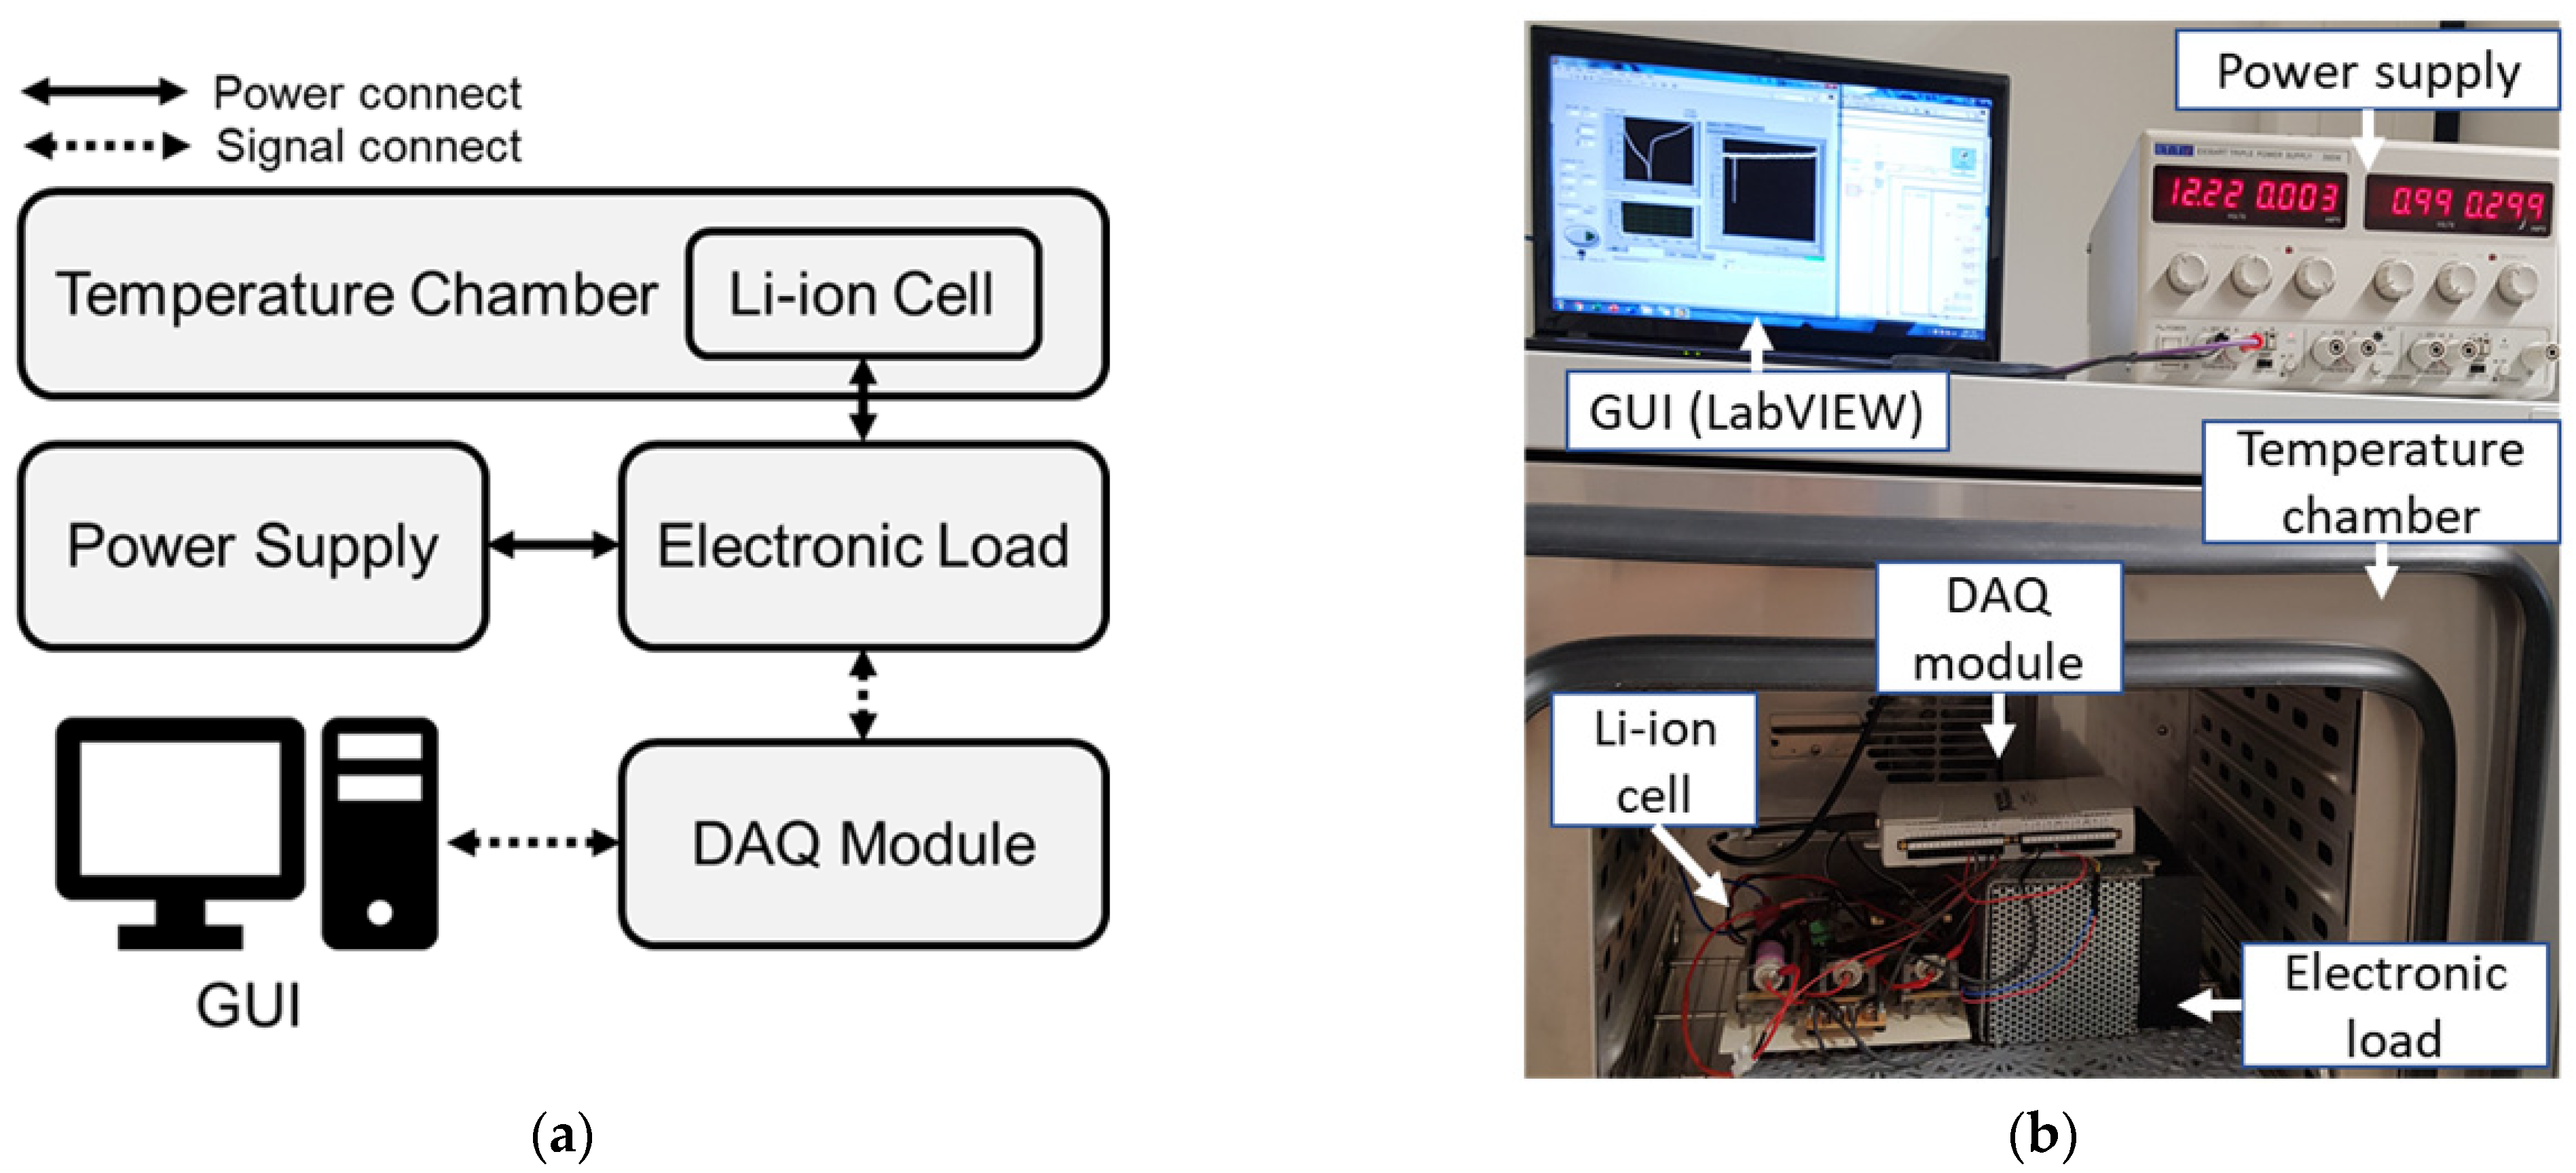
2.1. Measurement System

The measurement system is configured to measure cell impedance by applying a multi-sine signal to the operating current. Table 1 shows the specifications of the Li-ion battery cell used and Figure 1 shows a block diagram and a picture of the measurement system.
The test battery cell is placed in the temperature chamber of the Binder GmbH set to 25 °C. NXP’s silicon temperature sensor KTY 81-110 is attached to the cell to measure the actual cell surface temperature. The voltage signal output port of USB-6212, which is a data acquisition (DAQ) module of the Natural Instruments, is connected to an electronic load to apply test frequencies to the cell operating current. This DAQ module also acquires cell voltage, current, and temperature data. Experiments are controlled by adjusting measurement parameters through a graphical user interface (GUI) created using LabVIEW from National Instruments. Measured and calculated data is displayed on the monitor and can also be written to the hard disk. The analog inputs of the DAQ module have 16-bit analogue to digital converter (ADC) resolution, a maximum sample rate of 400 kS/s, and an input range of ±10 V. The analog output has 16-bit digital to analog converter (DAC) resolution, an output range of ±10 V, and a maximum update rate of 250 kS/s. The operation of the electronic load is described in the author’s previous paper [45].

2.2. Definition of Key Terms

There is no standard definition that defines SoC and SoH for battery cells and may be defined differently depending on the battery application system. Therefore, it is necessary to clarify the terms defined in this paper before discussing cell state estimation.
  • Definition of C-rate
In general, C-rate is used to indicate the rate of charge and discharge of a battery cell. The relationship shown in Equation (4) is given between the cell nominal capacity C N and the operating current i .
h = C N / i
where h is the time (hour) taken to completely discharge the battery cell, i is the current at which the cell operates, and C N is the nominal capacity of the battery (Ah). Here, the reciprocal of the h value is defined as the C-rate.
  • Definition of SoC
In this paper, the cell SoC is set through the following three steps:
(1) Full charge of the battery cell. The constant-current (CC) charging procedure at 1C and the constant-voltage (CV) charging procedure at 4.2 V are followed in sequence, where 4.2 V is the upper cut-off voltage specified by the cell manufacturer. This first step is complete when the charging current drops below C/10. Subsequently, each cell is given 90 min of relaxation time.
(2) Discharge the cell at 1C until it reaches a lower cut-off voltage. From this step, the actual cell capacity C cell is obtained.
(3) Set the cell to the target SoC. To fully charge the cell, Stage 1 is performed again, and then the charge of the cell is consumed until the target SoC is reached. Since different cell relaxation times can introduce errors, the same relaxation times must be observed [46,47]. Each cell is given 90 min of relaxation time after the target SoC is set and before it is used in the experiment.
The SoC is then defined as Equation (5).
SoC = C residual / C cell × 100   ( % )
The SoC of a cell is the ratio of the residual capacity ( C residual ) to the total available capacity when the battery cell is fully charged ( C cell ). The C cell can be obtained from the second step of the procedure for setting up the cell SoC mentioned above. Depth of discharge (DoD) has the exact opposite definition of SoC, i.e., a cell of 80% SoC has the same meaning as a cell of 20% DoD.
  • Definition of SoH
Battery cell SoH is defined as the ratio of the cell actual total available capacity C cell to the cell initial total available capacity C init and expressed by Equation (6).
SoH = C cell / C init × 100   ( % )
In this paper, cell impedances from 100% to 80% SoH of cells are measured and compared. The EoL of a battery is reached when the energy content or power capacity is no longer sufficient for the application. This can vary depending on battery application; thus, there is no universal definition of how many cell SoHs have reached EoL. Nonetheless, publications assume that EoL is reached when the battery cell SoH is less than 80% [48,49,50].

2.3. Measurement Parameters

2.3.1. Selection of Test Amplitude

Depending on the battery cell application, the amplitude of the test frequency should be selected taking into account the trade-off between measurement accuracy and investment costs for battery management. In order for the appropriate test amplitude to be selected for impedance measurements, it must be selected to be small enough not to violate the linear criteria of the electrochemical battery system but large enough to obtain a suitable signal-to-noise ratio for robust measurements. The amplitude of the test signal must be small enough to satisfy the pseudo-linearity of the cell response voltage. This is crucial because the current–voltage curve of a Li-ion cell shows a nonlinear relationship that follows the Butler–Volmer kinetics. An excitation amplitude of 5 to 10 mV is generally recommended [51], e.g., if it is used for CC measurement (galvanostatic), the excitation amplitude of the current must be set so that the maximum absolute value of the voltage amplitude does not exceed 10 mV. Especially when a multi-signal signal is used, the maximum amplitude of the applied signal should be considered. Because the amplitudes at each frequency increase the total amplitude of the test signal, pseudo-linearity can be violated. For more test frequencies to be used, the amplitude of each frequency must be lowered, i.e., if a multi-sine signal of N frequencies is used, the output voltage amplitude at each frequency must be reduced to a maximum 10/N·mV. Amplitudes that are too small can be a problem as well. This is due to the finite resolution of the hardware that acquires and generates the test signal. Moreover, impedance measurements are not possible when the output voltage amplitude at individual frequencies becomes less than the system noise.

2.3.2. Selection of Test Frequencies

In a Li-ion battery cell, charged particles containing lithium ions are always involved in the electrode process. It is generally believed that the time constants of the movement or reaction of charged particles in these processes are different. Thus, impedance at different frequencies is related to different processes [52]. The influence of mass transfer, whose time constant is slower, is dominant at impedance at lower frequencies. Mass transfer (including diffusion) becomes faster as the temperature is higher and as the concentration of Li-ions increases (as DoD is lower). Faster transfer speed can be interpreted as lower impedance. On the other hand, the lower the cell temperature or the higher the DoD, the slower the mass transport [53], which appears to be a higher impedance in the lower frequency. This means that impedance at lower frequency can be more advantageous as it is used for cell SoC estimation. Studies on battery cell impedance consistently show that impedance at lower frequencies is more dependent on changes in cell SoC. However, since the frequency is the reciprocal of the period, the lower the frequency, the longer the period required to measure each continuous impedance. For example, if 1 mHz is used for the measurement, it takes about 17 min to collect only one period of signal. Therefore, the test frequency should be selected considering the time interval required for state estimation depending on the battery application. There is one more problem: the longer the measurement of one period, the greater the change in the internal state of the cell such as SoC and cell internal temperature. This also increases the error in impedance measurements. In this paper, 1 Hz where one period of signal can be collected per second is used as an example for SoC estimation.
There are also some considerations for higher frequencies to be used. In this case, the achievable sampling rate in the hardware can be a constraint. In theory, satisfying the Nyquist-Shannon criteria is sufficient for the signal to be restored, but, generally, oversampling is required due to noise and non-ideal properties in analog filters. Another problem is that the cell impedance is generally lower at higher frequencies, which can lead to the same problems when the test amplitude is too low. Most cell degradation results in an increase in internal resistance [54,55,56,57], and the 1 kHz impedance of the cell used in this paper represents the ohmic resistance of the cell in which the imaginary part of the impedance becomes 0. In paper [46], the accuracy of SoH estimation with impedance at different frequencies is compared, which shows that impedance at higher frequencies is more advantageous for use in SoH estimation, which is less affected by cell SoC and temperature. In this paper, a frequency of 1 kHz is used for SoH estimation as an example.

3. Measurement Results

The measurement system and parameters described in Section 2 are used for cell impedance measurements. The overall process of cell state estimation in this paper is shown in Figure 2 as a flow chart.
Table 2 shows the experimental conditions. Cell impedance is measured every second while discharging from 0% to 100% DoD for each cell with 100% to 80% SoH. A DC bias of 1C and an excitation amplitude of 130 mA are applied, i.e., an amplitude of 65 mA is given at each frequency of 1 Hz and 1 kHz. This amplitude is chosen for the cell output voltage amplitude to be less than 10 mV. The multi-sine test signal, the sum signal of the two frequencies, applies to the cell DC bias, and the impedance at each frequency is measured simultaneously.
Figure 3 shows continuous 1 Hz and 1 kHz impedance during discharging of cells with different SoHs.
As shown in Figure 3, the lower the cell SoH, the higher the cell impedance, and while 1 kHz impedance is relatively constant for DoD changes, 1 Hz impedance is more affected by cell DoD. While the cell is completely discharged, the increased rate of the highest value to the lowest value of 1 kHz impedance is 3.74%. At the same time, for 1 Hz impedance, the increased rate of the highest value to the lowest value between DoD 5% and 95% is 10.16%. The 1 kHz impedance shows a smaller increased rate, and it indicates less susceptibility to changes in cell DoD. Therefore, the 1 kHz impedance is more suitable to be used for SoH estimation of cells for which the cell SoC is unknown. Contrastively, 1 Hz impedance shows larger increase rate, which means that it is more suitable for cell SoC estimation.
For the calculation of the increase rate, 1 Hz impedance between DoD 5% and 95% in Figure 3 are used (if the full range of DoD 0% to 100% is considered, the difference in impedance deviation at 1 Hz and 1 kHz will be more prominent.). The reason is that at the beginning and end of cell discharge, the 1 Hz impedance is not measured correctly and cannot be used for cell SoC estimation. The voltage response of an electrochemical cell is not only affected by the cell impedance. The cell discharge process causes an overpotential, which is the voltage loss described by polarization. Polarization refers to a phenomenon in which the electrode potential becomes excessive or insufficient in an equilibrium state. During the reaction process in a battery cell, the rate of charge transfer process occurring in each cell component is not the same. If this rate is relatively slow for a particular process, it becomes the rate-limiting process for the entire reaction of the cell. As the cell discharges, current flows between both terminals, causing the voltage to be measured below its equilibrium potential. In this case, the difference between the voltage at both terminals and the equilibrium voltage is called overpotential, indicating the degree of polarization. Figure 4 shows the three polarization regions appearing in the typical discharge curve of a Li-ion battery cell. In the cell discharge process, polarization can be classified into three categories: activation polarization, concentration polarization, and ohmic polarization [58].
Ohmic polarization, also referred to as ohmic loss, is caused by the current flowing through the internal resistance of the battery cell. The greater the cell internal impedance, the greater the operating voltage drop as the ohmic losses increase proportional to the current density. Therefore, in this region, it has a slope related to the cell impedance and shows the most linearity when charging and discharging the cell. Due to this linearity, impedance can be measured accurately; hence, it is the most suitable region for cell state estimation through impedance measurement. Meanwhile, the cell output voltage in the activation and concentration polarization regions has nonlinearity. Activation polarization is due to various delay factors inherent in the dynamics of electrochemical reactions, such as the work function that ions must overcome at the junction between the electrode and the electrolyte. It has a dominant effect at the beginning of cell discharge. Concentration polarization takes into account the resistance that ions face in the process of mass transfer (e.g., diffusion) as they move across the electrolyte and from one electrode to another. This polarization has a dominant effect at high cell DoD. In conclusion, the cell voltage drops significantly non-linearly as the cell discharges in the region of activation and concentration polarization. Because this nonlinearity is based on slow response, especially in battery cells, the lower the frequency, the more difficult it is to obtain an accurate cell impedance. As shown in Figure 3, the effect of activation and concentration polarization at a frequency of 1 Hz is more pronounced than at 1 kHz, because slow transport processes are well represented at lower frequencies. On the other hand, slow transport reactions cannot be detected at higher frequencies, but the effects of fast kinetics can be revealed.

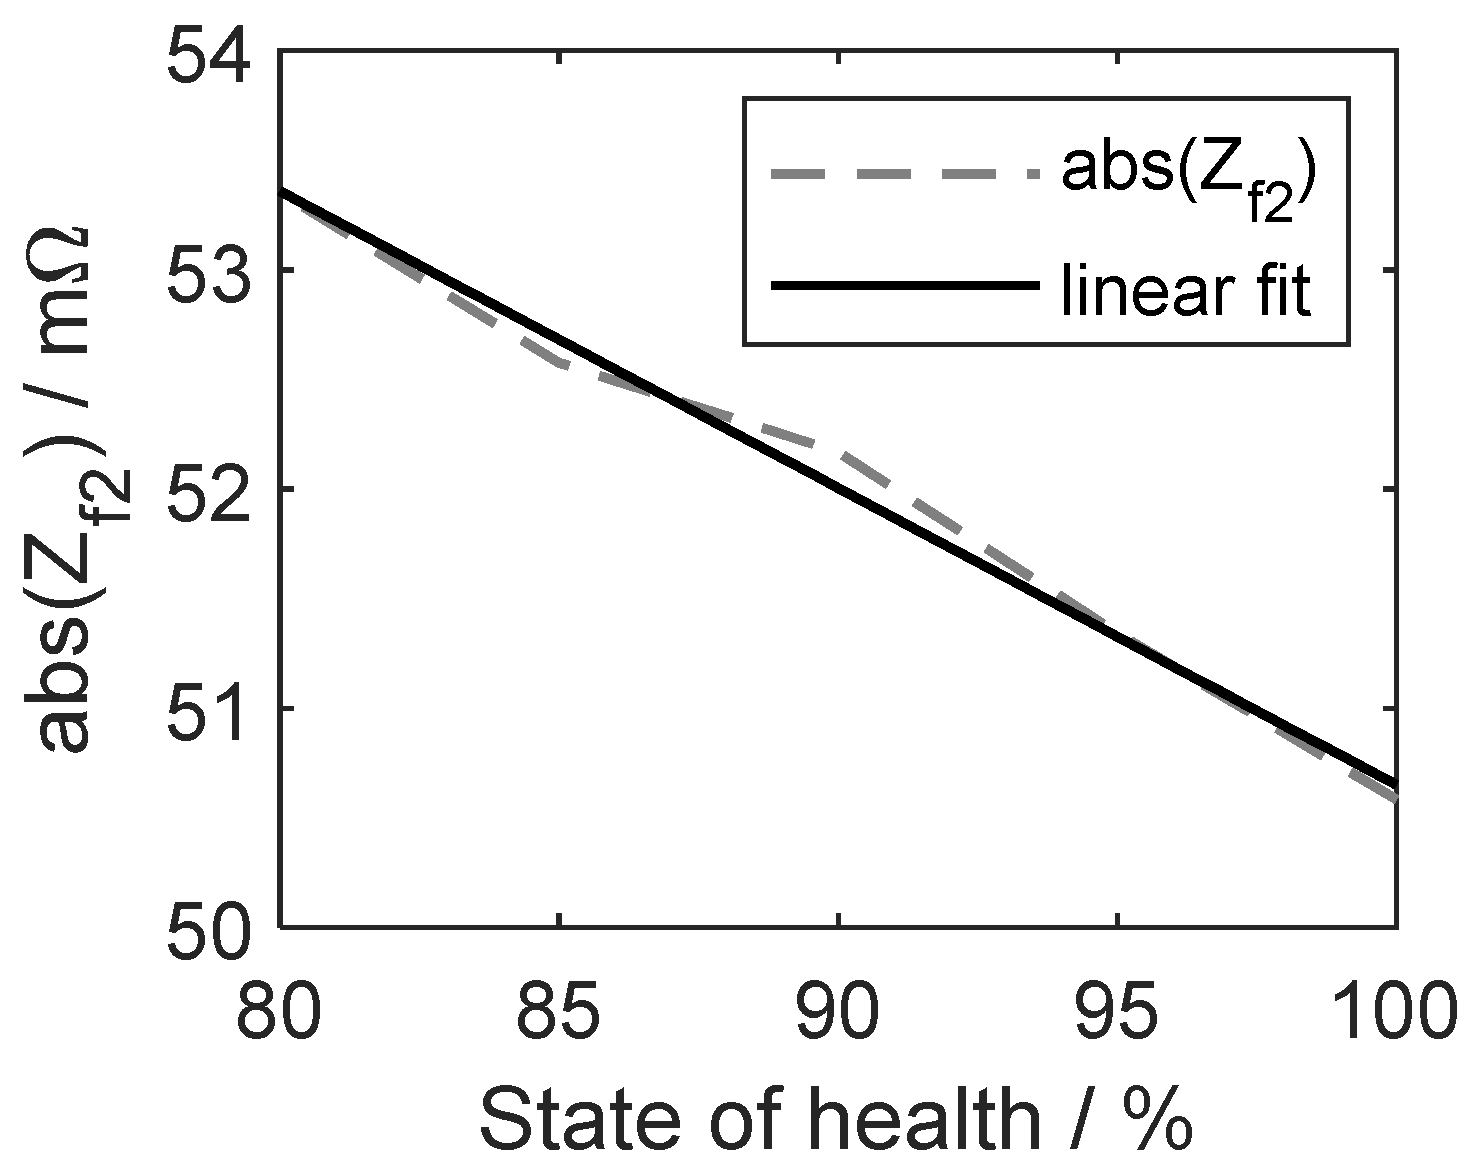
3.1. Cell SoH Estimation

The measured 1 kHz impedance in Figure 3 is used to estimate the cell SoH. Figure 5 shows the average of the 1 kHz impedance at each SoH and the fitted line.
The fitted line in Figure 5 is obtained through linear regression of these 1 kHz impedances measured at each SoH, and it is expressed as Equation (7).
Z f 2 = 0.1355 · SoH + 64.2
The measured 1 kHz impedance can be used to estimate the cell SoH using Equation (7). Here, root mean squared error (RMSE) is 0.21 mΩ and R 2 is 0.99. R 2 represents the goodness of fit of the estimated model. The closer this value is to 1, the better the estimate matches the target value.

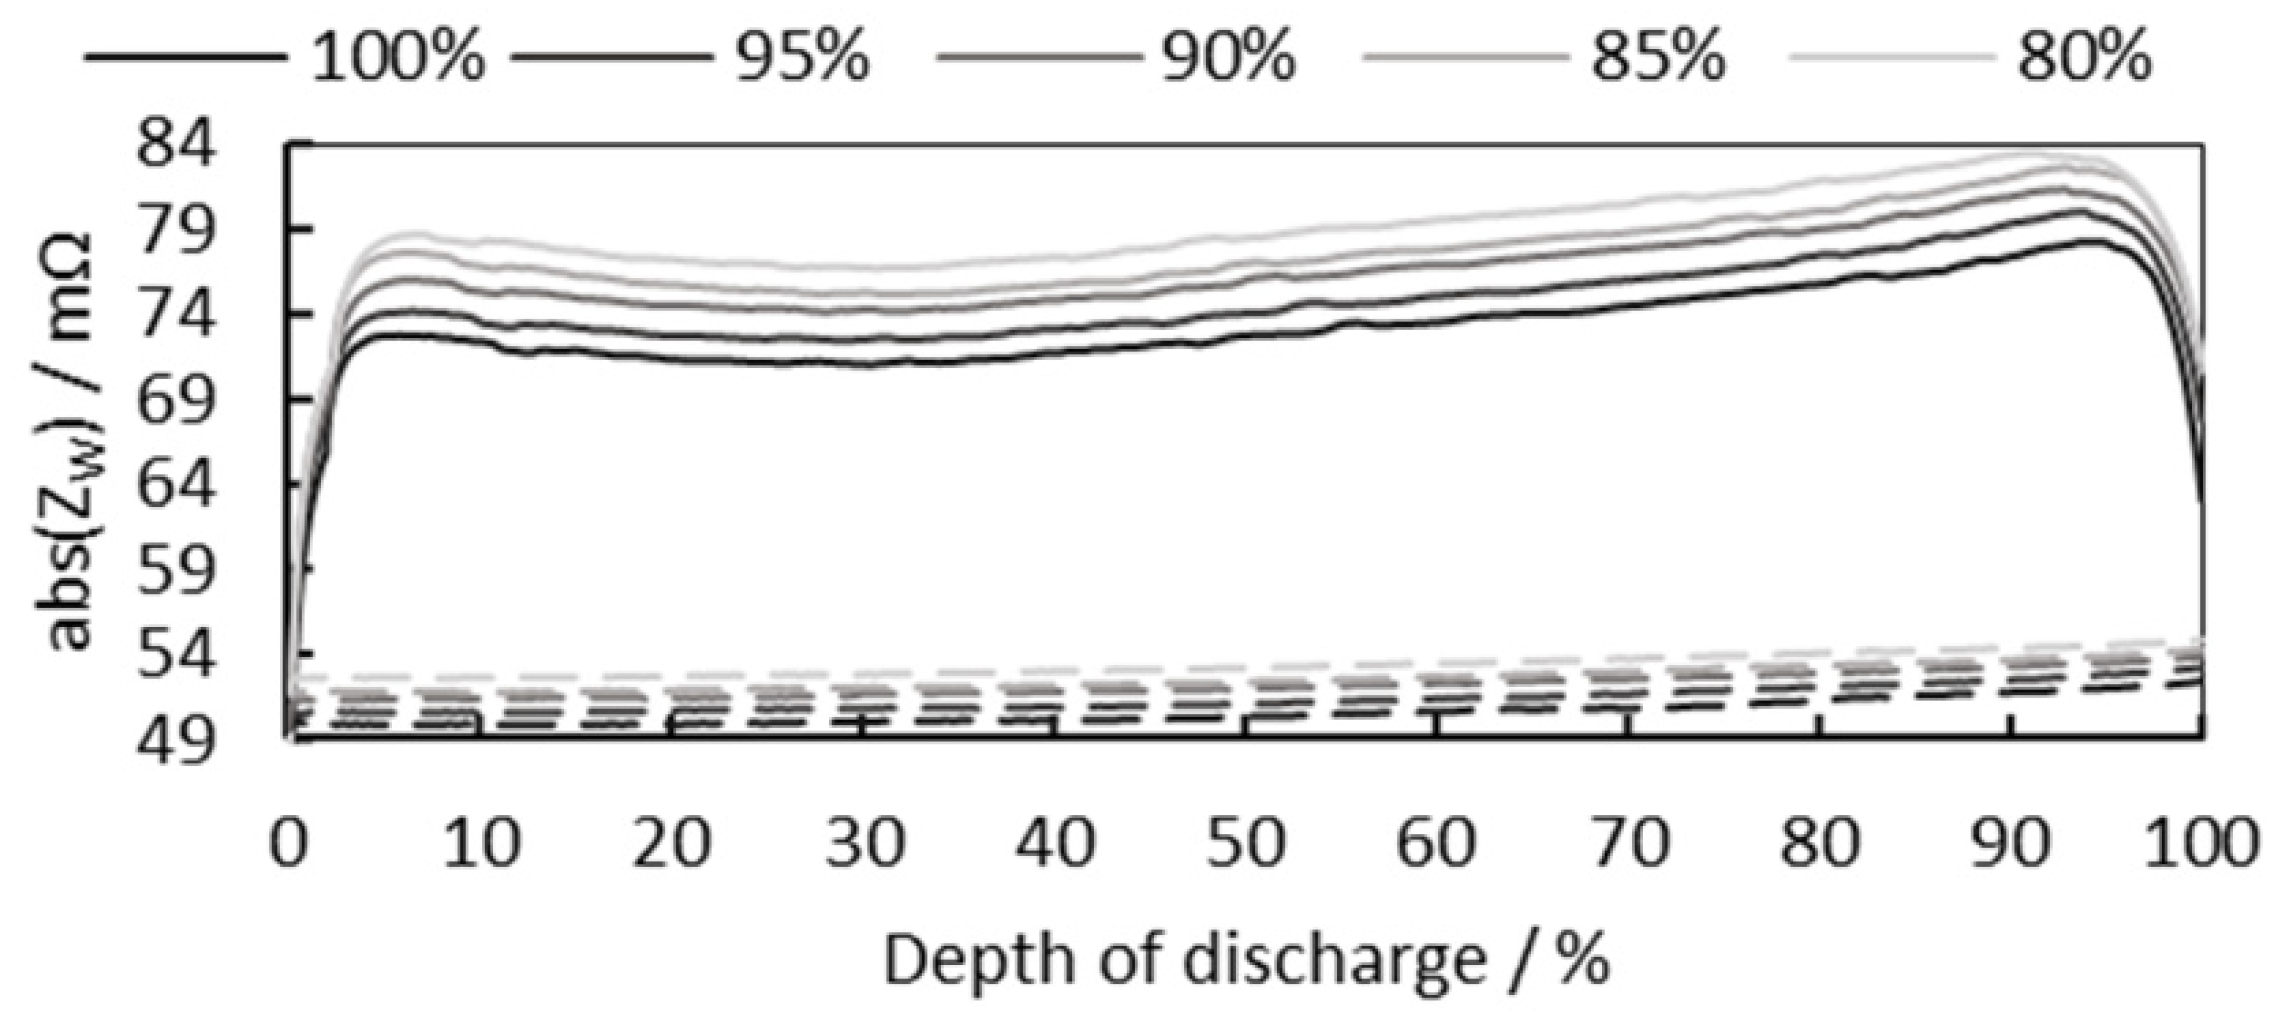
3.2. Cell SoC Estimation

The cell 1 Hz impedance is greatly influenced by not only the cell SoC but also the cell SoH and cell temperature. Therefore, to be used for cell SoC estimation, the 1 Hz impedance is adjusted as cell temperature in Section 3.2.1 and normalized as cell SoH in Section 3.2.2.

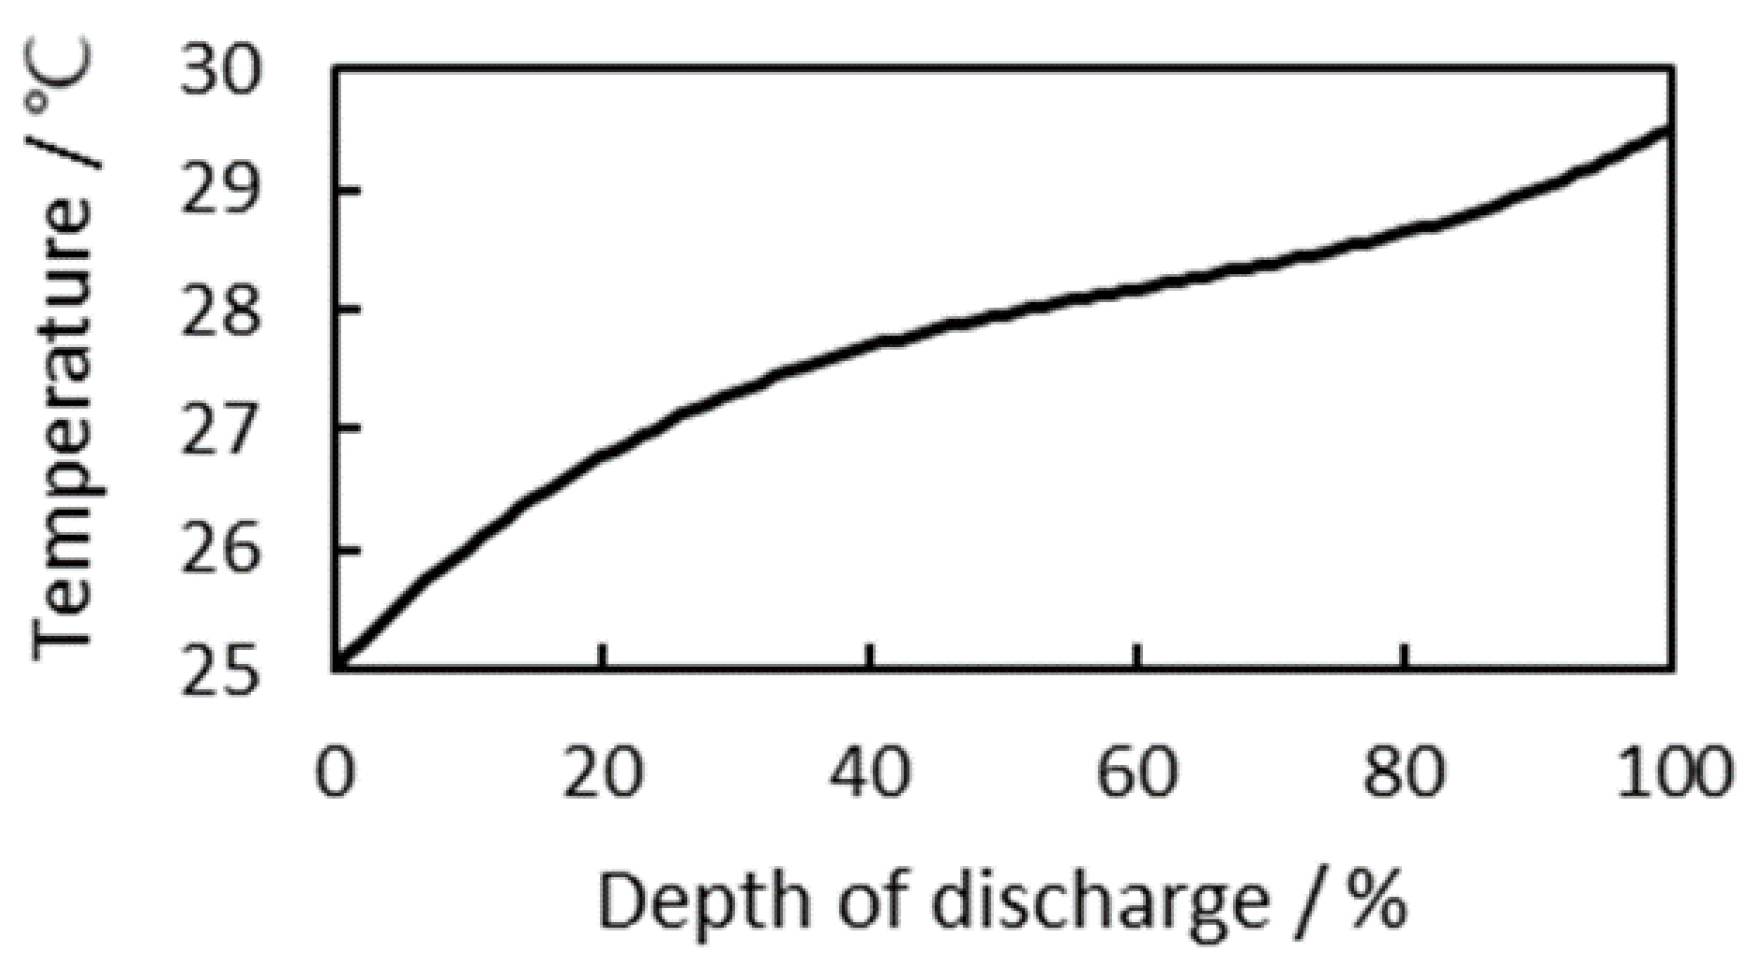
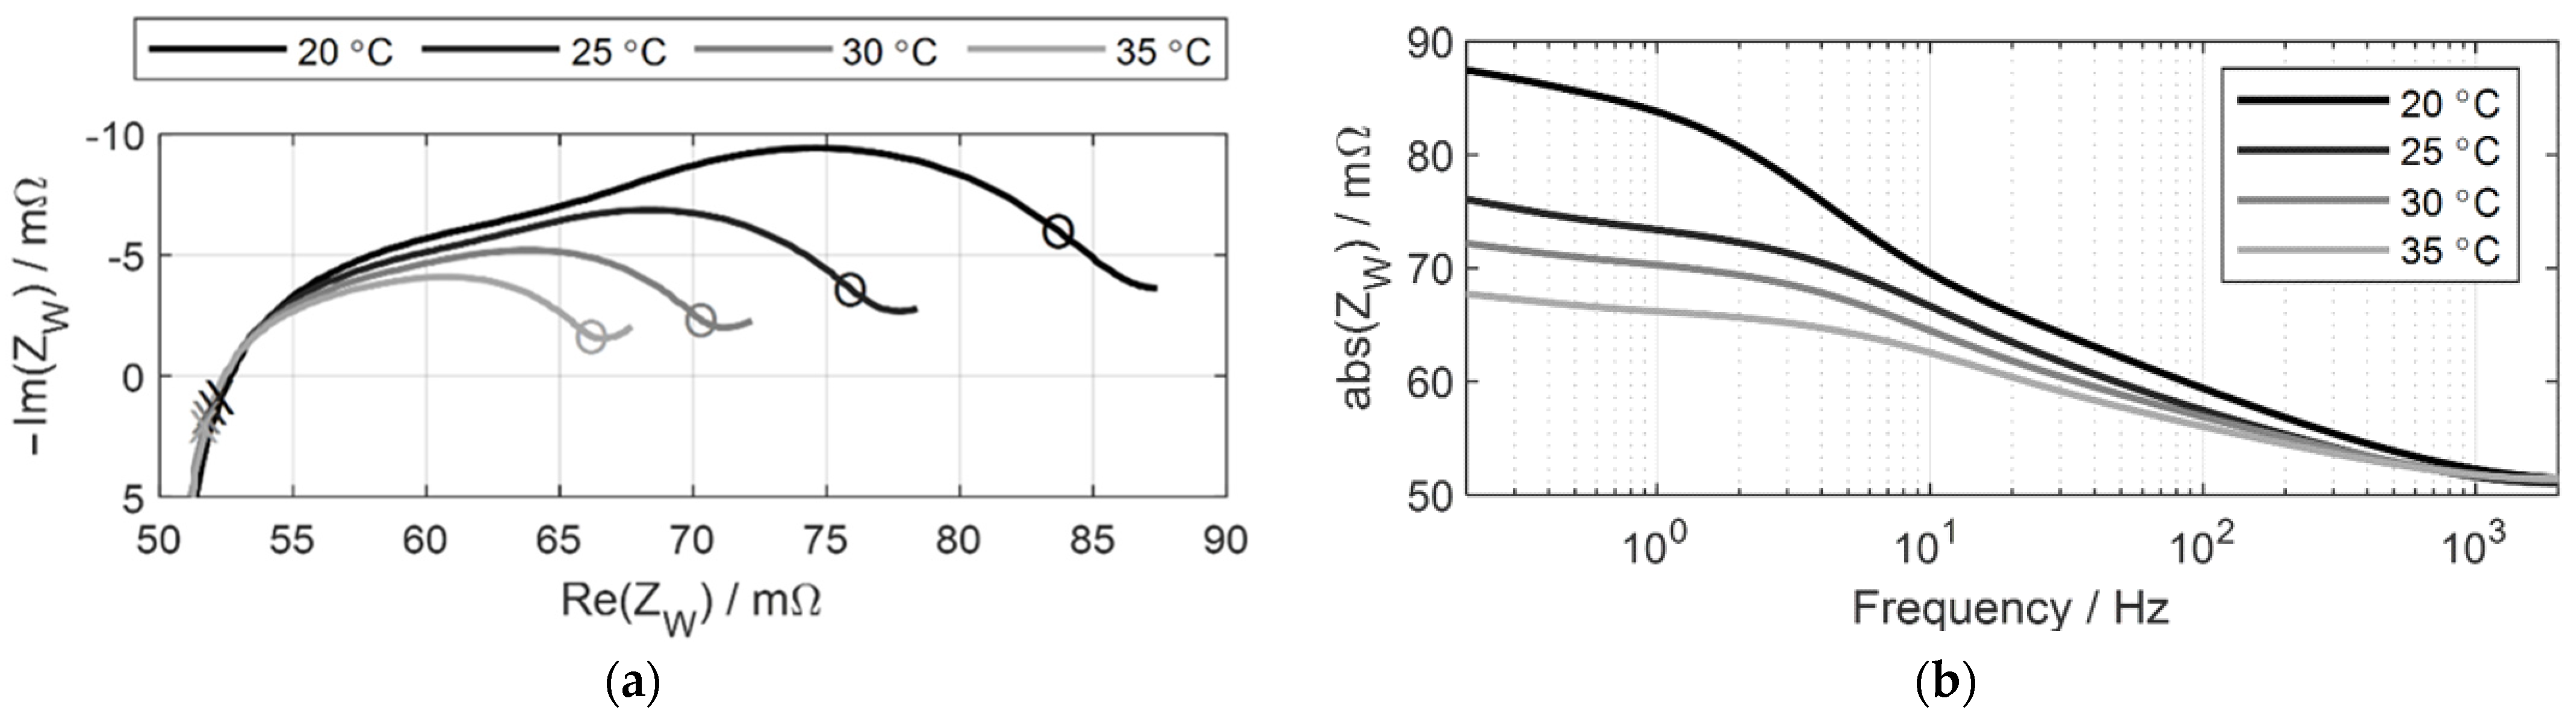
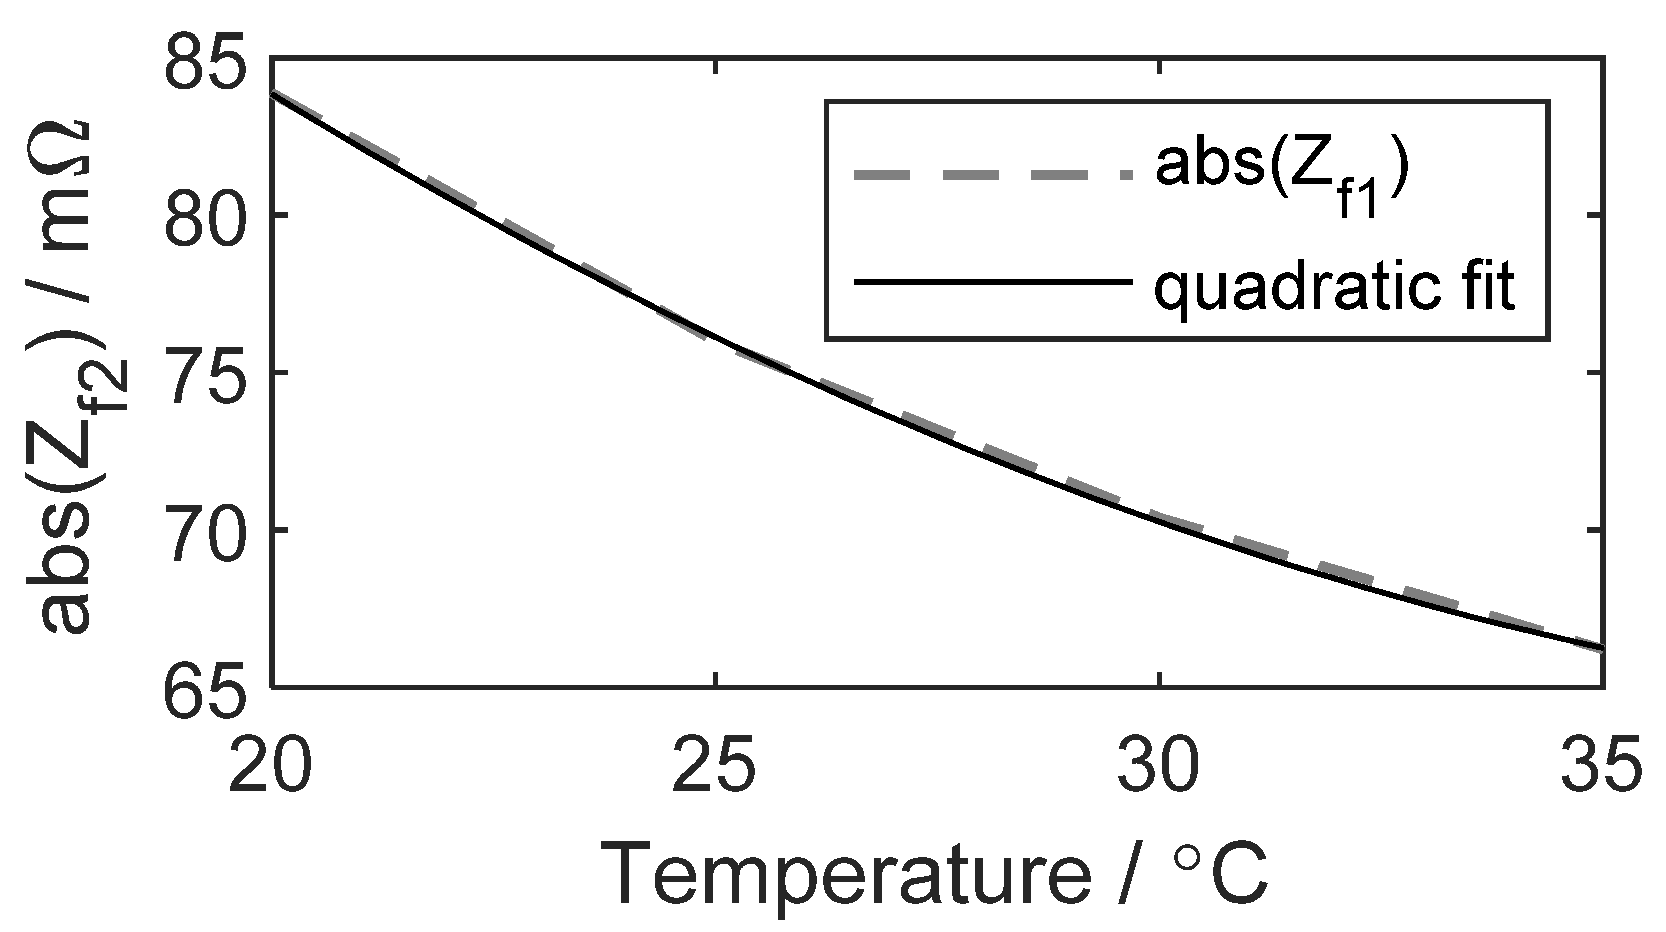
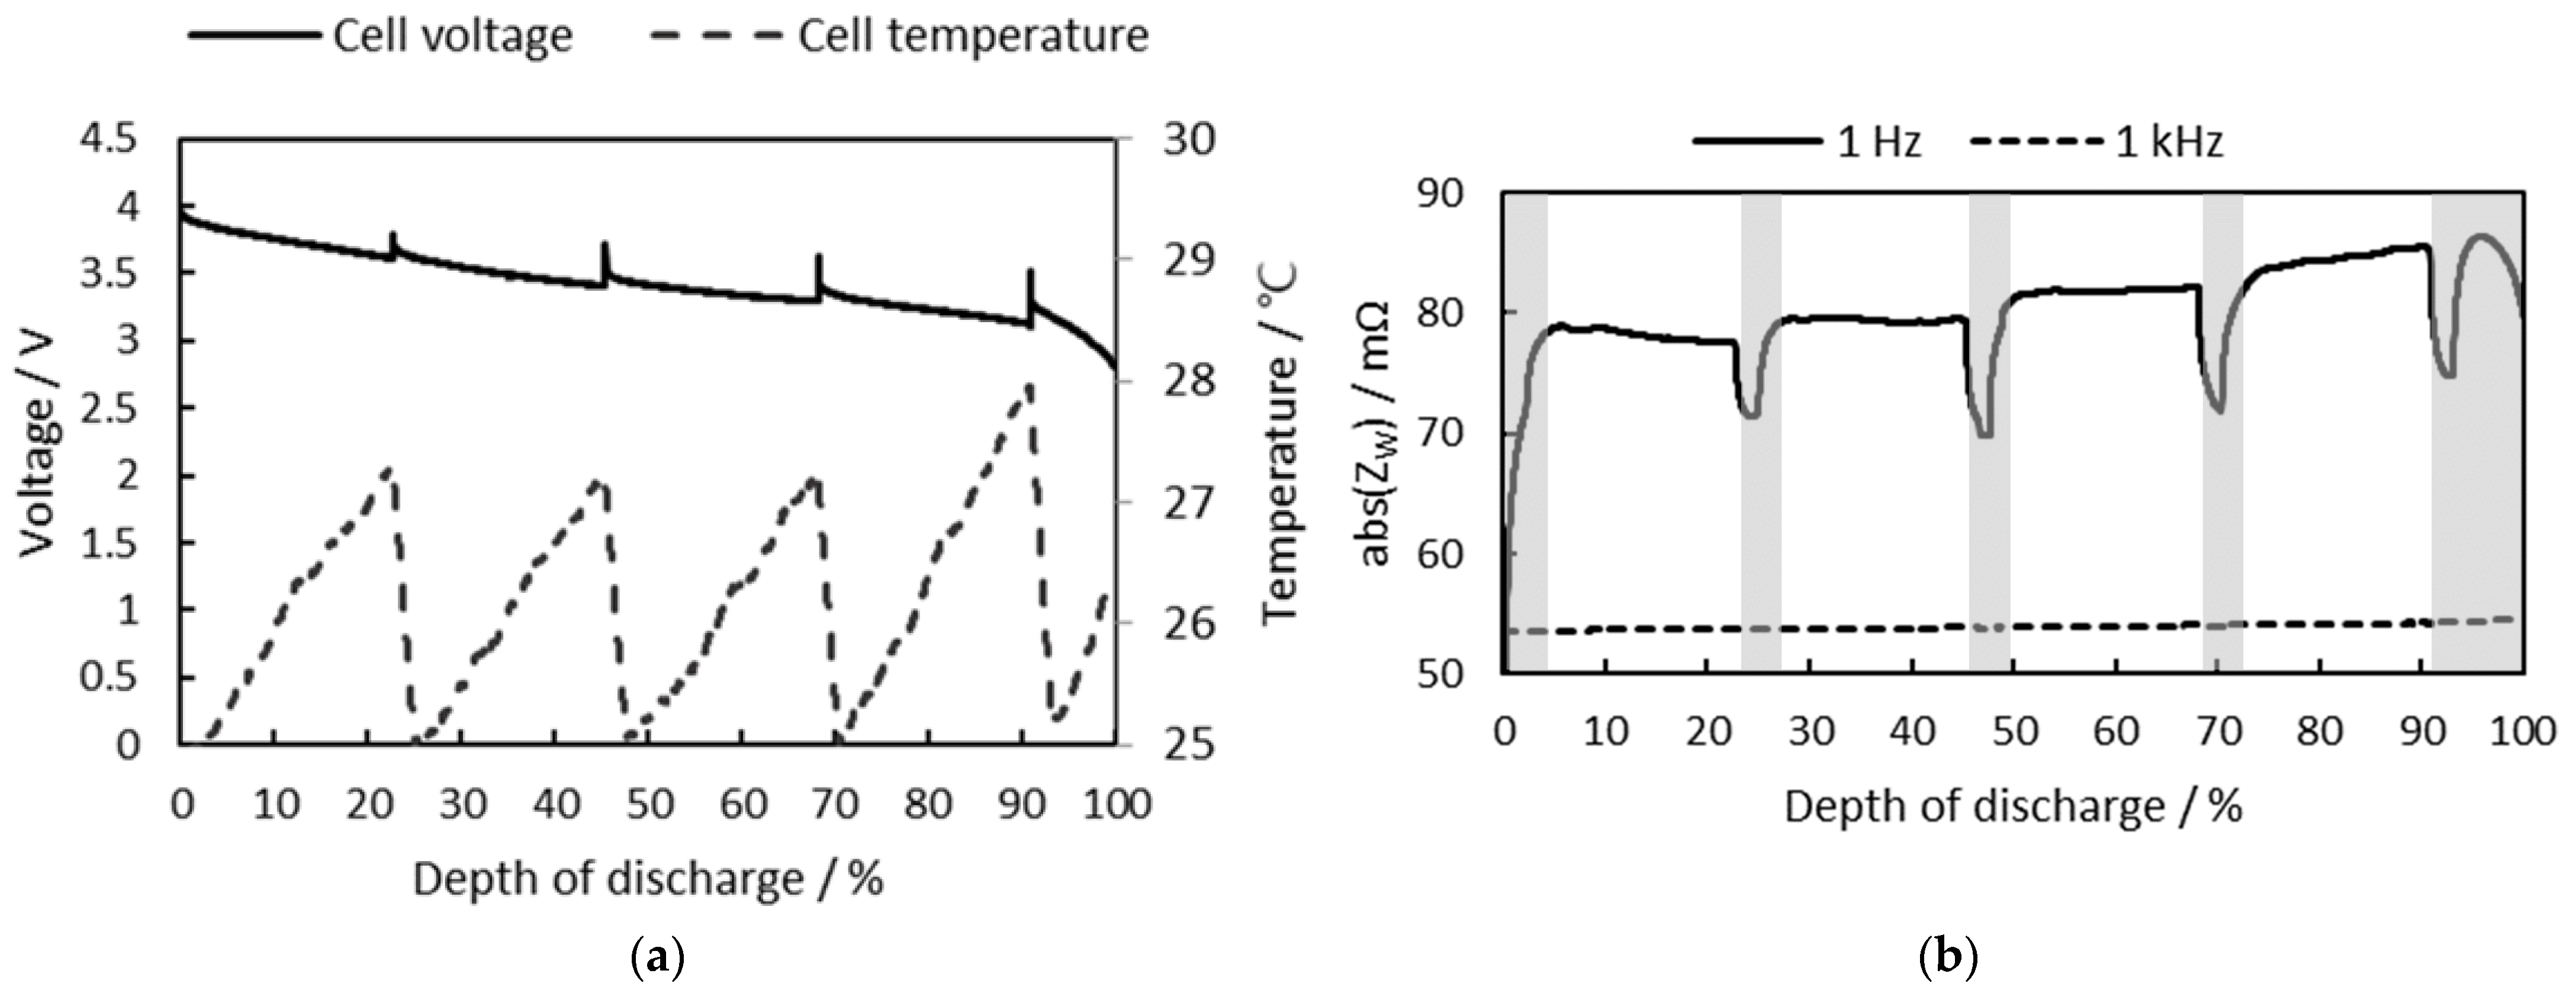
3.2.1. Consideration of Cell Temperature

The change in temperature of a battery cell mainly depends on the C-rate, discharge time, relaxation time, and ambient temperature [59]. Figure 6 shows the cell temperature that rises when the cell is discharged at 1C current from DoD 0% to 100% in a temperature chamber set to 25 °C (same experimental conditions as shown in Table 2).
To measure the cell impedance at each constant temperature, cell impedances are measured through an EIS instrument (IM6ex from Zahner-Elektrik GmbH & CoKG) in a temperature chamber set to 20, 25, 30, and 35 °C. The measurement conditions are shown in Table 3.
The measurement results are shown in Figure 7 as a Nyquist plot and a Bode plot.
As shown in Figure 7, the higher the cell temperature, the lower the cell impedance, and the 1 Hz impedance is more affected by temperature than the 1 kHz impedance. Figure 8 shows the 1 Hz impedance measured at each temperature and a curve fitted with a quadratic equation.
Equation (8) is the quadratic equation fitted in Figure 8, where R 2 is 1.00 and RMSE is 0.19 mΩ.
Z ( T ) fitted = 0.03717 · T 2 3.217 · T + 133.3
where T is the cell temperature, and Z ( T ) fitted is the impedance obtained through the equation at the cell temperature T .
The measured 1 Hz impedance at various cell temperatures is uniformly adjusted to the cell impedance at 25 °C through Equation (9).
Z ( T ) adjusted = Z ( T ) measured ( Z ( T ) fitted Z ( 25 ) fitted )
where Z ( T ) adjusted is the adjusted impedance to 25 °C and Z ( T ) measured is the measured impedance at temperature T .
The result of Equation (9) applied to the 1 Hz impedance in Figure 3 is shown in Figure 9.
In Figure 9, the 1 Hz impedance increases with increasing cell DoD. The higher the cell DoD, the higher the cell temperature (Figure 6), and as the cell temperature increases, the cell impedance decreases (Figure 8). Figure 9 shows the impedance when the impedance of Figure 3 is adjusted to a lower temperature of 25 °C. Therefore, the temperature-adjusted 1 Hz impedance in Figure 9 becomes higher than the 1 Hz impedance in Figure 3.

3.2.2. Consideration of Cell SoH

As mentioned above, cell 1 Hz impedance is affected by cell SoH as well as cell temperature. The cell SoH can be estimated via the 1 kHz impedance even if the cell SoC is unknown (Section 3.1). The cell SoH obtained in Equation (7) is used for normalizing the 1 Hz impedance. The measured cell 1 Hz impedance ( Z measured ) can be normalized to Z norm by Equation (10).
Z norm = ( Z measured Z min ) / ( Z max Z min ) × 100
In Equation (10), Z max and Z min represent the maximum and minimum values of the impedance between DoD 10% and 90% and can be obtained by Equations (11) and (12), respectively. In Equation (11), R 2 is 1.00 and RMSE is 0.12 mΩ, and in Equation (12), R 2 is 1.00 and RMSE is 0.26 mΩ.
Z max = 0.00593 · SoH 2 + 0.79922   SoH + 63.09
Z min = 0.2969 · SoH + 103.1
The result of applying Equation (10) to the 1 Hz impedance in Figure 9 is shown in Figure 10.
The average of the normalized impedance at each SoH is fitted with a cubic equation and plotted as a curve in Figure 10. This fitted curve is expressed by Equation (13) and has an R 2 of 1.00 and an RMSE of 1.51.
Z norm = 0.00014 · SoC 3 + 0.032 · SoC 2 0.85 · SoC + 7.58
Table 4 shows each R 2 and RMSE when Equation (13) is applied to cells with different SoHs.
Because of the cell nonlinear response mentioned above, SoC estimation using 1 Hz impedance is made here between DoD 10% and 90%.

3.2.3. Battery Cell SoC Estimation at Different Initial SoCs

Section 3.2.2 shows the results of SoC estimation when a fully charged cell is fully discharged. However, battery cells are not always operated in a fully charged state. Here, battery cell SoC estimation at different cell initial SoCs is emulated. A total of 10 min of cell discharge and 60 min of cell relaxation are repeated until the cell is completely discharged. The cell impedance is measured every second while the cell is discharging, and each cell state after the relaxations represents the cell state at different initial SoCs. The experimental conditions are shown in Table 5.
Figure 11a shows the cell voltage and cell temperature for the cell DoD, and Figure 11b shows the 1 Hz and 1 kHz impedances.
As shown in Figure 11a, the cell voltage drops while the cell is discharging and increases during each relaxation. At the same time, the cell temperature increases while the cell is discharged and decreases during the relaxation time. Figure 11b shows that cell 1 Hz impedance is more affected by DoD than 1 kHz impedance. The cell 1 kHz impedance is relatively constant for DoD changes and can be used for cell SoH estimation as shown in Section 3.1, while the 1 Hz impedance is highly influenced by DoD, and it is used for SoC estimation.
In Figure 11b, the DoD ranges where the 1 Hz impedance cannot be measured correctly are shown in gray. As explained earlier in Chapter 3, the cell 1 Hz impedance is not measured correctly at the beginning of each discharge, especially due to the nonlinearity of the cell discharge curve due to activation polarization shown in Figure 4. Each of these gray ranges in Figure 11b corresponds to 265 s. In addition, the range from DoD 95% in Figure 11b is also included in these gray ranges, as this range corresponds to the concentration polarization region in Figure 4. However, it should be noted that in most cell operations where cells are rarely fully discharged, a range that cell impedance cannot be measured correctly only appear once in the beginning of cell discharge. In Figure 11b, multiple gray ranges are shown because the impedance at the beginning of the discharge in different initial SoCs is shown in a single figure.
The 1 Hz impedance of Figure 11b adjusted to the cell temperature is shown in Figure 12a. Equation (9) is used to take into account the effects of cell temperature. The temperature-adjusted 1 Hz impedance is then normalized to the cell SoH, and the result is shown as a dotted line in Figure 12b. Equation (10) is used to normalize the temperature-adjusted impedance to the cell SoH.
The cell SoC can be estimated by applying Equation (13) to Figure 12b, where R 2 is 0.99 and RMSE is 3.07 mΩ. Cell impedance in grayed-out ranges is excluded from SoC estimation. These ranges include a range of 265 s after the start of the discharge and a range of cell DoD exceeding 95%. The purpose of this experiment is to show that SoC estimation is possible even when discharges are initiated from different cell SoCs, so it can lead to misunderstanding that there are too many grayed-out ranges where SoC estimation is impossible. Again, in most cases when battery cells are used, this grayed-out range appears only once a battery cell begins to discharge and rarely twice when the cell is completely discharged.

4. Conclusions and Discussion

This paper introduces a SoC monitoring method of Li-ion battery cells using impedance measurement. For accurate SoC estimation, the estimated cell SoH is considered with the measured temperature. Unlike traditional EIS measurement methods, the proposed method does not require impedance at wide frequencies, saving measurement time and simplifying measurement saves hardware costs. Especially, a multi-sine signal is applied to measure the cell impedance at two frequencies simultaneously. The cell impedance at 1 kHz for SoH estimation and the cell impedance at 1 Hz for SoC estimation are used. As a result, the proposed cell SoC monitoring method enables simultaneous estimation of unknown cell SoH and SoC. This is verified through an experiment in several different initial SoCs in a cell as well.
One problem to be pointed out is that at the start of battery cell discharge (ca. 265 s at 1C) and in the high DoD range (over ca. 95%), accurate cell impedance measurement is not possible due to the large nonlinearity in the cell voltage response; hence, the SoC cannot be correctly estimated. Nonetheless, the proposed SoC estimation method using impedance can be used together with the SoC estimation method using cell voltage without any additional hardware or measurement. This is because the proposed method already measures the cell voltage response to obtain cell impedance. At the same time, this SoC estimation method using cell impedance can compensate for the weaknesses of the existing SoC estimation methods using cell voltage. The voltage of the Li-ion battery cell drops significantly at the beginning and end of the discharge. This enables SoC estimation as a simple method through cell voltage measurement. However, the decrease in voltage in the middle region of the cell discharge curve, the so-called “flat plateau”, is not significantly noticeable, and this is one of the factors that makes it difficult to estimate SoC simply with the measured cell voltage. In particular, this flat plateau is notorious for estimating the SoC of lithium iron phosphate (LFP) battery cells. Contrariwise, this flat plateau makes impedance measurements more accurate. This is because accurate impedance measurement is possible when the target system is linear. That is, when the proposed method is used, SoC and SoH estimation is possible on this flat plateau and even more accurate.
In this paper, only the experimental results of lithium nickel manganese cobalt oxide (NMC) type cells are shown. The proposed method is based on EIS, which has already been validated in other types of battery cells through numerous literatures. Thus, it can be expected to be applied to other types of Li-ion cells. Nevertheless, it is worth comparing the results of applying this method to other types of cells in future studies.
This paper only deals with SoC estimation during battery cell discharge. Accurate SoC estimation during cell charging is also worth studying. However, there is the problem that this method is only possible during CC charging. This is because the offset current changes frequently during CV charging, making it impossible to measure the impedance correctly. If SoC estimation is possible only during CC charging, the range of SoC that can be estimated is limited. The authors evaluate that monitoring SoC under this limited condition does not have a definite advantage; hence, this is not covered in this paper.
Lastly, the experiments in this paper consider the estimation of the state of a cell discharged at room temperature. Therefore, the experiment is conducted between 20 and 35 °C. However, since the cell state estimation method in this paper has the advantage of considering the effect of cell temperature on impedance, experiments will be conducted in a wider temperature range for wider application of this method in the future.

Author Contributions

Conceptualization, methodology, validation, software, hardware implementation, writing—original draft preparation J.K. (Jonghyeon Kim); writing—review and editing, supervision, counseling J.K. (Julia Kowal); All authors have read and agreed to the published version of the manuscript.

Funding

This research was funded by DAAD (German Academic Exchange Service), Research Grants—Doctoral Programmes in Germany.

Institutional Review Board Statement

Not applicable.

Informed Consent Statement

Not applicable.

Data Availability Statement

Not applicable.

Conflicts of Interest

The authors declare no conflict of interest. The funder had no role in the design of the study; in the collection, analyses, or interpretation of data; in the writing of the manuscript; or in the decision to publish the results.

References

  1. Tarascon, J.-M.; Armand, M. Issues and challenges facing rechargeable lithium batteries. In Materials for Sustainable Energy; Nature Publishing Group: Berlin, Germany, 2011; pp. 171–179. [Google Scholar] [CrossRef]
  2. Goodenough, J.B.; Kim, Y. Challenges for rechargeable batteries. J. Power Source 2011, 196, 6688–6694. [Google Scholar] [CrossRef]
  3. Lu, L.; Han, X.; Li, J.; Hua, J.; Ouyang, M. A review on the key issues for lithium-ion battery management in electric vehicles. J. Power Source 2013, 226, 272–288. [Google Scholar] [CrossRef]
  4. Goodenough, J.B.; Kim, Y. Challenges for rechargeable Li batteries. Chem. Mater. 2010, 22, 587–603. [Google Scholar] [CrossRef]
  5. Armand, M.; Tarascon, J.-M. Building better batteries. Nature 2008, 451, 652–657. [Google Scholar] [CrossRef] [PubMed]
  6. Biensan, P.; Simon, B.; Peres, J.P.; de Guibert, A.; Broussely, M.; Bodet, J.M.; Perton, F. On safety of lithium-ion cells. J. Power Source 1999, 81, 906–912. [Google Scholar] [CrossRef]
  7. Doughty, D.H.; Roth, E.P. A general discussion of Li ion battery safety. Electrochem. Soc. Interface 2012, 21, 37. [Google Scholar]
  8. Belov, D.; Yang, M. Failure mechanism of Li-ion battery at overcharge conditions. J. Solid State Electrochem. 2008, 12, 885–894. [Google Scholar] [CrossRef]
  9. Yuan, Q.; Zhao, F.; Wang, W.; Zhao, Y.; Liang, Z.; Yan, D. Overcharge failure investigation of lithium-ion batteries. Electrochim. Acta 2015, 178, 682–688. [Google Scholar] [CrossRef]
  10. Tobishima, S.; Yamaki, J. Aconsideration of lithium cell safety. J. Power Source 1999, 81, 882–886. [Google Scholar] [CrossRef]
  11. Leising, R.A.; Palazzo, M.J.; Takeuchi, E.S.; Takeuchi, K.J. Abuse testing of lithium-ion batteries: Characterization of the overcharge reaction of LiCoO2/graphite cells. J. Electrochem. Soc. 2001, 148, A838. [Google Scholar] [CrossRef]
  12. Finegan, D.P.; Scheel, M.; Robinson, J.B.; Tjaden, B.; di Michiel, M.; Hinds, G.; Brett, D.J.L.; Shearing, P.R. Investigating lithium-ion battery materials during overcharge-induced thermal runaway: An operando and multi-scale X-ray CT study. Phys. Chem. Chem. Phys. 2016, 18, 30912–30919. [Google Scholar] [CrossRef] [PubMed] [Green Version]
  13. Sun, J.; Li, J.; Zhou, T.; Yang, K.; Wei, S.; Tang, N.; Dang, N.; Li, H.; Qiu, X.; Chen, L. Toxicity, a serious concern of thermal runaway from commercial Li-ion battery. Nano Energy 2016, 27, 313–319. [Google Scholar] [CrossRef]
  14. Larsson, F.; Mellander, B.-E. Abuse by external heating, overcharge and short circuiting of commercial lithium-ion battery cells. J. Electrochem. Soc. 2014, 161, A1611. [Google Scholar] [CrossRef]
  15. Wang, Q.; Ping, P.; Zhao, X.; Chu, G.; Sun, J.; Chen, C. Thermal runaway caused fire and explosion of lithium ion battery. J. Power Source 2012, 208, 210–224. [Google Scholar] [CrossRef]
  16. Zheng, Y.; Qian, K.; Luo, D.; Li, Y.; Lu, Q.; Li, B.; He, Y.-B.; Wang, X.; Li, J.; Kang, F. Influence of over-discharge on the lifetime and performance of LiFePO4/graphite batteries. RSC Adv. 2016, 6, 30474–30483. [Google Scholar] [CrossRef]
  17. Zhang, L.; Ma, Y.; Cheng, X.; Du, C.; Guan, T.; Cui, Y.; Sun, S.; Zuo, P.; Gao, Y.; Yin, G. Capacity fading mechanism during long-term cycling of over-discharged LiCoO2/mesocarbon microbeads battery. J. Power Source 2015, 293, 1006–1015. [Google Scholar] [CrossRef]
  18. Maleki, H.; Howard, J.N. Effects of overdischarge on performance and thermal stability of a Li-ion cell. J. Power Source 2006, 160, 1395–1402. [Google Scholar] [CrossRef]
  19. Li, H.-F.; Gao, J.-K.; Zhang, S.-L. Effect of overdischarge on swelling and recharge performance of lithium ion cells. Chin. J. Chem. 2008, 26, 1585–1588. [Google Scholar] [CrossRef]
  20. Piller, S.; Perrin, M.; Jossen, A. Methods for state-of-charge determination and their applications. J. Power Source 2001, 96, 113–120. [Google Scholar] [CrossRef]
  21. Pop, V.; Bergveld, H.J.; Danilov, D.; Regtien, P.P.L.; Notten, P.H.L. State-of-the-art of battery state-of-charge determination. In Battery Management Systems: Accurate State-of-Charge Indication for Battery-Powered Applications; Springer Science & Business Media: Berlin/Heidelberg, Germany, 2008; pp. 11–45. [Google Scholar] [CrossRef]
  22. Rodrigues, S.; Munichandraiah, N.; Shukla, A.K. A review of state-of-charge indication of batteries by means of ac impedance measurements. J. Power Source 2000, 87, 12–20. [Google Scholar] [CrossRef]
  23. Plett, G.L. Extended Kalman filtering for battery management systems of LiPB-based HEV battery packs. J. Power Source 2004, 134, 277–292. [Google Scholar] [CrossRef]
  24. Kim, I.-S. The novel state of charge estimation method for lithium battery using sliding mode observer. J. Power Source 2006, 163, 584–590. [Google Scholar] [CrossRef]
  25. Kim, I.-S. Nonlinear State of Charge Estimator for Hybrid Electric Vehicle Battery. IEEE Trans. Power Electron. 2008, 23, 2027–2034. [Google Scholar] [CrossRef]
  26. Barsoukov, E.; Macdonald, J.R. Impedance Spectroscopy: Theory, Experiment, and Applications, 3rd ed.; Barsoukov, E., Macdonald, J.R., Eds.; John Wiley & Sons: Hoboken, NJ, USA, 2017; ISBN 978-1-119-07408-3. [Google Scholar]
  27. Orazem, M.E.; Tribollet, B. Electrochemical Impedance Spectroscopy; John Wiley & Sons: Hoboken, NJ, USA, 2008; pp. 383–389. [Google Scholar]
  28. Tröltzsch, U.; Kanoun, O.; Tränkler, H.-R. Characterizing aging effects of lithium ion batteries by impedance spectroscopy. Electrochim. Acta 2006, 51, 1664–1672. [Google Scholar] [CrossRef]
  29. Buller, S.; Thele, M.; Karden, E.; de Doncker, R.W. Impedance-based non-linear dynamic battery modeling for automotive applications. J. Power Source 2003, 113, 422–430. [Google Scholar] [CrossRef]
  30. Buller, S. Impedance-Based Simulation Models for Energy Storage Devices in Advanced Automotive Power Systems; Shaker Verlag GmbH: Düren, Germany, 2003; ISBN 3832212256. [Google Scholar]
  31. Huet, F. A review of impedance measurements for determination of the state-of-charge or state-of-health of secondary batteries. J. Power Source 1998, 70, 59–69. [Google Scholar] [CrossRef]
  32. Fleischer, C.; Waag, W.; Heyn, H.M.; Sauer, D.U. On-line adaptive battery impedance parameter and state estimation considering physical principles in reduced order equivalent circuit battery models part 2. Parameter and state estimation. J. Power Source 2014, 262, 457–482. [Google Scholar] [CrossRef]
  33. Vetter, J.; Novák, P.; Wagner, M.R.; Veit, C.; Möller, K.-C.; Besenhard, J.O.; Winter, M.; Wohlfahrt-Mehrens, M.; Vogler, C.; Hammouche, A. Ageing mechanisms in lithium-ion batteries. J. Power Source 2005, 147, 269–281. [Google Scholar] [CrossRef]
  34. Abraham, D.P.; Knuth, J.L.; Dees, D.W.; Bloom, I.; Christophersen, J.P. Performance degradation of high-power lithium-ion cells—Electrochemistry of harvested electrodes. J. Power Source 2007, 170, 465–475. [Google Scholar] [CrossRef]
  35. Thomas, E.V.; Bloom, I.; Christophersen, J.P.; Battaglia, V.S. Statistical methodology for predicting the life of lithium-ion cells via accelerated degradation testing. J. Power Source 2008, 184, 312–317. [Google Scholar] [CrossRef]
  36. Belt, J.R.; Ho, C.D.; Miller, T.J.; Habib, M.A.; Duong, T.Q. The effect of temperature on capacity and power in cycled lithium ion batteries. J. Power Source 2005, 142, 354–360. [Google Scholar] [CrossRef]
  37. Qahouq, J.A.A. Online battery impedance spectrum measurement method. In Proceedings of the 2016 IEEE Applied Power Electronics Conference and Exposition (APEC), Long Beach, CA, USA, 20–24 March 2016; pp. 3611–3615, ISBN 1467395501. [Google Scholar]
  38. Waag, W.; Fleischer, C.; Sauer, D.U. On-line estimation of lithium-ion battery impedance parameters using a novel varied-parameters approach. J. Power Source 2013, 237, 260–269. [Google Scholar] [CrossRef]
  39. Do, D.V.; Forgez, C.; Benkara, K.E.K.; Friedrich, G. Impedance observer for a Li-ion battery using Kalman filter. IEEE Trans. Veh. Technol. 2009, 58, 3930–3937. [Google Scholar]
  40. Huang, W.; Qahouq, J.A.A. An online battery impedance measurement method using DC–DC power converter control. IEEE Trans. Ind. Electron. 2014, 61, 5987–5995. [Google Scholar] [CrossRef]
  41. Howey, D.A.; Mitcheson, P.D.; Yufit, V.; Offer, G.J.; Brandon, N.P. Online measurement of battery impedance using motor controller excitation. IEEE Trans. Veh. Technol. 2013, 63, 2557–2566. [Google Scholar] [CrossRef]
  42. Ojarand, J.; Min, M.; Annus, P. Crest factor optimization of the multisine waveform for bioimpedance spectroscopy. Physiol. Meas. 2014, 35, 1019. [Google Scholar] [CrossRef]
  43. Sanchez, B.; Vandersteen, G.; Bragos, R.; Schoukens, J. Optimal multisine excitation design for broadband electrical impedance spectroscopy. Meas. Sci. Technol. 2011, 22, 115601. [Google Scholar] [CrossRef]
  44. Breugelmans, T.; Tourwé, E.; van Ingelgem, Y.; Wielant, J.; Hauffman, T.; Hausbrand, R.; Pintelon, R.; Hubin, A. Odd random phase multisine EIS as a detection method for the onset of corrosion of coated steel. Electrochem. Commun. 2010, 12, 2–5. [Google Scholar] [CrossRef]
  45. Kim, J.; Krüger, L.; Kowal, J. On-line state-of-health estimation of Lithium-ion battery cells using frequency excitation. J. Energy Storage 2020, 32, 101841. [Google Scholar] [CrossRef]
  46. Barai, A.; Gael, H.C.; Guo, Y.; McGordon, A.; Jennings, P. A study on the impact of lithium-ion cell relaxation on electrochemical impedance spectroscopy. J. Power Source 2015, 280, 74–80. [Google Scholar] [CrossRef]
  47. Frank, M.K.; Noel, A.; Simon, V.E.; Jossen, A. Long-term equalization effects in Li-ion batteries due to local state of charge inhomogeneities and their impact on impedance measurements. Electrochim. Acta 2015, 185, 107–116. [Google Scholar] [CrossRef]
  48. Wood, E.; Alexander, M.; Thomas, H.B. Investigation of battery end-of-life conditions for plug-in hybrid electric vehicles. J. Power Source 2011, 196, 5147–5154. [Google Scholar] [CrossRef]
  49. Faria, R.; Marques, P.; Garcia, R.; Moura, P.; Freire, F.; Delgado, J.; de Aníbal, T. Primary and secondary use of electric mobility batteries from a life cycle perspective. J. Power Source 2014, 262, 169–177. [Google Scholar] [CrossRef]
  50. Han, X.; Ouyang, M.; Lu, L.; Li, J. A comparative study of commercial lithium ion battery cycle life in electric vehicle: Capacity loss estimation. J. Power Source 2014, 268, 658–669. [Google Scholar] [CrossRef]
  51. Stoynov, Z.B.; Vladjkova, D.E. Measurement Methods | Electrochemical: Impedance spectroscopy. In Encyclopedia of Electrochemical Power Source; Elsevier: Amsterdam, The Netherlands, 2009; pp. 632–642. [Google Scholar] [CrossRef]
  52. Wang, X.; Wei, X.; Zhu, J.; Dai, H.; Zheng, Y.; Xu, X.; Chen, Q. A review of modeling, acquisition, and application of lithium-ion battery impedance for onboard battery management. eTransportation 2021, 7, 100093. [Google Scholar] [CrossRef]
  53. Jiang, K.; Liu, X.; Lou, G.; Wen, Z.; Liu, L. Parameter sensitivity analysis and cathode structure optimization of a non-aqueous Li–O2 battery model. J. Power Source 2020, 451, 227821. [Google Scholar] [CrossRef]
  54. Liu, L.; Zhu, M. Modeling of SEI Layer Growth and Electrochemical impedance spectroscopy response using a thermal-electrochemical model of li-ion batteries. ECS Trans. 2014, 61, 43–61. [Google Scholar] [CrossRef]
  55. Liu, L.; Guan, P. Phase-field modeling of solid electrolyte interphase (SEI) evolution: Considering cracking and dissolution during battery cycling. ECS Trans. 2019, 89, 101–111. [Google Scholar] [CrossRef]
  56. Stiaszny, B.; Ziegler, J.C.; Krauß, E.E.; Zhang, M.; Schmidt, J.P.; Ivers-Tiffée, E. Electrochemical characterization and post-mortem analysis of aged LiMn2O4–NMC/graphite lithium ion batteries part II: Calendar aging. J. Power Source 2014, 258, 61–75. [Google Scholar] [CrossRef]
  57. Kim, J.-H.; Woo, S.C.; Park, M.-S.; Kim, K.J.; Yim, T.; Kim, J.-S.; Kim, Y.-J. Capacity fading mechanism of LiFePO4-based lithium secondary batteries for stationary energy storage. J. Power Source 2013, 229, 190–197. [Google Scholar] [CrossRef]
  58. Bagotsky, V.S. Fundamentals of Electrochemistry; John Wiley & Sons: Hoboken, NJ, USA, 2005; ISBN 9780471741985. [Google Scholar]
  59. Liu, S.; Liu, X.; Dou, R.; Zhou, W.; Wen, Z.; Liu, L. Experimental and simulation study on thermal characteristics of 18,650 lithium–iron–phosphate battery with and without spot–welding tabs. Appl. Therm. Eng. 2020, 166, 114648. [Google Scholar] [CrossRef]
Figure 1. (a) A block diagram of the measurement system; (b) a photo of the measurement system.
Batteries 07 00076 g001
Figure 2. Flow chart showing the cell state estimation process.
Batteries 07 00076 g002
Figure 3. 1 Hz and 1 kHz cell impedance during discharge of cells with different SoHs. The solid lines represent the 1 Hz impedance, the dotted lines represent the 1 kHz impedance, and the different brightness of the line represents the different cell SoH.
Batteries 07 00076 g003
Figure 4. Typical discharge curve of a battery cell, showing three different regions of polarization.
Batteries 07 00076 g004
Figure 5. Averages of 1 kHz impedance at each cell SoH (dotted line) and linear fit (solid line).
Batteries 07 00076 g005
Figure 6. The temperature change of the battery cell during discharging at 1C current.
Batteries 07 00076 g006
Figure 7. Cell impedance at each frequency at 20, 25, 30, and 35 °C. (a) Nyquist plot (O: 1 Hz, X: 1 kHz); (b) Bode plot.
Batteries 07 00076 g007
Figure 8. 1 Hz impedance measured at 20, 25, 30, and 35 °C (dotted line) and fitted curve (solid line).
Batteries 07 00076 g008
Figure 9. 1 Hz impedance adjusted to 25 °C.
Batteries 07 00076 g009
Figure 10. Normalized 1 Hz impedance vs. DoD.
Batteries 07 00076 g010
Figure 11. (a) Cell voltage (solid line) and cell temperature (dotted line) vs. DoD; (b) 1 Hz impedance (solid line) and 1 kHz impedance (dotted line) vs. DoD.
Batteries 07 00076 g011
Figure 12. (a) 1 Hz impedance adjusted to cell temperature vs. DoD; (b) temperature-adjusted 1 Hz impedance normalized to cell SoH (dotted line) and expected value (solid line) vs. DoD.
Batteries 07 00076 g012
Table 1. Specifications of the Li-ion cell.
ItemDescription
AnodeBased on intercalation graphite
CathodeBased on lithiated metal oxide 1
Product nameSamsung ICR 18650-26F
Battery systemLi-ion
Nominal voltage3.7 V
Rated capacity2.6 Ah
1 Consists of cobalt, nickel, and manganese.
Table 2. Experimental conditions for measuring cell impedance during discharge.
ParameterDescription
Chamber temperature25 °C
Depth of dischargeFrom 0 to 100%
DC bias2600 mA (1C)
f 1 ,   f 2 1 Hz, 1 kHz
Δ I 1 ,   Δ I 2 65 mA (each)
Table 3. Parameters for EIS measurement (Galvanostatic).
ParameterDescription
Cell temperature20, 25, 30, 35 °C
State of health80%
State of charge50%
DC bias0 mA
Frequency range0.2 to 2 kHz
AC amplitude100 mA
Table 4. Accuracy of SoC estimation in cells with different SoHs.
SoH R 2 RMSE
100%0.992.42
95%0.992.66
90%0.992.02
85%0.992.51
80%0.983.85
Average0.992.69
Table 5. Experimental conditions for SoC estimation of cells that start operating at different SoCs.
ParameterDescription
State of health80%
Chamber temperature25 °C
Discharge time10 min (each)
Relaxation time60 min (each)
Depth of dischargeFrom 0 to 100%
DC bias2600 mA (1C)
f 1 ,   f 2 1, 1000 Hz
Δ I 1 ,   Δ I 2 65 mA (each)
Publisher’s Note: MDPI stays neutral with regard to jurisdictional claims in published maps and institutional affiliations.

