
Electrical Characterization of Li-Ion Battery Modules for Second-Life Applications


Abstract
1. Introduction
2. Material and Methods
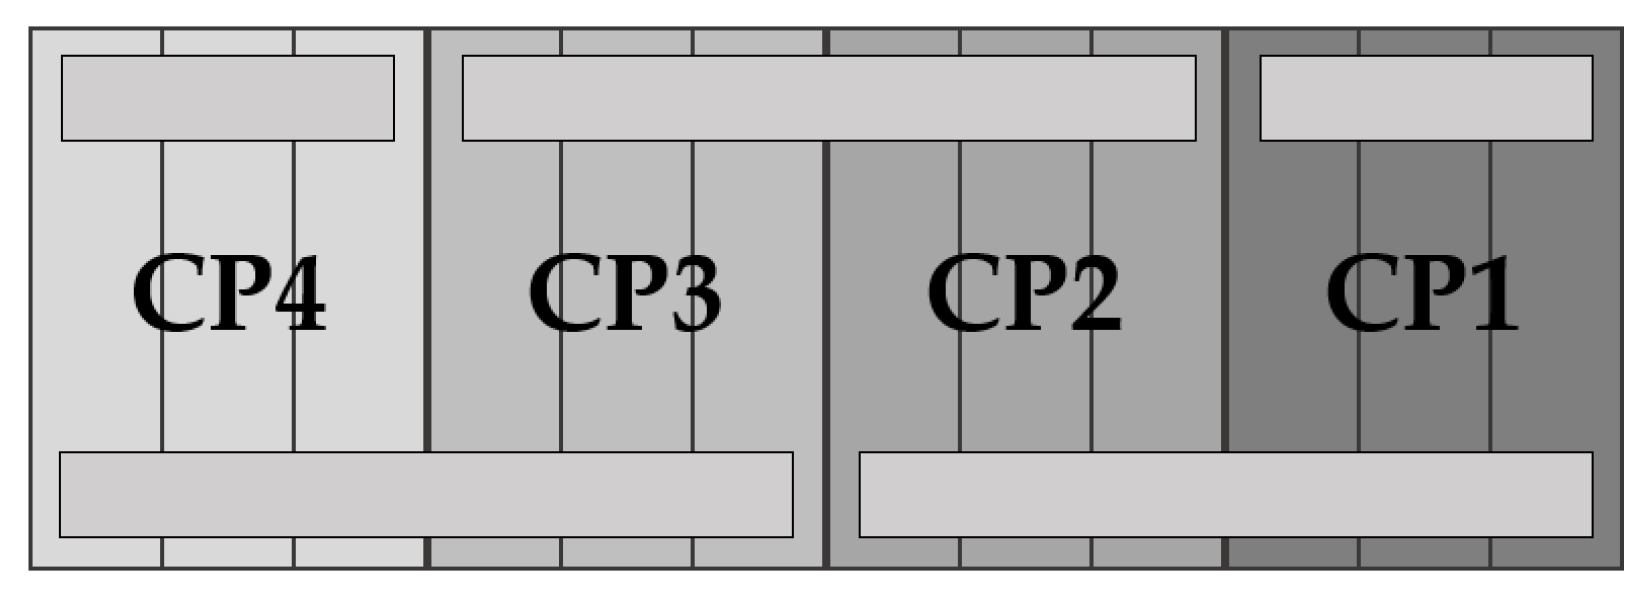
2.1. Test Objects
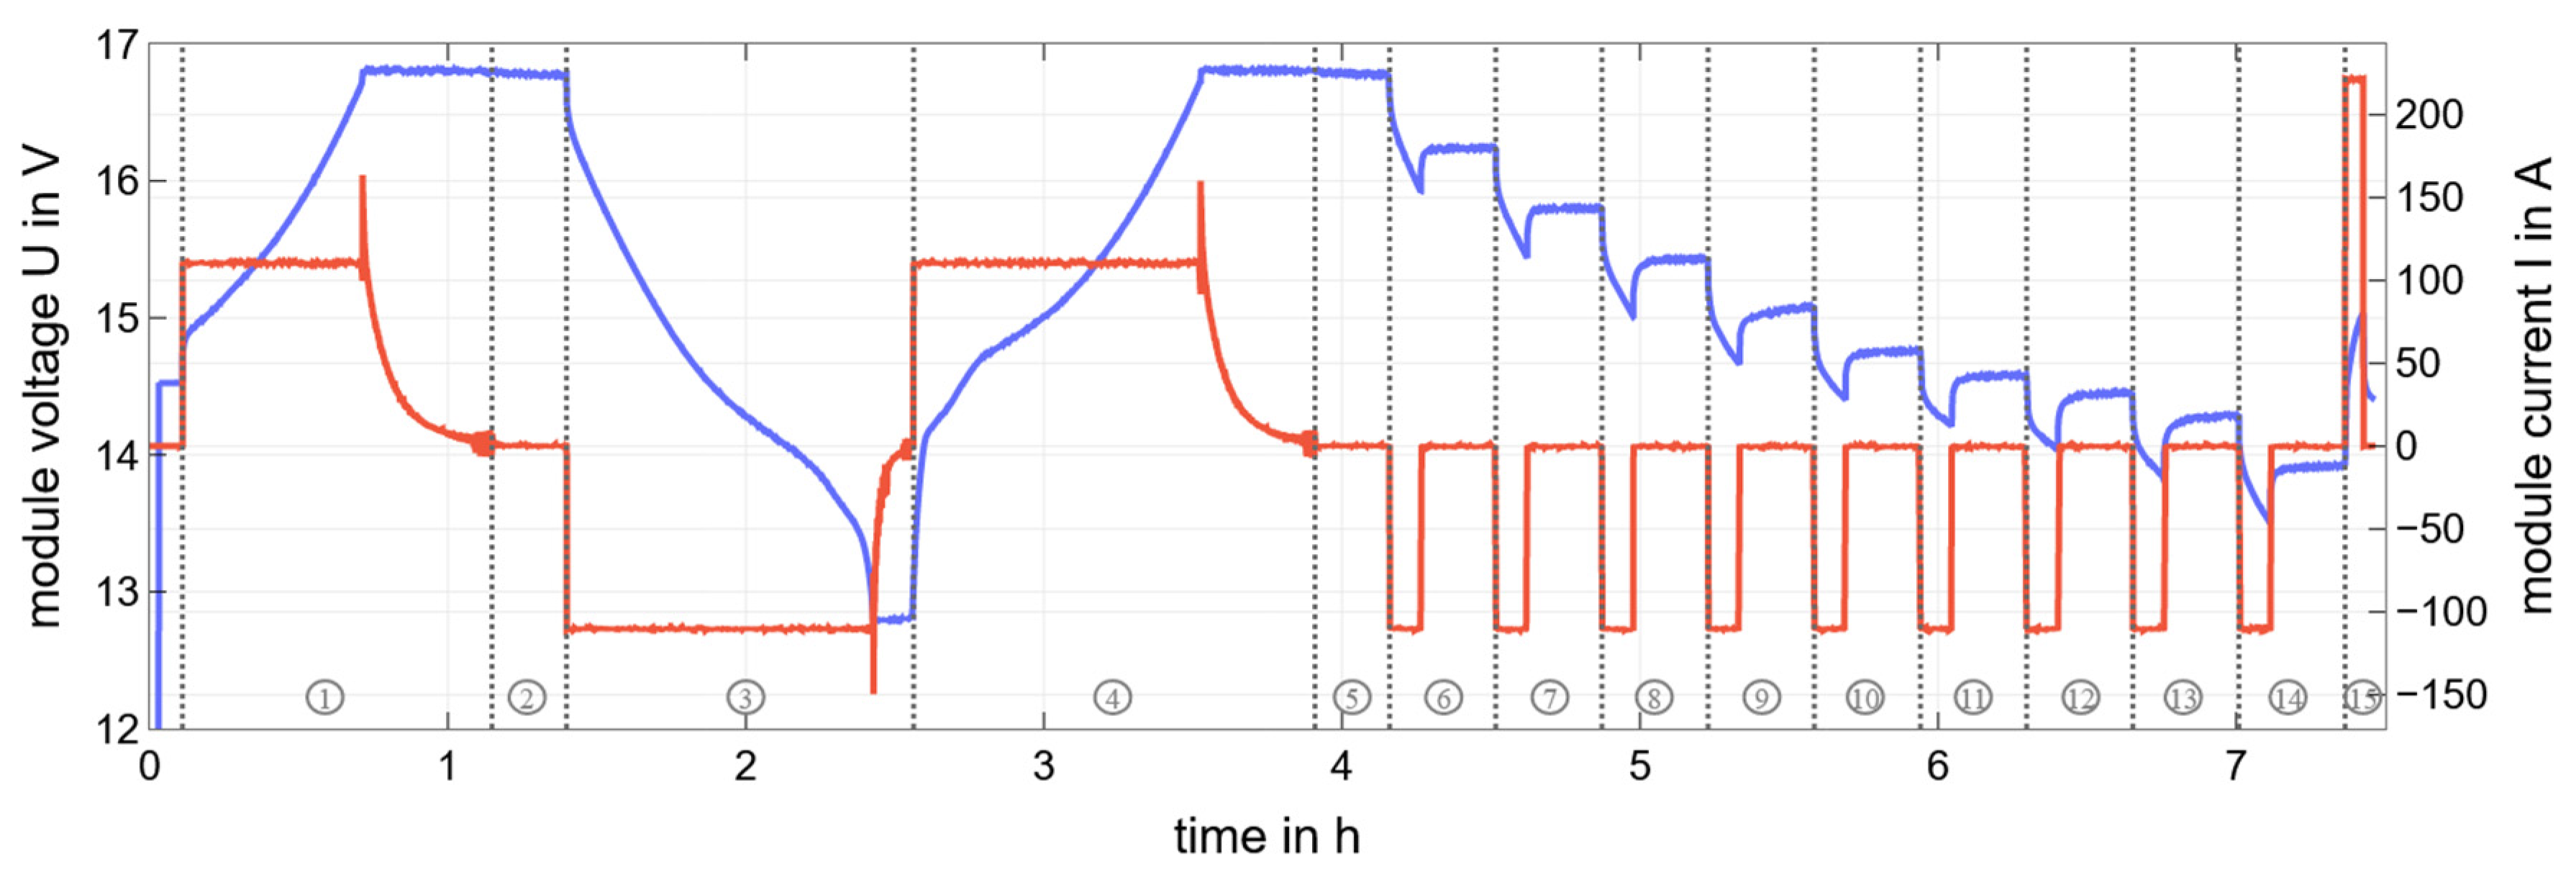
2.2. CI Method and Capacity Determination
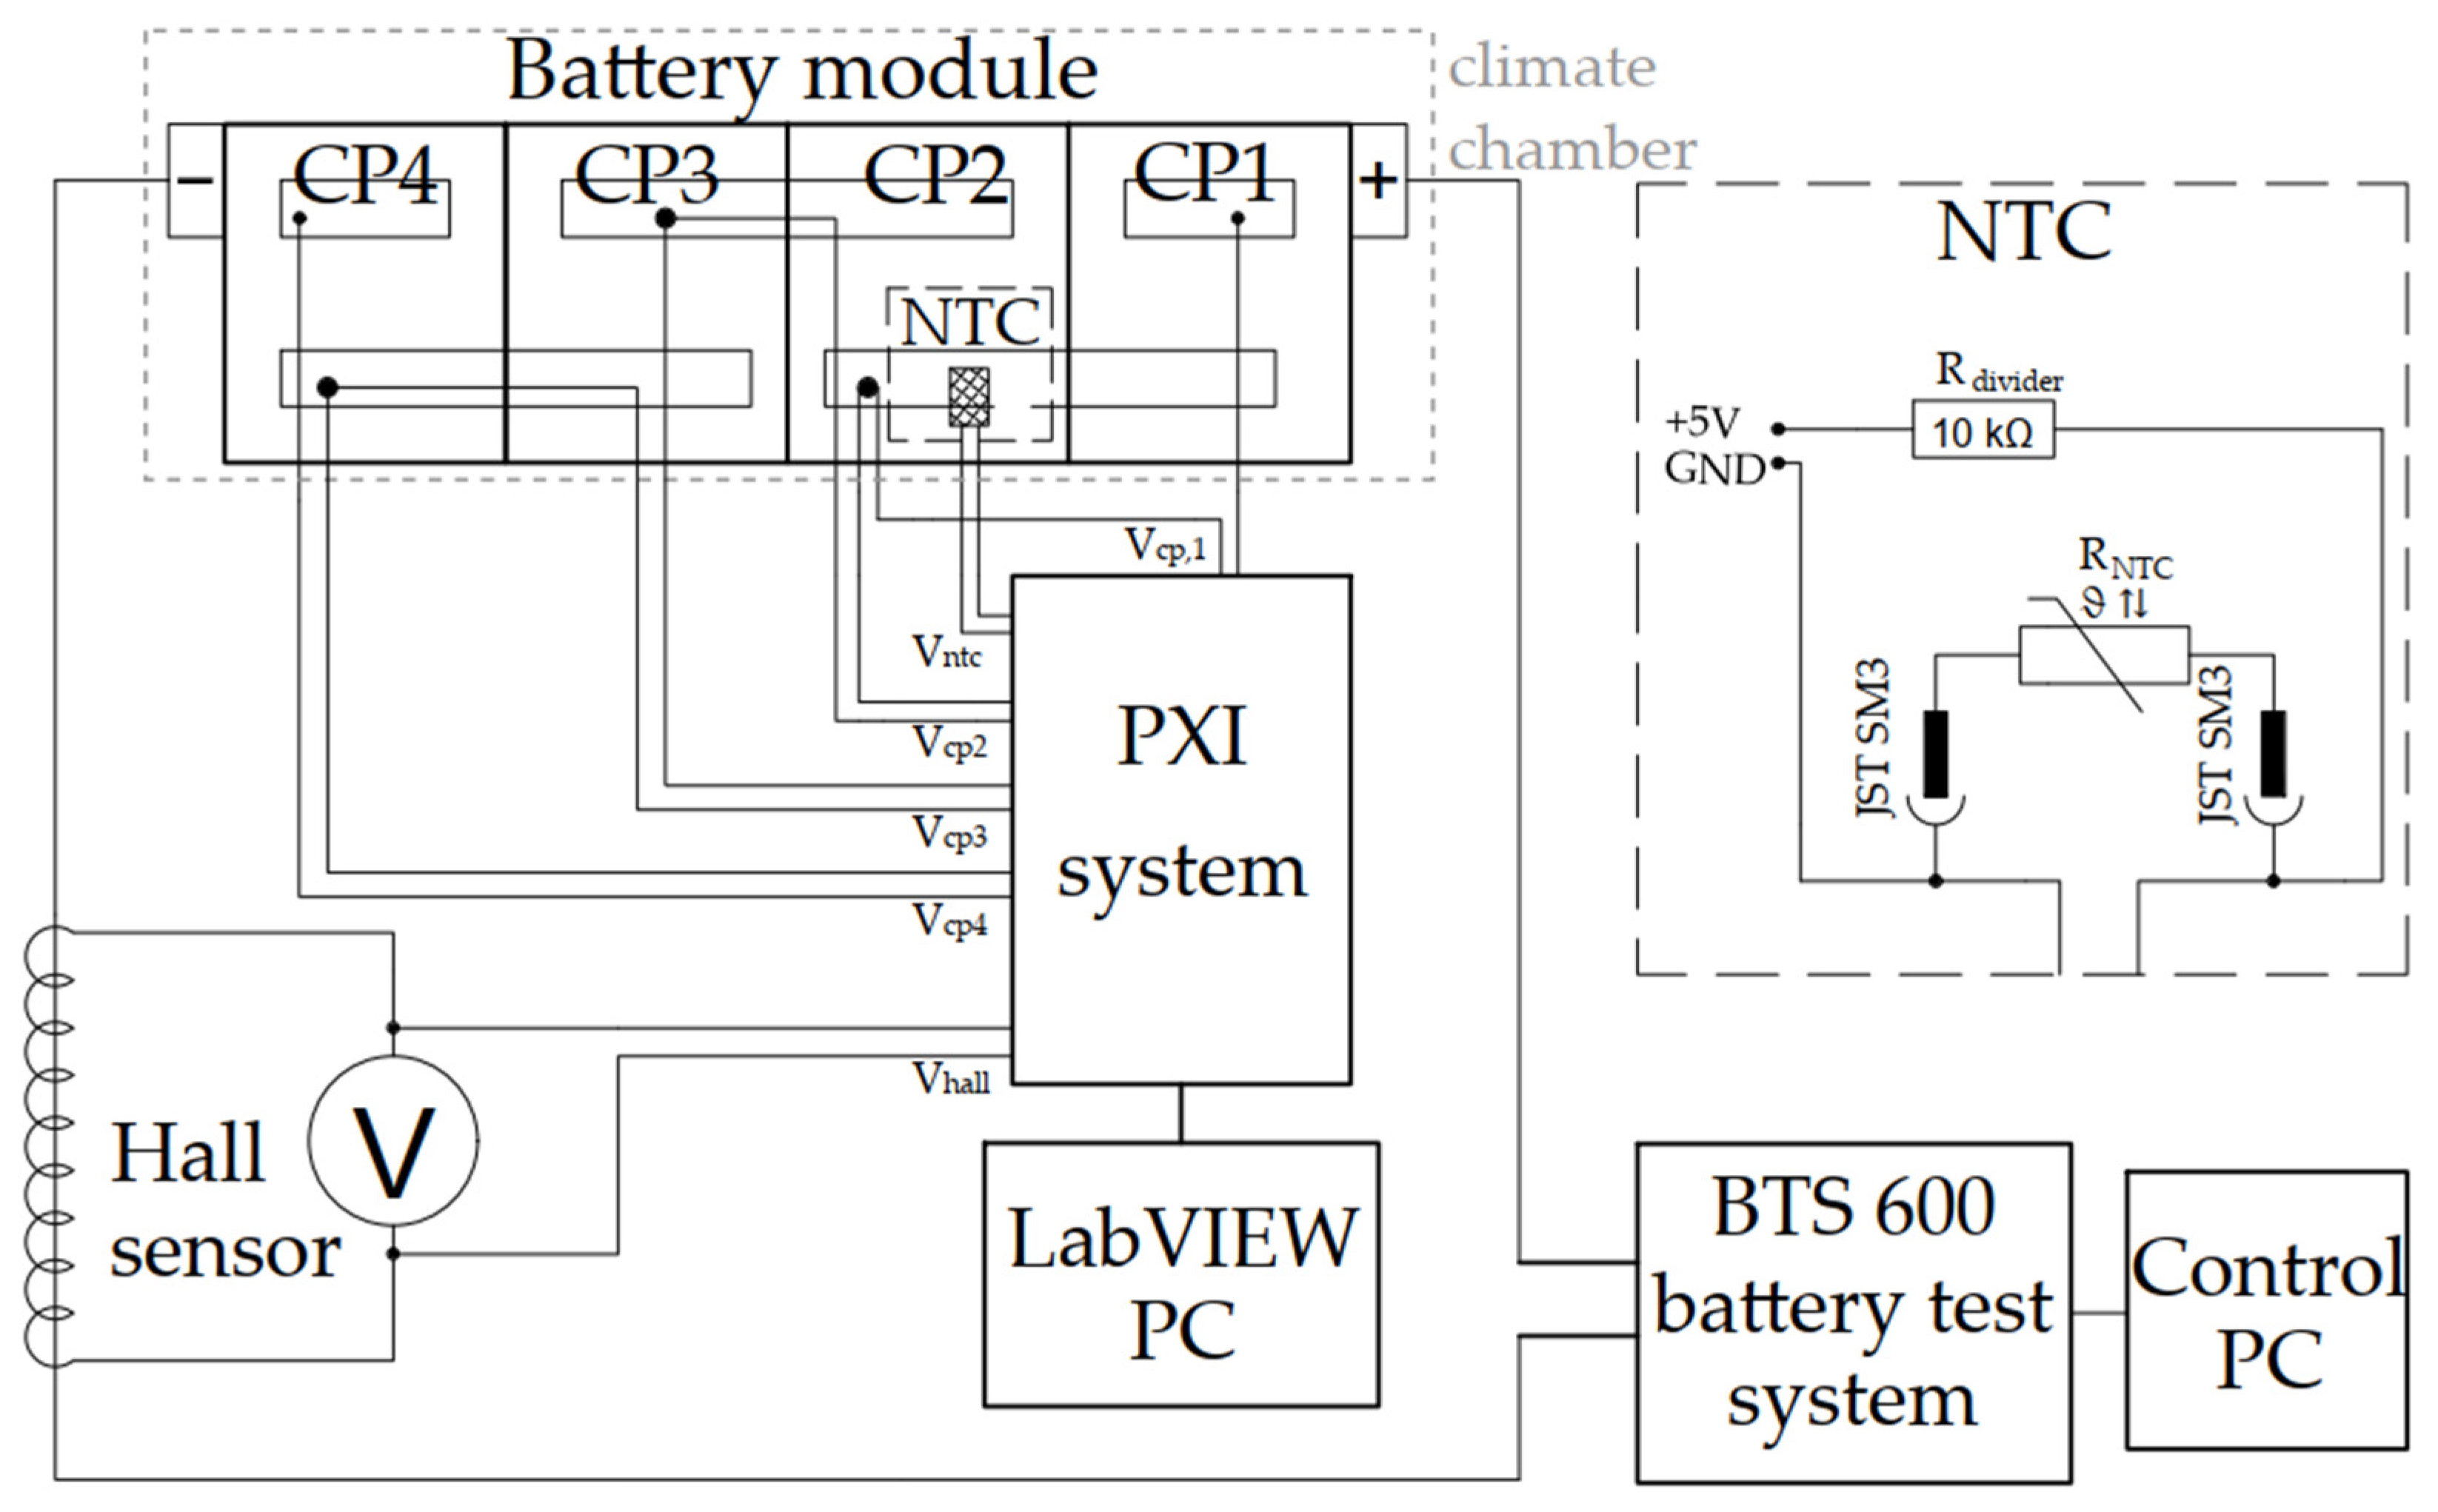
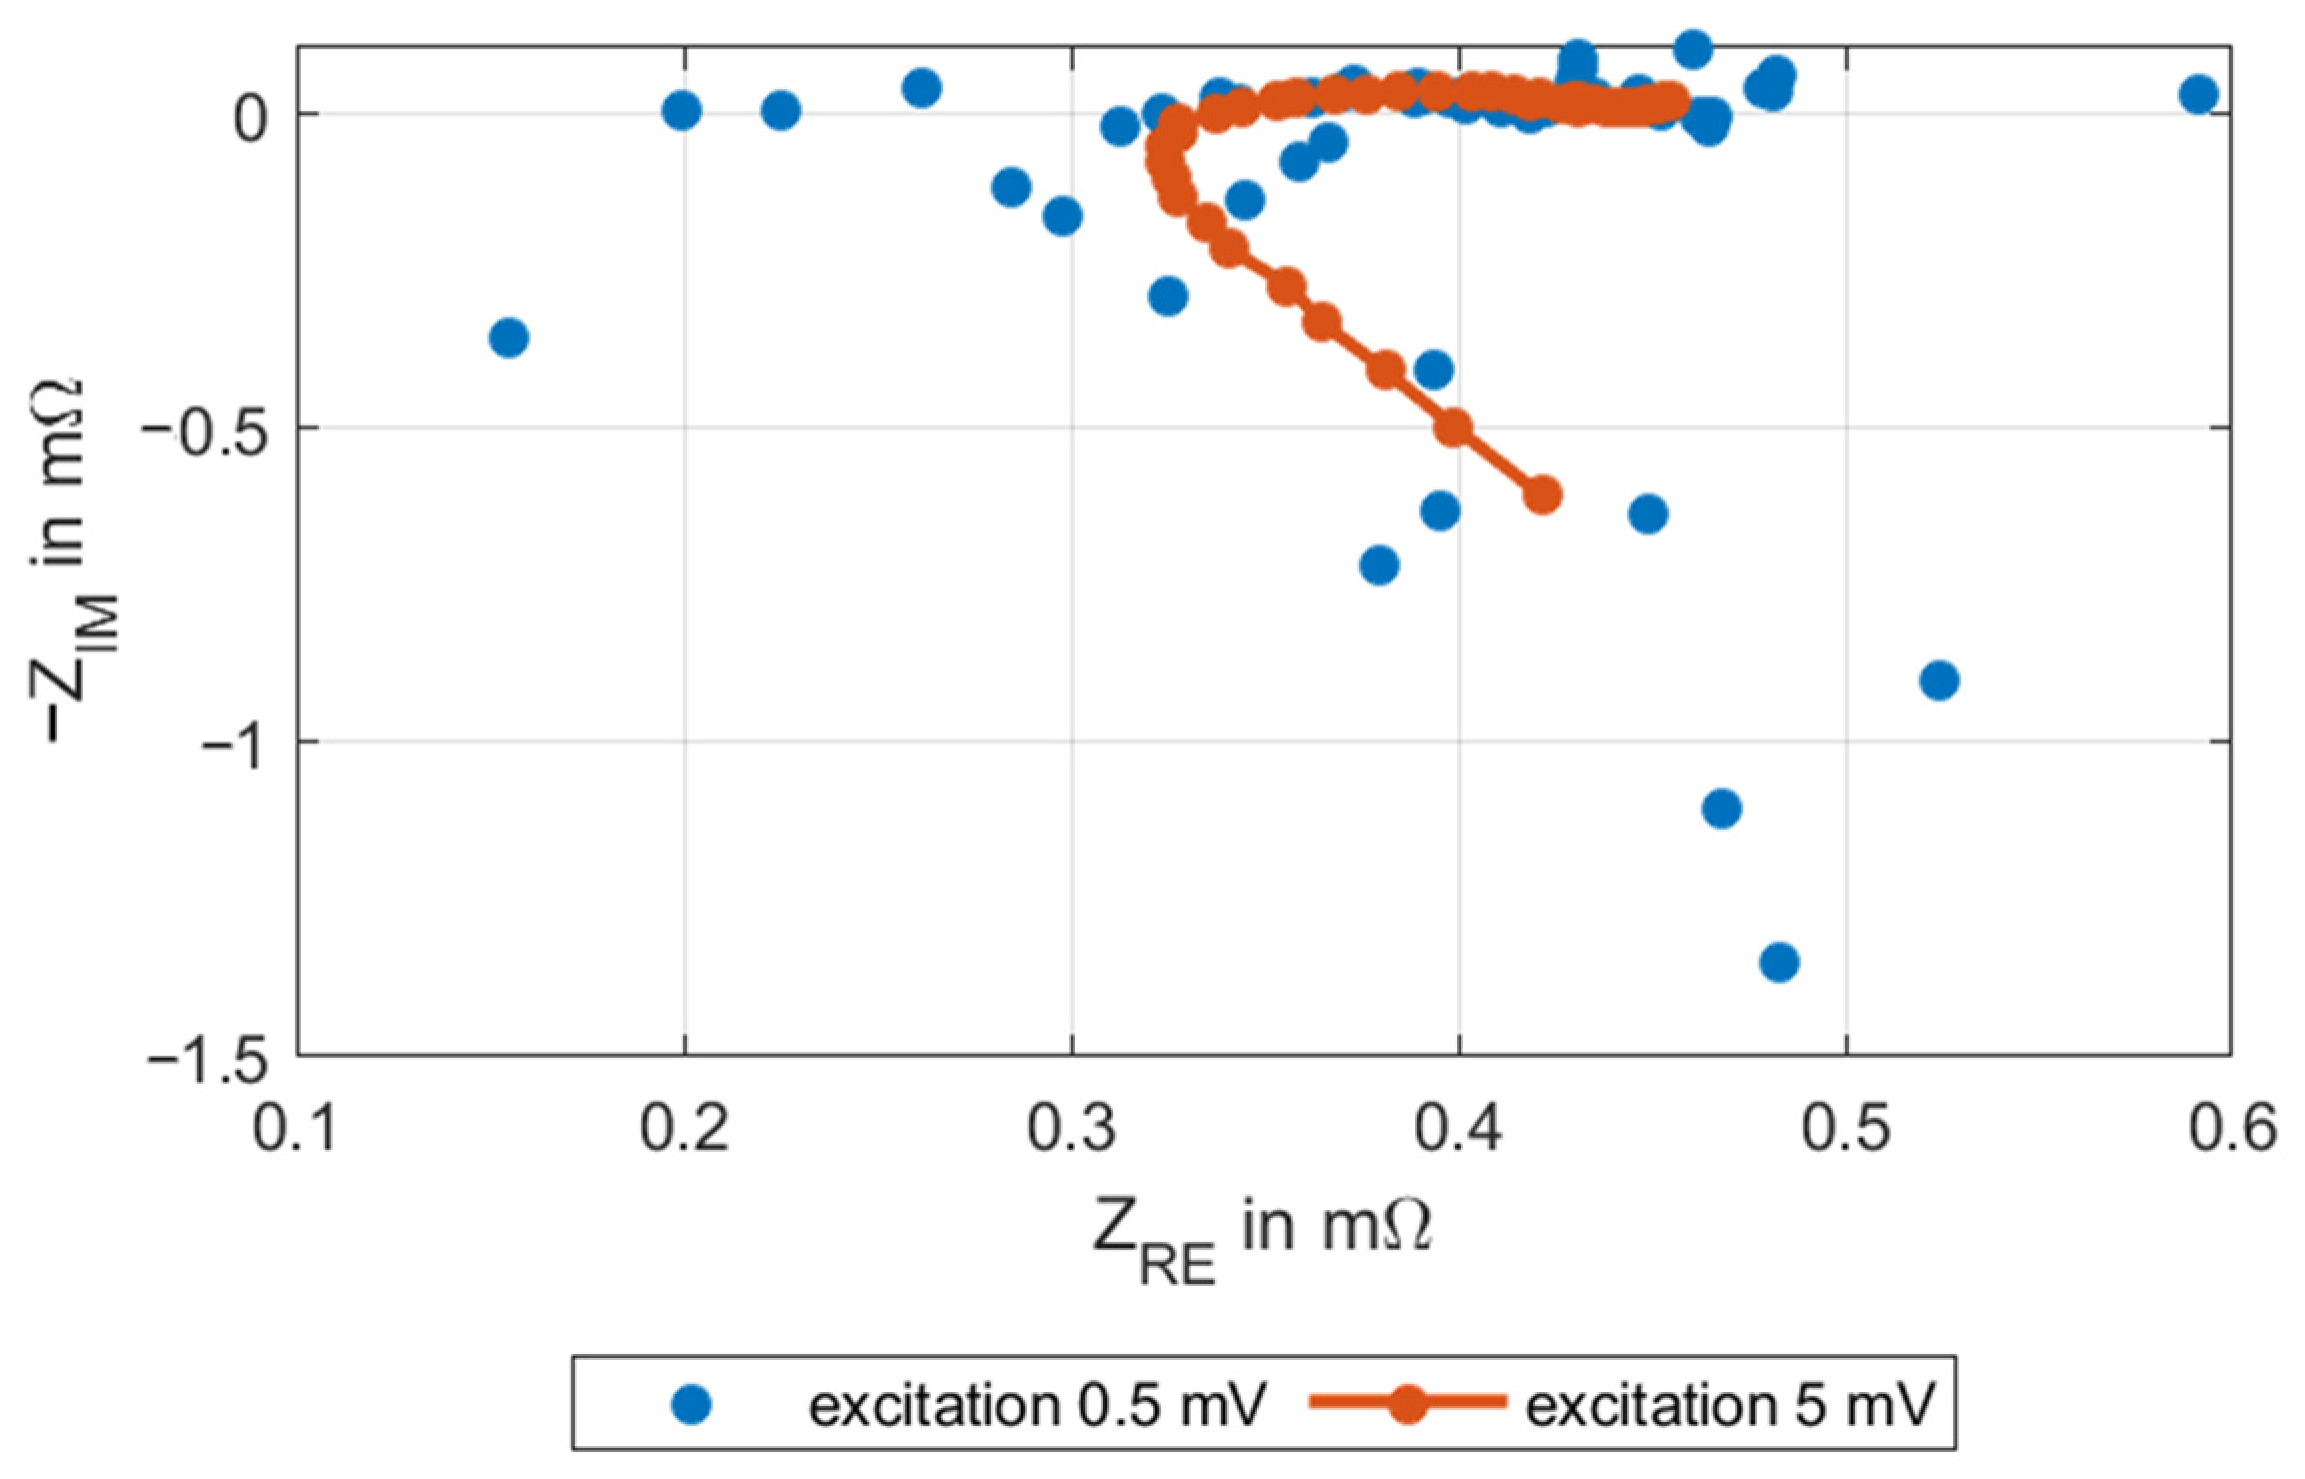
2.3. EIS Method
3. Results and Discussion
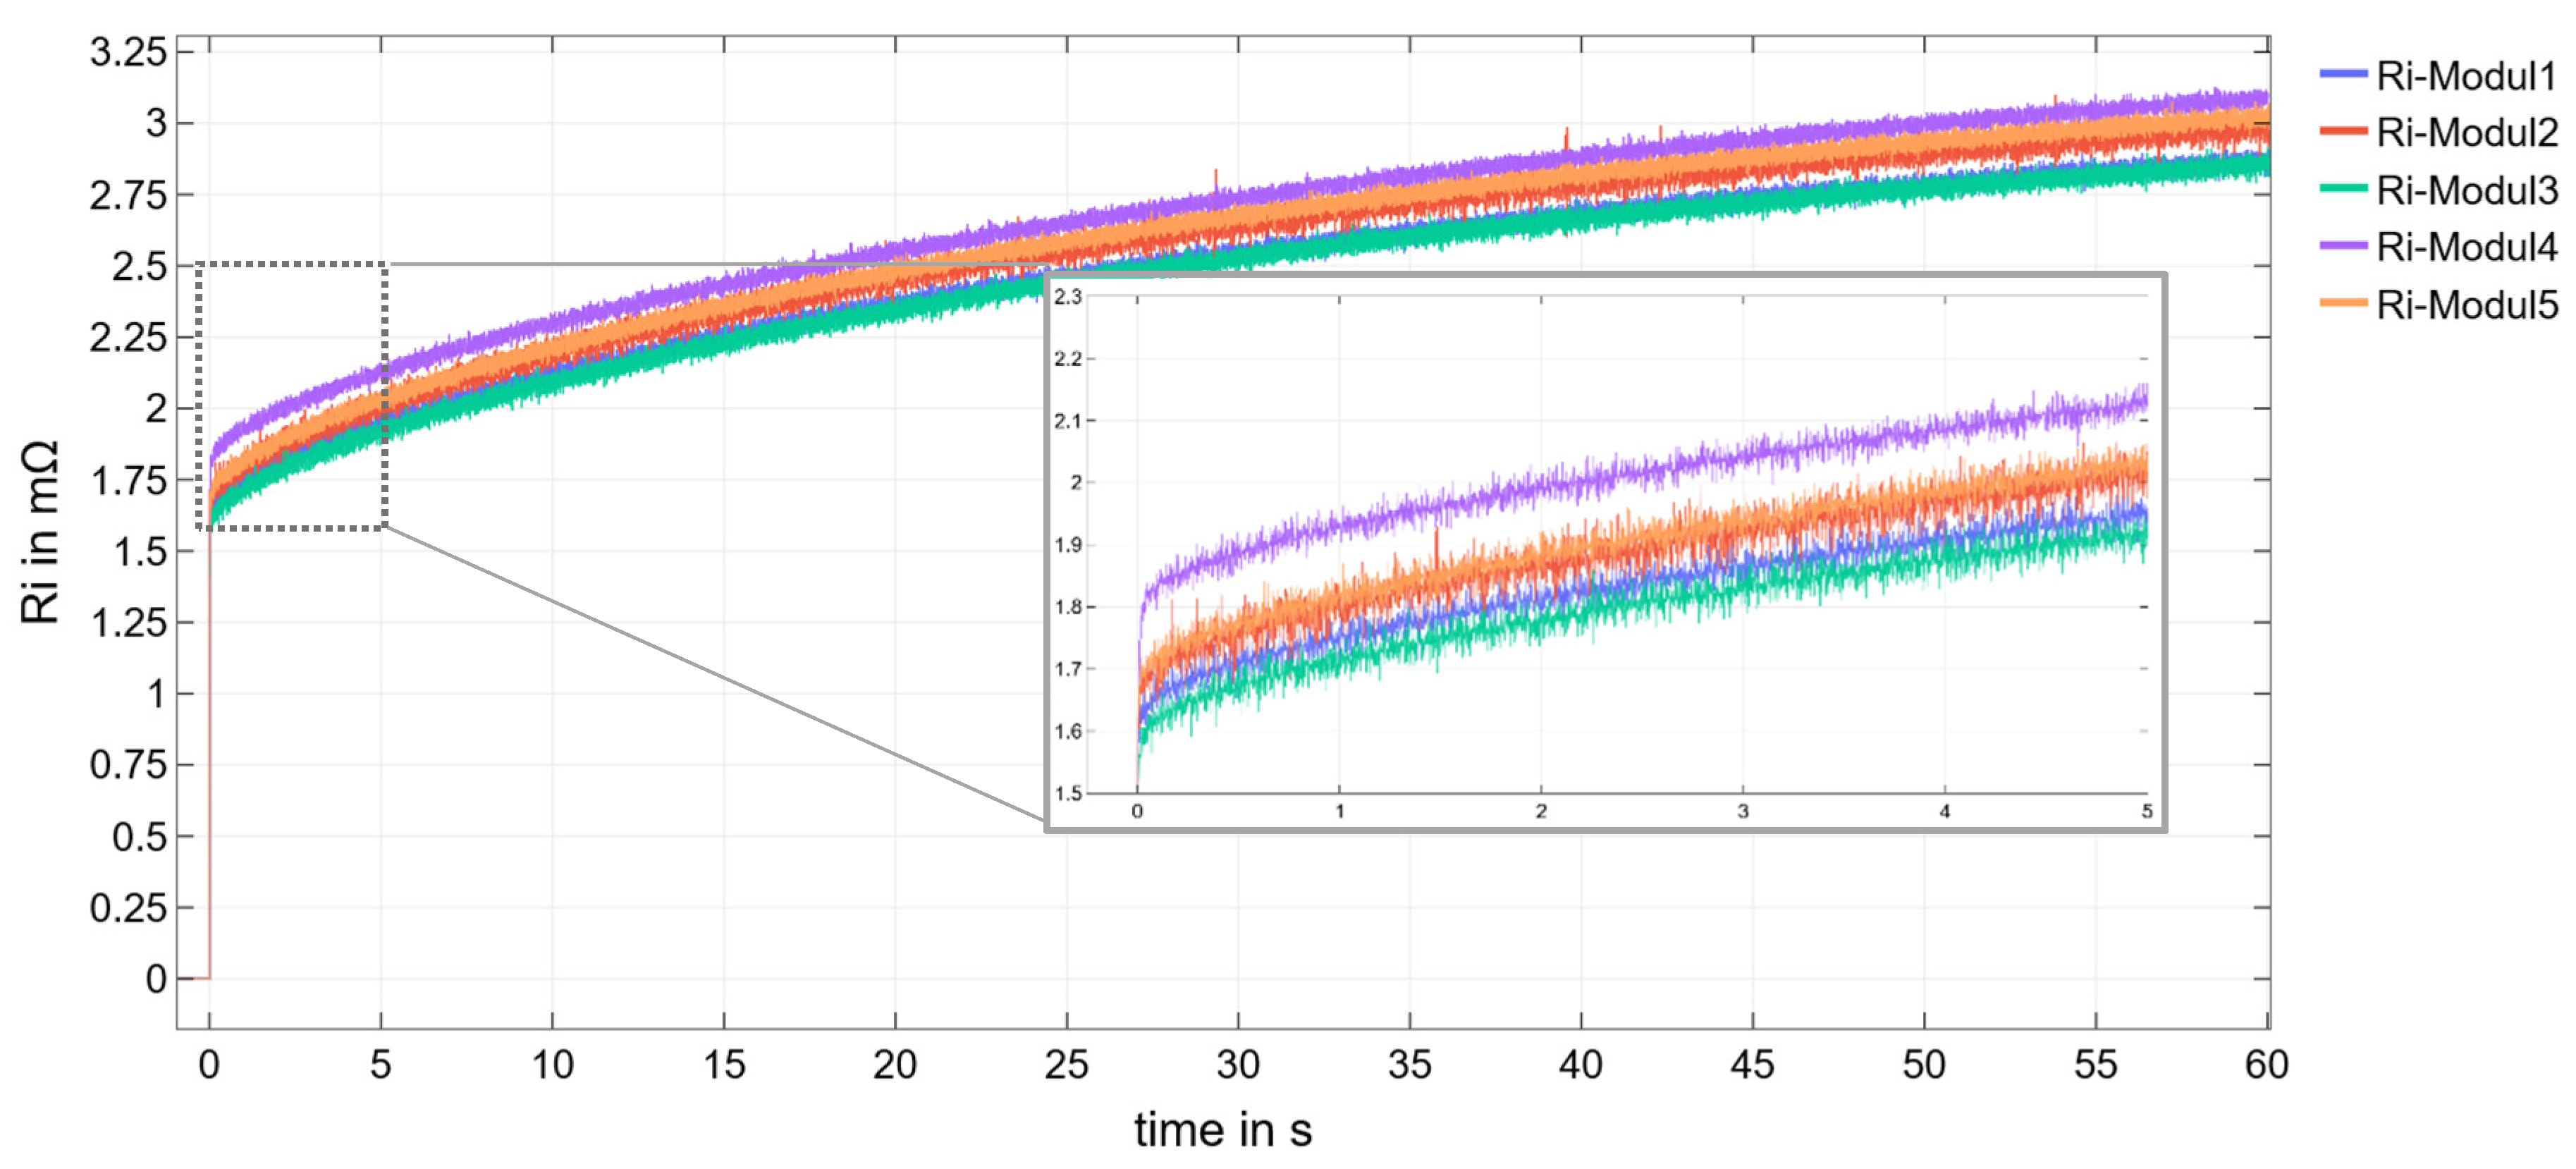
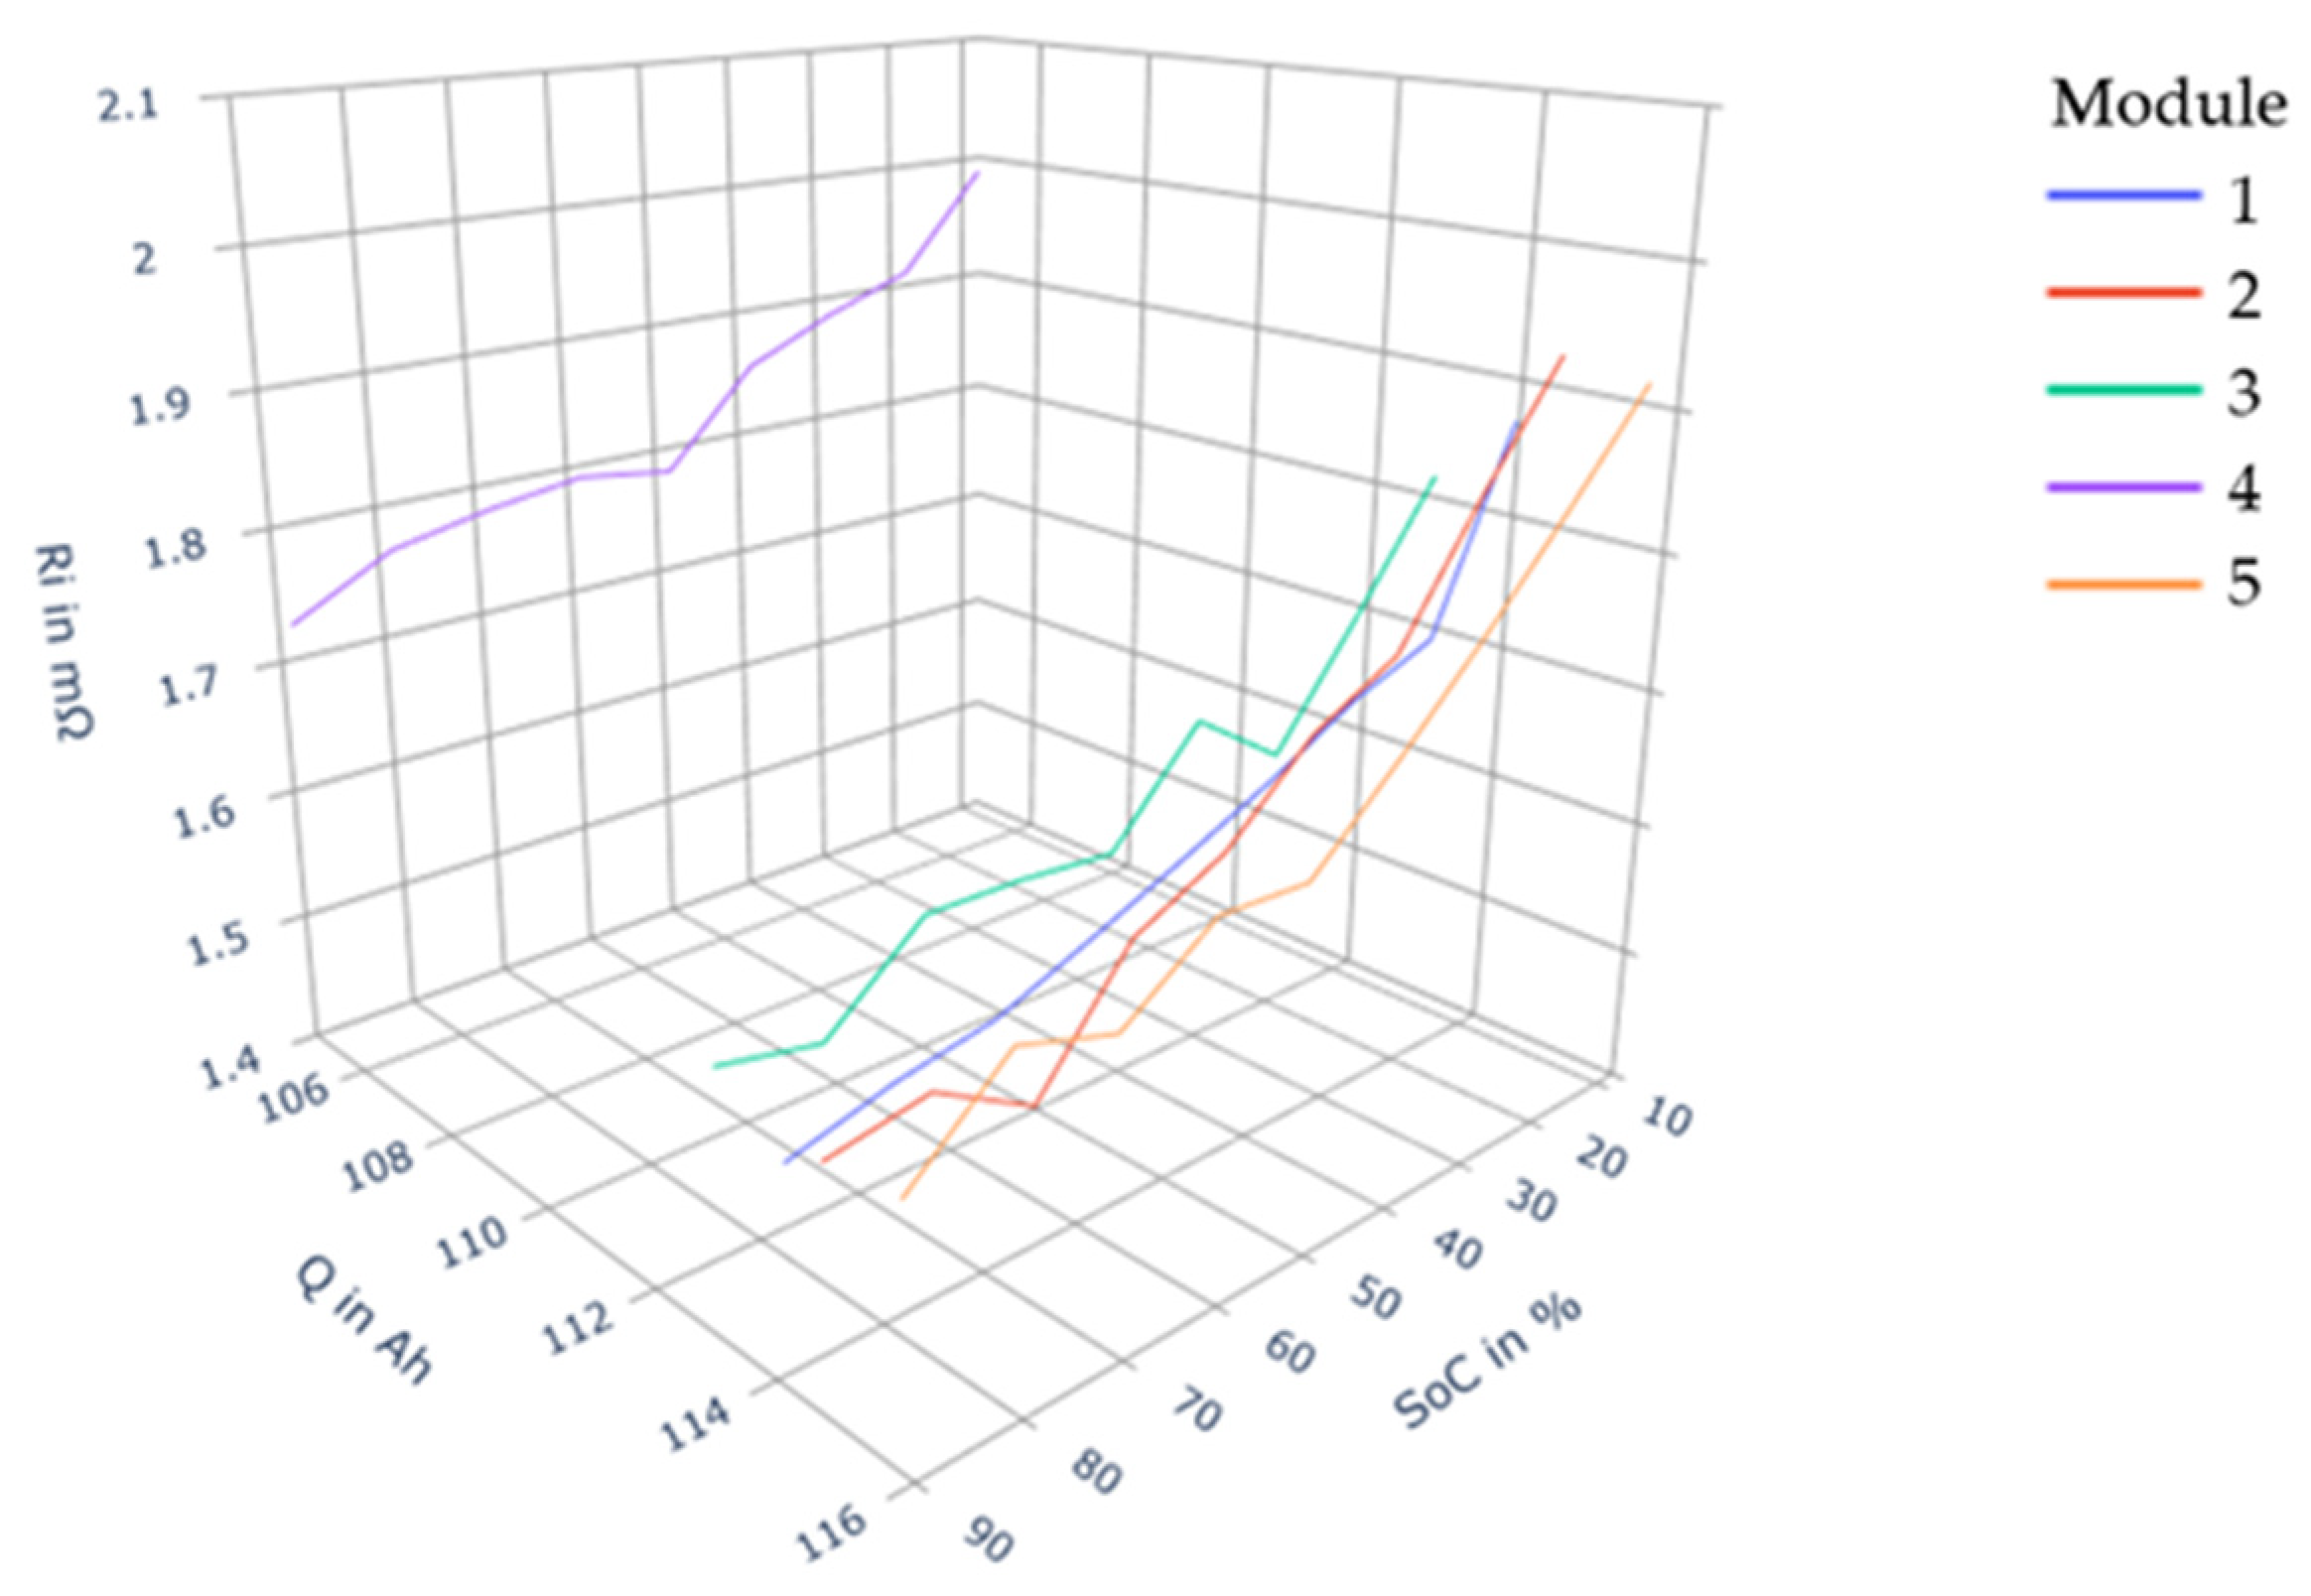
3.1. CI Method
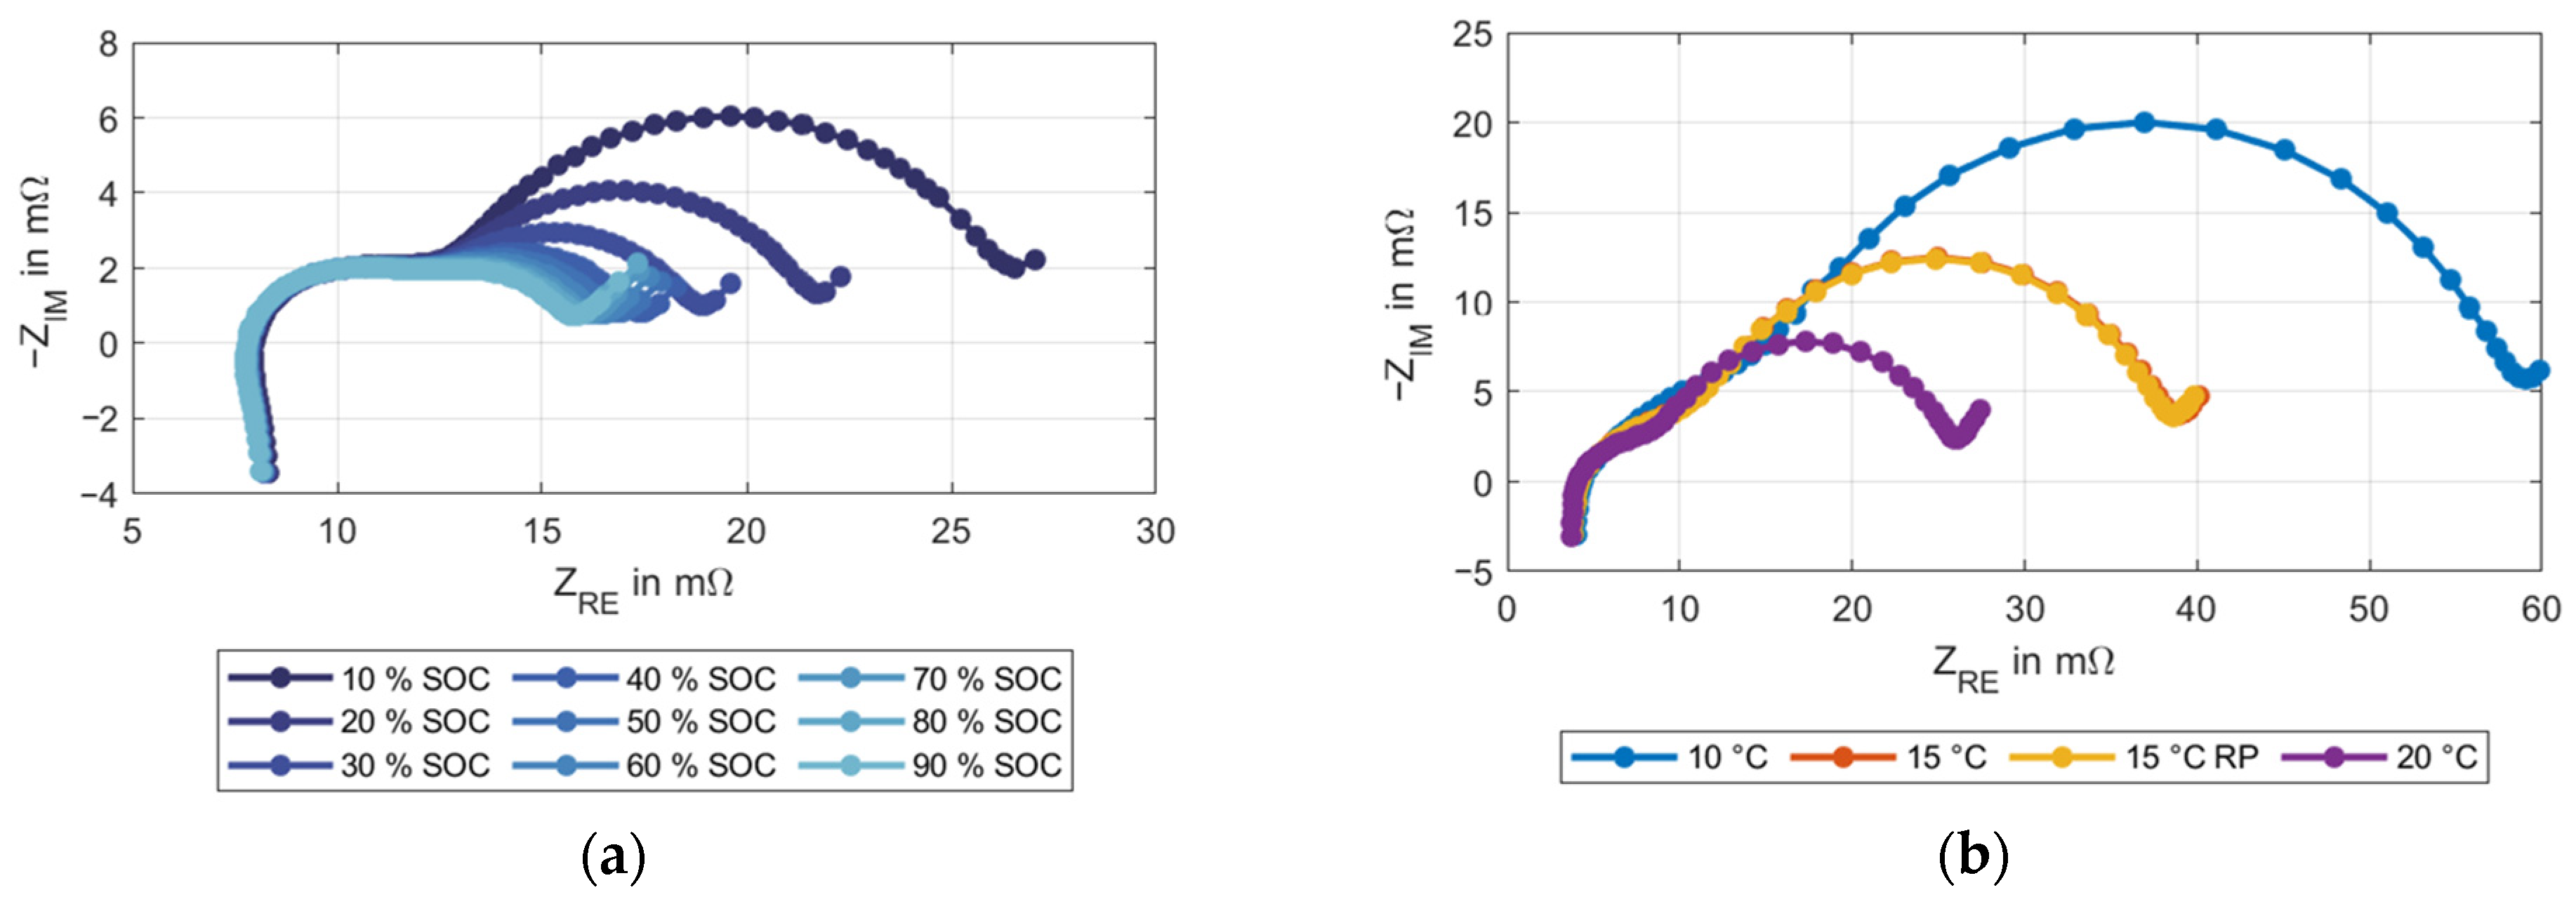
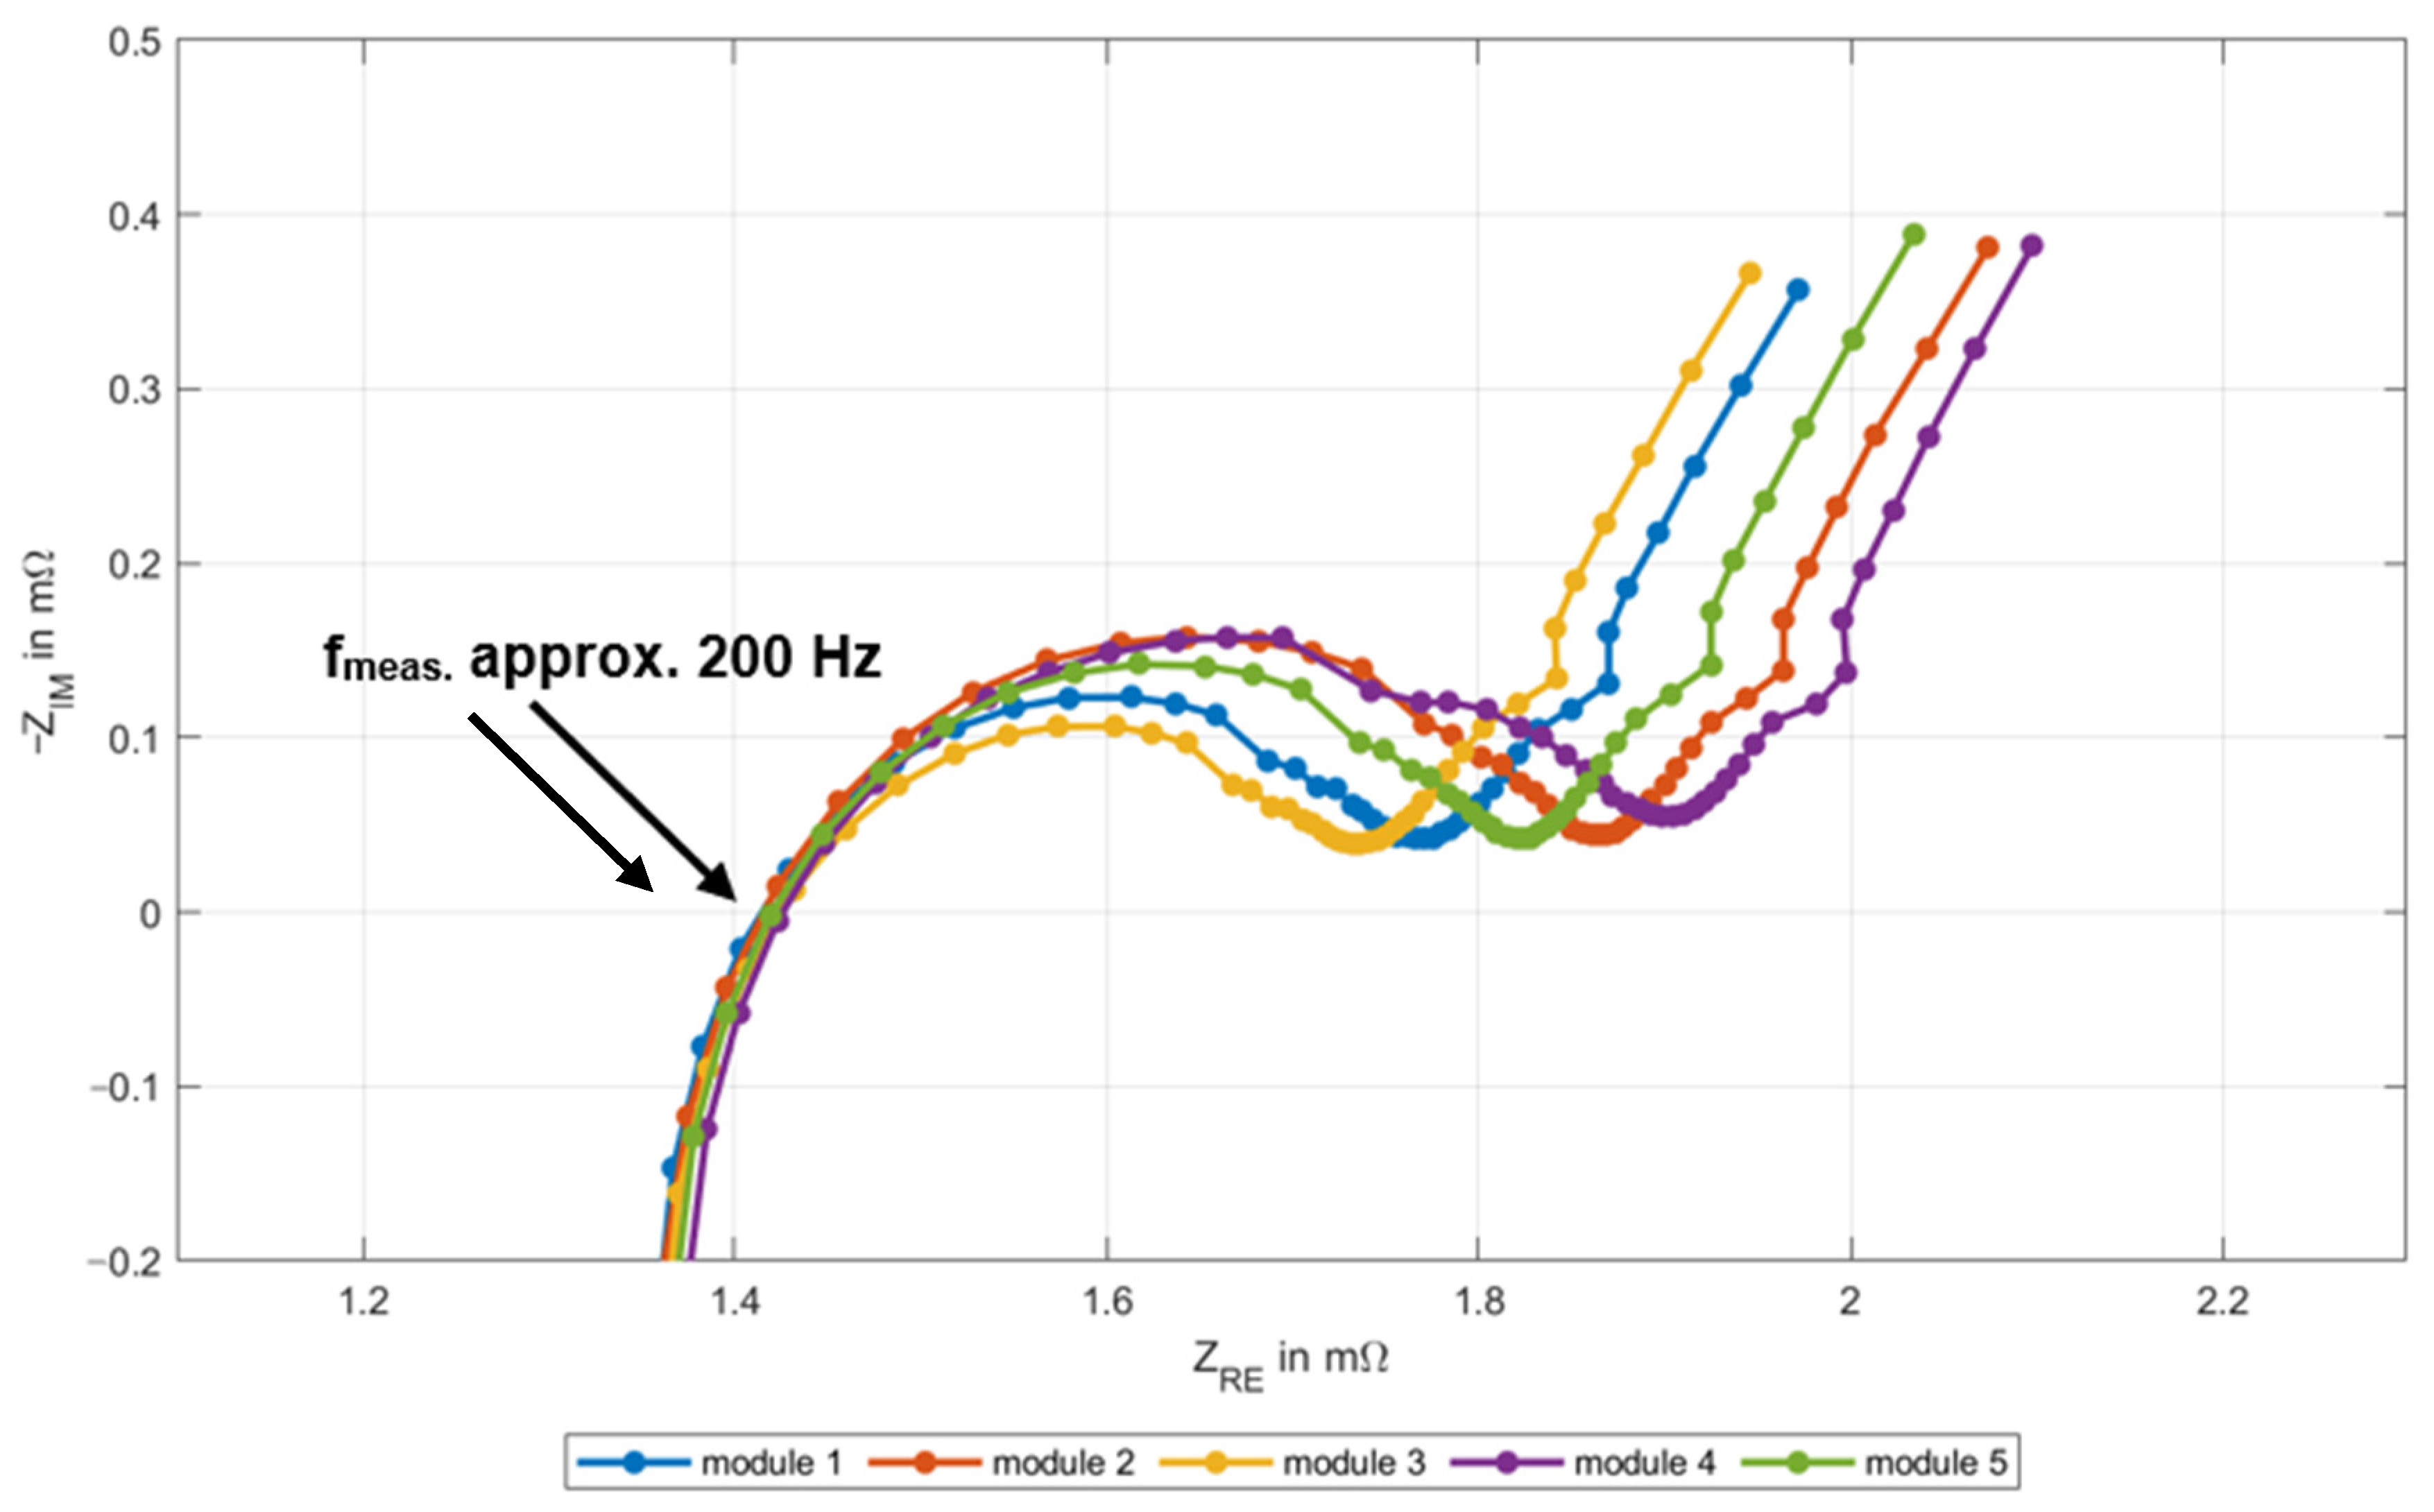
3.2. EIS Method
3.3. Capacity Test
3.4. Comparison of Methods
4. Conclusions
Author Contributions
Funding
Institutional Review Board Statement
Informed Consent Statement
Data Availability Statement
Acknowledgments
Conflicts of Interest
References
- European Commission. Communication from the Commission to the European Parliament, the Council, the European Economic and Social Committee and the Committee of the Regions: A New Circular Economy Action Plan. Brussels. March 2020. Available online: https://eur-lex.europa.eu/legal-content/EN/ALL/?uri=COM:2020:98:FIN (accessed on 28 December 2020).
- Casals, L.C.; García, B.A.; Canal, C. Second life batteries lifespan: Rest of useful life and environmental analysis. J. Environ. Manag. 2019, 232, 354–363. [Google Scholar] [CrossRef] [PubMed]
- Kwade, A.; Haselrieder, W.; Leithoff, R.; Modlinger, A.; Dietrich, F.; Droeder, K. Current status and challenges for automotive battery production technologies. Nat. Energy 2018, 3, 290–300. [Google Scholar] [CrossRef]
- Viswanathan, V.V.; Kintner-Meyer, M. Second Use of Transportation Batteries: Maximizing the Value of Batteries for Transportation and Grid Services. IEEE Trans. Veh. Technol. 2011, 60, 2963–2970. [Google Scholar] [CrossRef]
- Rallo, H.; Casals, L.C.; De La Torre, D.; Reinhardt, R.; Marchante, C.; Amante, B. Lithium-ion battery 2nd life used as a stationary energy storage system: Ageing and economic analysis in two real cases. J. Clean. Prod. 2020, 272, 122584. [Google Scholar] [CrossRef]
- Käbitz, S. Investigation of the Aging of Lithium-Ion Batteries Using Electroanalysis and Electrochemical Impedance Spectros-copy. Ph.D. Thesis, RWTH Aachen University, Aachen, Germany, 2016. [Google Scholar]
- Martinez-Laserna, E.; Sarasketa-Zabala, E.; Sarria, I.V.; Stroe, D.-I.; Swierczynski, M.; Warnecke, A.; Timmermans, J.-M.; Goutam, S.; Omar, N.; Rodriguez, P. Technical Viability of Battery Second Life: A Study From the Ageing Perspective. IEEE Trans. Ind. Appl. 2018, 54, 2703–2713. [Google Scholar] [CrossRef]
- Blömeke, S.; Mennenga, M.; Herrmann, C.; Kintscher, L.; Bikker, G.; Lawrenz, S.; Sharma, P.; Rausch, A.; Nippraschk, M.; Goldmann, D.; et al. Recycling 4.0. In Proceedings of the 7th International Conference on ICT for Sustainability, Bristol, UK, 21–27 June 2020; pp. 66–76. [Google Scholar]
- Barré, A.; Deguilhem, B.; Grolleau, S.; Gérard, M.; Suard, F.; Riu, D. A review on lithium-ion battery ageing mechanisms and estimations for automotive applications. J. Power Sources 2013, 241, 680–689. [Google Scholar] [CrossRef]
- Schuster, S.F.; Brand, M.J.; Campestrini, C.; Gleissenberger, M.; Jossen, A. Correlation between capacity and impedance of lithium-ion cells during calendar and cycle life. J. Power Sources 2016, 305, 191–199. [Google Scholar] [CrossRef]
- Westerhoff, U. Klassifizierung Von Lithium-Ionen-Batteriezellen Mittels Kenngrößenbasierter Methoden; Dr. Hut: München, Germany, 2019. [Google Scholar]
- Waag, W.; Käbitz, S.; Sauer, D.U. Experimental investigation of the lithium-ion battery impedance characteristic at various conditions and aging states and its influence on the application. Appl. Energy 2013, 102, 885–897. [Google Scholar] [CrossRef]
- Wildfeuer, L.; Wassiliadis, N.; Reiter, C.; Baumann, M.; Lienkamp, M. Experimental Characterization of Li-Ion Battery Resistance at the Cell, Module and Pack Level. In Proceedings of the 2019 Fourteenth International Conference on Ecological Vehicles and Renewable Energies (EVER), Monte-Carlo, Monaco, 8–10 May 2019; pp. 1–12. [Google Scholar]
- Eddahech, A.; Briat, O.; Vinassa, J.-M. Determination of lithium-ion battery state-of-health based on constant-voltage charge phase. J. Power Sources 2014, 258, 218–227. [Google Scholar] [CrossRef]
- Weng, C.; Feng, X.; Sun, J.; Peng, H. State-of-health monitoring of lithium-ion battery modules and packs via incremental capacity peak tracking. Appl. Energy 2016, 180, 360–368. [Google Scholar] [CrossRef]
- Campestrini, C.; Keil, P.; Schuster, S.F.; Jossen, A. Ageing of lithium-ion battery modules with dissipative balancing compared with single-cell ageing. J. Energy Storage 2016, 6, 142–152. [Google Scholar] [CrossRef]
- Somandepalli, V.; Biteau, H. Cone Calorimetry as a Tool for Thermal Hazard Assessment of Li-Ion Cells. SAE Int. J. Altern. Powertrains 2014, 3, 222–233. [Google Scholar] [CrossRef]
- Biteau, H.; Nava, N. Transportation of Li-ion Batteries: The State of Charge Parameter. p. 5. Available online: http://nts.uni-duisburg-essen.de/aube/aube17/paper/Session%2016/S16P2%20Biteau%20-%20Nava.pdf (accessed on 30 December 2020).
- Barai, A.; Uddin, K.; Chevalier, J.; Chouchelamane, G.H.; McGordon, A.; Low, J.; Jennings, P. Transportation Safety of Lithium Iron Phosphate Batteries—A Feasibility Study of Storing at Very Low States of Charge. Sci. Rep. 2017, 7, 5128. [Google Scholar] [CrossRef] [PubMed]
- Schmidt, J.P. Verfahren zur Charakterisierung und Modellierung von Lithium-Ionen Zellen; KIT Scientific Publishing: Karlsruhe, Germany, January 2013. [Google Scholar]
- Bauer, M. Elektrische und Mechanische Verfahren zur Detektion von Alterungseffekten in Lithium-Ionen-Batterien. Ph.D. Thesis, Technische Universität München, Munich, Germany, 2017. [Google Scholar]
- Barsoukov, E.; Macdonald, J.R. Impedance Spectroscopy: Theory, Experiment, and Applications, 2nd ed.; Wiley-Interscience: Hoboken, NJ, USA, 2005. [Google Scholar]
- Zhu, J.; Sun, Z.C.; Wei, X.Z.; Dai, H.F. A new lithium-ion battery internal temperature on-line estimate method based on electrochemical impedance spectroscopy measurement. J. Power Sources 2015, 274, 990–1004. [Google Scholar] [CrossRef]
- Petzl, M.; Kasper, M.; Danzer, M.A. Lithium plating in a commercial lithium-ion battery—A low-temperature aging study. J. Power Sources 2015, 275, 799–807. [Google Scholar] [CrossRef]
- Stroe, D.I.; Swierczynski, M.J.; Stan, A.-I.; Knap, V.; Teodorescu, R.; Andreasen, S.J. Diagnosis of lithium-ion batteries state-of-health based on electrochemical impedance spectroscopy technique. In Proceedings of the 2014 IEEE Energy Conversion Congress and Exposition (ECCE), Pittsburgh, PA, USA, 14–18 September 2014; pp. 4576–4582. [Google Scholar]
- Kucevic, D.; Tepe, B.; Englberger, S.; Parlikar, A.; Mühlbauer, M.; Bohlen, O.; Jossen, A.; Hesse, H. Standard battery energy storage system profiles: Analysis of various applications for stationary energy storage systems using a holistic simulation framework. J. Energy Storage 2020, 28, 101077. [Google Scholar] [CrossRef]
- Gamry Instruments Inc. Reference 3000 Potentiostat/Galvanostat/ZRA Operator’s Manual. Available online: https://www.gamry.com/assets/Uploads/Reference-3000-Operators-Manual.pdf (accessed on 3 December 2020).


| Step | Description | Parameters and Conditions |
|---|---|---|
| 1 | Full charge | @1C, CC + CV |
| 2 | Pause | 15 min |
| 3 | Capacity determination | Discharge @1C, CC + CV |
| 4 | Full charge | @1C, CC + CV |
| 5 | Pause | 15 min |
| 6–14 | Recurring discharge to 10% SoC | @10% SOC steps + 15 min relaxation |
| 15 | Charge | Charge while battery voltage <14.9 V @2C |
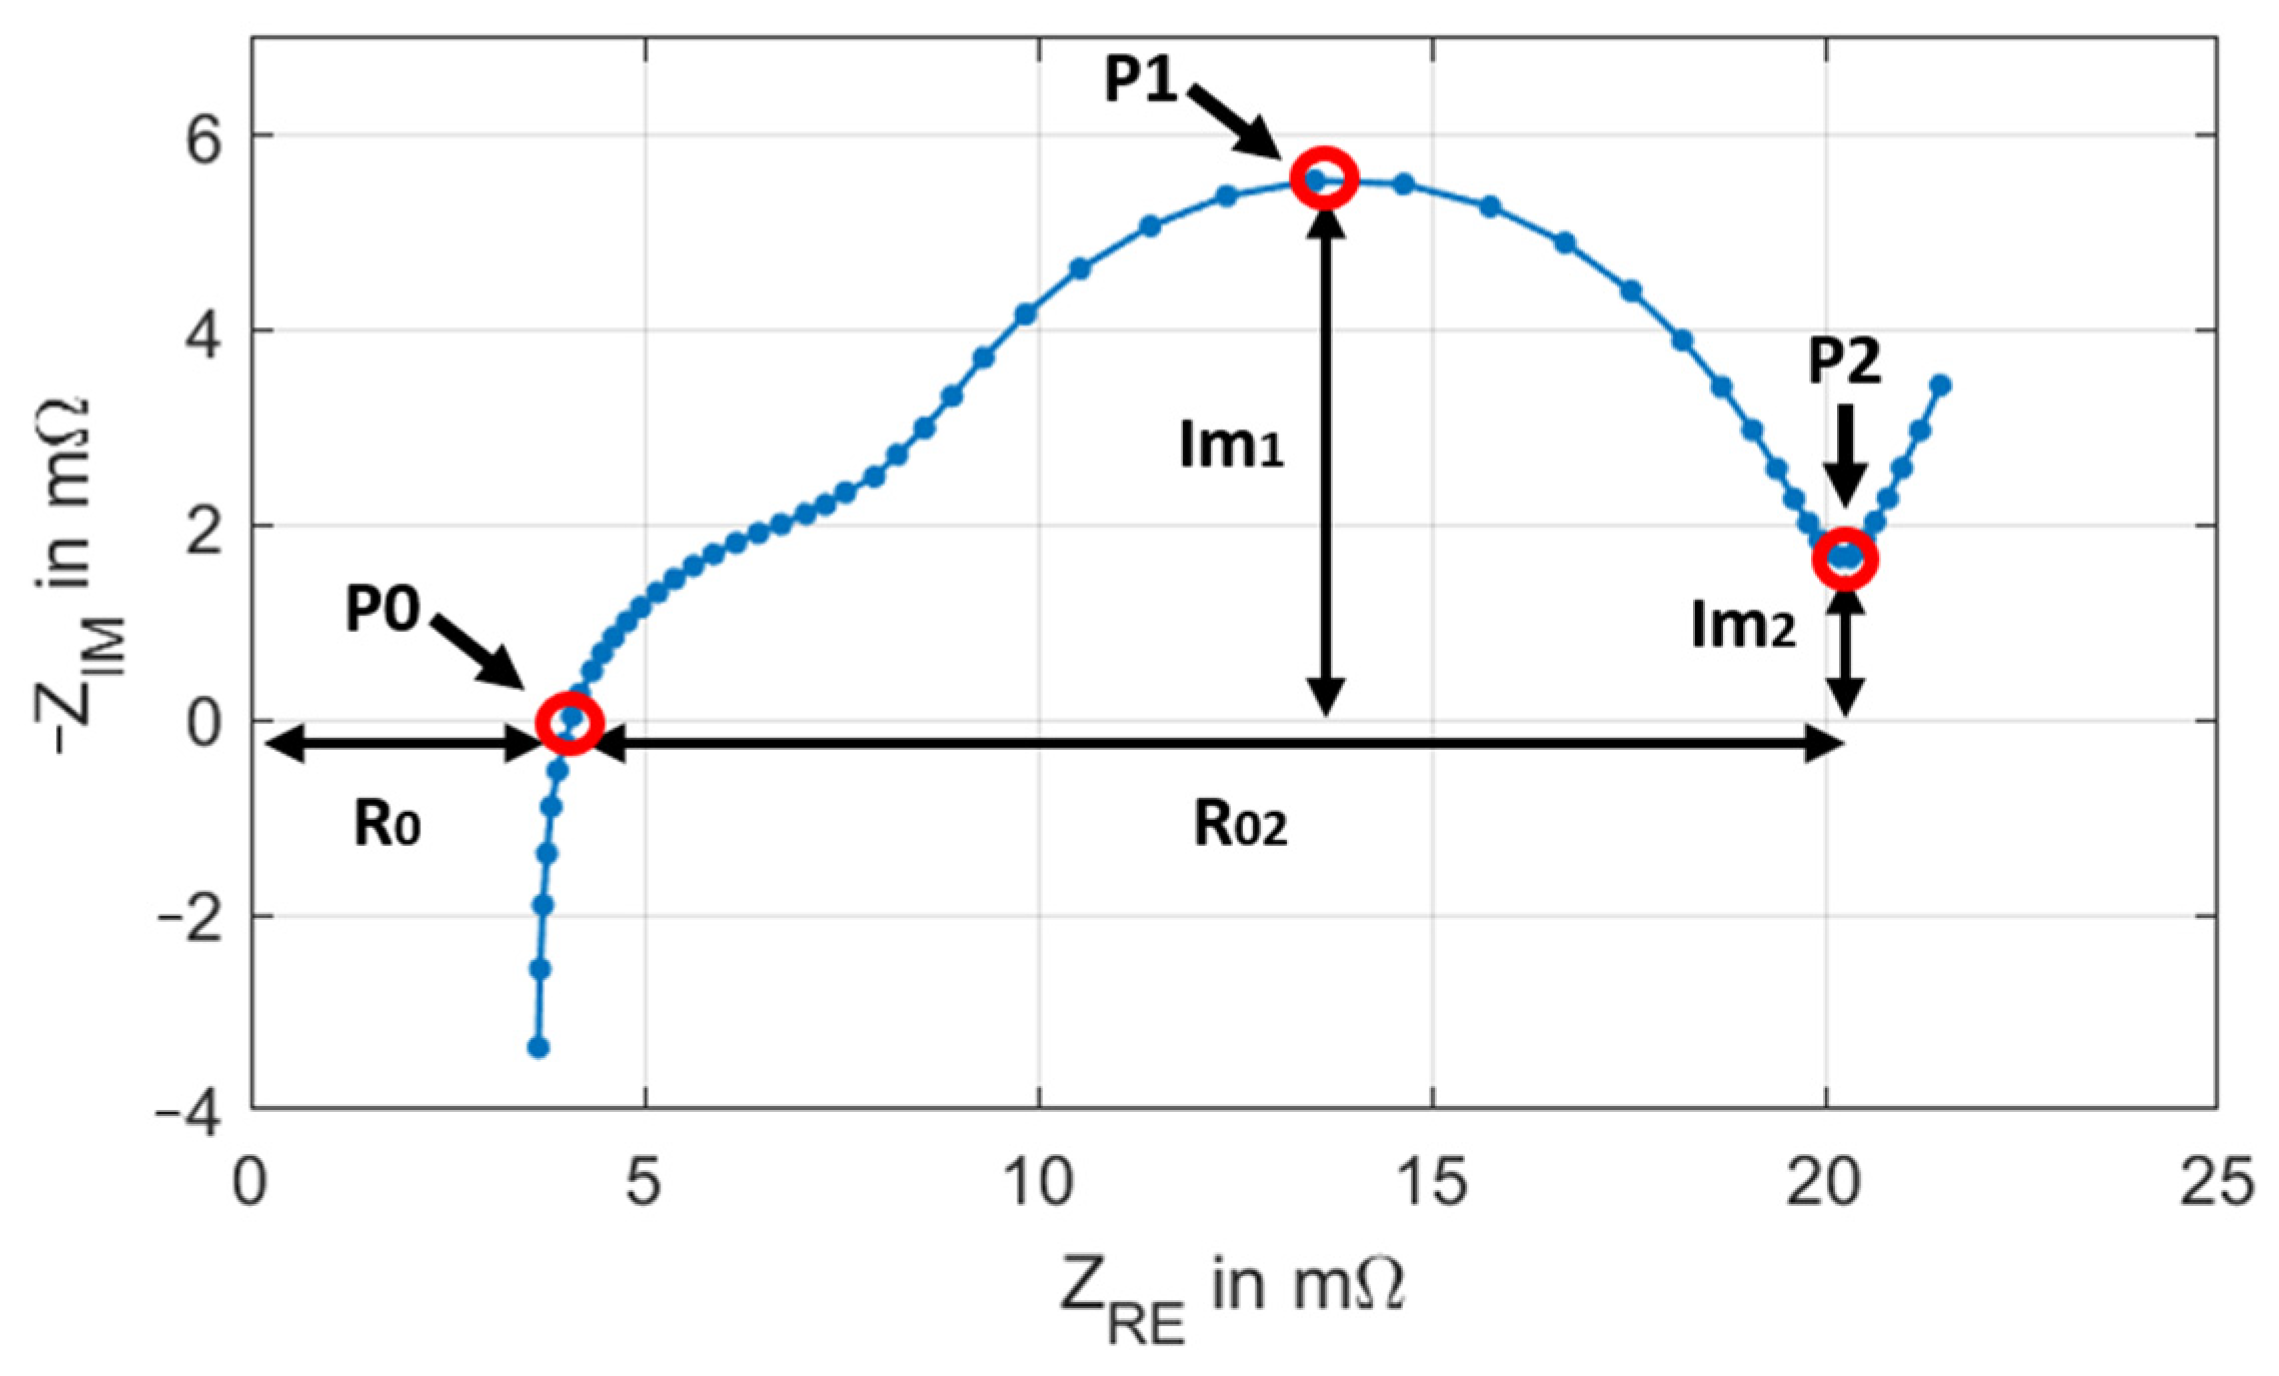
| Point | Re(Z) | Im(Z) | Frequency |
|---|---|---|---|
| P0 | Indirect informativeness | ≝0, necessary to define P0 | Depends on the experimental setup |
| P1 | Vulnerable to measurement and evaluation errors | Robust to measurement- and evaluation errors | Robust but has to be interpolated |
| P2 | Good measurability | Good measurability | Unequivocal allocation not possible |
| t in s | Module 1 in mΩ | Module 2 in mΩ | Module 3 in mΩ | Module 4 in mΩ | Module 5 in mΩ | ∆Ri-M4-MX in mΩ |
|---|---|---|---|---|---|---|
| 0 | 1.41 | 1.38 | 1.41 | 1.46 | 1.42 | 0.04 |
| 0.1 | 1.65 | 1.70 | 1.64 | 1.83 | 1.75 | 0.08 |
| 0.2 | 1.68 | 1.70 | 1.65 | 1.85 | 1.75 | 0.10 |
| 0.5 | 1.70 | 1.75 | 1.65 | 1.89 | 1.78 | 0.11 |
| 1 | 1.76 | 1.80 | 1.71 | 1.93 | 1.83 | 0.10 |
| 60 | 2.84 | 3.00 | 2.88 | 3.08 | 3.03 | 0.05 |
| SOC in% | Module 1 | Module 2 | Module 3 | Module 4 | Module 5 | ∆Ri-M4-MX in% |
|---|---|---|---|---|---|---|
| 90 | 100% (1.55 mΩ) | 101.03% | 102.19% | 111.73% | 101.55% | 9.54% |
| 80 | 100% (1.57 mΩ) | 100.51% | 100% | 112.79% | 104.20% | 8.59% |
| 70 | 102.92% | 100% (1.54 mΩ) | 105.91% | 116.11% | 104.94% | 10.20% |
| 60 | 100% (1.61 mΩ) | 100.68% | 100.99% | 111.48% | 103.16% | 8.31% |
| 50 | 101.17% | 102.10% | 100% (1.62 mΩ) | 110.17% | 102.28% | 7.89% |
| 40 | 100% (1.67 mΩ) | 102.57% | 101.38% | 111.18% | 102.69% | 8.49% |
| 30 | 103.58% | 106.13% | 100% (1.65 mΩ) | 114.68% | 108.01% | 6.67% |
| 20 | 100% (1.73 mΩ) | 106.35% | 100.06% | 110.57% | 106.70% | 3.87% |
| 10 | 102.85% | 105.70% | 100% (1.82 mΩ) | 109.27% | 105.32% | 3.57% |
| Module No. | Im1 | Im2 | R02 | EISSOH,∅ |
|---|---|---|---|---|
| 1 | 115% | 107% | 121% | 114% |
| 2 | 148% | 112% | 148% | 136% |
| 3 | 100% (0.106 mΩ) | 100% (0.039 mΩ) | 100% (0.300 mΩ) | 100% |
| 4 | 148% | 139% | 158% | 148% |
| 5 | 133% | 106% | 135% | 125% |
| Measurement Method | Best Module | Worst Module | |||
|---|---|---|---|---|---|
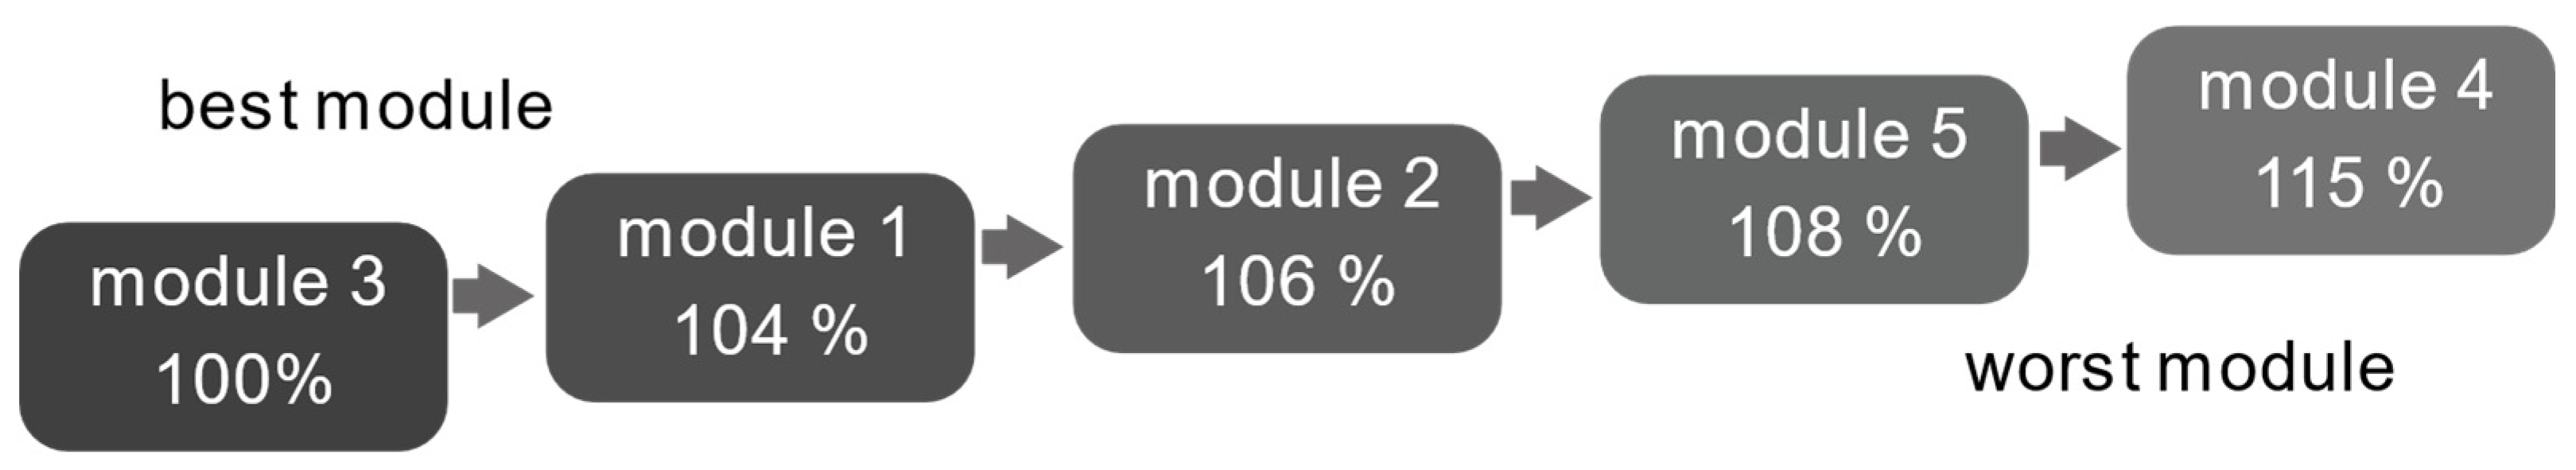
| CI/internal resistance | Module 3 | Module 1 | Module 2 | Module 5 | Module 4 |
| 100% | 104% | 106% | 108% | 115% | |
| EIS | Module 3 | Module 1 | Module 5 | Module 2 | Module 4 |
| 100% | 114% | 125% | 136% | 148% | |
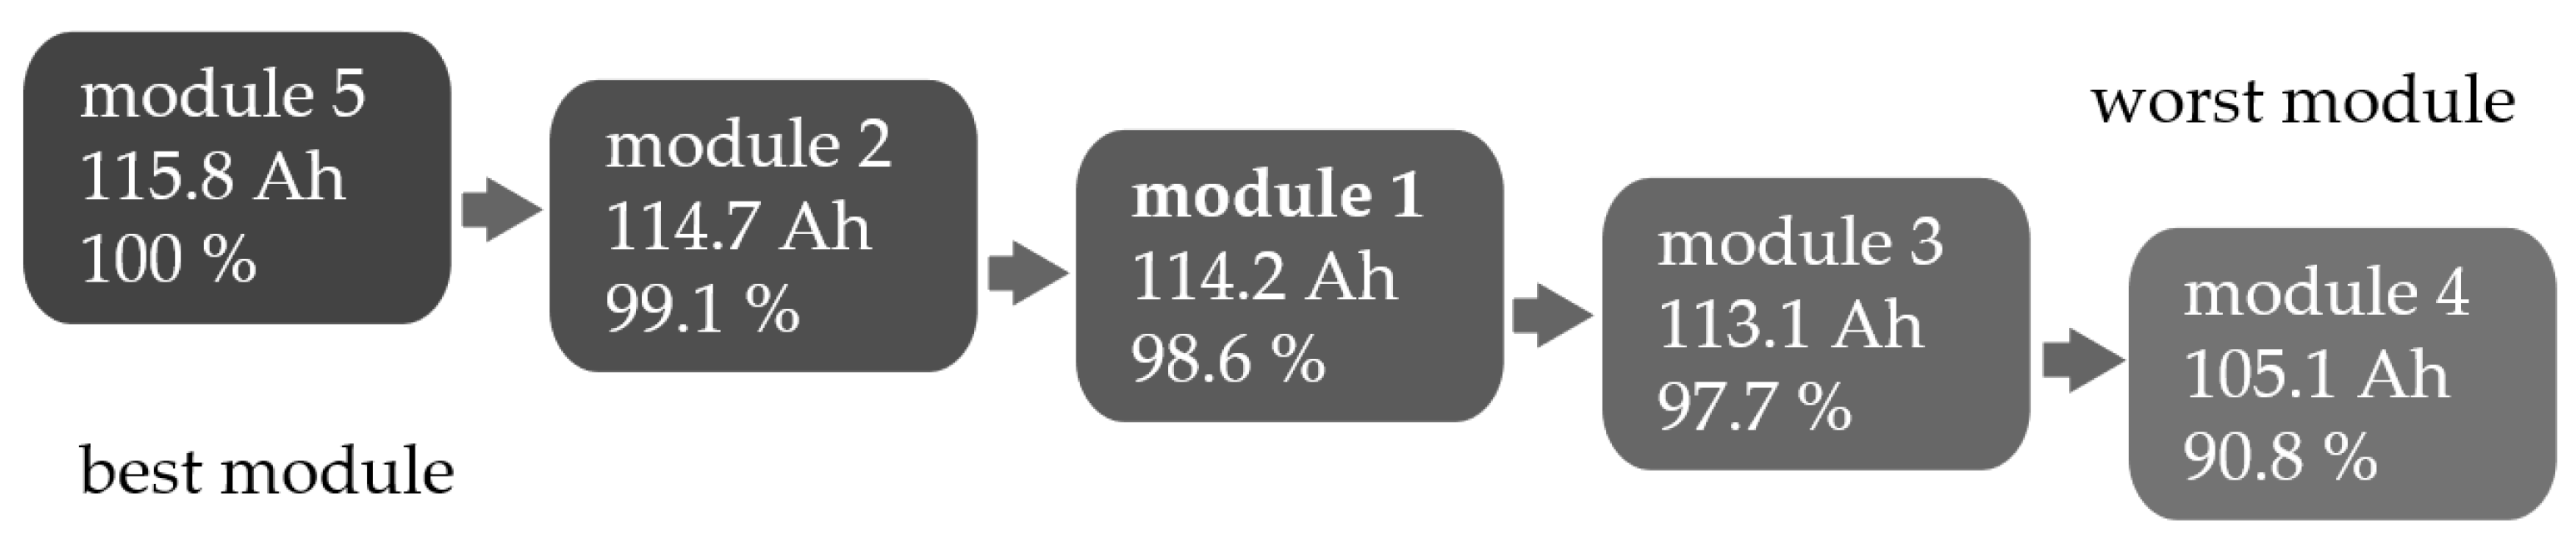
| Capacity test | Module 5 | Module 2 | Module 1 | Module 3 | Module 4 |
| 100% | 99.1% | 98.6% | 97.7% | 90.8% |
Publisher’s Note: MDPI stays neutral with regard to jurisdictional claims in published maps and institutional affiliations. |
© 2021 by the authors. Licensee MDPI, Basel, Switzerland. This article is an open access article distributed under the terms and conditions of the Creative Commons Attribution (CC BY) license (https://creativecommons.org/licenses/by/4.0/).
Share and Cite
Kehl, D.; Jennert, T.; Lienesch, F.; Kurrat, M. Electrical Characterization of Li-Ion Battery Modules for Second-Life Applications. Batteries 2021, 7, 32. https://doi.org/10.3390/batteries7020032
Kehl D, Jennert T, Lienesch F, Kurrat M. Electrical Characterization of Li-Ion Battery Modules for Second-Life Applications. Batteries. 2021; 7(2):32. https://doi.org/10.3390/batteries7020032
Chicago/Turabian StyleKehl, Daniel, Torben Jennert, Frank Lienesch, and Michael Kurrat. 2021. "Electrical Characterization of Li-Ion Battery Modules for Second-Life Applications" Batteries 7, no. 2: 32. https://doi.org/10.3390/batteries7020032
APA StyleKehl, D., Jennert, T., Lienesch, F., & Kurrat, M. (2021). Electrical Characterization of Li-Ion Battery Modules for Second-Life Applications. Batteries, 7(2), 32. https://doi.org/10.3390/batteries7020032