Article

Open-Loop Dynamic Modeling of Low-Budget Batteries with Low-Power Loads

by
Mojtaba Masoudinejad
Chair of Materials Handling and Warehousing, TU Dortmund University, Joseph-von-Fraunhofer-Str. 2-4, 44227 Dortmund, Germany
Batteries 2020, 6(4), 50; https://doi.org/10.3390/batteries6040050
Submission received: 6 September 2020 / Revised: 25 September 2020 / Accepted: 30 September 2020 / Published: 13 October 2020

Abstract

:
Understanding dynamic behavior of a battery and the possibility of simulating it is necessary during design of IoT systems. This plays a critical role, especially for industrial devices with low-power demands planned for long lasting operation. While cost limitation mostly leads to use of the low-budget batteries with fast degradation, a model of these batteries supplying low-power loads is provided here. The overall model is in open-loop form because no access to the terminal measurements is available during the design phase. The identification process of the relation between the state of charge and related electromotive force as a key element of the model is discussed. Moreover, guidelines are suggested for identification of this relation. Furthermore, SoC estimation based on the Coulomb counting is modified to include a dynamic inter-cycle aging factor. This factor enables replication of the degradation within a single cycle. In spite of simplicity of this concept, it is able to reduce the model’s estimation error evaluated with two different types of loads. The overall model provides promising results with relative errors less than 0.2%.

1. Introduction

The Internet of Things (IoT) revolution and Industry 4.0 as its industrial counterpart have increased the number of embedded systems. Such devices have shown promising results implemented in diverse fields of applications [1]. Lithium batteries are a key power storage system for systems such as portable devices, aviation, space travel, and electric vehicles [2,3].
It is common for the IoT system designers to integrate a battery with the highest possible power/energy density to maximize the operational time [4]. The same goal is targeted in the electronic design of IoT devices by use of low-power components to reduce the energy demand [4]. Consequently, it is very common that the battery’s demand scale is smaller than its nominal current ( I n ). Although it is possible to design and use large capacity batteries with a very small I n , increasing costs makes this a rare occurrence. Indeed a battery’s price tag affects development of the IoT devices more broadly because generally batteries have the highest cost per item overall in the devices. In some cases such as PhyNetLab [5] as a smart warehouse with some hundreds or even thousands of PhyNodes embedded bins [6], a high initial investment per device can sabotage the feasibility of the overall IoT-based solution. Hence, system designers tend to use low-budget batteries which mostly have shorter life spans. Consequently, review and modification of common modeling techniques for battery modeling are necessary to include this fast degradation effect.
Performances evaluation of an IoT device in its entire operational conditions is essential during the design. While a dynamic battery model is necessary for this step, it has to be open-loop because the real system is not accessible during the design phase. The only available signal is the demand current ( I b ) while the terminal voltage ( V b ) is desired. Hence, this model is abstracted as in Figure 1.
The combination of a low-budget battery, low-power demand and an open-loop structure introduces two main challenges addressed in this paper. First is the identification of the relation between the State of Charge (SoC) and its related electromotive force ( V e ) as an essential part of the model. Next is a method to handle fast aging process of the low-budget batteries within the model.
SoC as a key element of the battery models has a direct relation to some external static parameters such as the open-circuit voltage (OCV) [7,8]. However, the exact relation is dependent on the OCV after a long rest period which is called the electromotive force [9] or the rest of the voltage [8]. This rest period is responsible to remove the recovery effect [10]. For identification of this relation different methods are available. They can be categorized into two groups: continuous (low current) and discrete (incremental tests) measurements [11]. In the discrete method, V e is measured directly from long rested OCV after application of a current pulse. Thereupon, this experiment can take a very long time and has dependency on the current rate [12]. On the contrary, in the continuous method V e is found from the V b when a small constant current in the range of C/30 is applied [9,13]. Not only validity of this range has to be evaluated for the low-budget batteries, but also it is common for low-power loads to be even smaller than this range. Hence, an exact comparison and validation of these methods for low-power loads is crucial here.
Among aging based power and capacity losses [14], capacity changes are fundamental for the operational time analysis. Calendar aging and cyclic aging are two common types of aging models [2] available in the literature. While the former is associated to the storage period, temperature and SoC; effectual factors on the cycle aging are temperature, SoC, Depth of Discharge (DoD), applied current and number of cycle [2,3]. Although calendar aging is not critical for the IoT applications because of continuous operation, cyclic aging analysis is essential for devices withlow-budget batteries.
Scale of low-power currents is limited and current effect on the aging can be ignored. Moreover, industrial operators commonly use the whole possible voltage range to maximize the recharge period. Furthermore, in indoor applications such as PhyNetLab warehouse, devices are in a controlled environment with a negligible temperature deviation. Therefore, the only effective parameter on the cyclic aging is the number of cycles. While the aging effect changes between 200 and 2000 cycles based on the battery technology [15], the related aging curve is normally provided by the manufacturers for different current rates. However, while these data are mostly not published for the low-budget batteries; it is for currents higher than the scale of the low-power systems’ demands in rare cases of availability. Furthermore, similar to [14,16] most analysis of these data has the granularity of cycles. Changes in the low-budget batteries’ capacity during a single cycle are large enough (compared to the low-power loads) to introduce errors. Hence, a formulation of the inter-cycle aging mechanism is required.
To tackle these issues, this paper starts with explanation of PhyNode as an industrial IoT device used as a case study. Afterwards, measurement setup and its quality assurance for the low-power loads is explained. It is followed with the measurement and comparison of the SoC-Ve curve identification from both methods. Then, the overall dynamic model is formulated including the aging and current factors for low-power loads. Next is the evaluation of the proposed model and analysis of the new aging formalism. Finally results are summed up and some future research topics are suggested. Appendices include abstract procedures to replicate all experiments used within this work.

2. Case Study

PhyNode built by low-power components is equipped with a low-budget Lithium-ion Polymer battery with the model No. LP632670 produced by Blue TaiYang. Its nominal capacity is 1250 m A h . It has a typical 4.2 V over-voltage limit and a cut-off voltage of 3.0 V . Its I n is at C/5 with a maximum rate at 1C. Furthermore, its manufacturer claims an end-of-life after 300 cycles when operating at I n .
To analyze this battery at low-power loads, PhyNode’s demanded currents ( I p n ) is measured in different voltage levels for all of its operations [17]. Representation of these loads at some of voltages is shown in Figure 2. Its current is in a limited range with a peak around 32 m A and a minimum at about 900 μ A during the idle phase.
Capacity measurement of five new PhyNodes batteries has shown an average initial capacity of 4584.45 A s . Comparing this value with the end of life capacity, a large capacity loss is obvious during only 300 cycles with an average loss of 3.28 A s per cycle. In spite of its small value, this presents a different image when considered in a low-power application such as PhyNode. This difference means more than 100 s extra operation with the highest load or one extra hour of idle operation. This disparity shows the necessity of a more accurate analysis of the aging within a cycle for the low-budget batteries used in the low-power applications.
Considering small scale of loads, measurements of the battery requires extra precision. Consequently, instead of using common cyclers, a Keysight B2902A Source Measurement Unit (SMU) is used here. This device has a resolution of 10 f A and 100 nV which fits perfectly for the measurement of small signals. Due to the safety reasons, a Keysight U2941A test fixture holds the battery inside a metal box and connects it to the SMU with a 4-wire (Kelvin) connection. For each measurement a MATLAB program is written which sends Standard Commands for Programmable Instruments (SCPI) commands to set the behavior of the SMU and its measurements. All these experiments are explained in Appendix A and their related program can be accessed publicly from [18]. Initial condition plays a critical role in the battery measurements, because of the integrative behavior of most parameters. Therefore a fully charged condition is used as the initial condition for all measurements. This charge process is pursued with application of a chirp signal to remove the hysteresis according to the guideline provided in [9,19].

3. Modeling

Development of the desired open-loop model has three main parts as:
  • Identification of the relation between V e and SoC;
  • Explanation of a method for finding the SoC relation to fulfill requirements of the low-budget batteries;
  • Dynamic model identification.
which are explained hereafter.

3.1. Soc- V e Relation

In an Equivalent Circuit Model (ECM) of the battery, knowledge of the V e is integrated into the model. This value in the form of a voltage source is essential to calculate the terminal voltage. Since this voltage is dynamically dependent on the SoC, the relation between these two parameters has to be identified. To evaluate accuracy and performance of two common techniques for the extraction of this relation, they are both measured here.

3.1.1. Continuous Discharge Method

Researchers such as [9,13] suggest a continuous discharge current at a rate of C/30 for a the continuous discharge identification of the SoC-Ve relation. This rate is equal to 41.6 m A for the PhyNode’s battery, which is unfortunately even higher than its maximum current demand. Hence, instead of this exact value, a wide range of currents are used to find the proper current criteria here. Measured battery voltage for different currents from the PhyNode’s battery are presented in Figure 3.
To be noted that all measurements start from a fully charged state discussed formerly. In addition, OCV is measured in the beginning of each experiment before application of the current step. This helps to estimate the series resistance of the battery. By assumptions of no active dynamics for these cases and a constant series resistor for the whole discharge curve, measured terminal voltage can be converted to the V e by use of the Rint model as:
V e = V b + R 0 · I b
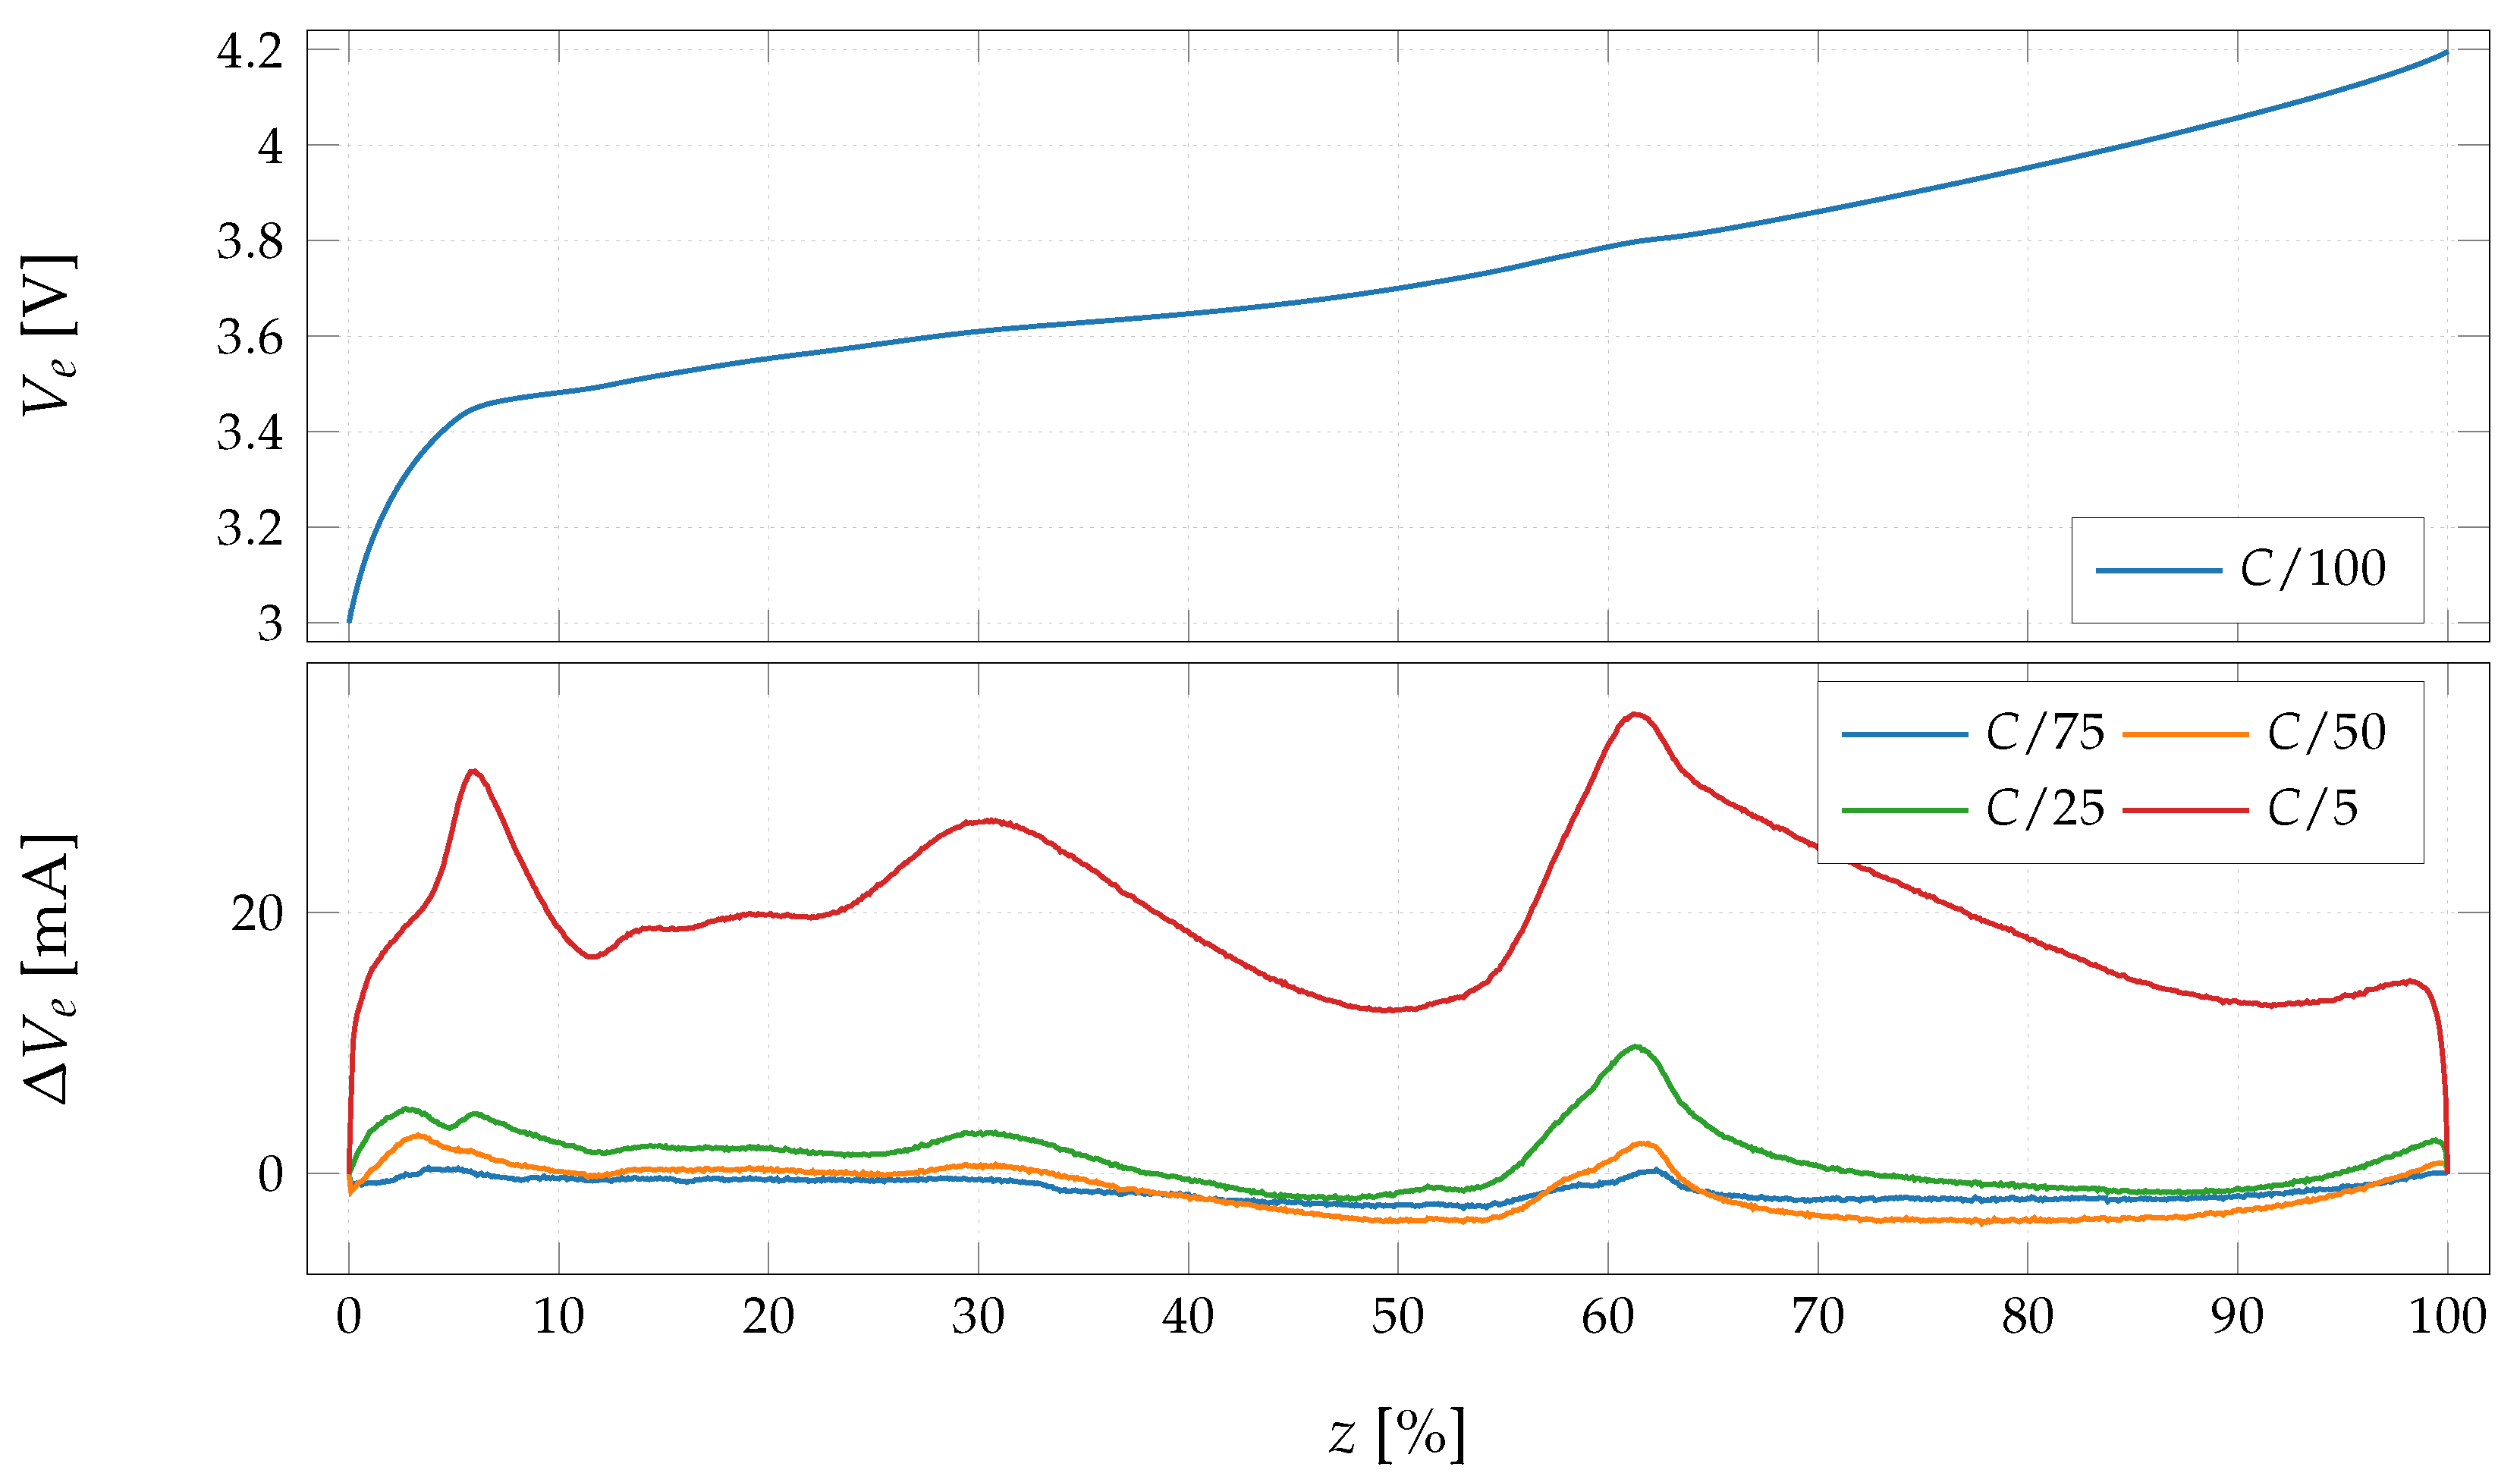
Then, the measured capacity of the battery for each discharge current can be found for the related curve by integration of the current over time. This capacity is used to convert the time axis into the SoC value to explain the SoC-Ve relation. By repeating this procedure, the SoC-Ve relation is found for all considered currents. This relation for the lowest current at a semi-infinitesimal current ( I ϵ ) = C/100 is shown in Figure 4. Furthermore, this shows the difference of all other curves from the I ϵ curve as a base measurement here. While all curves have the typical shape of Lithium-based batteries, it can be seen that except for the current value at C/5 other curves are very similar to the base curve.
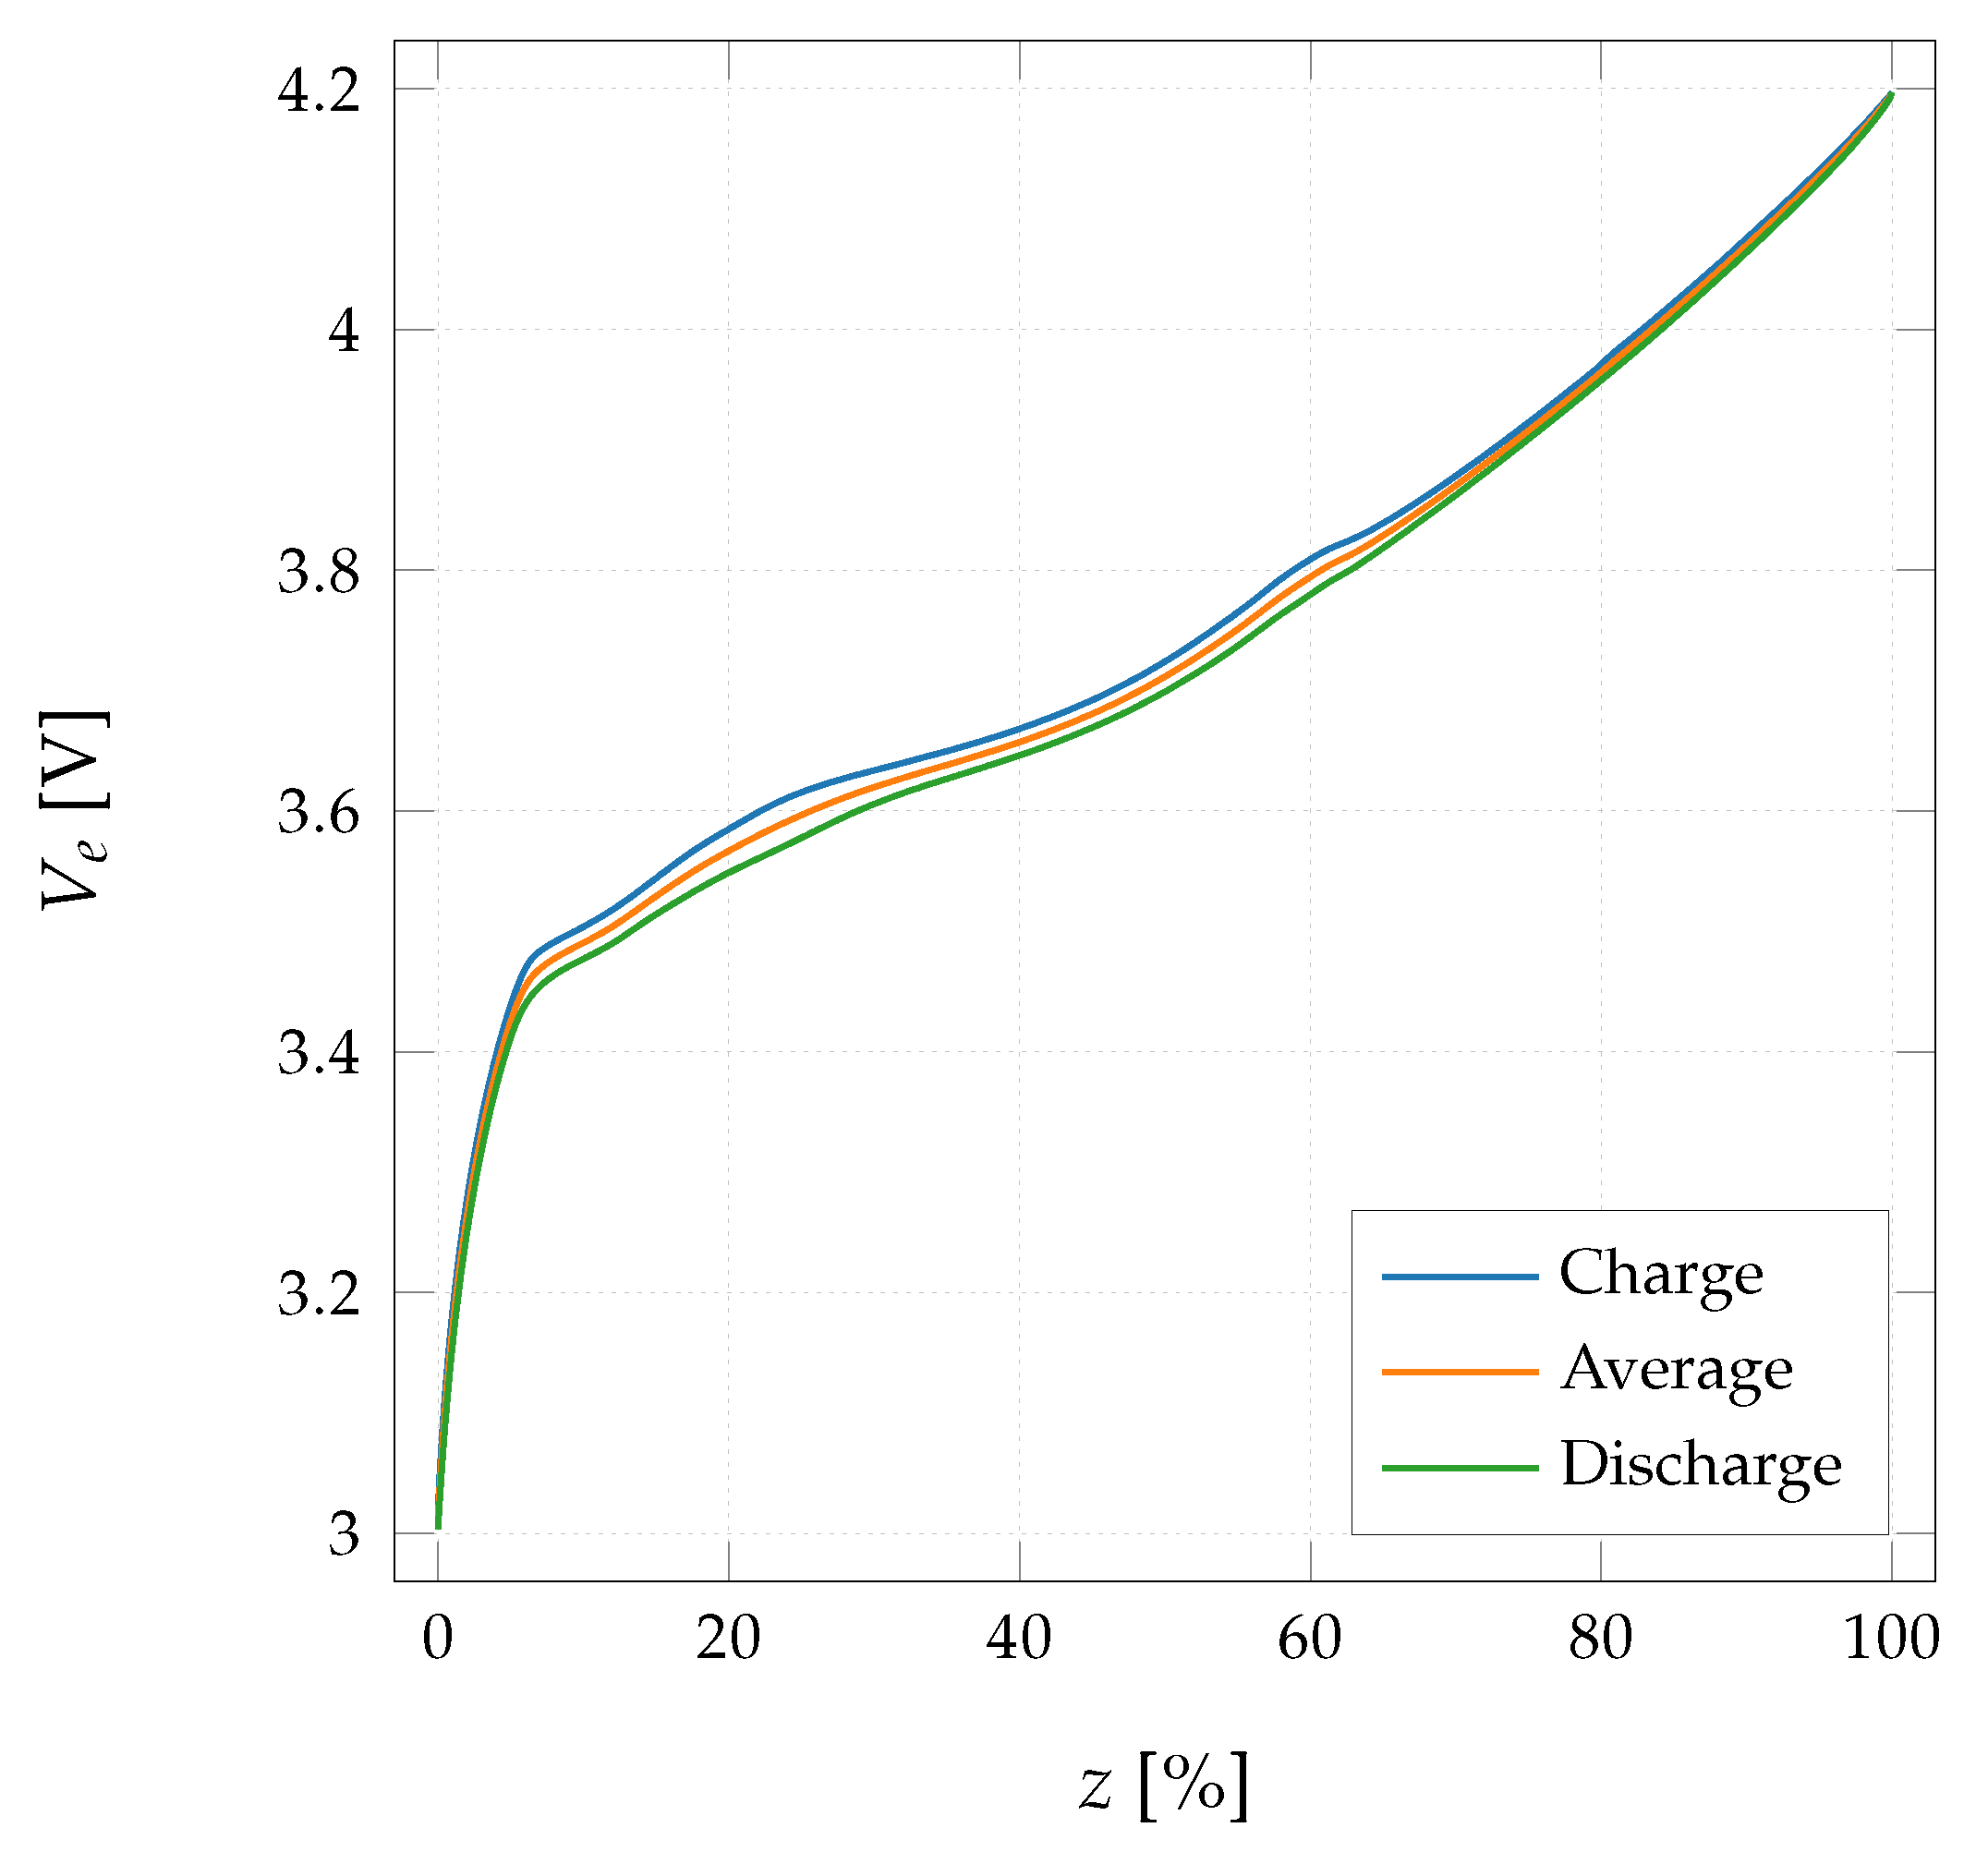
Small differences between small currents’ curves can somehow approve the assumption of measuring with less than C/30. However, to assure the highest possible accuracy, data from I ϵ = C/100 are used hereafter as the representative of this method. To consider this relation valid, the hysteresis effect has to be removed from the curve as well. Consequently, at the end of the discharge process, the battery is depleted with the I ϵ for a second round after a short rest period. Subsequently a chirp signal is applied to remove the hysteresis. After one hour of rest, it is supposed that the battery is at the fully discharged condition. Then the charge curve with the same current is measured and similar calculation procedure is applied on the resulting curve. Measured curves in both directions for the I ϵ current are shown in Figure 5. To remove the hysteresis effect seen in Figure 5, the averaged curve of both direction will be used as the SoC-Ve relation.

3.1.2. Discrete Discharge Method

In this method no assumption is included and V e is measured directly during the procedure. Unfortunately this causes long measurement period as a consequence of the long rest period till the internal dynamics of the battery are stabilized and the measured OCV is equal to the V e . However, the result of this method is the actual SoC-Ve relation and can be used as the ground-truth for the evaluation of the continuous technique. Nonetheless, this method can only provide data at specific discrete points and not all possible values are covered similar to the continuous technique.
Smaller drained charges during a pulse will help to reduce the discontinuation of the curve and have a better reproduction of the overall form. Moreover, from the overall shape of the curve in Figure 5, changes in the curve are much faster in the hyperbolic section, requiring a more dense sampling. Furthermore, with different experiments it has been found that the rest period to reach the steady state OCV has an inverse relation with the SoC value. Therefore, rest period shall increase during this measurement when the SoC is dropping. Using all these considerations, measured V e during this discrete discharge for the PhyNode’s battery is as presented in Figure 6. Initial condition before application of the first pulse is the fully charged condition similar to the measurements for the continuous method.
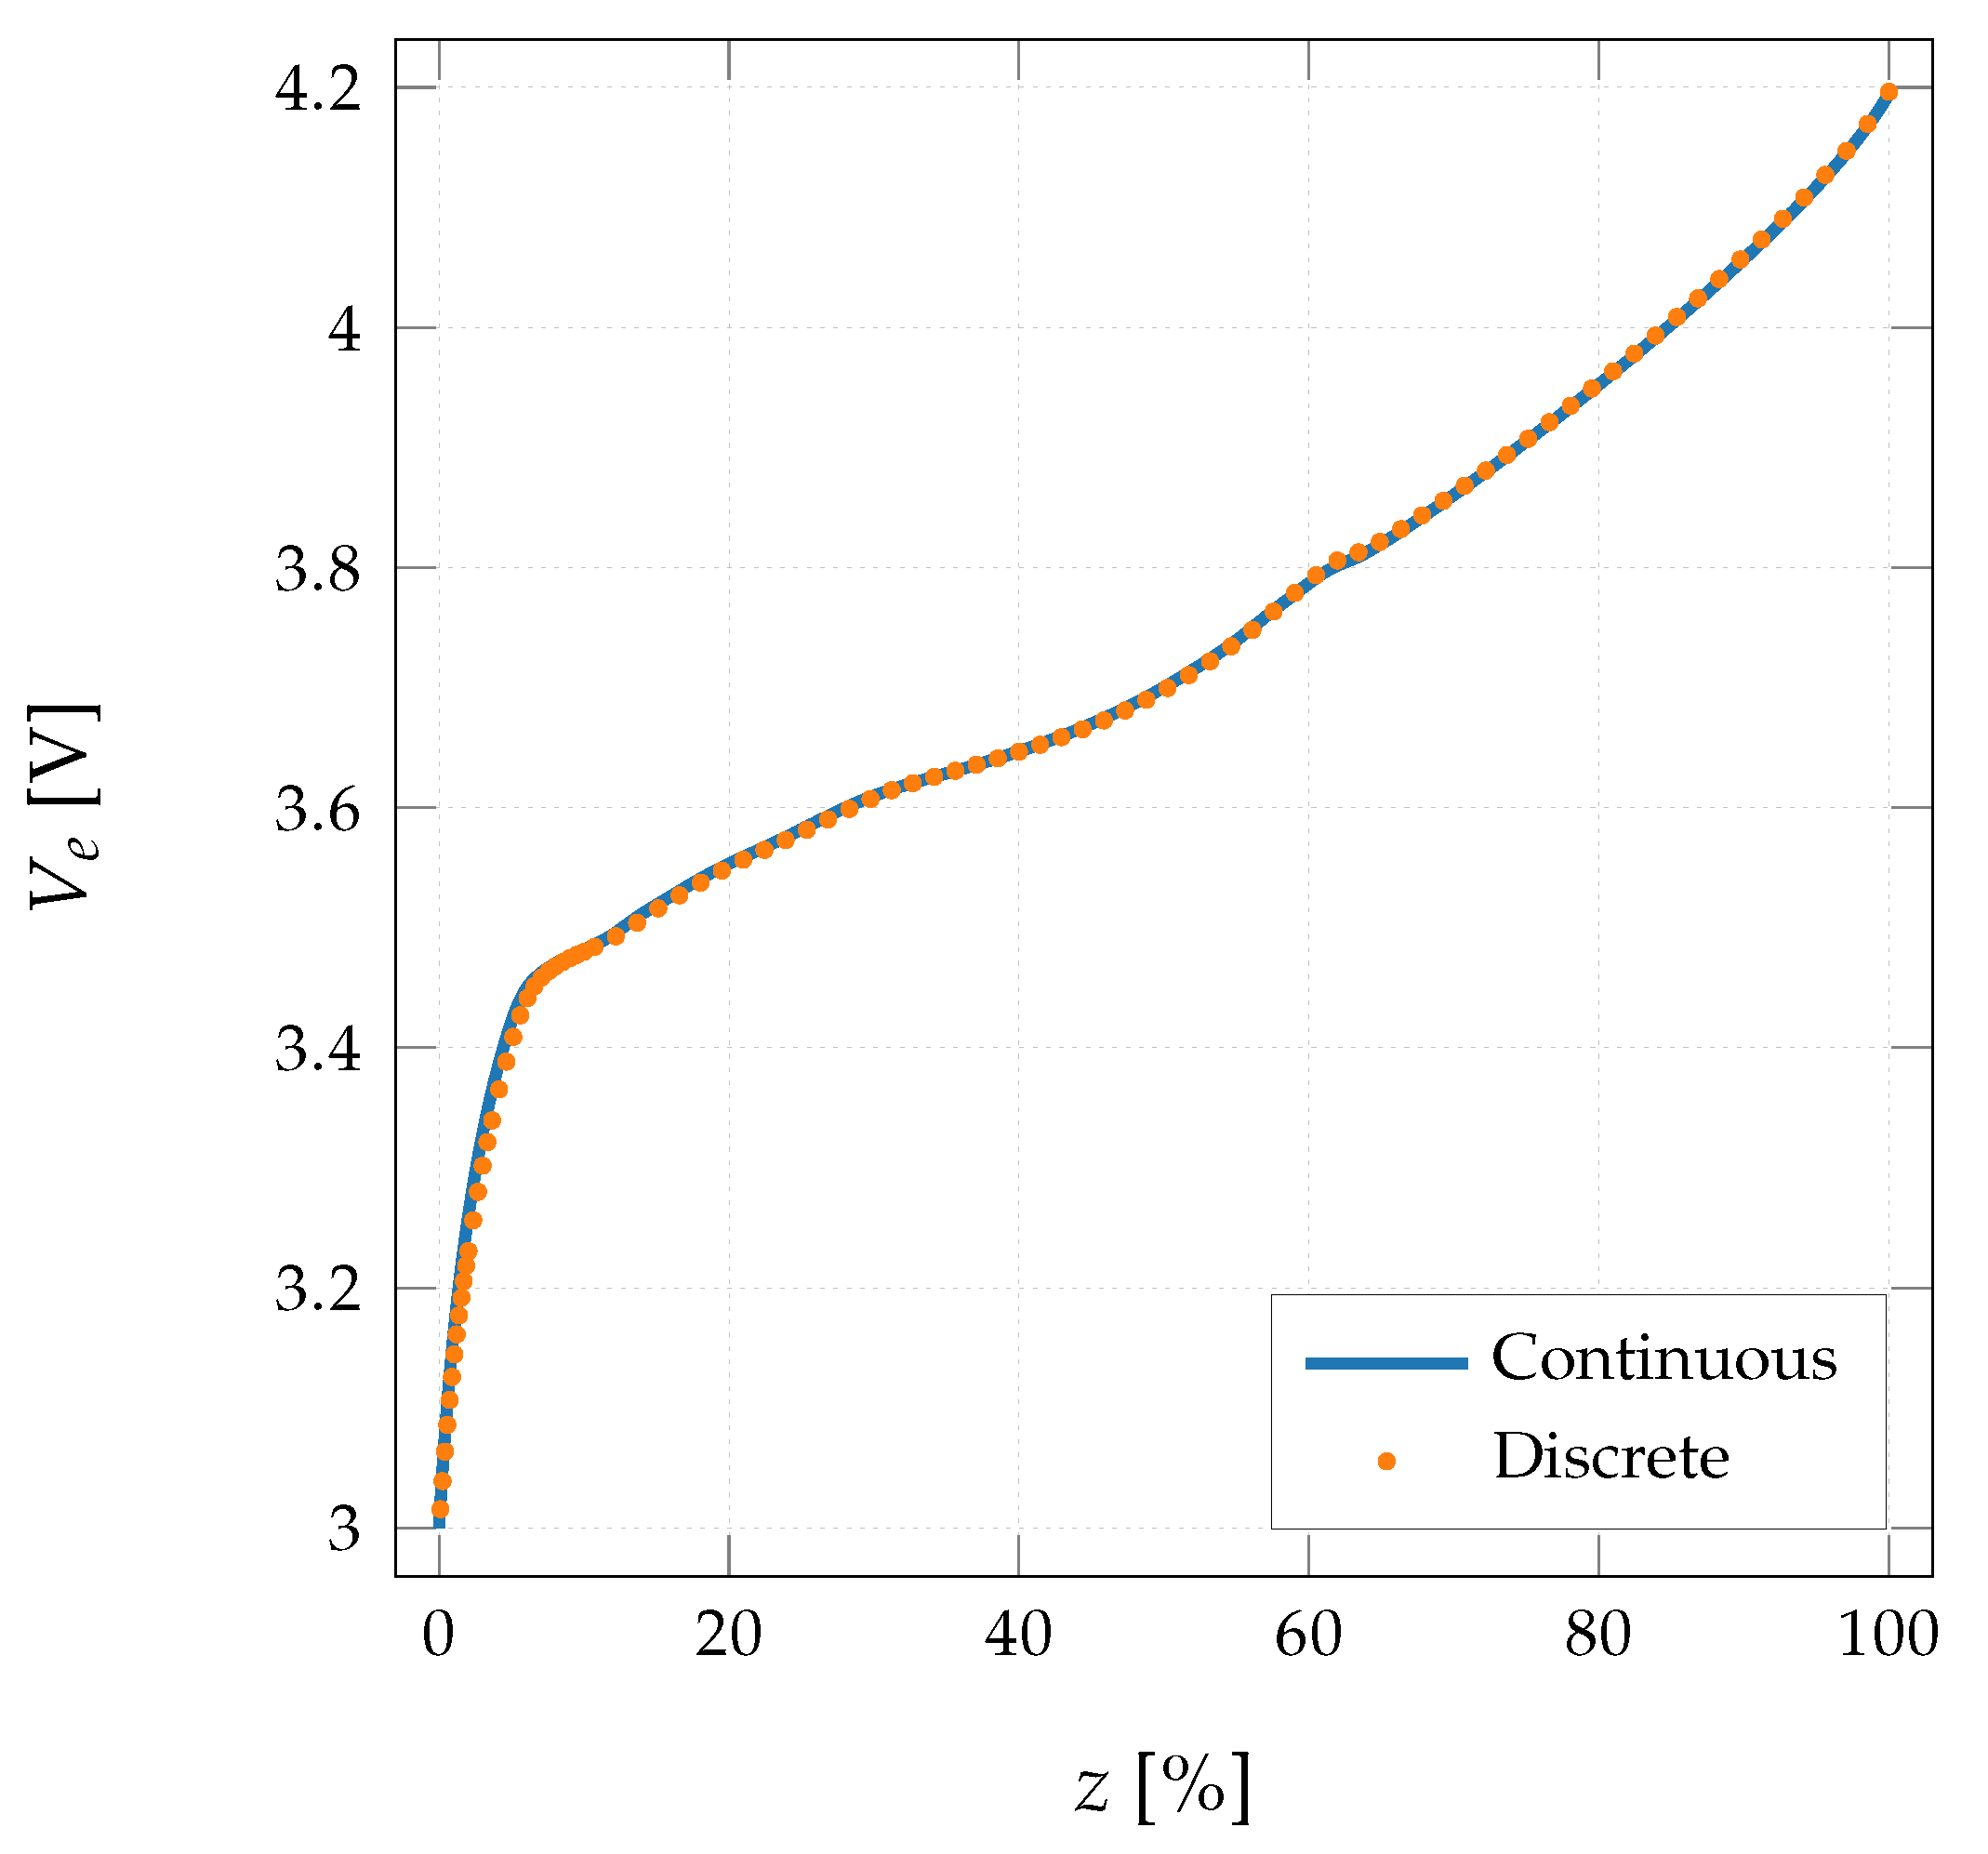
Due to the recovery effect, the exact cut-off voltage of 3 V cannot be reached in the steady state. During pulse applications discharge current stops as soon as the cut-off voltage is reached. Consequently, voltage increases again during the following rest period. Hence, the exact capacity cannot be found directly. However, the last measured voltage is very near to the cut-off value and an estimation can be simply done by extrapolation of the curve. This capacity is used for the conversion of the curve according to the SoC. Subsequently, comparison of the SoC-Ve relation from this method with the curve from the continuous discharge with I ϵ are presented in Figure 7.
This comparison shows a similar behavior with very small differences, mostly in the hyperbolic section. However, it has to be clarified if these discrepancies are only measurement errors or a consequence of some systematic differences between these two methods. In Figure 7, V e from the discrete method is higher than the continuous curve, especially in the hyperbolic section. However, it should be the other way around because of the recovery effect. Consequently, it is clear that the aging in between measurements has caused small changes in the shape of the curve.
Considering fast aging of low-budget battery, it can be concluded that the continuous method with small current (in the scale of C/100) is valid and comparable to the discrete SoC-Ve relation. However, the continuous current has to be smaller than the normal load range to avoid errors in the same scale as the signals. Moreover, it is clear that the effect of the aging is much more critical in these applications and has to be included in the SoC estimation.
Before discussing the SoC estimation method, differences between batteries due to the production tolerances should be included in the SoC-Ve relation as well. Therefore, this curve is identified using C/100 for 5 different batteries from the same batch. The result of these measurements presented in Figure 8 shows small difference in between these batteries. To include these differences and have a more general model, a compromise is done by using the average of these curves as the final relation.

3.2. Soc Estimation

A large set of methods are available for the SoC estimation which the most common ones according to [20,21] are:
  • Ampere-hour (Coulomb counting);
  • OCV based;
  • Model based;
  • Data driven;
  • Impedance based;
  • Based on the static characteristics;
  • Non conventional.
While each method has its pros and cons, Ampere-hour technique is forced here due to the fact that the model has to be open-loop while no signal measurement is possible. A general challenge of this method is the integrative error growing during the experiment. However, because of using high accuracy signal measurements by a SMU, integrative error causes minimal problem here. Using a general definition of SoC (z) from the Ampere-hour method, it can be formulated using Equation (2) [7].
z ( t ) = z 0 100 Q · 0 t η ( τ ) · I b ( τ ) d τ
when Q is the total capacity of the battery representing its maximum possible capacity. Furthermore, η is a general representation of all factors changing with the time including dependency to the current ( η c ) and aging efficiency ( η a ). Consequently, total capacity and both scaling factors in Equation (2) have to be defined to reach a valid model.
Starting with the identification of the Q, it is known that the discharge current has an effect on the measured capacity. Moreover, nominal capacity ( C n ) is measured by I n which is in a much larger scale than the low-power loads of the battery. Therefore, it is better to use a capacity size measured by a current in the range of loads; such as the one from I ϵ at C/100. However, it is known from the SoC-Ve relation identification that the capacity measured from the discrete method is even larger than the capacity of the continuous discharge with I ϵ . Hence, the capacity from the discrete SoC-Ve relation identification is supposed as the Q here. Nonetheless, as seen in Figure 7, even this value is dependent on the aging status of the battery. Furthermore, there is no exact information from aging behavior of the low-budget batteries. Therefore, an aging identification mechanism is necessary.
Due to the relative nature of the aging, C n is considered as the base point. This means that the battery is at its neutral aging status when its capacity (measured with I n ) is equal to the C n . All other statuses of the battery have to be scaled according to this specific condition. To analyze the aging status at each point, a standard test is defined which starts from the fully charged state and discharges the battery with the I n . Using this experiment, the aging condition of a battery can be found using Equation (3):
η a = 1 C n · 0 t d I n ( τ ) d τ = I n · t d C n
Based on the form of Equation (2) where factors are multiplied to the DoD, it would be easier to define the aging factor ( ζ a ) as the inverse of the η a by:
ζ a = 1 η a ζ a = C n I n · t d
While a standard test can explain the relative aging status of the battery, the actual aging during each experiment is still not defined. Therefore, one standard test is measured before each experiment and one after. This process can be understood more clearly in an abstract overview presented in Figure 9.
Exploiting these two standard tests and finding their ζ a from Equation (4), an estimation for the experiment’s aging factor can be found as the average of these two values. Using this method, it is possible to convert Q into the normalized total capacity ( Q n ) using Equation (5) when ζ a ( d ) is the aging factor found for the experiment of the discrete SoC-Ve identification.
Q n = ζ a ( d ) · Q
After definition of the standard test and finding Q n , effect of the current level on the calculation of the SoC has to be formulated. Therefore, the process of measuring the standard tests is applied during multiple continuous discharge measurement and ζ a is found for each experiment. By reformulating Equation (2) and use of the normalized total capacity from Equation (5), current efficiency for each I b can be found using Equation (6).
η c ( I b ) = ζ a ( I b ) Q n · 0 t d ( I b ) I b ( τ ) d τ
It has to be noted that this factor is in the normalized situation while its curve is scaled according to the base condition by use of its corresponding aging factor. Next, Equation (6) can be simplified into Equation (7) due to the constant current during a discharge.
η c ( I b ) = ζ a ( I b ) Q n · I b · t d ( I b )
By defining the current scale factor ( ζ c ) as the inverse of the current efficiency from Equation (7), each discharge curve can be related to the normalized total capacity using:
Q n = ζ a ( I b ) · ζ c ( I b ) · 0 t d I b ( τ ) d τ
Hence, each normalized discharge capacity will be equal to the normalized total capacity, which is actually the whole concept of the SoC definition. Finally, ζ c for each discharge curve can be found by restructuring Equation (8) and substituting Equation (5), leading to:
ζ c ( I b ) = ζ a ( d ) ζ a ( I b ) · Q t d · I b
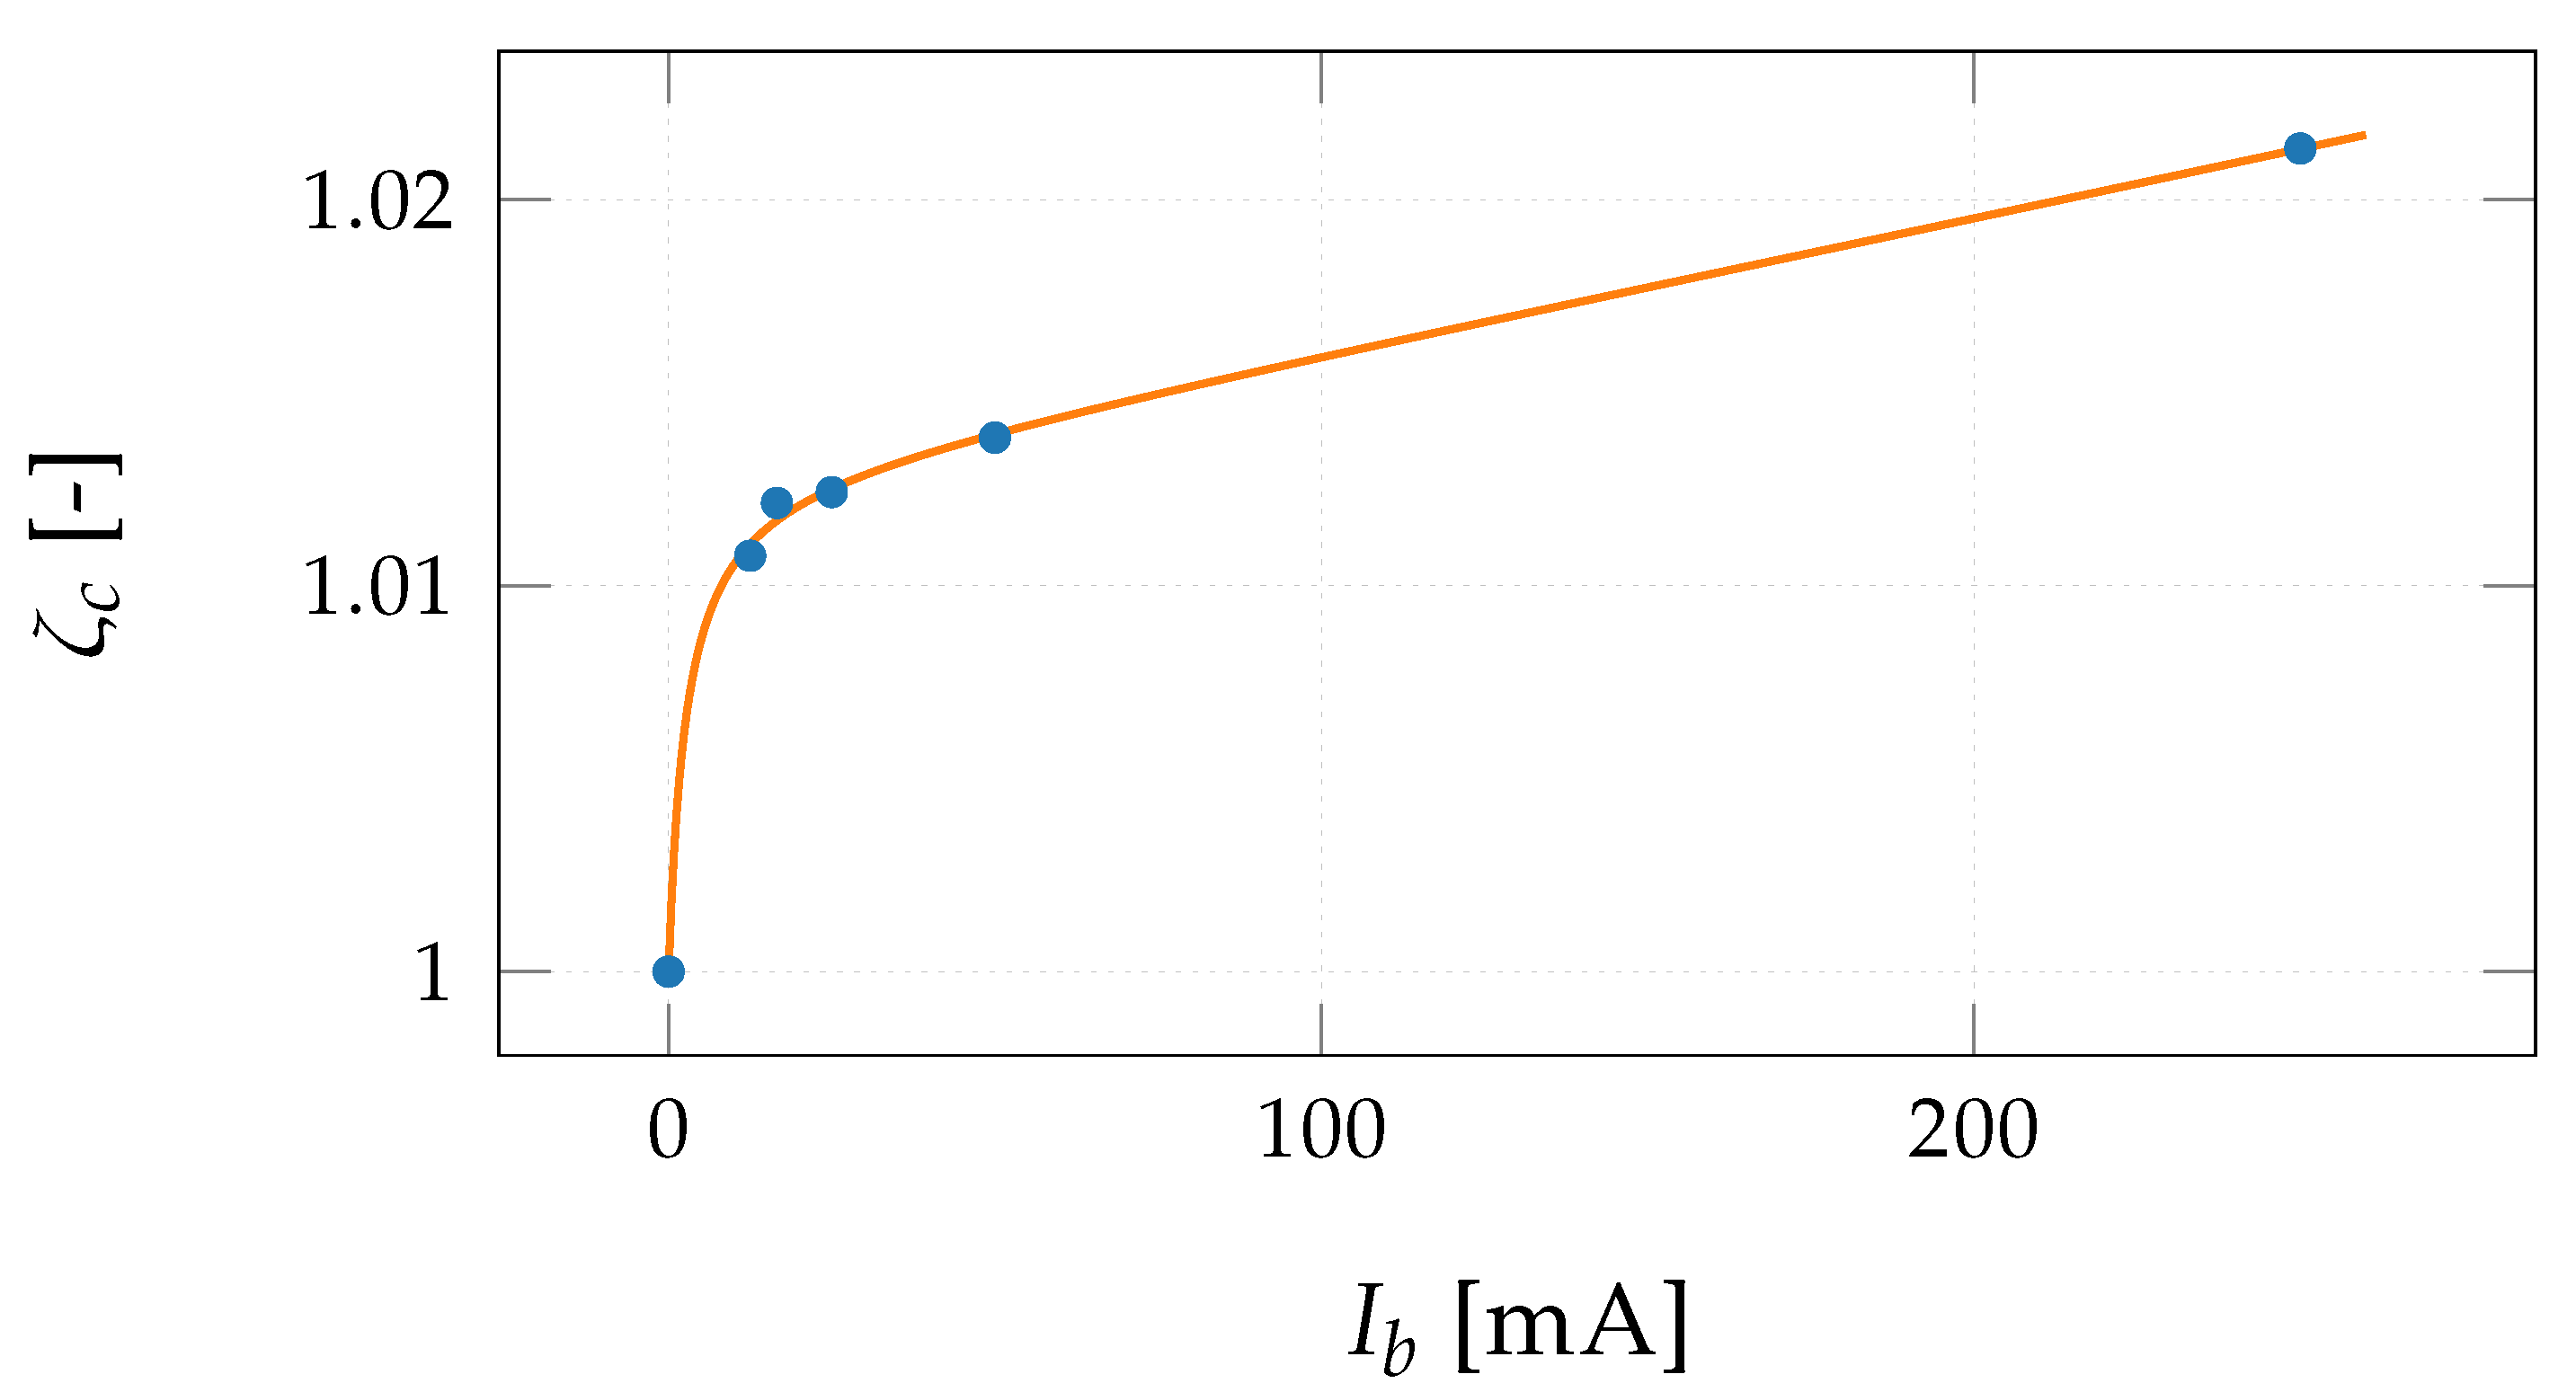
Using Equation (9) and experiments with multiple currents from the continuous SoC-Ve identification method, ζ a for each current has been calculated which their distribution is shown in Figure 10.
In this representation, value at zero current is from the discrete method which is used for the calculation of the Q. To include the current behavior into the model in a more systematic way, this form is mimicked by an exponential ratio with a tuned version as:
ζ c ( I b ) = 0.5287 · exp ( 1.089 · I b ) 0.5271 0.5545 · exp ( 1.025 · I b ) 0.553
Finally, by inclusion of all these information, SoC can be found using Equation (11).
z ( t ) = z 0 100 · ζ a Q n · 0 t ζ c ( τ ) · I b ( τ ) d τ
However, different tests have shown that considering a single ζ a for the whole discharge process of a low-budget battery introduces extra errors to the system. This is mainly because the battery is aging during the discharge as well, while a single ζ a is somehow an estimated value for the whole discharge curve. Therefore, an inter-cycle dynamic aging factor is introduced. In this manner, initial ζ a is equal to the factor from the last standard test ( ζ a 1 ) which changes till it reaches the final aging factor. This final value is the average of factors from both standard tests. Although process of change in between these two values can be explained by use of a complex electro-chemical model of the battery, a simple linear change according to the SoC status will be used here. Consequently, Equation (11) can be advanced into Equation (12).
z ( t ) = z 0 100 Q n · 0 t ζ a ( τ ) · ζ c ( τ ) · I b ( τ ) d τ
when:
ζ a ( t ) = ζ a f + z ( t ) 100 · ζ a f ζ a l
In Equation (13), ζ a f is the aging factor from the standard test before the main experiment ( ζ a 1 in Figure 9) and ζ l is the estimated factor for the whole curve as the average of both standard tests.

3.3. Dynamic Model

After identification of the SoC-Ve relation and definition of a proper SoC formulation method including the inter-cycle aging factor, complete dynamic model has to be built. Simplicity of the Equivalent Circuit Models (ECM) makes them a perfect candidate for replication of the battery dynamics. However, a key aspect of these models is the number of required R C pairs to mimic the right level of dynamics. The optimal number of R C pairs can be found by analyzing performance of the ECMs with different sets. Consequently, dynamic voltage-current relation of the battery is formulated. In a simple Thevenin model, terminal voltage can be written using Kirschhof equations as:
V b = V e ( z ( t ) ) R 1 · i R 1 ( t ) R 0 · I b ( t )
when i R 1 ( t ) is found using an ordinary differential equation in Equation (15):
d i R 1 ( t ) d t = 1 R 1 · C 1 · I b ( t ) i R 1 ( t )
It is known that the solution of this equation leads to an exponential function. Due to the discrete time form of the measurement, Equations (14) and (15) can be written as Equation (16) in the discrete form.
i R 1 [ k + 1 ] = exp ( τ r c ) · i R 1 [ k ] + [ 1 exp ( τ r c ) ] · I b [ k ]
V b [ k ] = z [ k ] R 1 · i R 1 [ k ] R 0 · I b [ k ]
when τ r c is the time constant of a R C pair, explained by:
τ r c = Δ t R 1 · C 1
Expanding discrete time form for a general model with m sets of R C can be formulated as:
τ r c j = Δ t R j · C j , j { 1 , , m }
i R j [ k + 1 ] = exp ( τ r c j ) · i R j [ k ] + [ 1 exp ( τ r c j ) ] · I b [ k ]
V b [ k ] = V e [ k ] j = 1 m R j · i R j [ k ] R 0 · I b ( t )
Using Equation (18) with 1 R C to 3 R C , models are fitted to the recovery tail of the pulse responses from the discrete SoC-Ve identification. The error for these tuned models on an example recovery period is presented in Figure 11.
From Figure 11, performance deficiency of 1 R C model is clear, while differences between the 2 R C and 3 R C models are minimal. Therefore, a 2 R C model will be a good trade-off between performance and computational complexity of the model.
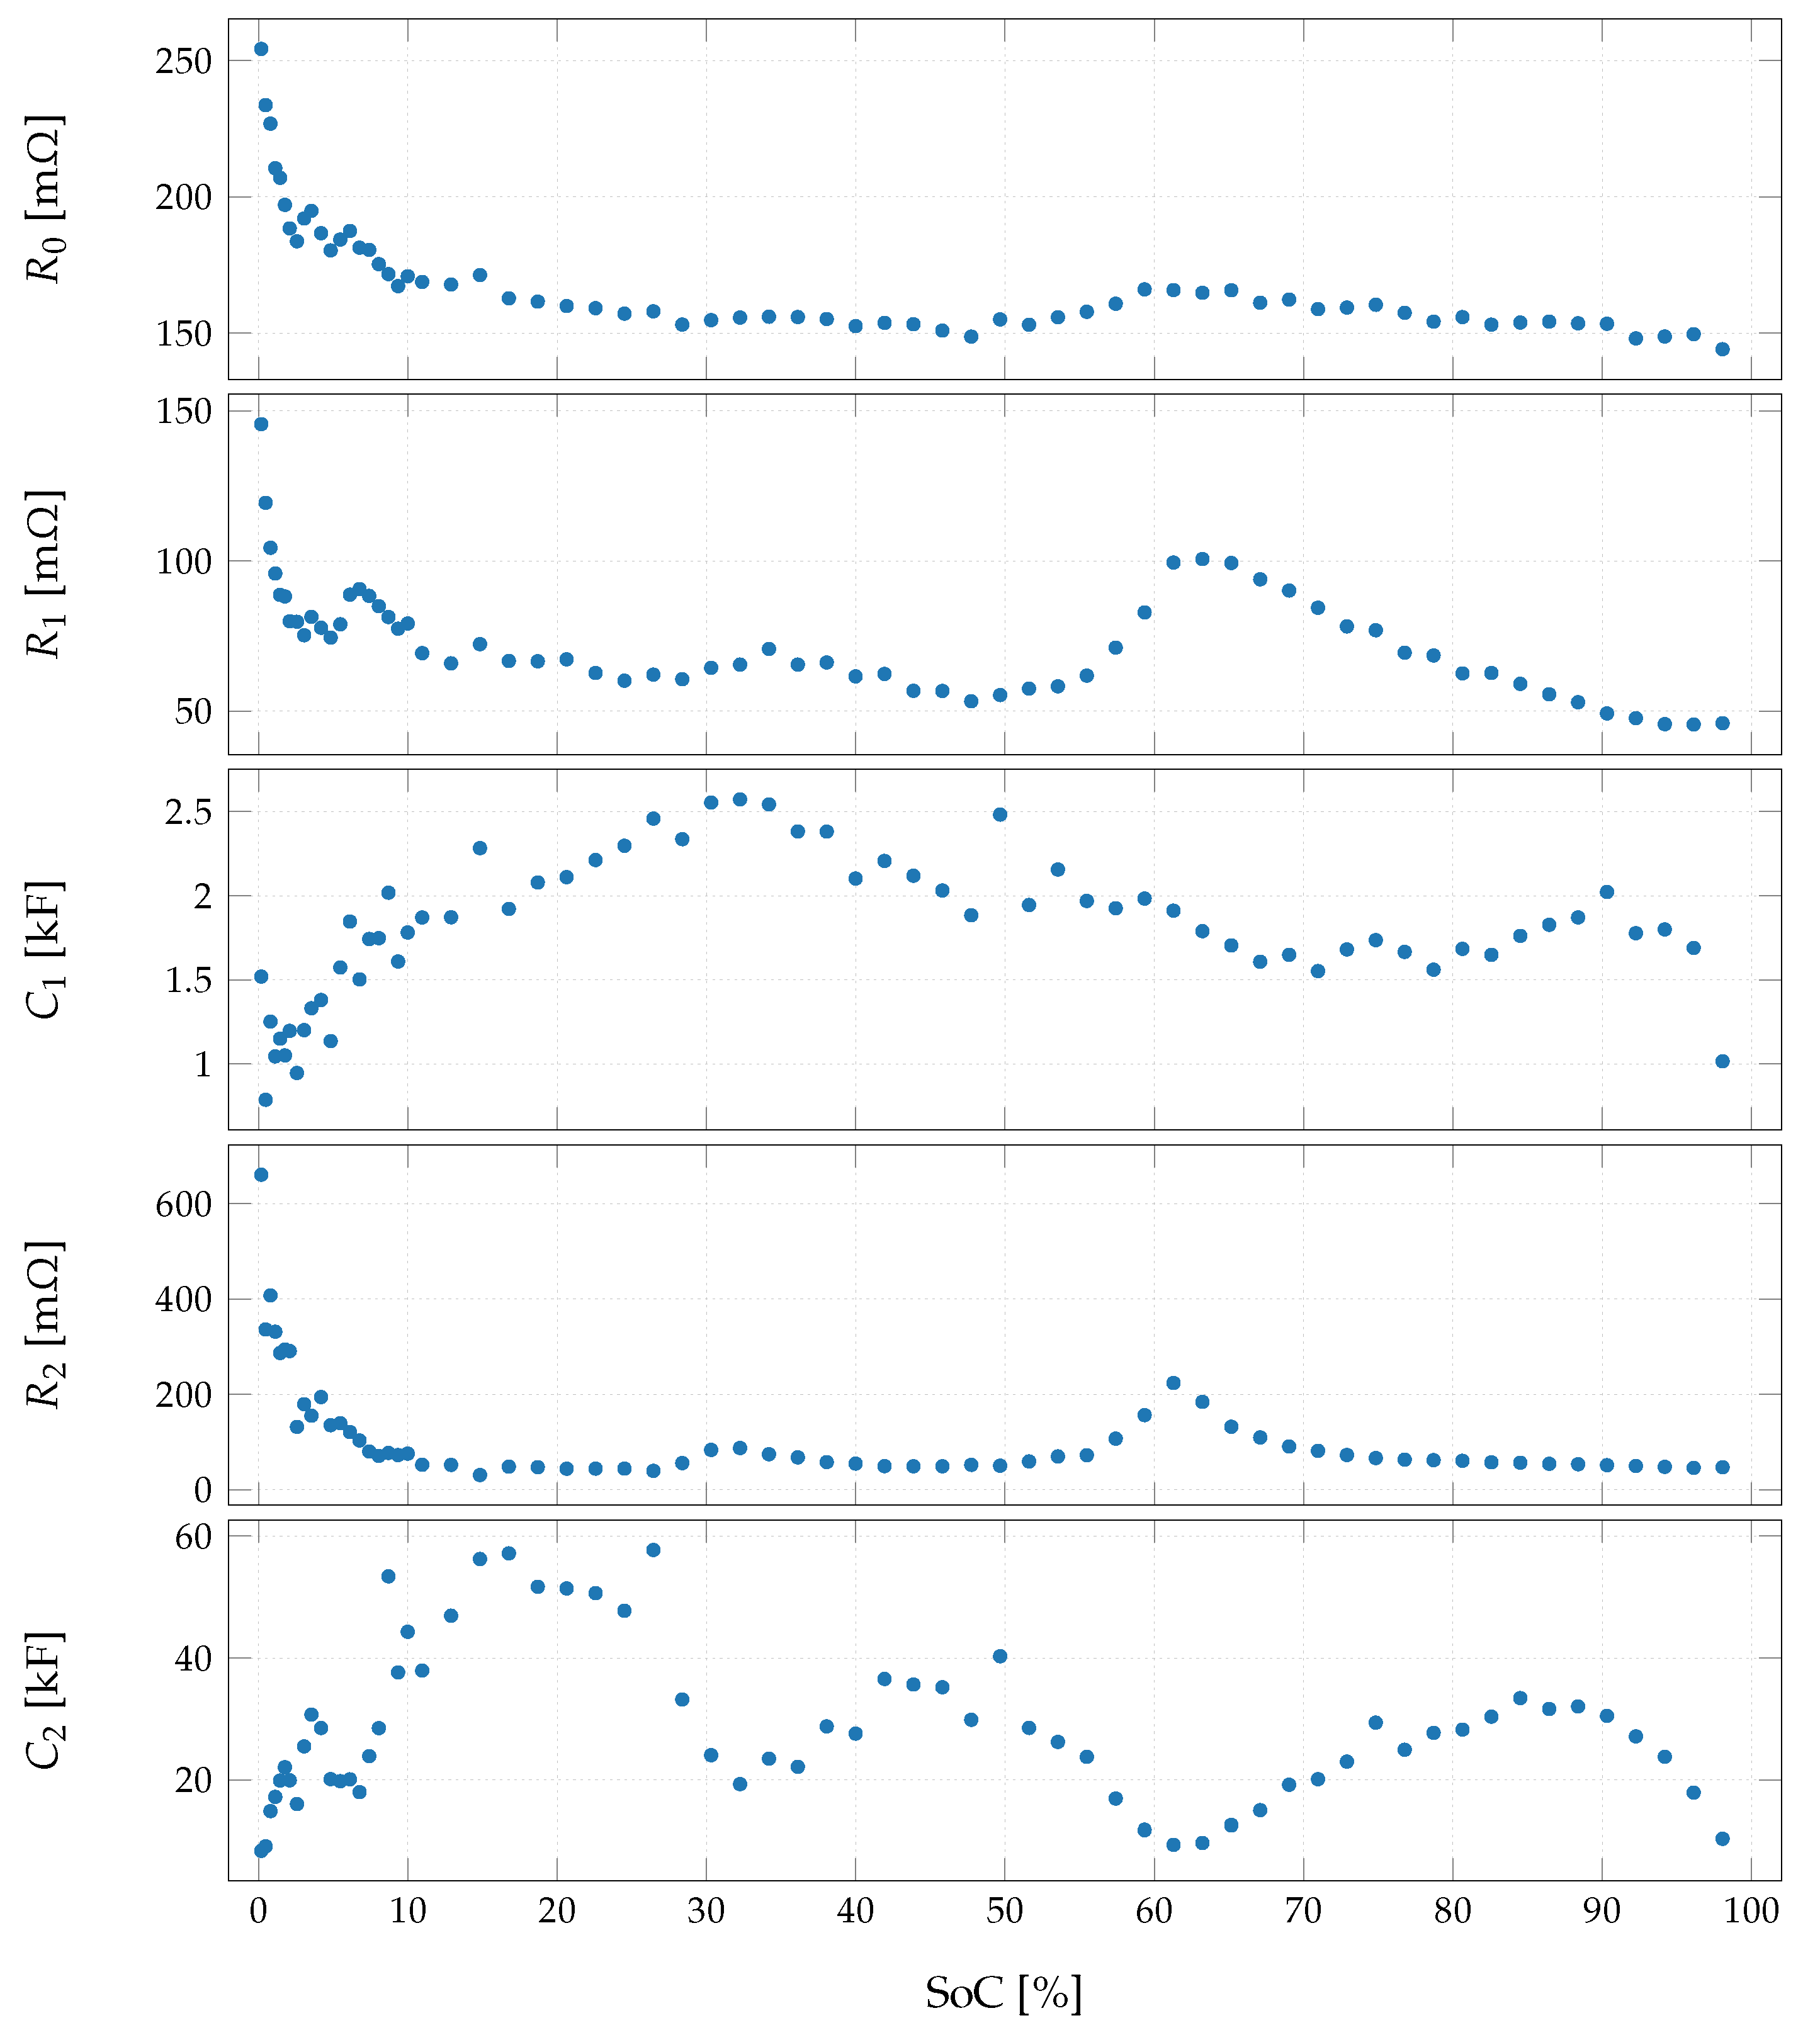
Final remaining requirement for completion of the dynamic model is knowledge about behavior of the parameters in the ECM according to the SoC. These data can be simply extracted from the recovery tail of pulses in the discrete SoC-Ve relation identification experiments. All parameters are extracted for the related SoC values by optimizing the 2 R C model to each of the experiments. These parameters are shown in Figure 12.
Changes according to the SoC value is obvious for all parameters. Therefore, each parameter is stored in a Look-up Table (LuT) as a part of the model.
All in all, detailed model with current as input and V b as output presented in Figure 1 is made by an ECM with 2 R C sets presented in Figure 13.
In this ECM, terminal voltage can be explained by:
V b [ k ] = V e [ k ] R 0 ( z [ k ] ) · I b [ k ] R 1 ( z [ k ] ) · i R 1 [ k ] R 2 ( z [ k ] ) · i R 2 [ k ]
when:
χ [ k ] = LuT χ ( z [ k ] ) , χ { V e , R 0 , R 1 , R 2 , C 1 , C 2 }
z [ k + 1 ] = z [ k ] 100 · ζ a [ k ] · ζ c [ k ] · I b [ k ] · Δ t / Q n
ζ a [ k + 1 ] = ζ a f + [ z [ k ] · ( ζ a f ζ a l ) ] / 100
ζ c ( I b ) = ( 0.5287 · exp ( 1.089 · I b ) 0.5271 ) / ( 0.5545 · exp ( 1.025 · I b ) 0.553 )
i R 1 [ k + 1 ] = exp ( τ r c 1 [ k ] ) · i R 1 [ k ] + ( 1 exp ( τ r c 1 [ k ] ) ) · I b [ k ]
i R 2 [ k + 1 ] = exp ( τ r c 2 [ k ] ) · i R 2 [ k ] + ( 1 exp ( τ r c 2 [ k ] ) ) · I b [ k ]
τ r c 1 [ k ] = Δ t / ( R 1 ( z [ k ] ) · C 1 ( z [ k ] ) )
τ r c 2 [ k ] = Δ t / ( R 2 ( z [ k ] ) · C 2 ( z [ k ] ) )
This model is presented in the time discrete form while all measurements are in a digital discrete configuration.

4. Evaluation

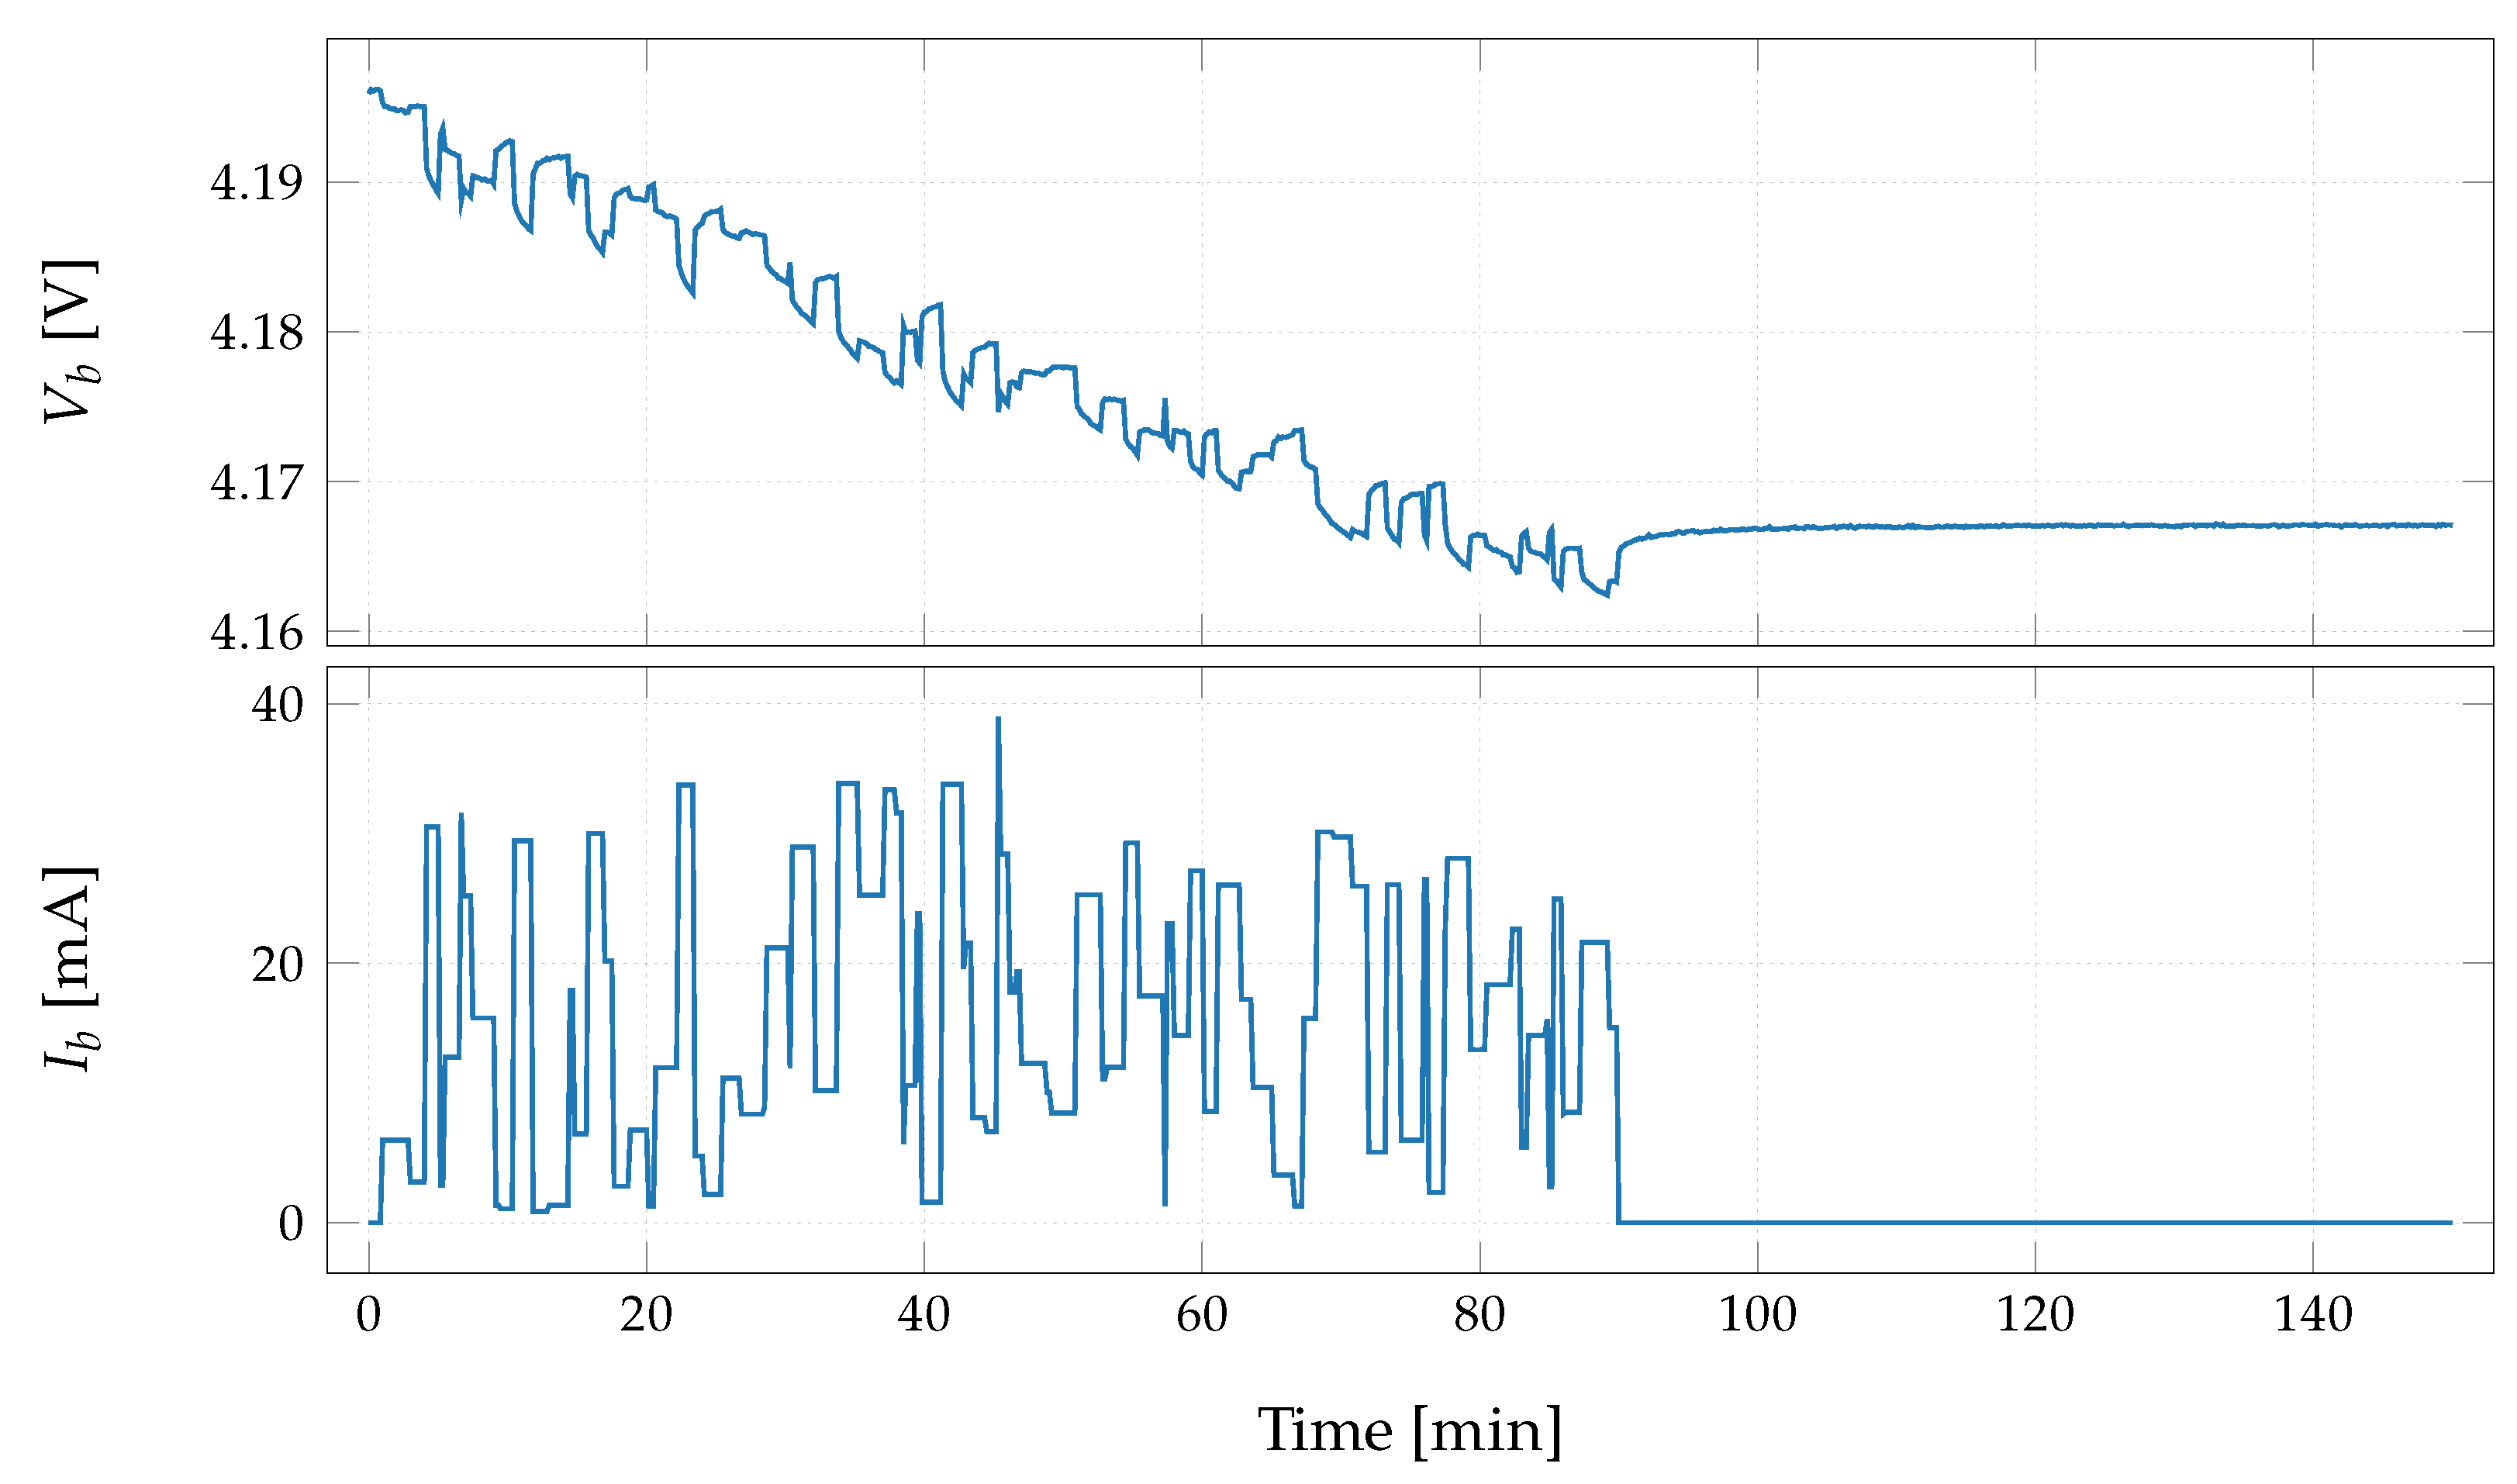
For the evaluation of the developed model, two different experiments are designed here. The first test has a more random nature while the second one uses the exact behavior of the PhyNode’s load to check it in a realistic form. The initial test is made by application of randomly selected pulses with a maximum of 35 m A for a random duration between 1 s to 120 s. These pulses are subsequently applied to the battery while both terminal signals are measured with a 100 ms sample time. Due to the memory limitation of the SMU, it is not possible to measure a complete low-power discharge within a single measurement. Therefore a workaround is used in a way that after 90 min pulse application is stopped and the OCV during the recovery effect is measured for one hour. Directly after reading all data from the memory, a new experiment is applied and this procedure is repeated till the lowest voltage is reached. Use of no current period at the end of each experiment assures no voltage change during data transfer from the SMU. Moreover, it is possible to use this recovery tail as a performance criteria for the aging effect. An example of signals from one such experiment are presented in Figure 14.
Performance of the suggested model on the overall random evaluation set made of 50 subsequent experiments is presented in Figure 15 in the form of the relative error ( ρ ) of the terminal voltage.
As can be seen, the overall relative error is in a small range and proposed model is able to predict the dynamics of the battery. This model provides a very good estimation of the terminal voltage, despite lack of any feedback in the model. One critical aspect which has to be noted here, is inclusion of the inter-cycle aging factor to the model. In case a single static ζ a is used for the whole discharge instead of Equation (20c), performance of the model will be much worse, which is shown in Figure 16.
Comparison of Figure 16 with Figure 15 clearly shows the necessity of the inter-cycle dynamic ζ a . In Figure 15 model is underestimating the voltage in the beginning. However, this trend changes toward the end and final estimated voltage is higher than the real measured terminal voltage, leading to the negative errors. This change of error is clearly a consequence of using a single static aging value for the whole experiment. This value is somehow an average condition which can be considered as somewhere in the middle of the whole discharge process. Therefore, the model is predicting a bit worse in the beginning because it considers the battery to be older than it is. Nevertheless, towards the end of the experiment, the battery is actually even older than the average static value considered in the model. Therefore, the model predicts a higher voltage level. This theory can be seen better in Figure 17 showing performance of the static aging factor only on the first experiment.
It is clear from Figure 17 that the model is predicting the dynamics very well but a bias divergence is available during the experiment, obvious at the rest section at the end. During these times no dynamics is available and only the SoC estimation part of the model is active. To show this effect of static ζ a more clearly, a new value is tuned to minimize the error for this experiment which is also depicted in Figure 17. Looking at the behavior of this model with the optimized ζ a , model is able to replicate the dynamics in a perfect way. Consequently, the main issue in the model causing error is the used ζ a value. To understand the necessity of an inter-cycle dynamic ζ a , this optimized ζ a for the first experiment is used on the whole random load discharge curve, which its behavior can be seen in Figure 18.
It is clear from Figure 18 that the optimal static ζ a causes over estimation of the voltage towards the end of test. Therefore, aging is so fast for such a low-budget battery that having a static factor cannot replicate the overall aging behavior of the battery, though it can perfectly explain it partially.
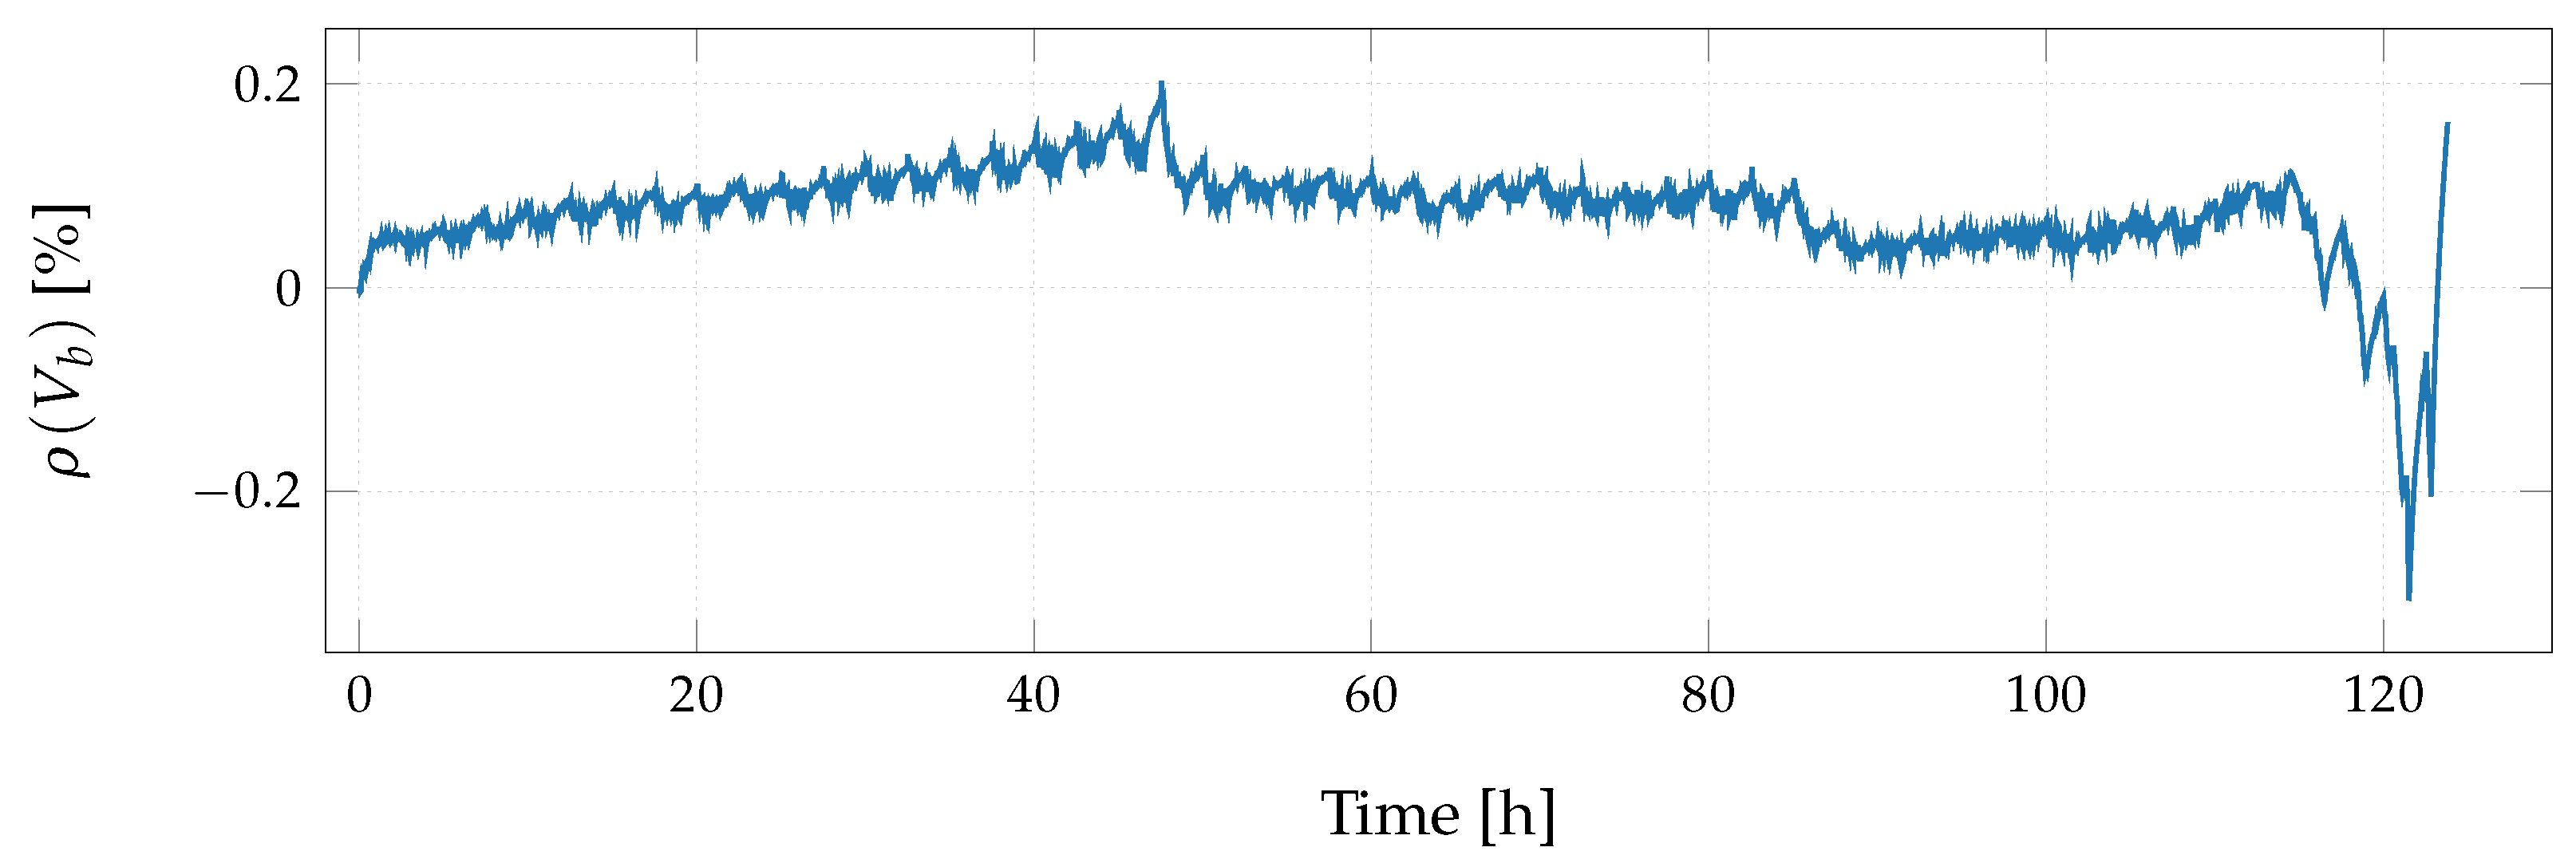
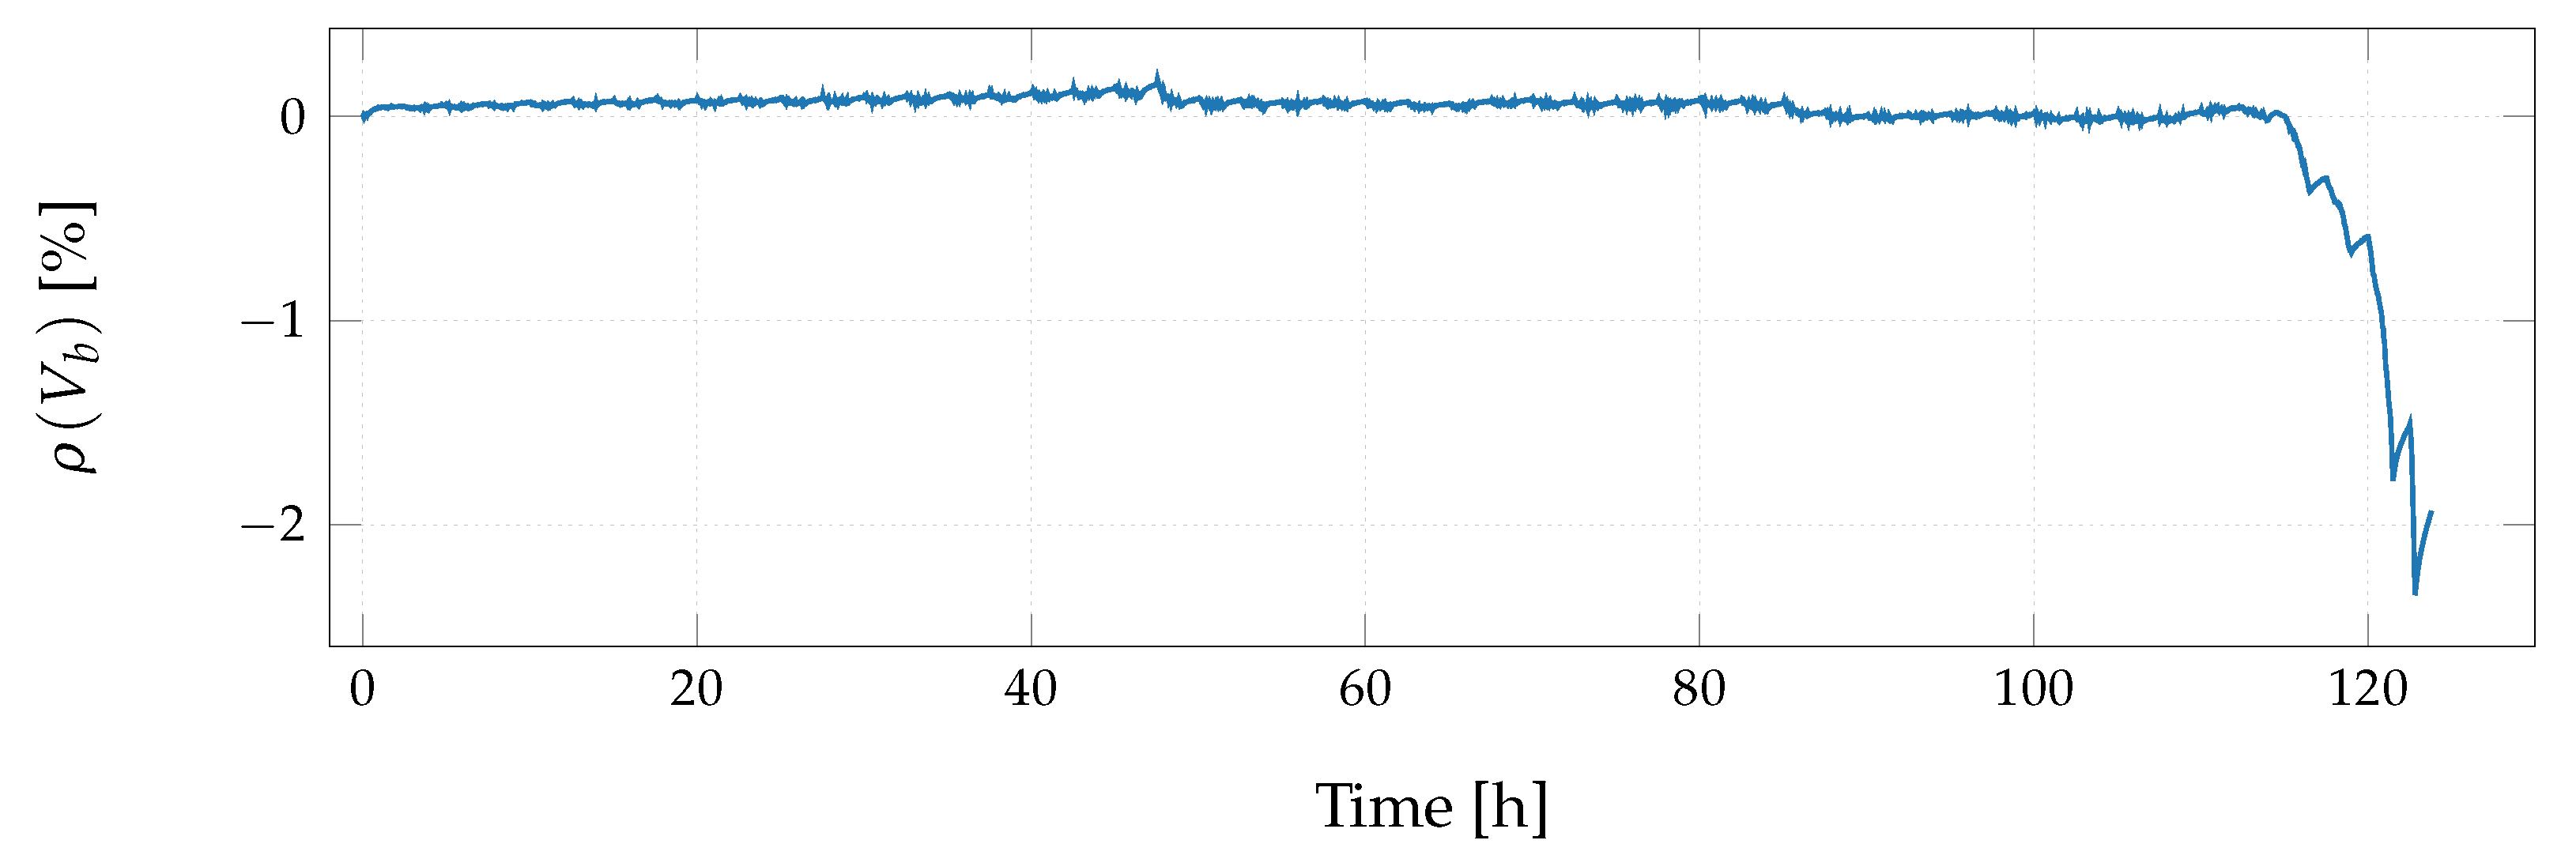
Next, a secondary evaluation experiment is applied by use of the exact load from PhyNode in a subsequent way, starting from the fully charged state. However, the minimum allowed voltage here is higher than the battery’s cut-off value because of PhyNode’s operation limit at 3.54 V . Consequently, this experiment is stopped at this specific threshold. Regardless of this limitation, due to the low-power nature of PhyNode, this experiment takes a long period with more than 120 h and has more than 4.45 × 10⁶ sample points. Performance of the model with the inter-cycle dynamic aging factor on this experiment is shown in Figure 19. To be noted that due to the large number of values in this experiment, a moving average of the relative error and its bound is depicted in Figure 19.
Considering very long period of this experiment, integrative nature of the model and use of an open-loop structure, this model is performing very well and can replicate the dynamic behavior of a low-budget battery when a low-power load is applied.
Looking at the model performances in Figure 15 and Figure 19 and considering a smaller voltage range in Figure 15, a similar trend in the error of both curves is visible. This is a systematic error as a consequence of using the average SoC-Ve relation from different batteries shown in Figure 8 to compensate the production tolerances in between batteries. Therefore, this error can be accepted as a trade-off to make the model applicable on all batteries in the used batch.

5. Conclusions and Future Works

Integration of the low-budget batteries into IoT and Industry 4.0 devices is getting more common because of large scale mass production and price sensitivity of the industrial users. On the other hand demanded power by these devices is reduced by designing low-power systems. Combination of these two specifications brings new challenges for the battery modeling which are addressed in this work. The overall contributions of this work can be summarized as:
  • Difficulties of modeling low-budget batteries integrated in the low-power IoT and Industry 4.0 devices are addressed.
  • High accuracy measurement of the low-power signals for the battery identification and modeling by SMUs is explained and programmed.
  • Two common methods of continuous and discrete identification of the SoC-Ve relation are applied and compared.
  • Validity of the continuous identification is proven but with the limitation of using very small currents in the scale of C/100.
  • Hysteresis removal and consideration of production tolerances is included in the model.
  • A method for identifying the aging status of a low-budget battery without knowledge from the state of health curve is provided by use of normalized standard capacity tests.
  • A heuristic equation for the current effect of low-power loads is formulated and tuned for the case study.
  • SoC measurement formulation is modified to include a linear dynamic inter-cycle aging factor.
  • Performance of the suggested model on two different experiments is evaluated showing relative errors less than 0.2 %.
  • Effect of the inter-cycle fast aging of the low-budget batteries is shown visually to prove necessity of the inter-cycle dynamic aging factor.
While this work shows an initial effort to address the complexities of integrating a small size low-budget Lithium-based battery into the low-power IoT devices, there are multiple further research topics which some of them can be listed as:
  • Analysis of the inter-cycle aging in other battery technologies.
  • Use of a more advanced and nonlinear inter-cycle aging factor.
  • Electro-chemical formulation of the inter-cycle aging factor.
  • Inclusion of a deductive current effect relation into the SoC relation for low-power loads.
  • Application of the closed-loop methods for the SoC-Ve relation identification using low-power loads.

Funding

Part of this work has been funded by Deutsche Forschungsgemeinschaft (DFG) within the Collaborative Research Center SFB 876 “Providing Information by Resource-Constrained Analysis”, project A4. Furthermore, part of the work was funded by the Federal Ministry of Education and Research of Germany within the “competence center for machine learning ML2R” (01|S18038A).

Conflicts of Interest

The author declares no conflict of interest. The funders had no role in the design of the study; in the collection, analyses, or interpretation of data; in the writing of the manuscript, or in the decision to publish the results.

Appendix A. Measuring Processes

To enable reproduction of the processes explained in this work users can follow a set of measurements explained hereafter. These are explained in a general form as algorithms which should be programmed according to the used measurement devices and related programming language. However, a version programmed by MATLAB using SCPI commands is openly accessible from [18].
This is the main Algorithm A1 including the overall procedure:
Algorithm A1: Main program with the suggested order of experiments.
Batteries 06 00050 i001
To remove the initial dynamics of a new battery it is better to charge and discharge it for few times:
Algorithm A2: Procedure of removing possible initial dynamics of a new battery.
Batteries 06 00050 i002
To find the aging status of the battery during the overall measurement a standard test is used, explained as:
Algorithm A3: A general process to find the relative aging status of the battery.
 Charge the battery to the unified initial point using Algorithm A4;
 Discharge the battery with the nominal current;
 Find the relative aging status from Equation (4);
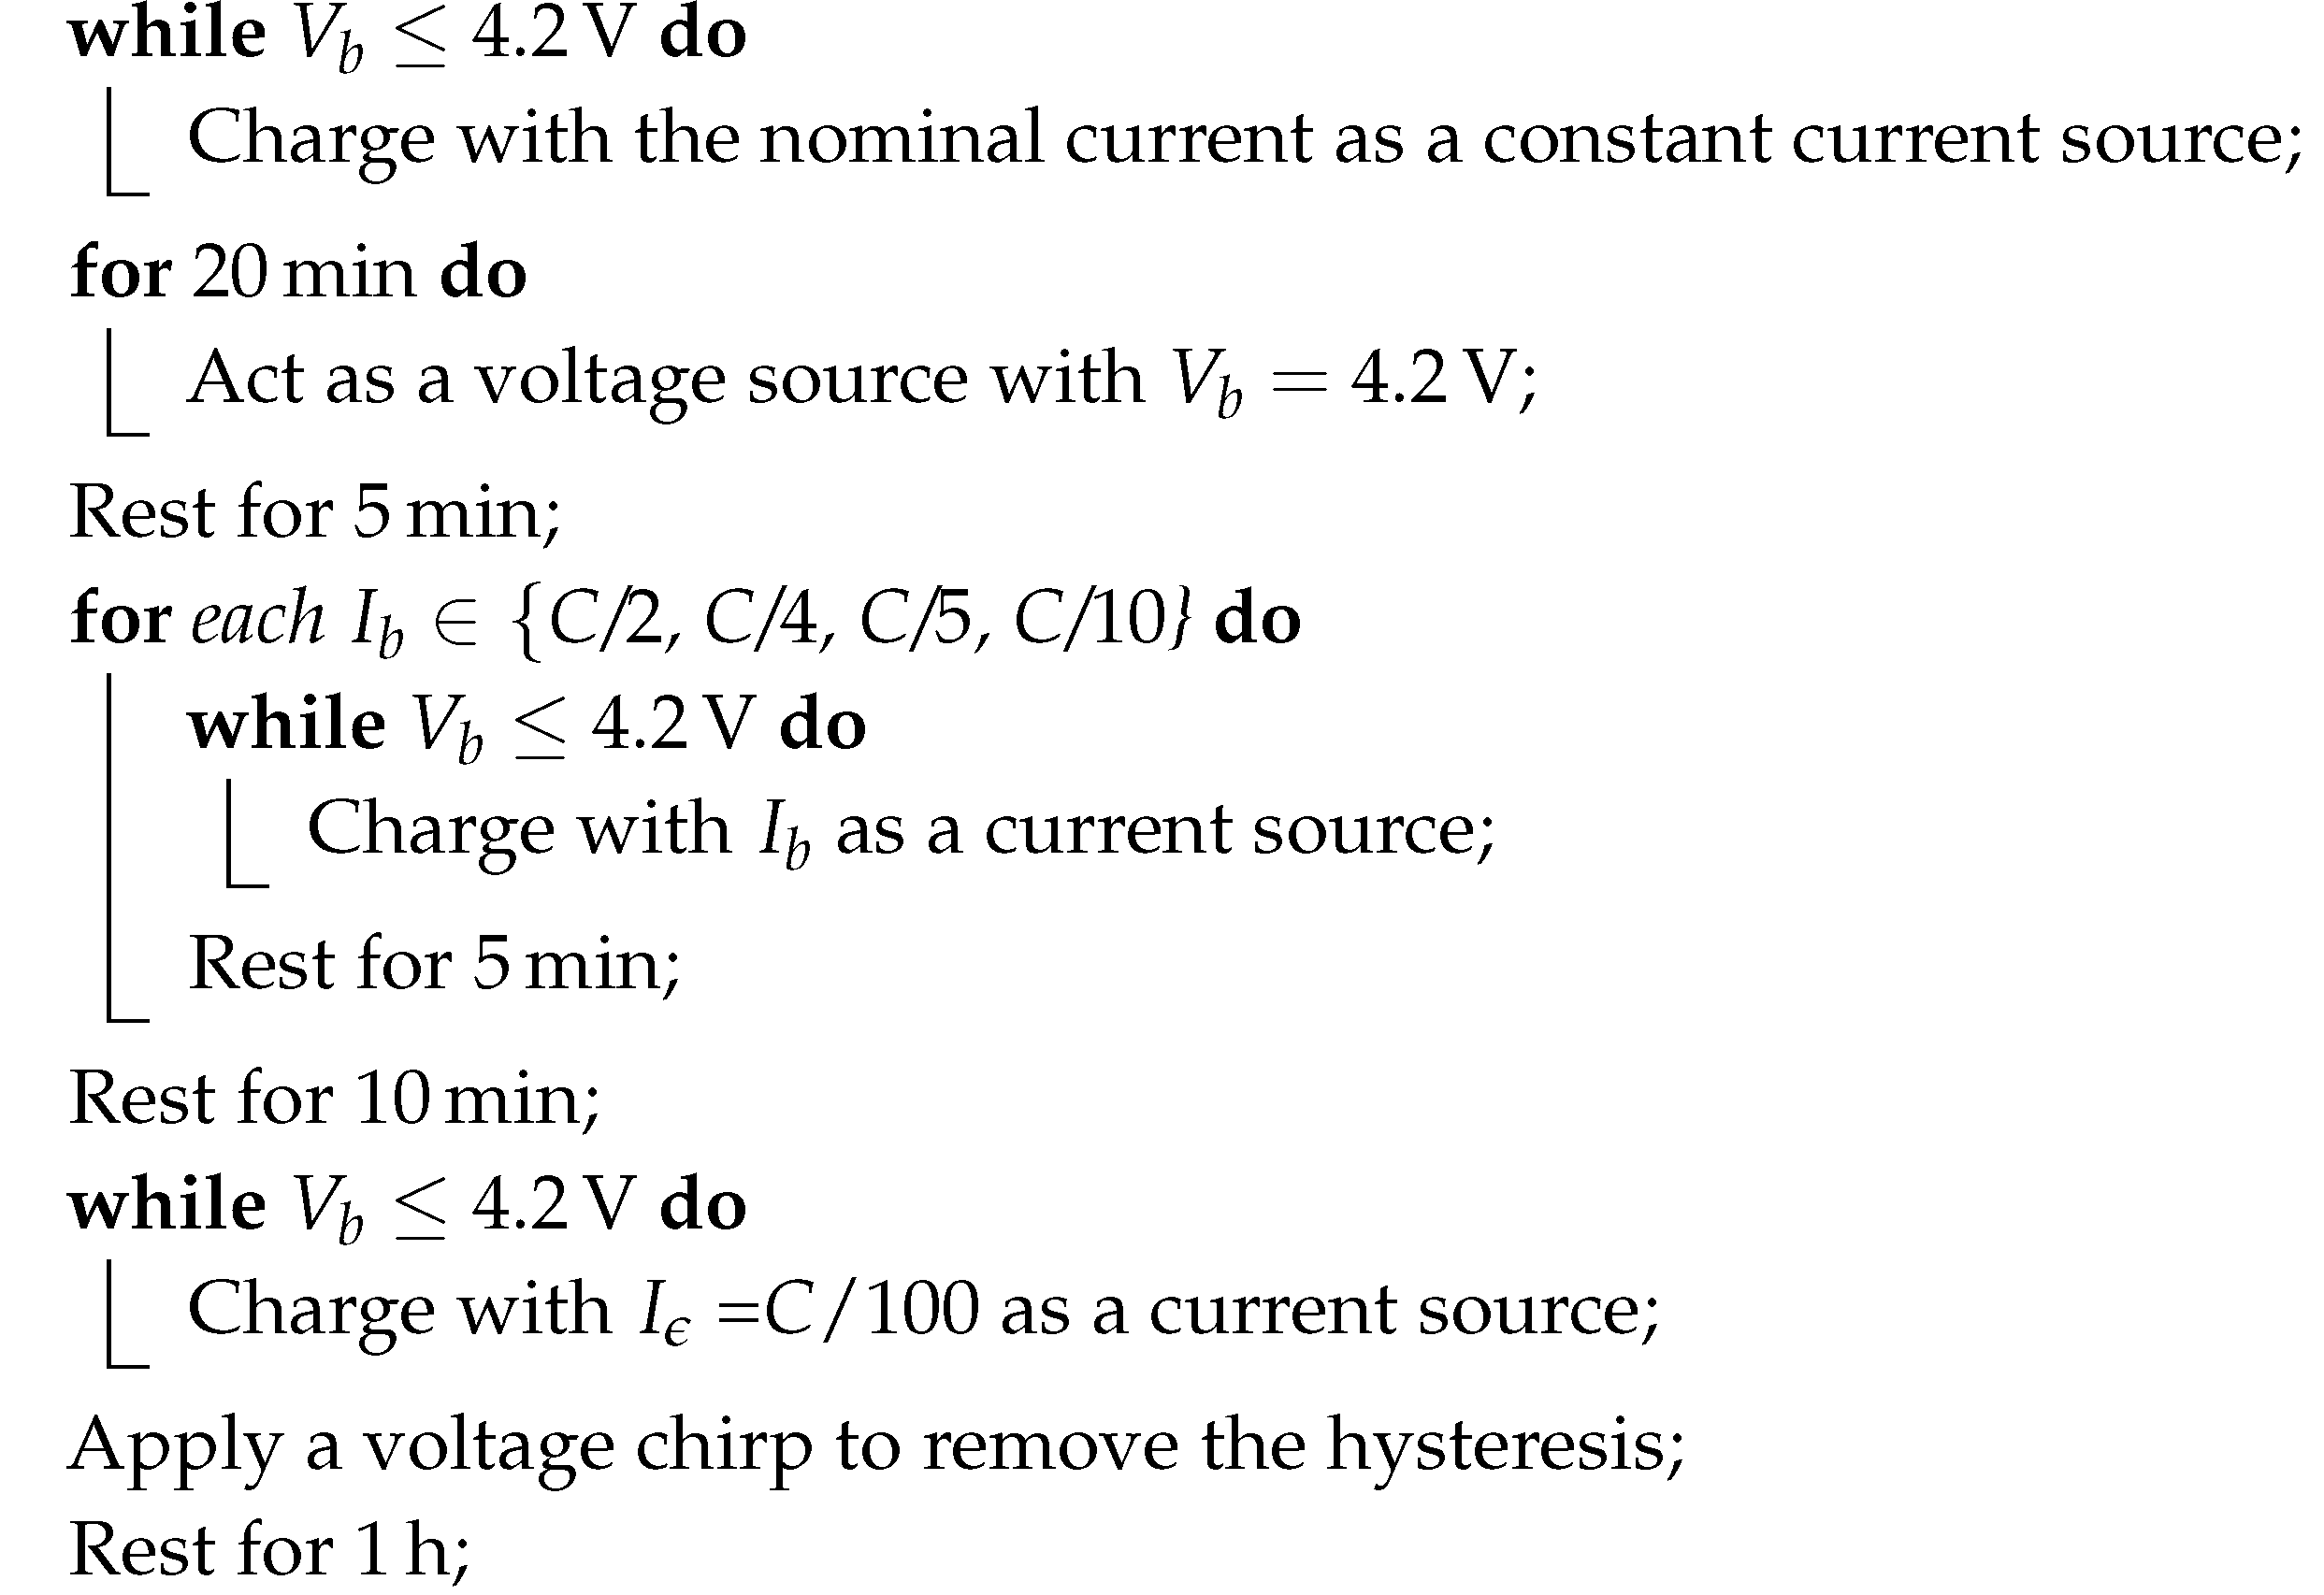
To assure that all measurements are starting from a similar initial condition a specific charging process is defined. It is a mixture of a fast charging in the beginning, followed with multiple small current charges. Finally, a chirp signal is applied to remove the hysteresis, followed with a rest period.
Algorithm A4: Process of charging the battery to the fully charged initial state.
Batteries 06 00050 i003
For the identification of the SoC-Ve relation from the discrete method which directly measures V e a process is used as:
Algorithm A5: A process for identification of the SoC-Ve relation in the discrete form.
Batteries 06 00050 i004
For the evaluation of the model, a random load can be generated and applied on the battery as:
Algorithm A6: Procedure of collecting evaluation data by application of subsequent randomly selected pulses.
Batteries 06 00050 i005

References

  1. Masoudinejad, M.; Magno, M.; Benini, L.; ten Hompel, M. Average Modelling of State-of-the-Art Ultra-low Power Energy Harvesting Converter IC. In Proceedings of the 2018 International Symposium on Power Electronics, Electrical Drives, Automation and Motion (SPEEDAM), Amalfi, Italy, 20–22 June 2018; pp. 99–104. [Google Scholar]
  2. Jafari, M.; Khan, K.; Gauchia, L. Deterministic models of Li-ion battery aging: It is a matter of scale. J. Energy Storage 2018, 20, 67–77. [Google Scholar] [CrossRef]
  3. Baghdadi, I.; Briat, O.; Delétage, J.Y.; Gyan, P.; Vinassa, J.M. Lithium battery aging model based on Dakin’s degradation approach. J. Power Sources 2016, 325, 273–285. [Google Scholar] [CrossRef]
  4. Borza, P.N.; Machedon-Pisu, M.; Hamza-Lup, F. Design of Wireless Sensors for IoT with Energy Storage and Communication Channel Heterogeneity. Sensors 2019, 19, 3364. [Google Scholar] [CrossRef] [PubMed] [Green Version]
  5. Falkenberg, R.; Masoudinejad, M.; Buschhoff, M.; Ramachandran Venkatapathy, A.K.; Friesel, D.; Hompel, M.T.; Spinczyk, O.; Wietfeld, C. PhyNetLab: An IoT-based warehouse testbed. In Proceedings of the Federated Conference on Computer Science and Information Systems (FedCSIS), Prague, Czech Republic, 3–6 September 2017; pp. 1051–1055. [Google Scholar]
  6. Ramachandran Venkatapathy, A.K.; Riesner, A.; Roidl, M.; Emmerich, J.; ten Hompel, M. PhyNode: An intelligent, cyber-physical system with energy neutral operation for PhyNetLab. In Proceedings of the European Conference on Smart Objects, Systems and Technologies (Smart SysTech), VDE-Verl, Aachen, Germany, 16–17 June 2015; pp. 1–8. [Google Scholar]
  7. Xiong, R.; Cao, J.; Yu, Q.; He, H.; Sun, F. Critical Review on the Battery State of Charge Estimation Methods for Electric Vehicles. IEEE Access 2018, 6, 1832–1843. [Google Scholar] [CrossRef]
  8. Barai, A.; Widanage, W.D.; Marco, J.; McGordon, A.; Jennings, P. A study of the open circuit voltage characterization technique and hysteresis assessment of lithium-ion cells. J. Power Sources 2015, 295, 99–107. [Google Scholar] [CrossRef]
  9. Plett, G.L. Battery Management Systems, Volume I: Battery Modeling; Artech House: Norwood, MA, USA, 2015. [Google Scholar]
  10. Jongerden, M.R.; Haverkort, B.R. Which battery model to use? IET Softw. 2009, 3, 445–457. [Google Scholar] [CrossRef] [Green Version]
  11. Chen, X.; Lei, H.; Xiong, R.; Shen, W.; Yang, R. A novel approach to reconstruct open circuit voltage for state of charge estimation of lithium ion batteries in electric vehicles. Appl. Energy 2019, 255, 113758. [Google Scholar] [CrossRef]
  12. Song, Y.; Park, M.; Seo, M.; Kim, S.W. Improved SOC estimation of lithium-ion batteries with novel SOC-OCV curve estimation method using equivalent circuit model. In Proceedings of the 2019 4th International Conference on Smart and Sustainable Technologies (SpliTech), Split, Croatia, 18–21 June 2019; pp. 1–6. [Google Scholar]
  13. Plett, G.L. Extended Kalman filtering for battery management systems of LiPB-based HEV battery packs: Part 2. Modeling and identification. J. Power Sources 2004, 134, 262–276. [Google Scholar] [CrossRef]
  14. Broussely, M.; Biensan, P.; Bonhomme, F.; Blanchard, P.; Herreyre, S.; Nechev, K.; Staniewicz, R.J. Main aging mechanisms in Li ion batteries. J. Power Sources 2005, 146, 90–96. [Google Scholar] [CrossRef]
  15. Hu, X.; Zou, C.; Zhang, C.; Li, Y. Technological Developments in Batteries: A Survey of Principal Roles, Types, and Management Needs. IEEE Power Energy Mag. 2017, 15, 20–31. [Google Scholar] [CrossRef]
  16. Li, S.; He, H.; Su, C.; Zhao, P. Data driven battery modeling and management method with aging phenomenon considered. Appl. Energy 2020, 275, 115340. [Google Scholar] [CrossRef]
  17. Masoudinejad, M. Power analysis of PhyNode; Technical Report; TU Dortmund University: Dortmund, Germany, 2018. [Google Scholar]
  18. Masoudinejad, M. Programs for Measuring Low-Budget Batteries Using Keysight High Accuracy Source Measurement Units. 2020. Available online: https://github.com/masoudinejad/BatteryMeasuring (accessed on 10 October 2020).
  19. Plett, G.L. Extended Kalman filtering for battery management systems of LiPB-based HEV battery packs: Part 1. Background. J. Power Sources 2004, 134, 252–261. [Google Scholar] [CrossRef]
  20. Waag, W.; Fleischer, C.; Sauer, D.U. Critical review of the methods for monitoring of lithium-ion batteries in electric and hybrid vehicles. J. Power Sources 2014, 258, 321–339. [Google Scholar] [CrossRef]
  21. Satyan, P.A.; Sutar, R. A Survey on Data-Driven Methods for State of Charge Estimation of Battery. In Proceedings of the 2020 International Conference on Electronics and Sustainable Communication Systems (ICESC), Coimbatore, India, 28–30 April 2020; pp. 996–1004. [Google Scholar]
Figure 1. An abstract representation of the desired model.
Batteries 06 00050 g001
Figure 2. Measured current of PhyNode at different operational voltages.
Batteries 06 00050 g002
Figure 3. Terminal voltage measured during the continuous discharge with different currents.
Batteries 06 00050 g003
Figure 4. Top: identified SoC-Ve relation from I ϵ current. Bottom: difference of the other current curves from the I ϵ curve.
Batteries 06 00050 g004
Figure 5. Measured SoC-Ve relations to remove the hysteresis effect.
Batteries 06 00050 g005
Figure 6. V e measured during the discrete identification method according to the drained charge (DoD).
Batteries 06 00050 g006
Figure 7. Comparison of the SoC-Ve relation identified from both identification methods.
Batteries 06 00050 g007
Figure 8. Comparison of the SoC-Ve relation identified from five different batteries in the same production batch.
Batteries 06 00050 g008
Figure 9. Procedure of finding the aging factor for each specific experiment.
Batteries 06 00050 g009
Figure 10. Found current factors from the continuous discharge curves. Solid continuous curve presents an inverse exponential function tuned to the found points, as in Equation (10).
Batteries 06 00050 g010
Figure 11. Error of the models with different number of R C sets, tuned to the recovery period of an identification pulse in the discrete method.
Batteries 06 00050 g011
Figure 12. Identified parameters for the 2 R C model according to the related SoC.
Batteries 06 00050 g012
Figure 13. Representation of the ECM used for the dynamic model of the PhyNode’s battery.
Batteries 06 00050 g013
Figure 14. Measured voltage and current during a random load experiment.
Batteries 06 00050 g014
Figure 15. Relative error of the model with dynamic ζ a on the random load test.
Batteries 06 00050 g015
Figure 16. Performance of the model with a constant static aging factor on the random load evaluation test.
Batteries 06 00050 g016
Figure 17. Performance of the model with a static ζ a on a single example of the random load. Moreover, green line shows a secondary model with a ζ a optimized for this specific experiment.
Batteries 06 00050 g017
Figure 18. Performance of the model with an optimized ζ a for the first experiment on the whole random load test.
Batteries 06 00050 g018
Figure 19. Relative error of the model on the PhyNode load evaluation test.
Batteries 06 00050 g019