1. Introduction
Greenhouse gas emissions from internal combustion engines (ICEs) is a significant concern currently driving the development of electric vehicles (EVs). Life-cycle assessment of EVs has shown significant energy and emissions savings over traditional ICEs over the vehicle lifetime. While the majority of the environmental impact of ICEs is due to burning fossil fuels a large portion of EV impact lies in the production of the energy storage medium, which is a lithium ion battery (LIB) for current EVs. Batteries reach the end of their useful life in transportation (i.e., electric vehicles) because reduced capacity directly translates into range reduction, a characteristics unacceptable to most drivers. As the transportation sector continues to rapidly electrify, end-of-life batteries are growing into considerable volumes.
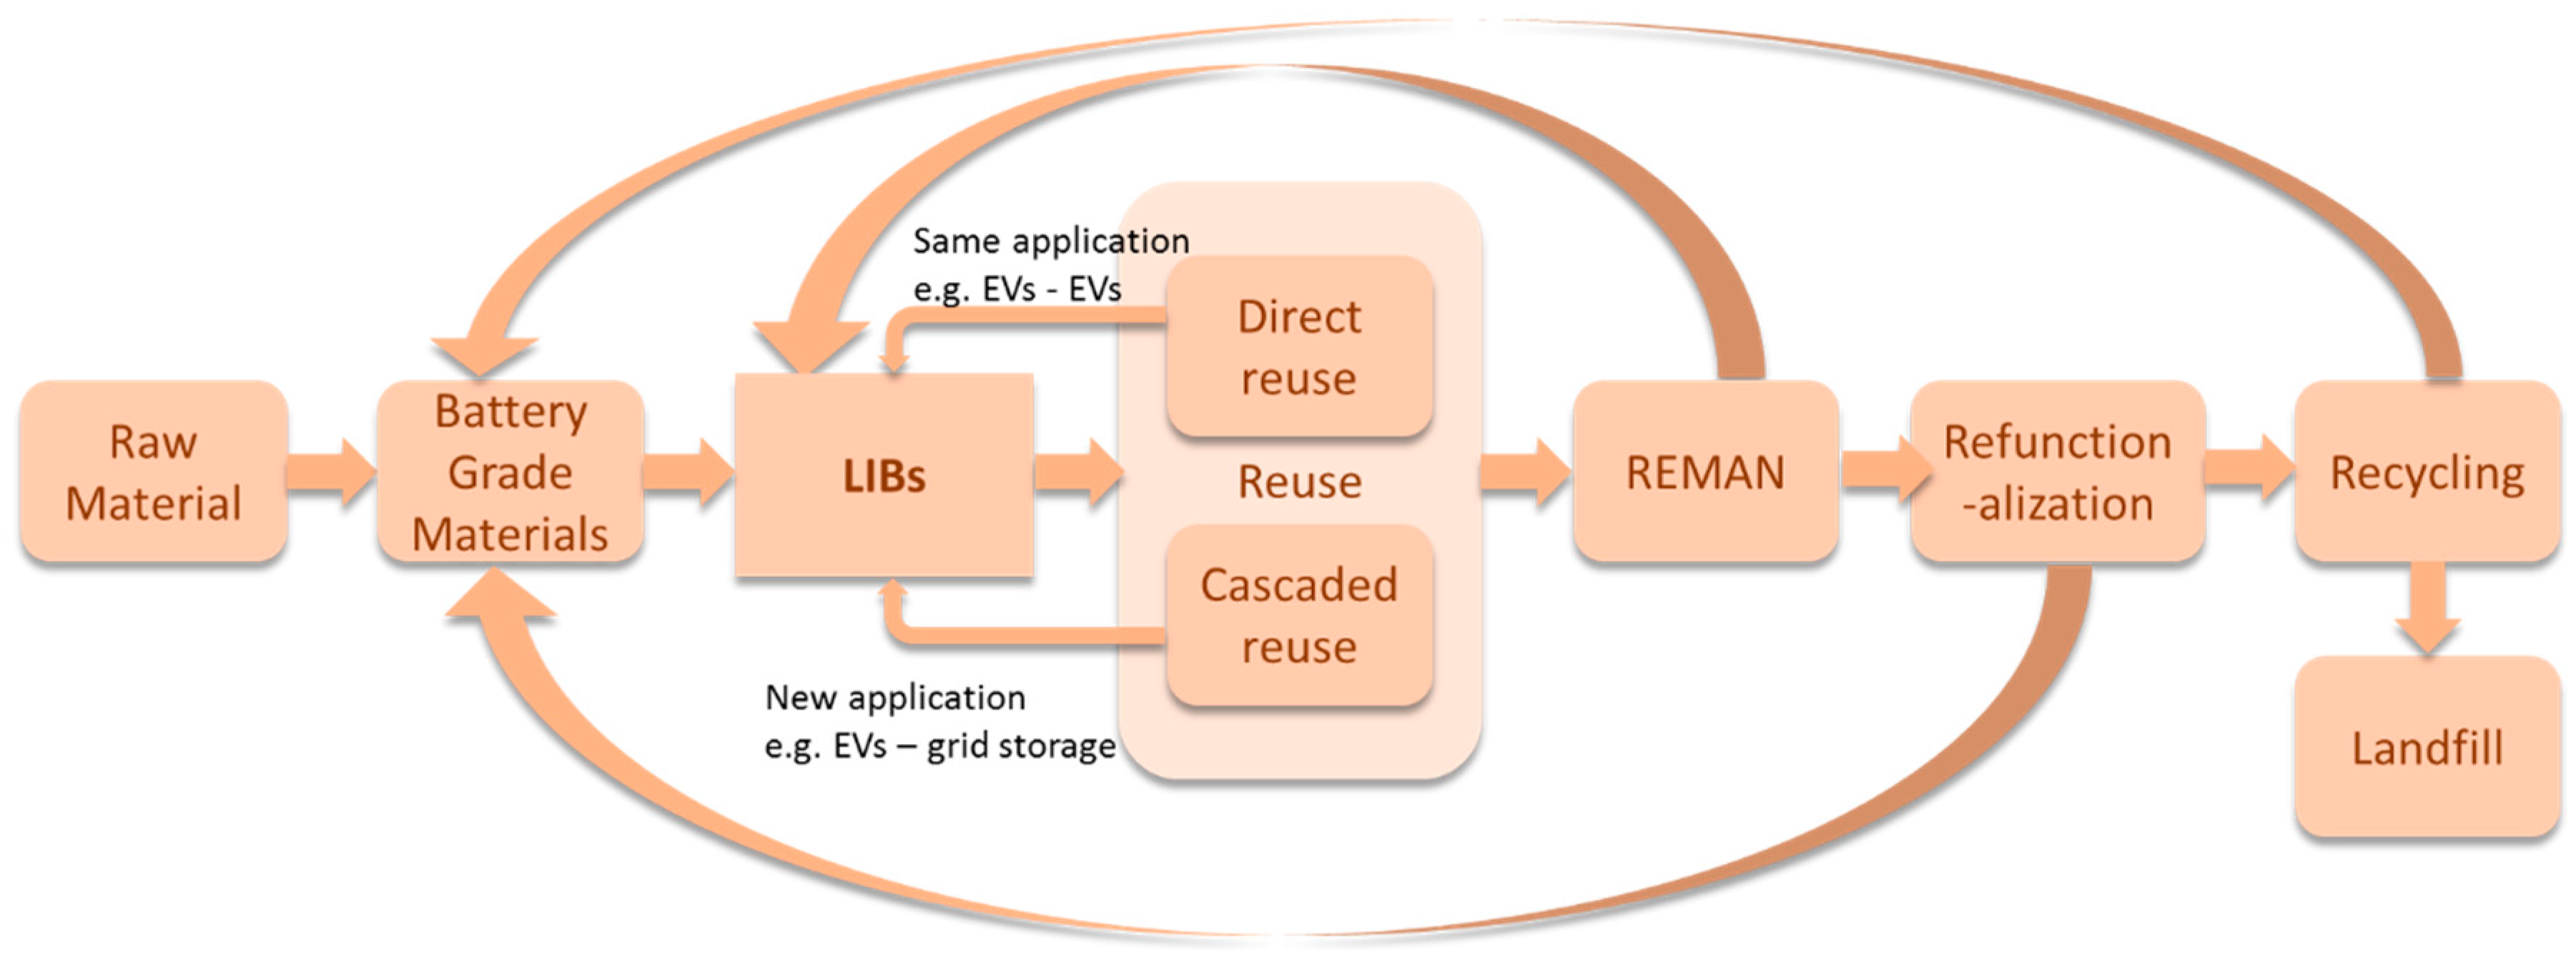
There are several options at end-of-life for batteries including landfill disposal and multiple resource recovery routes including reuse, re-synthesis of active materials and recycling (
Figure 1). Only 41% of the materials present in the lithium ion cells in the EV battery waste stream were recycled based on estimates from the US Geological Survey (2012). These high value materials included metals such as aluminum, cobalt, copper, nickel, steel and iron. Another 10% of the EV battery waste stream included two high value materials, lithium and manganese, which were not recycled. Low value materials which were not being recycled constituted 48% of the EV battery waste stream. Even if a comprehensive recycling system had been implemented in the state significant amounts of material, including ones with toxicity concerns, would still require waste treatment, with a likely eventual fate of landfilling.
Preventing the loss of the materials contained in LIBs while promoting economic savings suggests a circular economy approach. Ensuring a circular economy framework for LIBs will require removing barriers to the implementation of these various second-life routes to prevent current linearity to disposal; a hierarchy based on environmental and economic metrics is proposed [
1,
2] placing reuse at the top.
The resource recovery route this work was focused on was reuse, as transportation batteries typically have considerable remaining life that makes them suitable for secondary applications. For this purpose, we refer to a reuse route as being one where the battery materials did not require significant chemical or metallurgical processes in order to recover functionality. Examples of this route were reuse of individual cells from a failed pack or reuse in renewable energy storage; for example, several studies had indicated that the cost of plug-in hybrid vehicle battery packs could be offset by repurposing vehicle batteries in grid support systems [
3]. Reuse is likely the route with the highest economic and environmental gains and further, not all of the materials contained in these battery packs could be recycled with significant economic value. However, barriers remain to implementing reuse routes, one of which being the diversity of stakeholders in the battery system.
The diversity of stakeholders in this product system creates a range of competing needs and perspectives for both supply and demand of batteries with reuse potential. Battery integrators have developed specifications for modules in the context of their primary applications; given the range of options described previously these are often quite different. Even for cases where they are roughly the same, the metrics may vary. For example, for transportation applications, modules are categorized by their capacity in amp-hours while capacity for building applications is in kilowatt-hours. For battery integrators, much of the intellectual property lies outside the module itself. Companies had developed and perfected an entire energy storage system (ESS), with cooling, battery management system (BMS), standard communication protocols (e.g., CAN bus) and packaging that are tailored for a specific primary market. Because the expensive development effort for the entire system may not be readily replicated for different secondary applications, battery integrators are often reluctant to offer more than their modules for the secondary markets.
Businesses and other entities had started to employ microgrids for improving their economic and environmental performance as well as for improvement of power reliability and power quality. Energy storage systems, often referred to as distributed storage (DS), enabled key features of microgrids, which, in turn, facilitated resilience and sustainability of the grid.
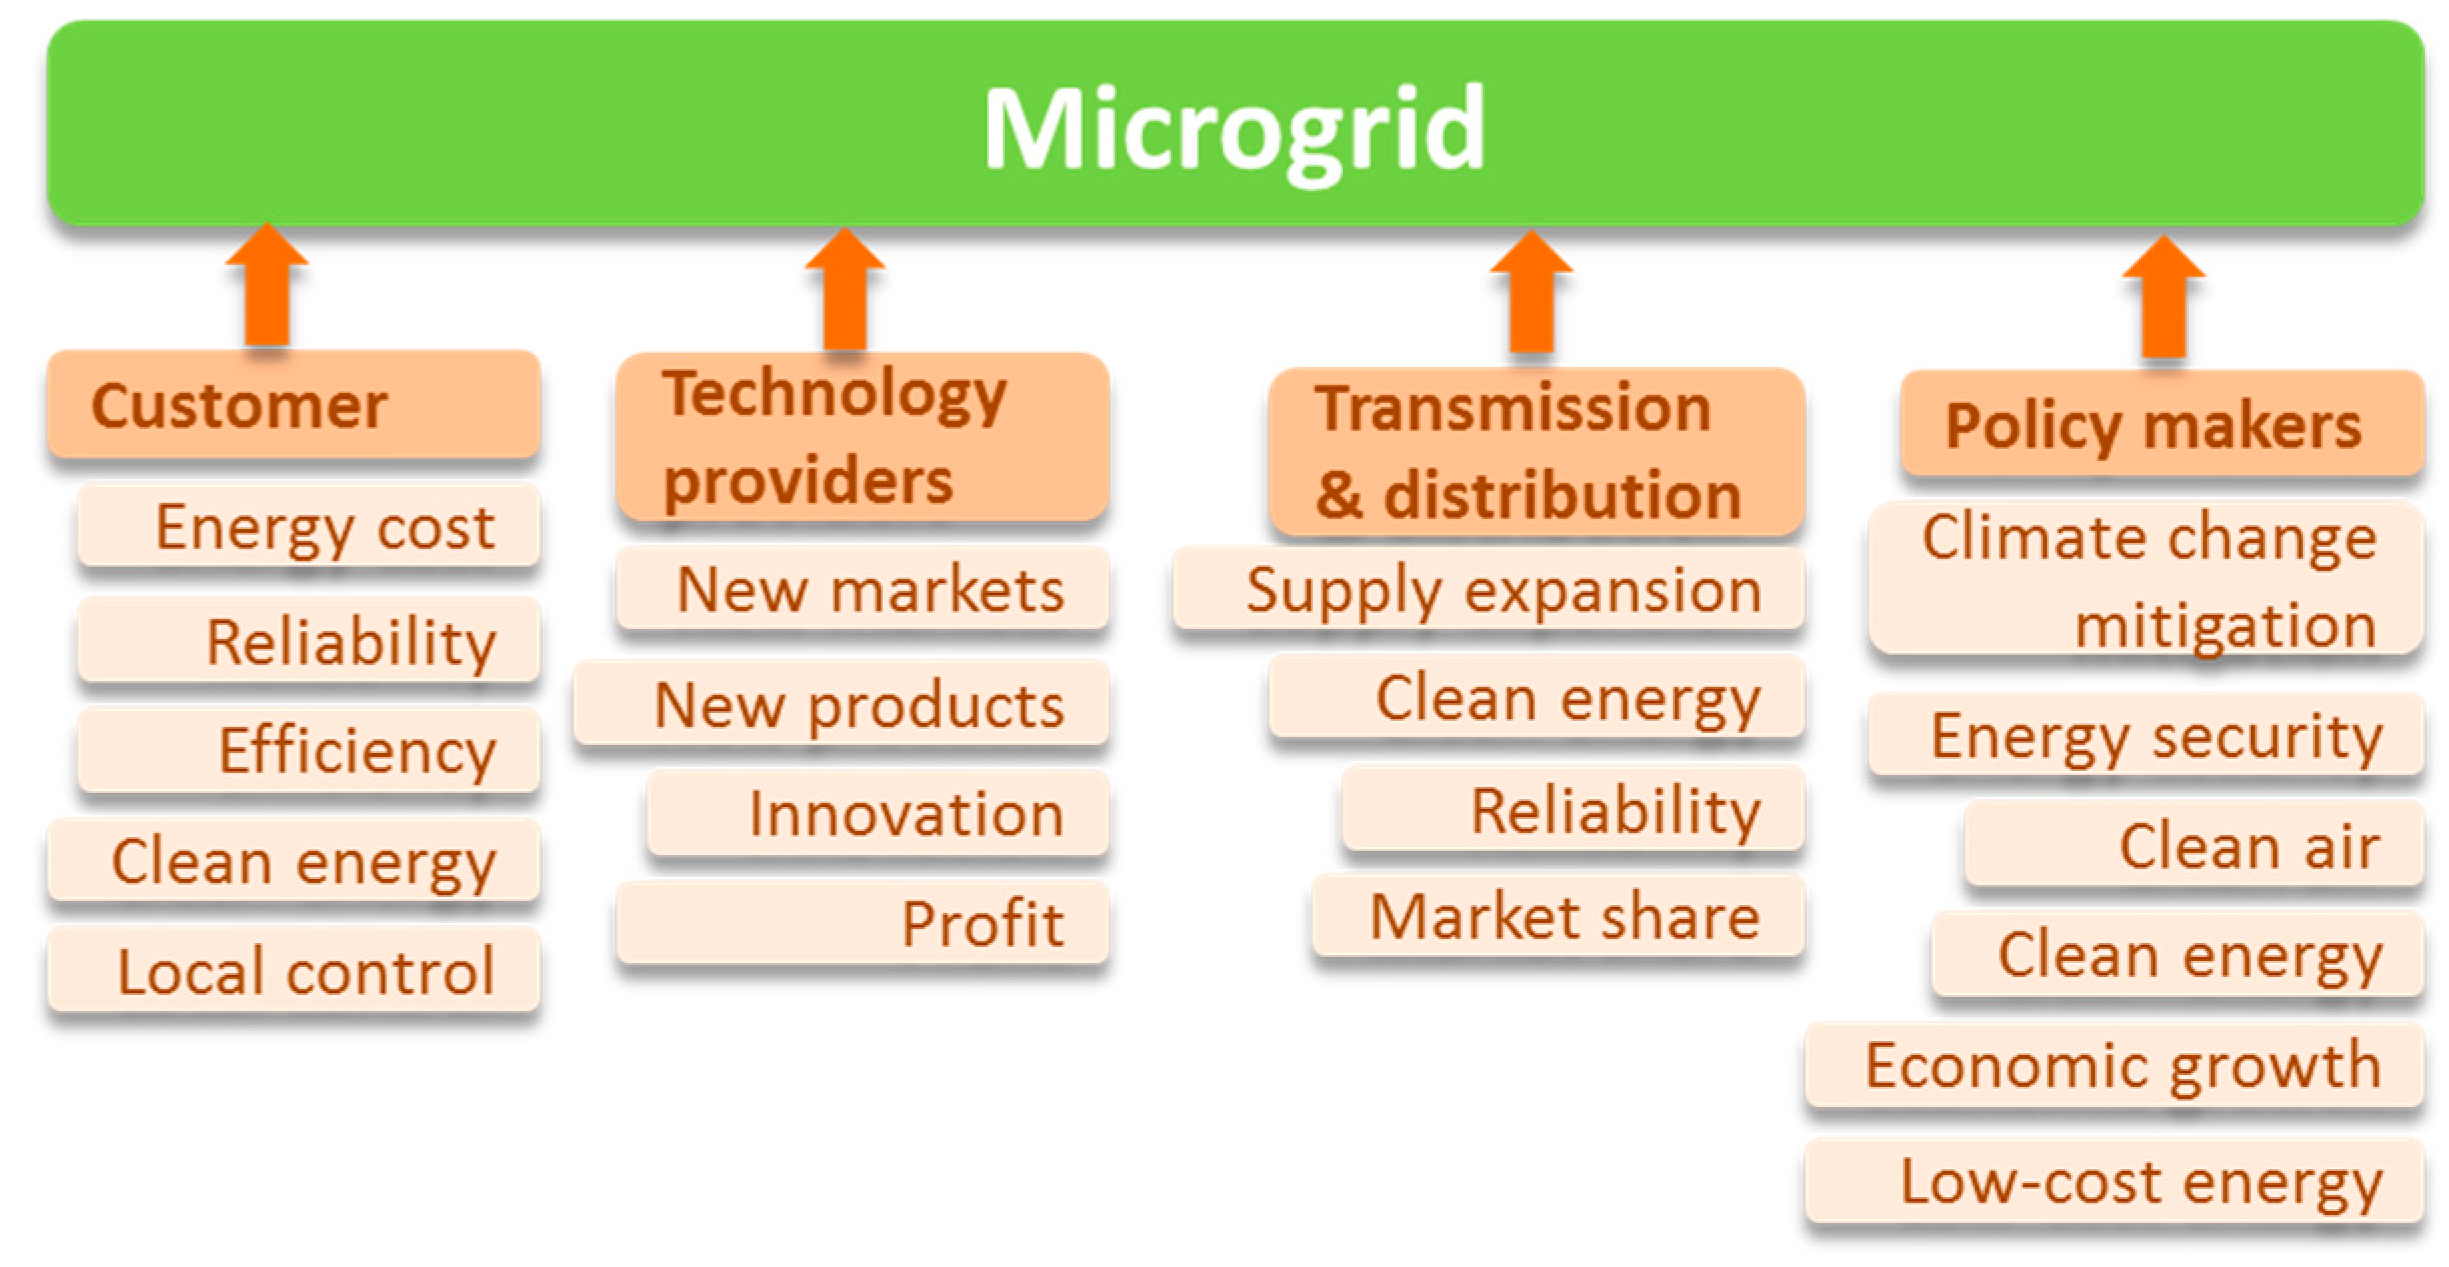
Figure 2 shows drivers for microgrids across four stakeholder groups.
As modern, small-scale versions of centralized electricity systems (macrogrids) [
4,
5], microgrid was found to be particularly well-suited for exploring potential grid applications. This setting consisted of a controlled grouping of energy (including electricity) sources and loads that were connected but could function independently of the main grid, in islanded mode [
6]. In addition to the ability to function in the grid-connected mode and in the islanded mode, microgrids are typically required to switch between the two modes smoothly [
7], or at least with minimum disruption [
8], with the grid-connected mode referred to as
the normal and islanded mode as
the emergency mode [
9]. Storage is especially critical for islanded operation. While an isolated microgrid looks like a scaled-down version of a grid, it has unique features not seen in a large-scale utility grid; for example utilization of nonconventional, intermittent power sources which require power electronics solutions to regulate voltage and frequency [
10].
Researchers created a variety of more formal microgrid definitions depending on the context of technology and function; the following definitions are frequently cited [
11]: (1) Microgrids are electricity distribution systems containing loads and distributed energy resources, (such as distributed generators, storage devices, or controllable loads) that can be operated in a controlled, coordinated way either while connected to the main power network or while islanded (CIGRÉ C6.22 Working Group). (2) A microgrid is a group of interconnected loads and distributed energy resources within clearly defined electrical boundaries that acts as a single controllable entity with respect to the grid. A microgrid can connect and disconnect from the grid to enable it to operate in both grid-connected or island-mode (U.S. Department of Energy Microgrid Exchange Group, 2010). Examples of microgrids include: communities and neighborhoods, corporate and academic campuses, buildings, military base camps and naval systems. The microgrid concept has emerged in the research literature to address problems associated with proliferation of distributed generation (DG), DS and DG-DS hybrids [
12,
13,
14]. However, they are not new; the basic approach has been employed for some time in military bases, refineries and other large facilities that rely primarily on their own, on-site generation while remaining connected to the local utility for supplemental power and other services [
15]. The diverse variety of microgrids share a common need, inexpensive storage.
Many microgrid benefits have been identified [
6,
16,
17], including increased heterogeneous power quality and reliability (PQR) and resilience of the critical systems. Microgrids create a more favorable environment for efficient and small-scale renewable DG. They protect the main grid from intermittent renewable source, such as solar and wind. Some local generation technologies further enable efficiency improvements via heat recovery. Microgrids offer more reliable and more secure power as the available power becomes more susceptible to cyber-attacks and natural disasters. Drivers for microgrids across four stakeholder groups are shown in
Figure 2. In New York State’s vision for future grid [
18], microgrids are perceived as the critical building blocks and affordable storage is the key enabler.
Small businesses considered here included convenience store owners, restaurant owners, food industries (wineries, dairy farms), small industrial plants and so forth. Their electric bill was composed of two parts: the energy consumption charge and the peak power demand charge. The energy consumption charge was the total amount of energy used and was priced at ~10 cents/kWh. The power demand charge was based on the single highest fifteen minutes usage during the month. For this reason it was charged at $15 per kW (This is a typical price in Upstate New York; prices in densely populated area such New York City are often double, or more—$28–$50). Thus, during the peak fifteen minutes, the effective cost of power was 600 times higher than normal (15 $/kW/0.25 h)/(0.1 $/kWh) = 600). Consequently, the peak demand charges could amount as high as 50% of an electric bill. While the reasons for peak demand charges were perfectly valid, the business owners perceived them as somewhat unfair. At the current cost of batteries, reducing the peak demand by employing local storage, that is, peak shaving was prohibitively expensive (early estimates indicated that they would require 8 to 10 years for payback) but reused batteries could have had the potential to bring to market cost-effective peak shaving solutions.
The primary goal of this study was to assess if the existing battery modules could be employed for secondary applications. The second objective was to explore and identify other potential applications for the modules. While a wide range of literature has examined this from a feasibility [
19,
20] or policy [
2,
21] perspective, there is very little empirical data available for actual end of life modules. Most empirical testing focuses on capacity fade [
22], aging mechanisms [
23] and health monitoring [
24,
25]. Because the modules could end their life in primary applications at different remaining capacity, it was important to differentiate their suitability for different secondary applications based on remaining capacity in an empirical manner to bridge this gap in the literature.
2. Results
A total of 51 tests were performed on three battery modules including pulse tests (10 tests), constant current tests (40 tests) and a test profiles based on reducing intermittency of the solar power (1 test), see
Table 1. The objective of the pulse tests was to map the phenomenological parameters of the battery model to the state-of-charge (SOC) and remaining capacity. Multiple full charge-discharge cycles at three different current levels (10 A, 15 A and 20 A) determined capacity variability between the modules and capacity dependence on the current, given the cell voltage constraints provided by the manufacturer. Full charge-discharge tests are directly related to peak shaving applications. Finally, power waveforms from the solar panels were used to develop a profile for reducing the intermittency of the solar generator. More details on the three test types are provided in turn.
The first step was to characterize the end-of-life of the battery modules. The initial tests were conducted with relatively low current, at ~2 A, despite the rated capability of the module to draw 60 A. After multiple cautious tests were performed, more thorough characterization of the modules followed. The detailed investigation included step charge and step discharge tests.
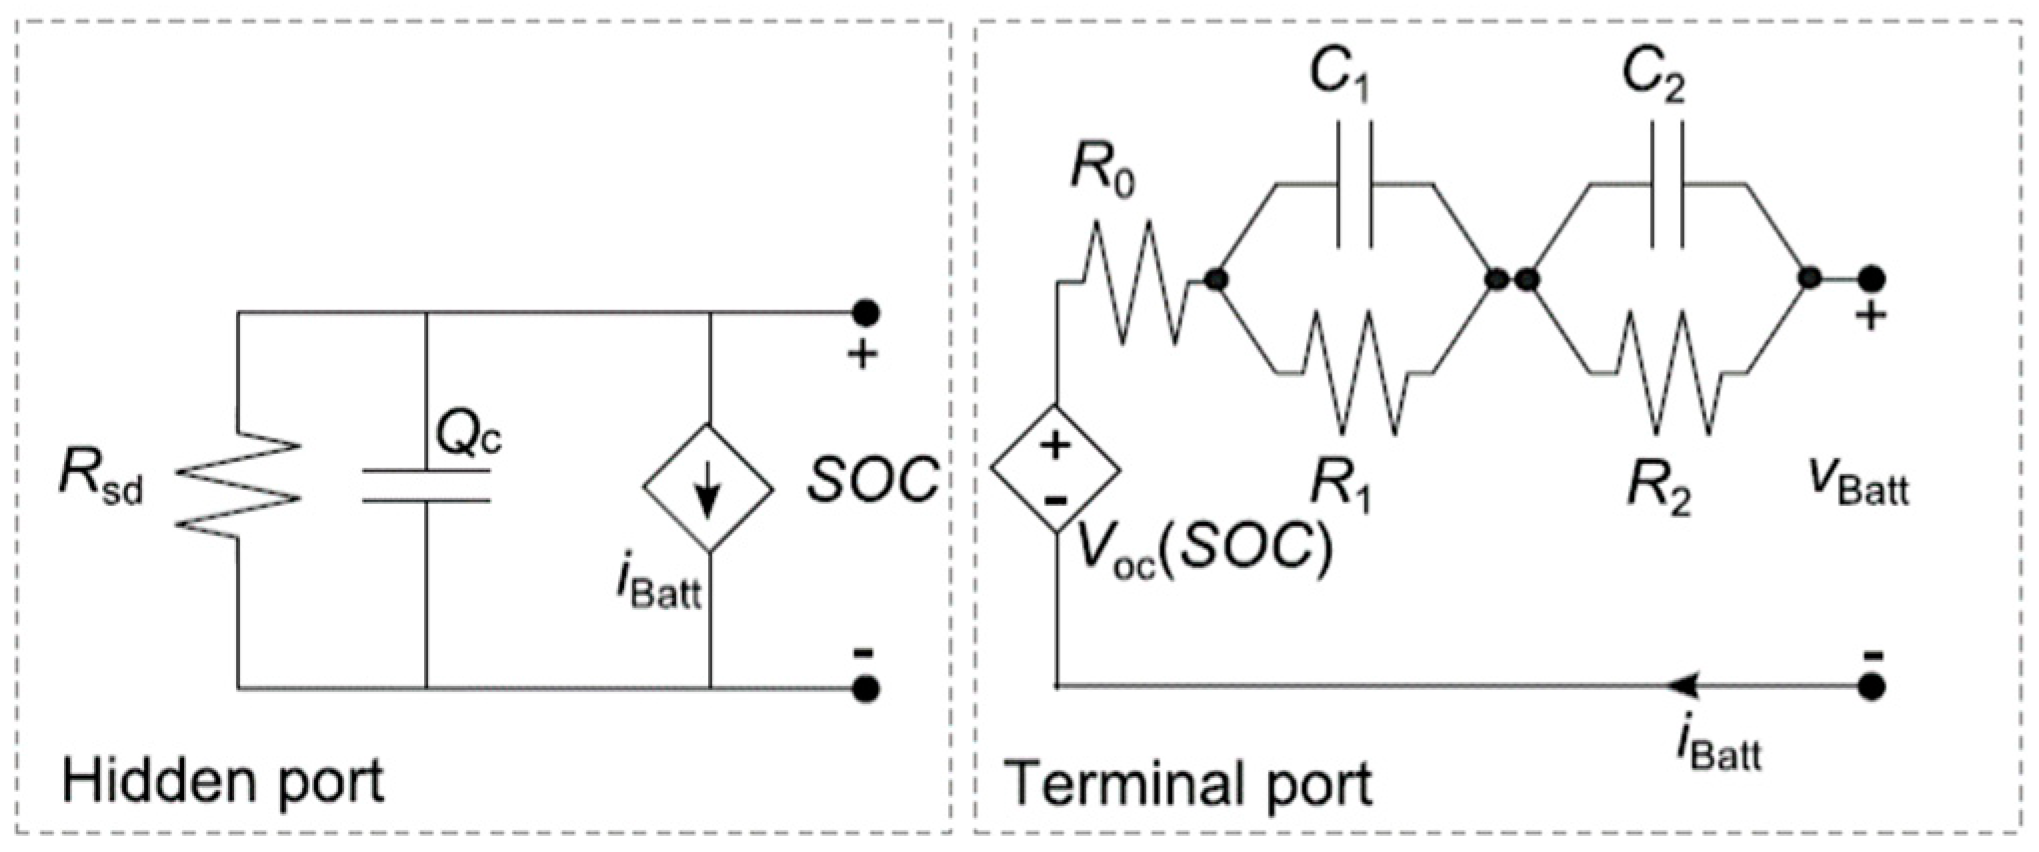
Figure 3 shows a pulsed charge test. In this test the battery was charged with constant current with periods of rest in between. The rest periods allow us to estimate the variation of the parameters of the batteries phenomenological model, such as double-exponential model [
26].
The double exponential model, shown in
Figure 4, consists of two ports: the hidden port that cannot be directly observed and the terminal port. In the previous study [
27] we showed that pulsed charge can be used to estimate the model parameters: open circuit voltage
, resistance
and RC circuits for modeling transients
. The components of the hidden model are capacity
and self-discharge resistance
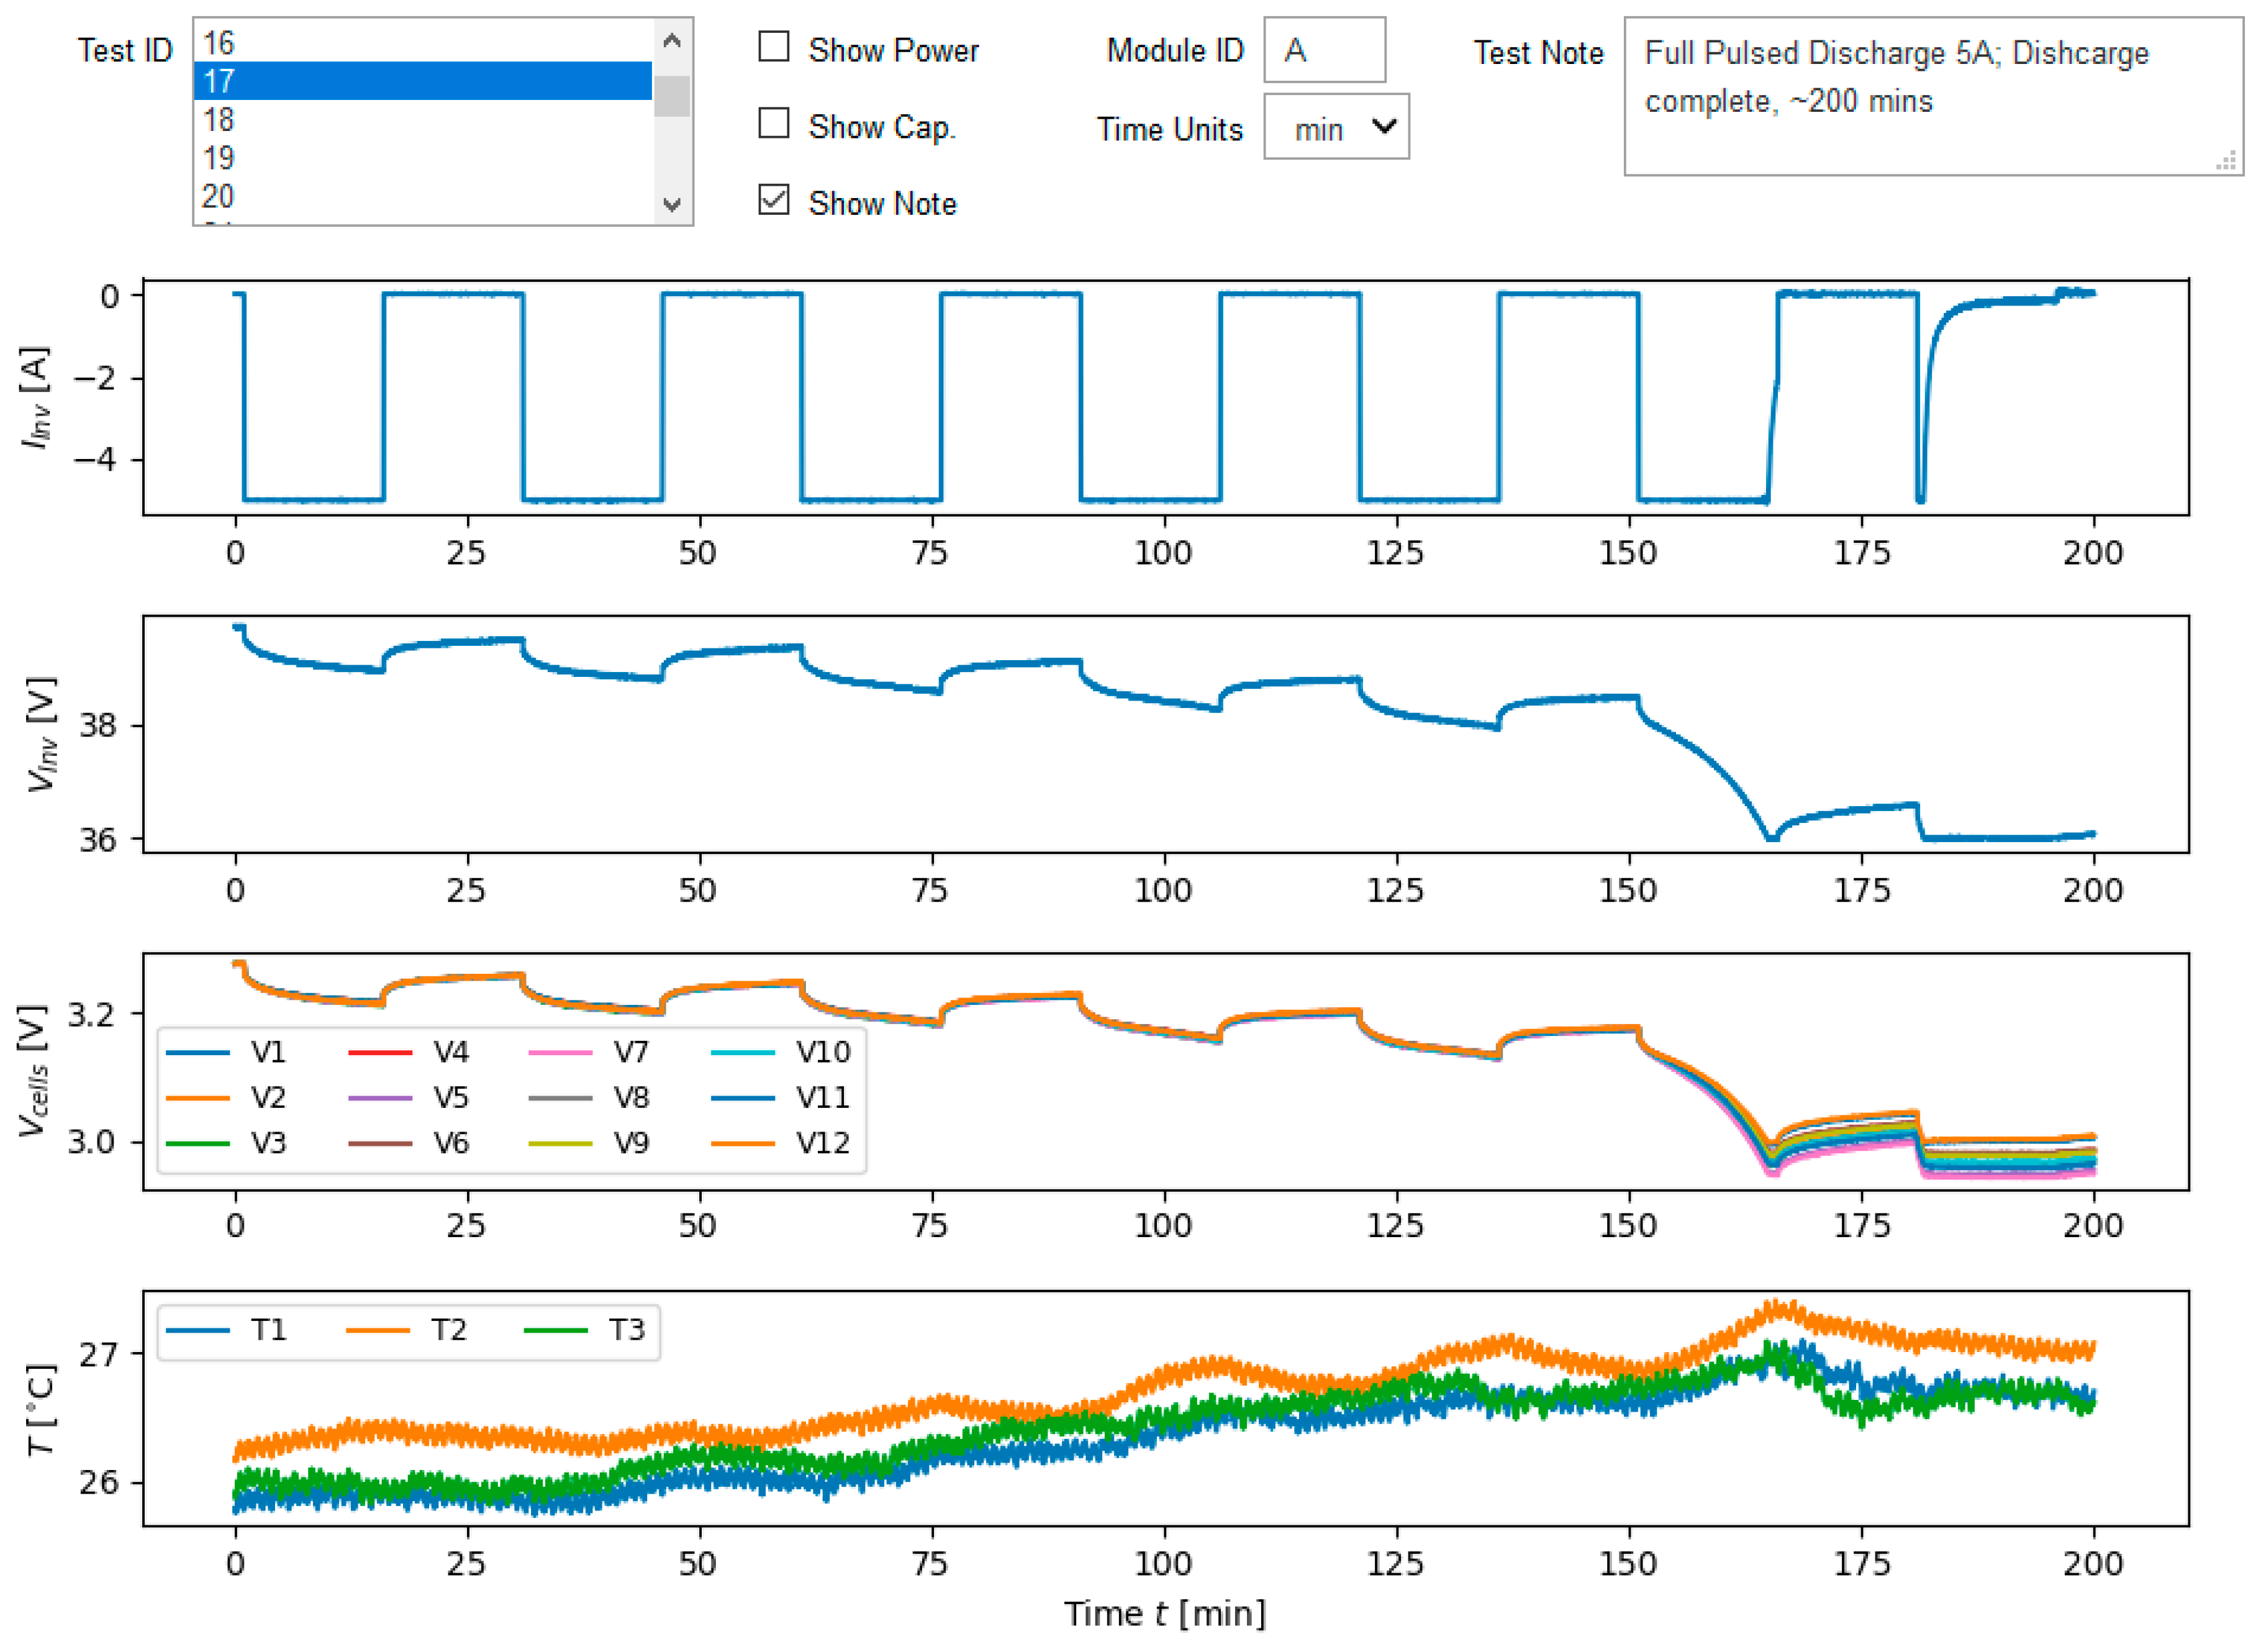
During the charge and discharge we selected conservative limits for the maximum voltage (during charge) and minimum voltage (during discharge) that are each one volt within the specified limits based on the specifications for the cells. Note that near the end of discharge (
Figure 3), defined in this conservative manner, the internal voltages start to diverge (3rd subplot). This observation, made not only at the end of multiple charge tests but also at the end of multiple discharges, reinforced the decision to employ safety factors for the system voltage limits.
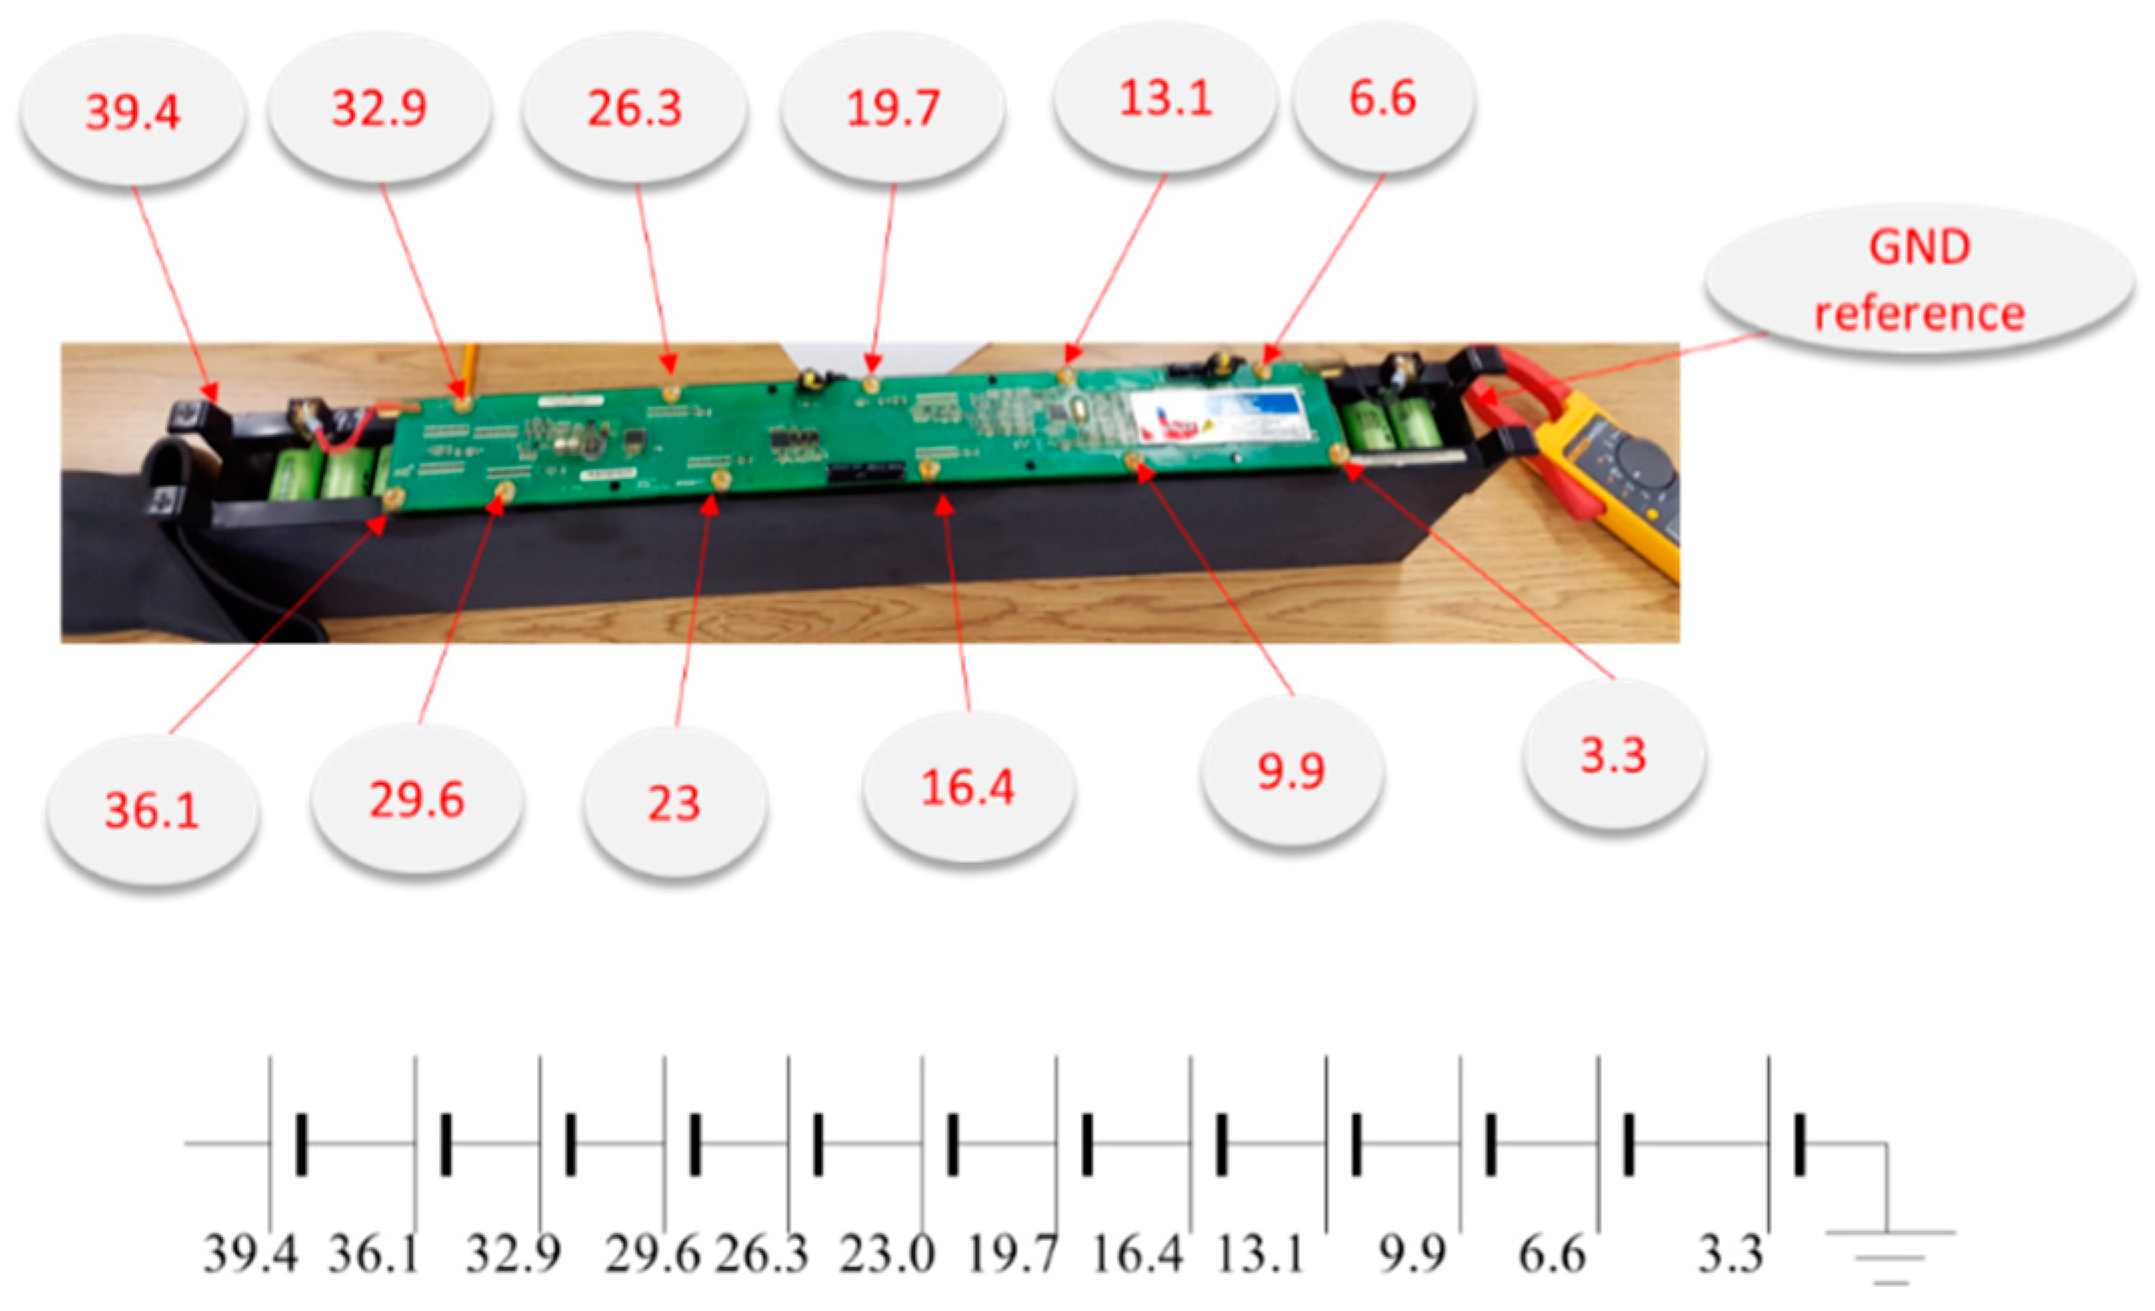
The modules consisted of 12 serially connected sub-modules, which consisted of 8 cells connected in parallel (see
Table A1 in the
Appendix A). There is natural equalization within sub-modules, which alleviates the problem of cell-to-cell capacity fade divergence during aging. However, the performance of the module is limited by the performance of the worst of the serially connected sub-modules. Connecting multiple modules in parallel can enable additional equalization but these experiments were out of the scope of this study. The tolerable degradation of the module is evaluated in the context of the application. For example, for peak shaving applications, discussed next, the overall loss of capacity directly translates to the peak shaving time interval. In practice, a designer of the peak shaving system would build in ≃25% of a safety factor and when the safety factor starts to approach zero, the module would be replaced. While the performance of the module is limited by the performance of the worst sub-module, replacing a sub-module for these application would not be practical because the modules are spot-welded and the repair process would require transport of modules to a shop. Moreover, before being used for in these applications, the modules have already reached the end of their useful life in their primary transportation applications and the other sub-modules are expected to need replacement shortly afterward. Instead, it may be of interest to evaluate the sub-modules for even less demanding applications, such as garden lights, in the future.
An initial evaluation of the suitability of the used modules for secondary, grid applications was the focus of this study. In the next sections we examine two such applications: peak shaving and reduction of the intermittency of the renewables (or firming of the renewables, as it is referred to by the practitioners in the renewable energy domain). The former application is already of interest, especially in metropolitan areas where peak power demand accounts for 50% of the bill for many commercial customers; the latter application will inevitably become important in the near future. Durability of the modules is critically important for adoption of the used modules in practice and must be evaluated in the context of each application. However, the scope and duration of this study could not support the full evaluation of a sufficiently large number of modules and sufficiently long number of cycles to determine durability. These tests can be a subject of a follow-on study. Additional challenges in evaluating degradation rate stemmed from the lack of access to new modules. Thus, the initial evaluation, conducted here, is the first step in establishing the value of the modules for the secondary applications. After the degradation and durability of the modules are established in the future, it will be possible to estimate the economic value of the modules. At present the modules have “negative value” because after the end of their useful life in the primary application, the integrator has to assume the cost of the disposal.
2.1. Peak Shaving Results
After the first few tentative attempts with low current, most of the test were settled at A. This choice was motivated by typical needs of peak shaving where the uncertainties in the timing of the peak require that the window of discharge last longer than an hour.
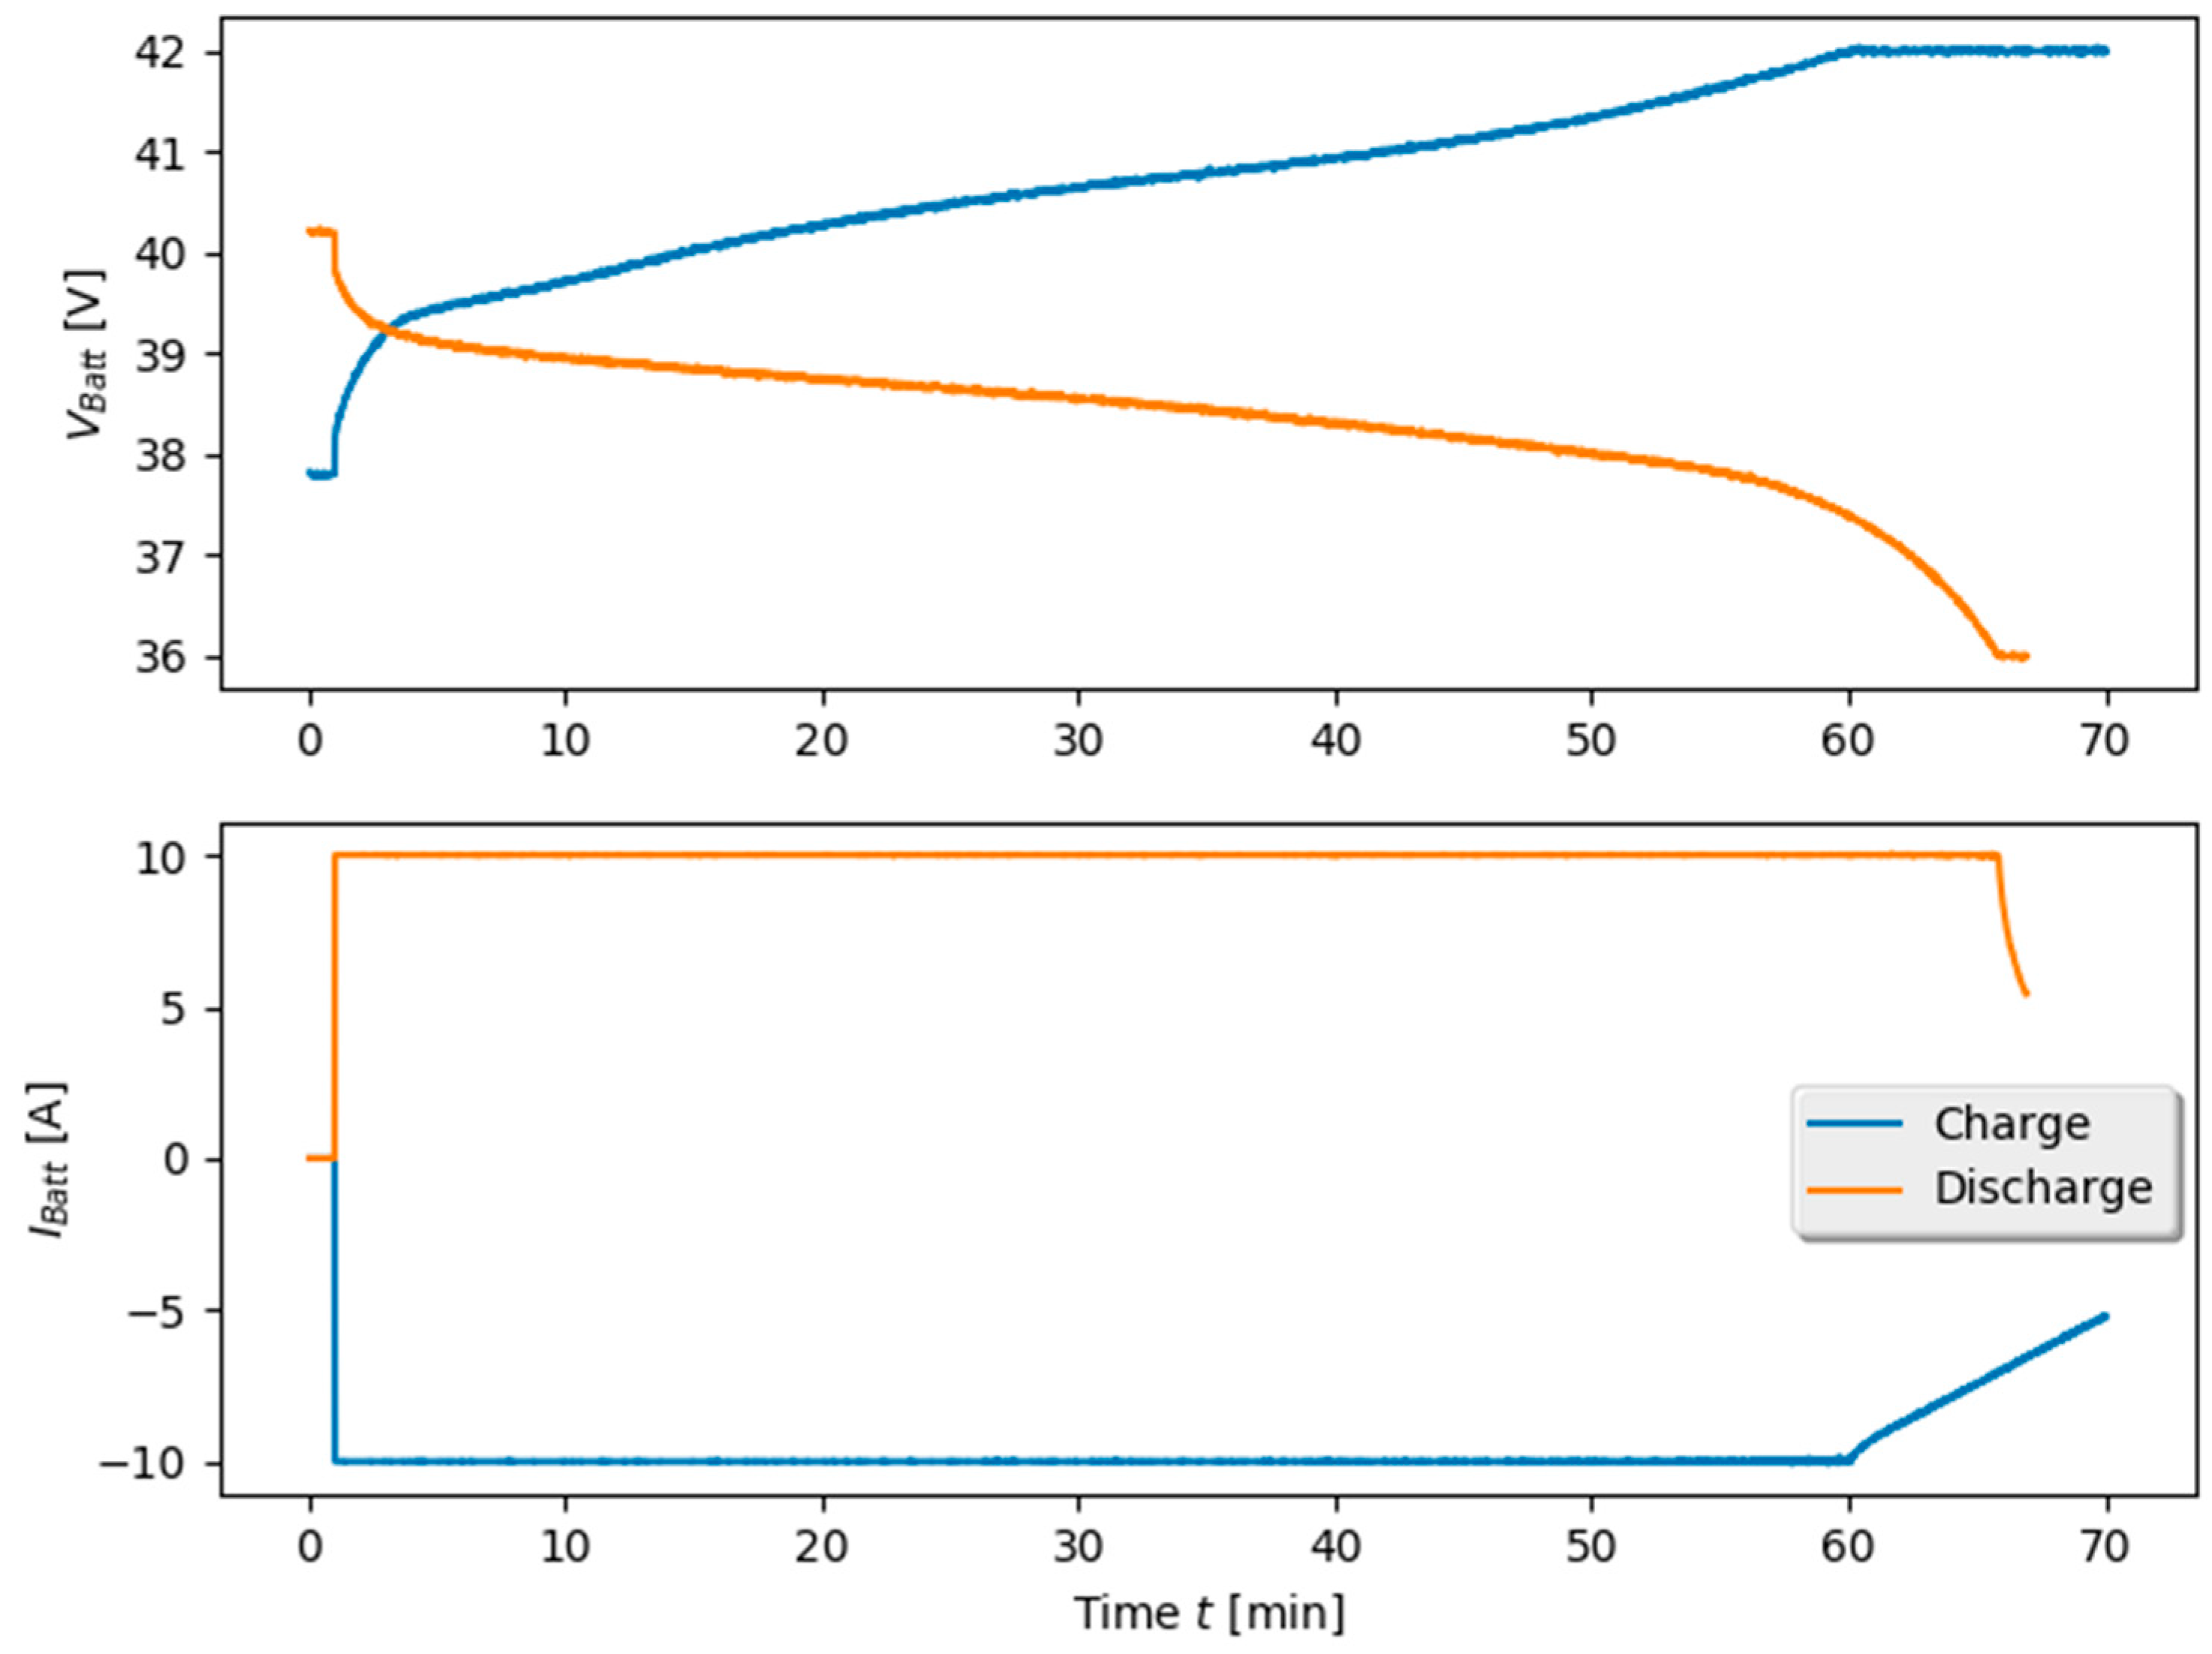
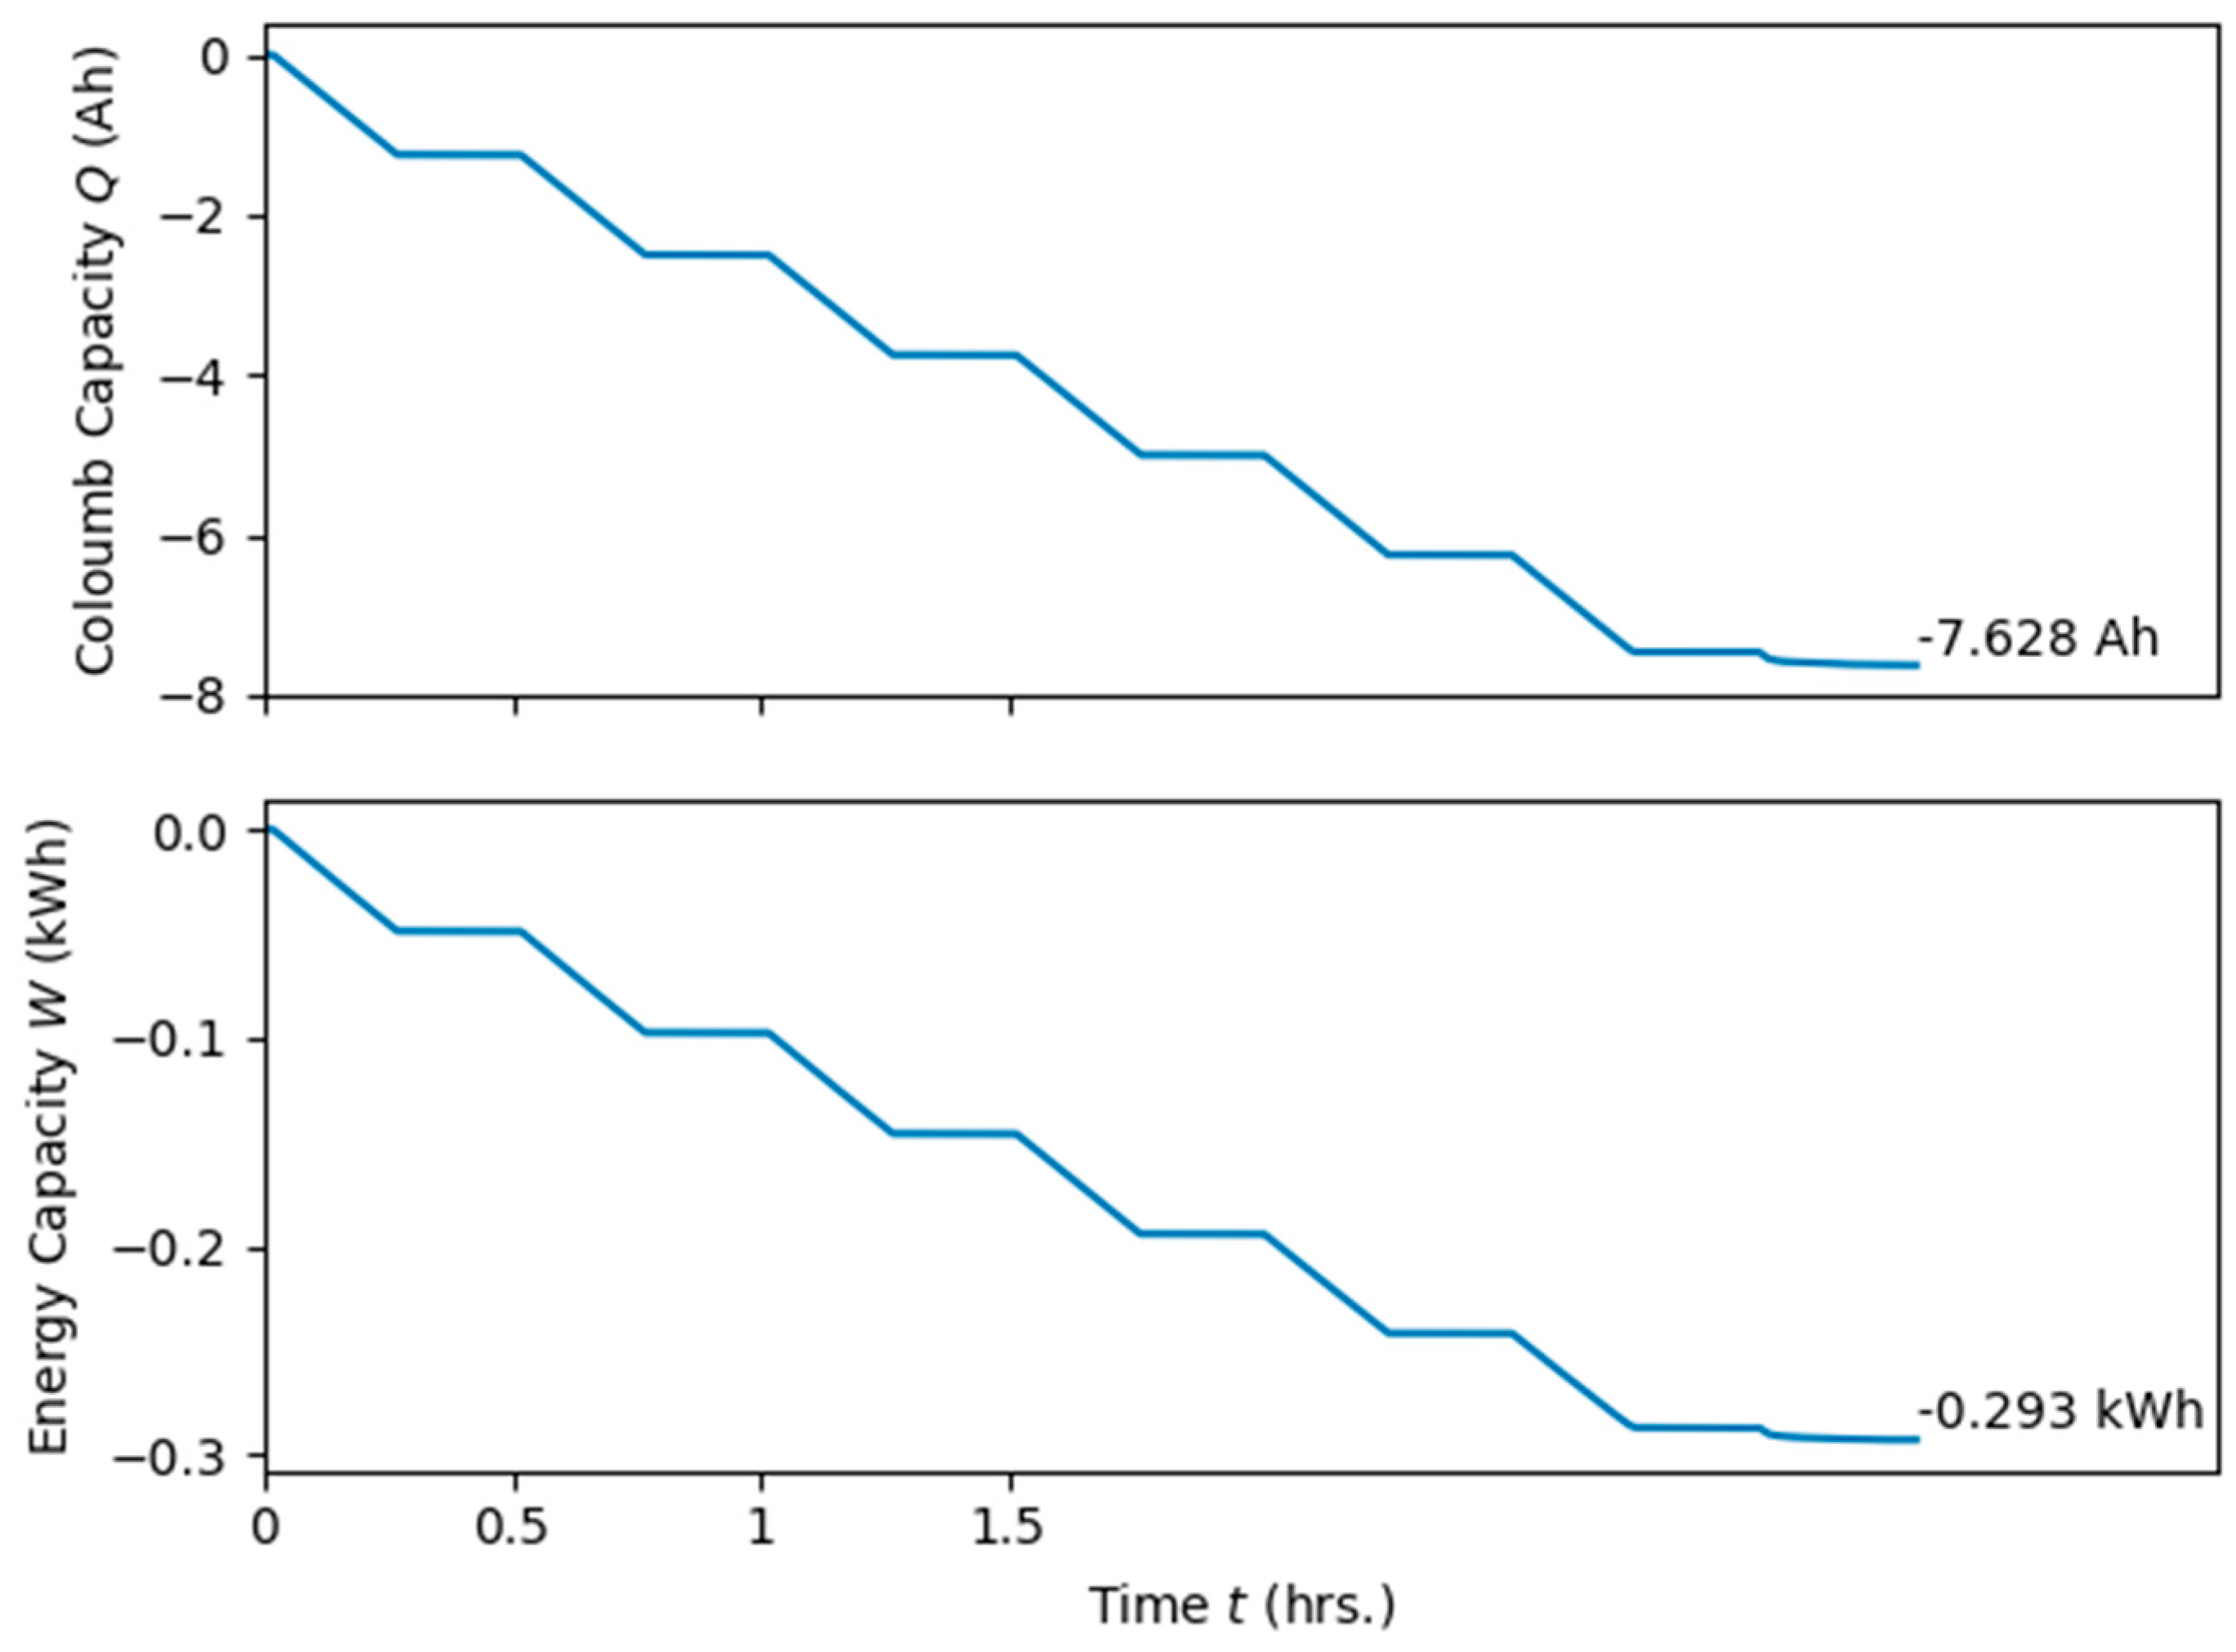
Figure 5 shows Coulomb capacity
, measured in Ah, during charge (up-pointing triangle markers) and discharge (down-pointing triangle markers) for three different modules (A, B and C). The capacity was measured at a constant current (CC) mode, until the voltage reaches the limit, when it switched to constant voltage (CV) mode. An example of a charge and a discharge cycle is shown in
Figure 6. Although a typically discharge cycle does not contain the CV mode, these tests included them to achieve a closer parallel between the two tests. It is important to note that in practical applications the useful discharge is determined by the load and CV mode is not meaningful.
Although standard cycling of a hundred or more cycles were out of the scope of the current project, we can see that that the observed capacities shown in
Figure 5 (a total of 13 tests) were fairly consistent, within approximately ±6%.
Two additional current levels were tested, viz.
A and
A.
Figure 7 shows the capacities observed at the three levels of testing. Each column corresponds to a separate charge-discharge cycle. As before the capacities are within a few percent of their mean, which is within the error bar of the test. While the capacities are very comparable, it is important to keep in mind that the duration of the charge cycles are inversely proportional to the current levels.
2.2. Firming Renewables Results
Different strategies for operating storage to condition the intermittent solar generation were investigated. The constraints of storage cost that limits the available energy and power from storage, as well as the finite resolution of the inverter were taken into account.
It was found that value stacking, such as using storage energy to offset the peaks due to morning charges can be used to keep the battery at its preferred energy state (~50% vs. ~0% that can be detrimental to storage durability).
Figure 8 shows the characteristic waveforms of the storage operation; the top plot shows generated power, targeted one hour ahead and EV profiles. The middle plots shows that the battery is operating within its power range and the bottom plot shows that the battery is operating within its energy range. The battery should be charged to about 50% of its capacity during off-peak hours.
The profile of the battery power needed to condition hour-by-hour solar generation is shown in
Figure 9. To assess whether used modules could be subjected to this profile, it was sufficient to select a four hour long subset of the entire day, where considerable variability was observed. For this purpose, we selected the four hours between 10 AM and 2 PM, highlighted in
Figure 9 and expanded in
Figure 10.
The power capability of an individual battery module was not at the level of the building power generator. Thus, the waveform was scaled accordingly. The largest current used in testing was 10 A and our upper voltage limit was set to 42 V.
. The maximum power allowed in testing was 0.42 kW. Through a bit of trial and error the values of the power profile in
Figure 10 were scaled down by 60, putting the absolute value of their limits within roughly the desired 0.42 kW (In
Figure 11 the minimum values just reach past −0.4). In other words, the decision to keep the power within the testing limits suggested that the number of modules needed for firming a ≃40 kW solar generator in hour-by-hour fashion would be approximately 60, if this power profile were used.
It was of interest to verify the energy limits.
Figure 12 gives the energy profile for this interval acquired by integrating the scaled power profile in
Figure 11. When running the scaled power profile the battery should start at approximately 50% SOC.
Storage power was computed from the inverter voltage and the inverter current as
Figure 13 shows the results of the firming renewable profile. The fourth subplot, showing 12 internal voltage measurements, did not divergence as much as in charge and discharge cycles previously observed because the battery started near 50% SOC and the firming renewable profile did not require it to reach as close to those limits in order to support the solar generator.
4. Conclusions
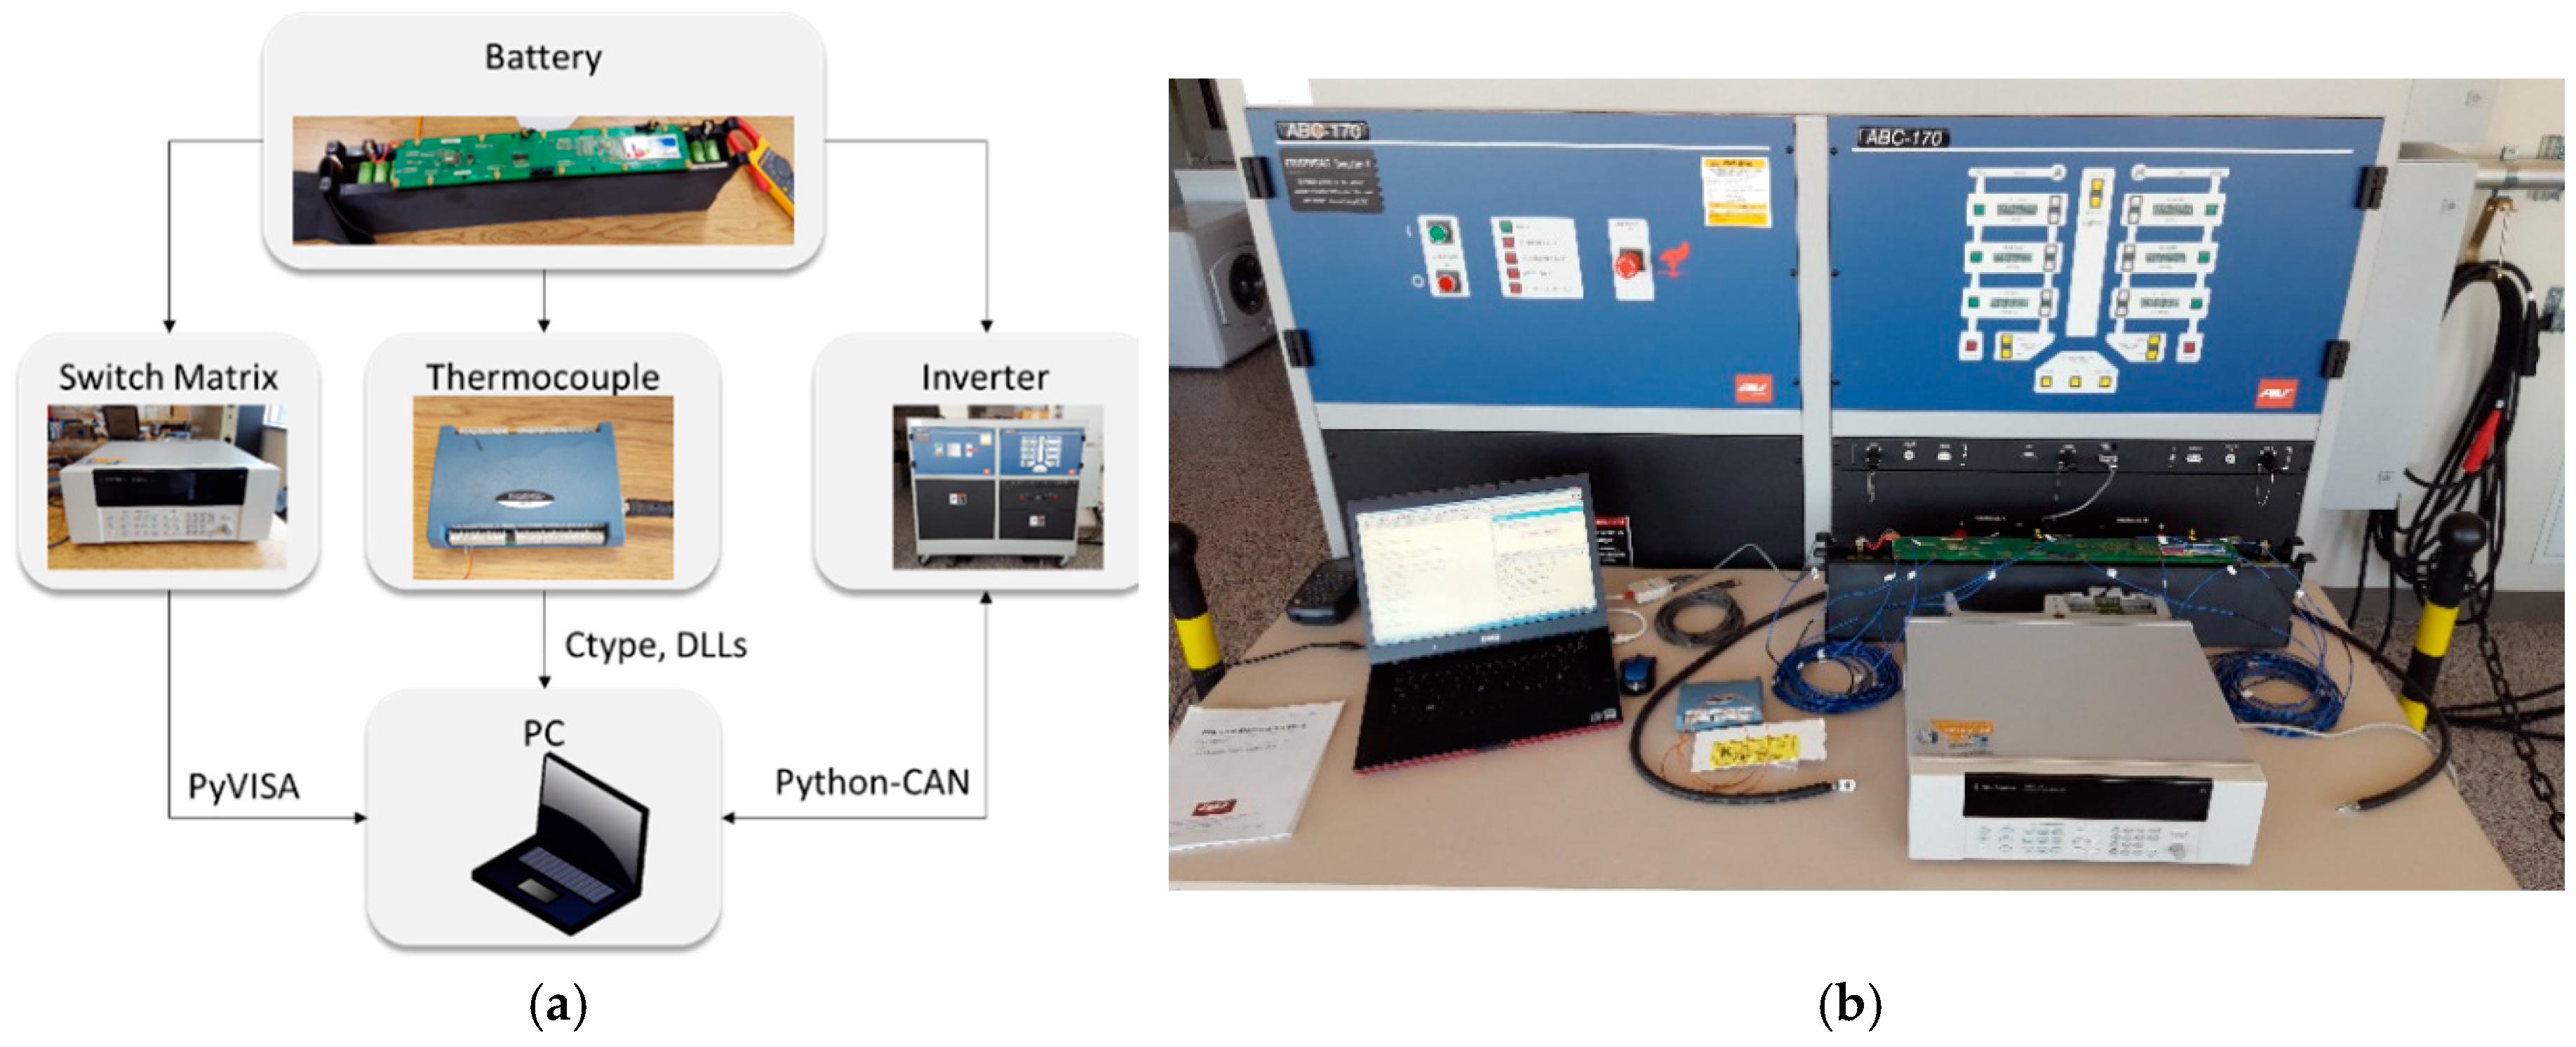
The modern electric grid has a critical need to for inexpensive scalable storage. This pressing need comes from the growing renewable energy resources, which depend on weather and produce highly variable and unpredictable power. The present utility operation requires that the generators provide day ahead, hour-by-hour accurate forecast of their operation. The weather predictions cannot accurately predict wind strength or cloud coverage on hour-by-hour bases, which directly determine intermittency of the renewable power generation. From the technical point of view, the storage offers a straightforward solution to this problem but it is currently cost-prohibitive. On the other hand, the battery modules from electric and hybrid electric vehicles have significant capacity left, when they reach the end of their useful life. The study examined feasibility of the used modules, at the end of their useful life in hybrid electric trucks, for use in the two selected grid applications, viz. peak shaving and firming renewables. Three battery modules were subjected to three separate tests. The first test was a charge and discharge using pulsed current and explored the dependence of the modules’ effective parameters to the SOC of the three modules. The second test used constant current for charge and discharge to examine the suitability for peak shaving applications of the three modules. Charging these reused modules during morning hours and discharging during peak energy hours of the day have the potential to reduce peak energy costs, the need for economically inefficient peaker plants and the expensive waste stream processes these modules would follow otherwise. The third test employed custom waveforms, based on observed solar generation, for compensating the intermittency of a solar power generator. Without storage to smooth out the variability of weather-dependent power generation, the utilities must limit the number of distributed energy resources to avoid instabilities. The profile developed in this study was designed to keep predictable fixed power output from the solar generator for one hour. The battery integrators of the electric buses are interested only in selling the battery modules, without instrumentation and battery management system. Reusing the modules in secondary applications requires considerable effort for re-building the instrumentation and the monitoring system. The activities related to building the monitoring system are described in detail in the Materials and Methods section.
During the peak shaving tests, current and voltage measurements showed a low variation in estimated energy capacity, at under 6% among the three tested modules and under 8% among varying currents (10 A, 15 A and 20 A) for one of the modules. The observed divergence of internal node voltages near the end of a charge or discharge cycle during an initial low-current test strongly suggested the use of more conservative thresholds during the higher-current tests. Consequently, the capacity was limited by the voltage threshold crossing of the worst-performing sub-module. The divergences were indicators of different rates of aging among sub-modules and for the specific application to be considered for production, a follow on study with many more cycles would be recommended. The voltage drift phenomenon of aged cells was attenuated in a group of cells connected in parallel and the average performance in each parallel group contributed to the over performance of the stack in series, which was limited by the worst performing group. The experiments concluded with the cycling test based on a power profile that was computed from real solar generator data in order to reduce intermittency due to effects such as cloudy weather.
This study demonstrated that the used modules can perform desired functionality over a short term. A follow-on study, with longer cycling and a larger number of modules, is required to establish the modules’ degradation and durability, with the ultimate objective of estimating the economic value that the prospective customers would be willing to pay for the modules. The modules currently have negative value to their current owners, vehicle battery integrators, who must pay transportation and disposal fees for their removal. Additional future work can expand to simultaneous testing of multiple connected modules in grid applications.


