1. Introduction
During the last decade, electrochemical energy storage devices have advanced into entirely new fields of application [
1]. Due to their higher reliability and performance as well as reduced costs, lithium ion battery cells with graphite anode and nickel cobalt manganese oxide composite cathode (NCM) are predominantly being utilized for power storage applications [
2]. Since rapid ion transport must be ensured for a high performance, liquid electrolytes are primarily employed. A drawback of this design type is its safety aspect as it is probable that damaged cells are thermally destroyed in an explosion with toxic outgassing [
3]. Furthermore, the reaction will spread to adjacent cells, leading to a total failure of the entire system, and place the surrounding areas at risk. In addition, the recently proceeding development of nickel-rich cathodes contributes to an aggravation of the safety risk [
4]. Although these electrodes have higher electrical capacities and partially substitute the insufficiently available and expensive element cobalt, they form a more unstable state of the composite crystal structure and are thus more susceptible to degradation and failure [
5]. Nevertheless, battery cells with nickel-rich cathodes and liquid electrolyte will also have a broad application potential in the future, even in critical infrastructures such as aircrafts, vessels, submarines and clean rooms as well as high-energy storages for charging stations and IT centers. A usage of lithium ion batteries in second-life applications is also obvious, especially in the field of automotive construction where high-performance power storages are of interest, which have a large part of the initial electrical capacity available at their application-specific end of life. In this context, further safety-critical aspects arise, which must be considered in the later field of application.
An enhanced safety level can essentially be achieved by applying a safe cell chemistry, a supervisory disaster-controlling system or an additional sensor technology for a stand-alone monitoring, simultaneous with the conventional battery management system. To date, the establishment of an innovative cell type is not in prospect and solid-state batteries are still in the developmental stage for an indeterminate period of time [
6]. Malfunction fallback systems, such as energy-consuming cell interlayers, harmful gas neutralization filters, flame filters or solid enclosures, are available but unfeasible for most applications due to the extra costs and system size. In particular, the use of additional sensors for determining the state of charge (SOC) and the state of health (SOH) as well as the measurement of operating parameters and early detection of failures is a promising solution strategy for safety-critical applications. Specifically pouch cells are in the focus of development, since inactive materials such as the battery cell casing constitute a very small proportion of the total weight. It is expected that comparable reproducibility and gravimetric energy densities to prismatic cells can be achieved by novel stacking and deep drawing techniques [
7]. On the basis of externally applied optical Bragg sensors, which act as volume expansion sensors, it is already possible to determine, on the one hand, the state of charge through the detection of reversible, so-called battery cell respiration, and on the other hand, the state of health through the measurement of irreversible cell expansion due to electrolyte outgassing, solid electrolyte interphase (SEI) growth or electrode recrystallization processes [
8]. The key benefits of these optical sensors include full electromagnetic compatibility, low cost sensor material, and the ability to integrate a variety of sensor positions into a single light waveguide as well as to simultaneously monitor various measurands, such as strain and temperature.
For an immediate and high-precision status monitoring of lithium ion batteries without transmission and time losses, a measurement signal acquisition inside the cell, directly at the site of the reaction, is required. A variety of research activities, such as [
9,
10,
11,
12], are focused on this objective. However, for a cell internal measurement, addressed for example in [
13], essential requirements must be fulfilled. On the one hand, the sensor must not be passivated by the electrolyte in the cell by reaction or deposition processes, on the other hand, an accelerated cell aging must be prevented despite the integration of an additional sensor system as a foreign object. Besides maintaining the cell performance, for reasons of operational safety, an accumulation of lithium on the sensor is to be prevented, which explains why uncoated metal-based sensors are therefore unsuitable. Furthermore, the hermeticity of the cell casing material must be ensured at the sensing element entry point, so that moisture cannot penetrate through the ambient air and no electrolyte can leak. Additionally, foreign objects potentially promote the detachment of electrode active material with concomitant loss of capacity by electrical isolation, which also needs to be averted. Lastly, the sensory equipment of the cell should not lead to a significant increase in the price of the electrochemical energy storage, since a realistic application potential is a prerequisite for the development.
In order to satisfy all of these requirements, an optical sensor has been developed in this work with which cell-internal temperatures, temperature-compensated expansions and refractive index variations can be detected. The waveguiding of the measurement light is accomplished using a standard telecommunication glass fiber. In the light-guiding core of the fiber, first the individual grating points are processed by applying the point-by-point inscription method [
14,
15] with the interaction of a femtosecond pulsed laser (Spectra-Physics Ti:Sapphire Tsunami/Spitfire pro), a focusing objective lens with a numerical aperture of 0.4 (Zeiss LD Plan-Neoflur 20×) and a three-dimensional computer-controlled translation stage (PI N-565.260 linear translation stage), so that the Bragg condition for reflecting the characteristic wavelength spectrum, depending on the grating point distance and the effective refractive index resulting from the optical densities of the Bragg grating, the light waveguide and the surrounding medium, is fulfilled. For an exclusive strain and temperature measurement, this type of sensor (core Bragg grating), schematically shown in
Figure 1a, is sufficient. For this research work, however, changes in the refractive index of the measuring environment shall also be detected. Therefore, the Bragg grating needs to stay in direct contact with the ambient medium to analyze the effective index of refraction. By applying hydrogen fluoride etching, the glass cladding of the fiber could be removed to reach this objective [
16]. The remaining glass stand would have a diameter of merely 6–9 µm and miss the mechanical stability that is essential for a later processing inside the glovebox under protection gas atmosphere. Considering this, a production method developed by our group [
17] is utilized. By applying the same femtosecond pulsed laser setup, a cladding waveguide is processed from the fiber core to its edge. The measuring light hereby is split between two paths. At the laterally same position, a second Bragg grating is integrated into the manufactured waveguide in the edge area of the fiber (surface cladding waveguide Bragg grating). The scheme of the temperature
T, strain
ε and refractive index
n sensitive optical compensating sensor is illustrated in
Figure 1b.
With the integration of such a photonic sensor into a lithium ion battery cell, the expansion of the electrodes and temperature variations at the reaction sites can be detected with the Bragg grating located precisely in the central fiber core and simultaneously, mass composition changes in the cell interior can be measured by the second Bragg grating in the fiber edge region, since the local refractive index is directly affected by evanescent fields. The latter parameter information is especially important if changes in the conductive salt concentrations occur due to degradation processes, for example when electrolyte boundary layers increase. This results in the passivation of the materials actively involved in the internal energy conversion processes. During the desired formation and undesired further growth of the solid electrolyte interphase, for instance, diffusible lithium ions are sorbed and are thus no longer available for cell cyclization. By utilizing the developed optical sensor in the experiments presented in this work, a foundation for future non-electrical measurements for simultaneous internal and external condition monitoring of lithium ion battery cells should be created. To achieve this objective, as a first step, the manufacturing and subsequent integration of the sensor into the anode active material of a cell is conducted in order to carry out cyclization and abuse strain measurements with the core Bragg sensor. In the second step, the surface cladding waveguide grating is additionally included on the one hand as a stand-alone sensor to measure the refractive index temperature-compensated within ionic solutions, and on the other hand, integrated in the cell’s separator layer, to investigate the charging behavior and revealing characteristics. Finally, it is assessed to what extent the sensor at this stage is suitable for various state analyses and which development steps must be taken for a robust measured value acquisition with low cross-influence and improved separability of the state variables strain, temperature and refractive index.
2. Core Fiber Bragg Grating Sensors for Electrode Active Material-Internal Status Monitoring
2.1. Sensor Production by Direct Point-By-Point Inscription
For the realization of a mere optical strain measurement with an active material-internal status monitoring, no changes in the light conduction conditions within the glass fiber need to be implemented. The grating points are inscribed directly in the core centerline axis of the fiber by utilizing the femtosecond pulsed laser-based point-by-point inscription method. A pulse length of 90 fs (Spectra-Physics autocorrelator Model 109) and a pulse energy of 125 nJ (Ophir PE9-ES-C), measured after the fiber core focusing lens, is applied for the production process. The manufactured optical sensor is embodied by a Bragg grating type II with an adjusted center reflection wavelength of 829 nm and a reflectivity of 50%, both of which are measured with an optical spectrum analyzer (Yokogawa AQ6370B). The broadband light source used is a fiber-coupled and temperature-regulated superluminescent diode (SLED) with a central wavelength of 830 nm (EXALOS SLED 14-BTF). The grating has a length of 1 mm and consists of 1200 refractive index variation points in the third grating period order. The sensor is integrated in a 7.5 µm thick polyimide-coated single-mode glass fiber with a germanium-doped core of diameter 5 µm and a pure silica cladding of diameter 125 µm (Leoni SMF810-E5/125PI).
Optical strain sensors are mechanically coupled to the surface to be monitored, which is why a thermal compensation sensor is needed in the same location to separate the state-dependent expansion from any temperature effects. In the present case, the compensation sensor is omitted because all of the tests, except for the final abuse scenarios, take place in a temperature-controlled environment at relatively low charge and discharge rates.
2.2. Battery Cell Manufacturing with Core Bragg Grating Sensor Integration
In the following step, two optical sensor-integrated lithium ion battery cells in a pouch bag housing with an electrical capacity of 5 Ah are manufactured. First, the electrodes are produced with a roll-to-roll coater and cut out with a roll cutter. The anodes consist of graphite (Imerys TIMREX SLP-30) as the electrochemically active material, sodium carboxymethyl cellulose (Sigma-Aldrich Na-CMC) as a binder and carbon black (Imerys ENSACO Super C 65) as a conductive additive. The anode material composition (graphite/Na-CMC/carbon black) is 91:3:6 by weight percent. The cathode consists of lithium nickel manganese cobalt oxide (POSCO ESM NMC 811) as the electrochemically active material, polyvinyl difluoride (Arkema PVDF Kynar ADX 111) as binder and carbon black (Imerys ENSACO Super C 65) as conductive additive. The cathode material composition (NMC/PVDF/carbon black) is 89:5:6 by weight percent. The compounds are mixed under vacuum conditions (Eirch R02Vac IntensiveMixer). The anode is coated on copper foil and the cathode on aluminum foil, respectively. The coating and calendering are conducted using a roll-to-roll coater (Mathis BA-RRC). Subsequently, electrodes with an area of 20 × 10 cm
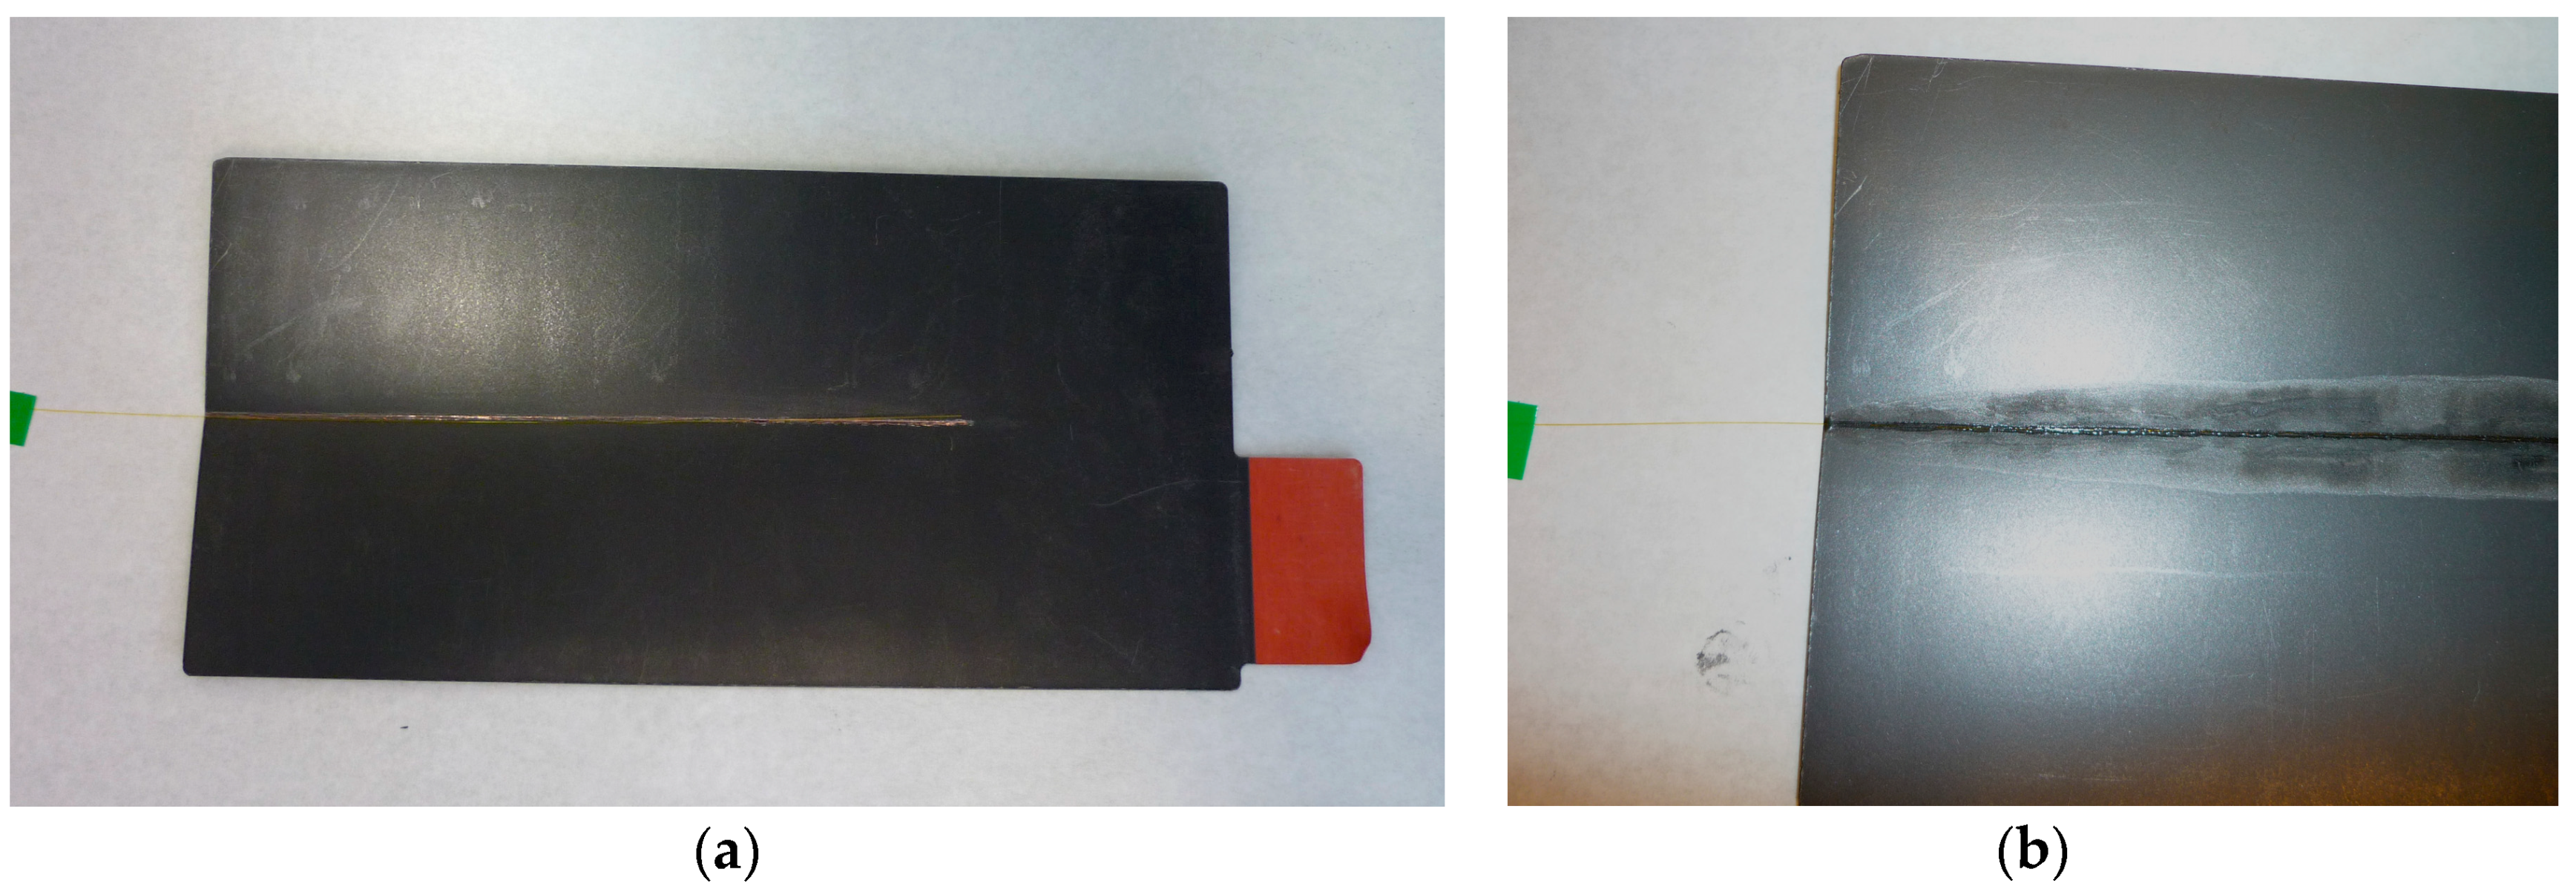
2 are stamped out. Four cathodes and four anodes are stacked with a separator (Litarion SEPARION S240P20). Before the stacking of the respective cells, the glass fiber with the core Bragg grating sensor is integrated inside one of the anode plates. Accordingly, a central strip of the anode active material is removed, creating a small groove. Therein, the glass fiber is inserted and coated with the same slurry, which is used for the electrode production. After drying, the process is repeated until the glass fiber is completely attached to the electrode. In
Figure 2, the sensor-integrated electrode, before and after coating, is shown. A polypropylene tape is welded on the fiber to be sealed with the pouch bag foil during the process step of pre-sealing. This method allows the fiber to be led out of the cell without causing any leakage, since the tape surface and the inner layer of the aluminum composite foil consist of the same material and are therefore reliably combined.
In the next step, the stack is placed between matching pouch bag foil sheets (Südpack Four-Layer Composite Foil) and pre-sealed at three sides before drying under reduced pressure (<1 mbar) for 24 h at 120.0 °C. The prepared cell is then filled with a 25 mL electrolyte solution of ethylene carbonate (EC) and diethyl carbonate (DEC) in equal proportions by volume as well as with the conducting salt lithium hexafluorophosphate (LiPF6) in a molar concentration of 1 M. The final sealing process is performed with a semi-automatic fill and sealing machine (Harro Höfliger LRT) inside a glovebox under an argon atmosphere with a purity of water and oxygen of less than 1 ppm at a pressure of 20 mbar. Subsequently, the manufactured fiber-optically monitored cell is subjected to electrical tests.
2.3. Cell Formation and Cyclization with Fiber-Optical Anode Active Material Strain Condition Monitoring
For the formation of the solid electrolyte interphase, explained in [
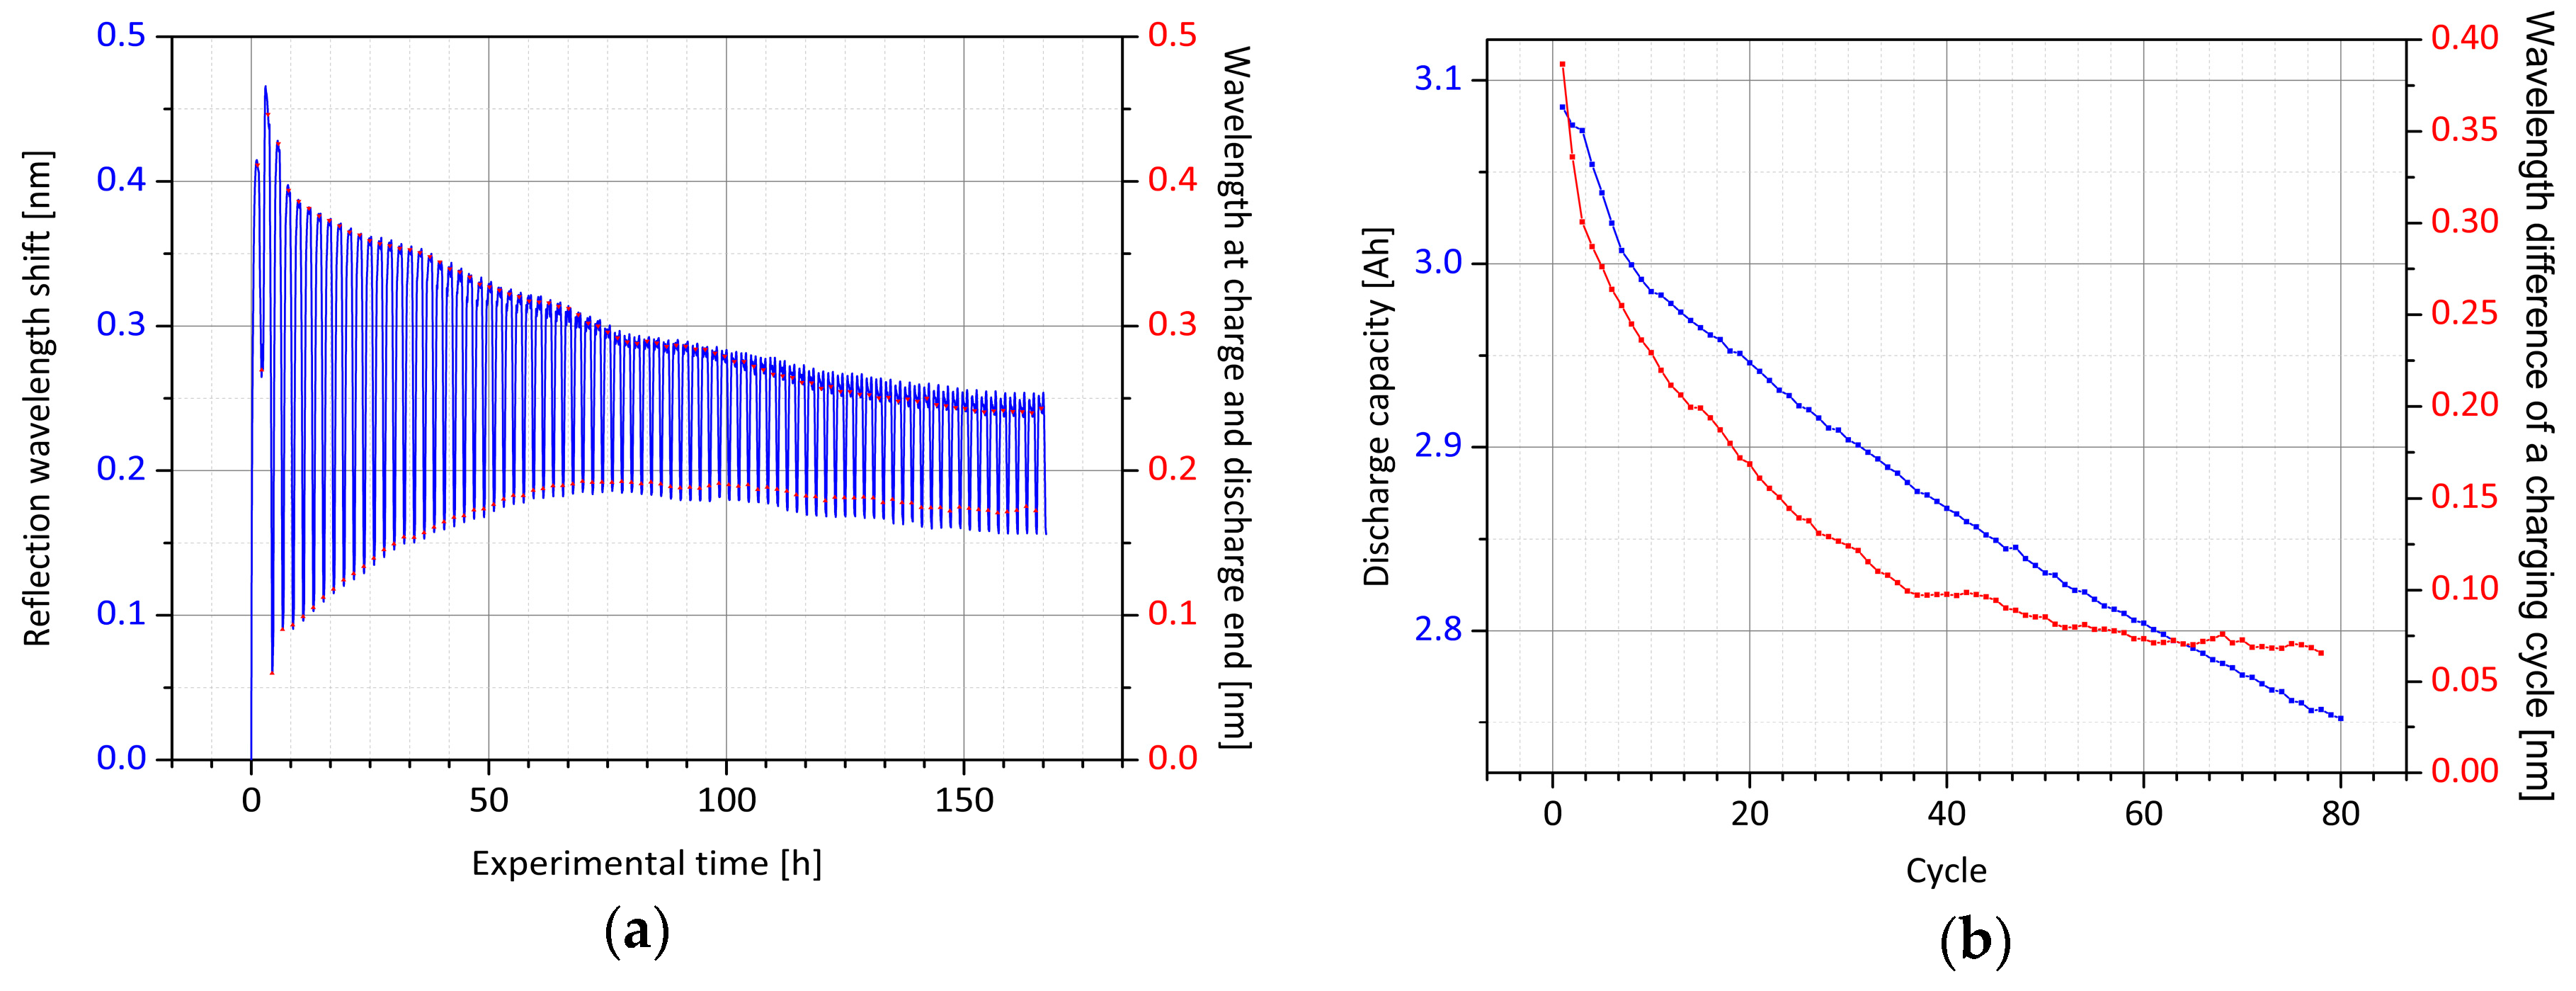
18], the cell is cycled between 3.0 V and 4.2 V at a current rate of 0.2C. Thereafter, the cell is cycled at 1C between 3.0 V and 4.2 V for 80 cycles. Both process steps are done with a cyclization unit (BaSyTec HPS) inside a temperature chamber (Vötsch VT 4021) set to 23.0 °C. In
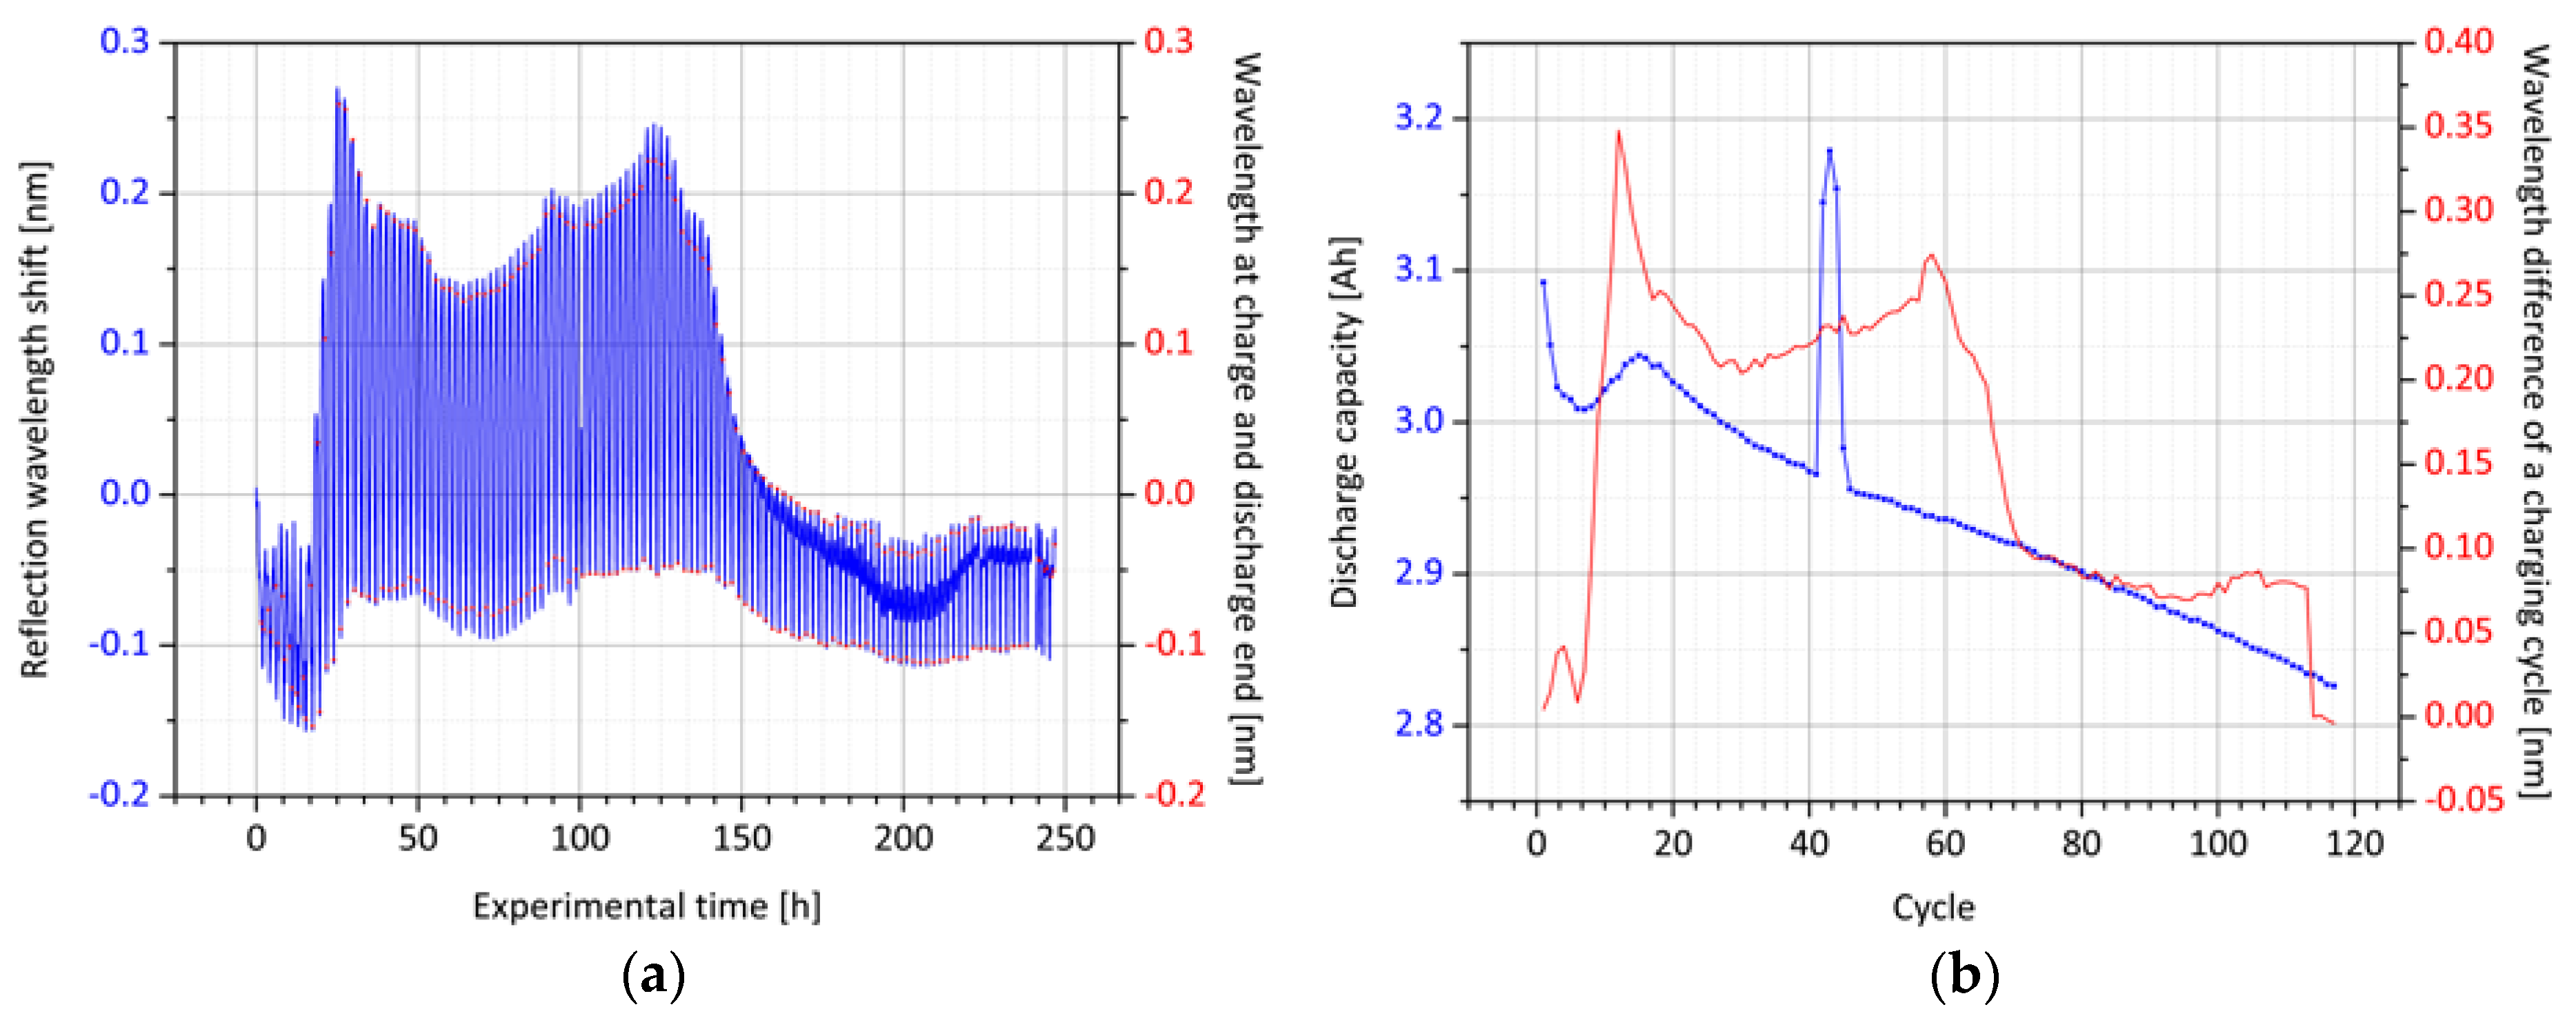
Figure 3, the corresponding results are shown in detail. During the first charging process, the reflection wavelength of the core Bragg grating is increasing by 400 pm, followed by a decrease of 150 pm until the end of discharge. For the second cycle, the anode active material shows the most intense expansion rate with a signal shift of 400 pm between the lowest and highest state of charge level. This is not an unusual development since contact surfaces and interfaces form during the first charging and discharging processes, even after the formation step. The optical strain sensor detects expansion exclusively in the longitudinal direction. For anode thickness growth, as determined by external strain monitoring with Bragg gratings, and for transverse expansion, there is no sensitivity.
In the further course of the cyclization, the maximum wavelength at the end of charge decreases, and concomitantly, the minimum wavelength at the discharge end increases. By comparing the difference between the two values, it is recognized that an exponential decay of the amplitude occurs, until approximately cycle 40. Subsequently, the signal drops slightly in linear course. In addition, the overall wavelength shift moves steadily to lower wavelengths and the optically determined signal shape of a full cycle also changes gently from that point. By evaluating the electrical discharge capacity of the respective cycles, the initial exponential decay is detected only until the 10th cycle; hereafter, a steadily linear drop occurs, which is in slight deviation to the optical signal. Nonetheless, there is an obvious correlation between the wavelength difference and capacity fade of the cell. Both measurements are directly related to the number of lithium ions capable of being lithiated into the anode active material. With each cyclization step, it is most likely that some lithium is not deintercalated from the anode and is thus not available for the discharge process. Simultaneously, the compression of this electrode is less pronounced. Furthermore, with each charging process, by electrical and chemical passivation, slightly less active material for the intercalation is supplied within the graphite layers, so that the expansion of the anode is also subsiding. Both processes are very well reflected by the optical signal. In
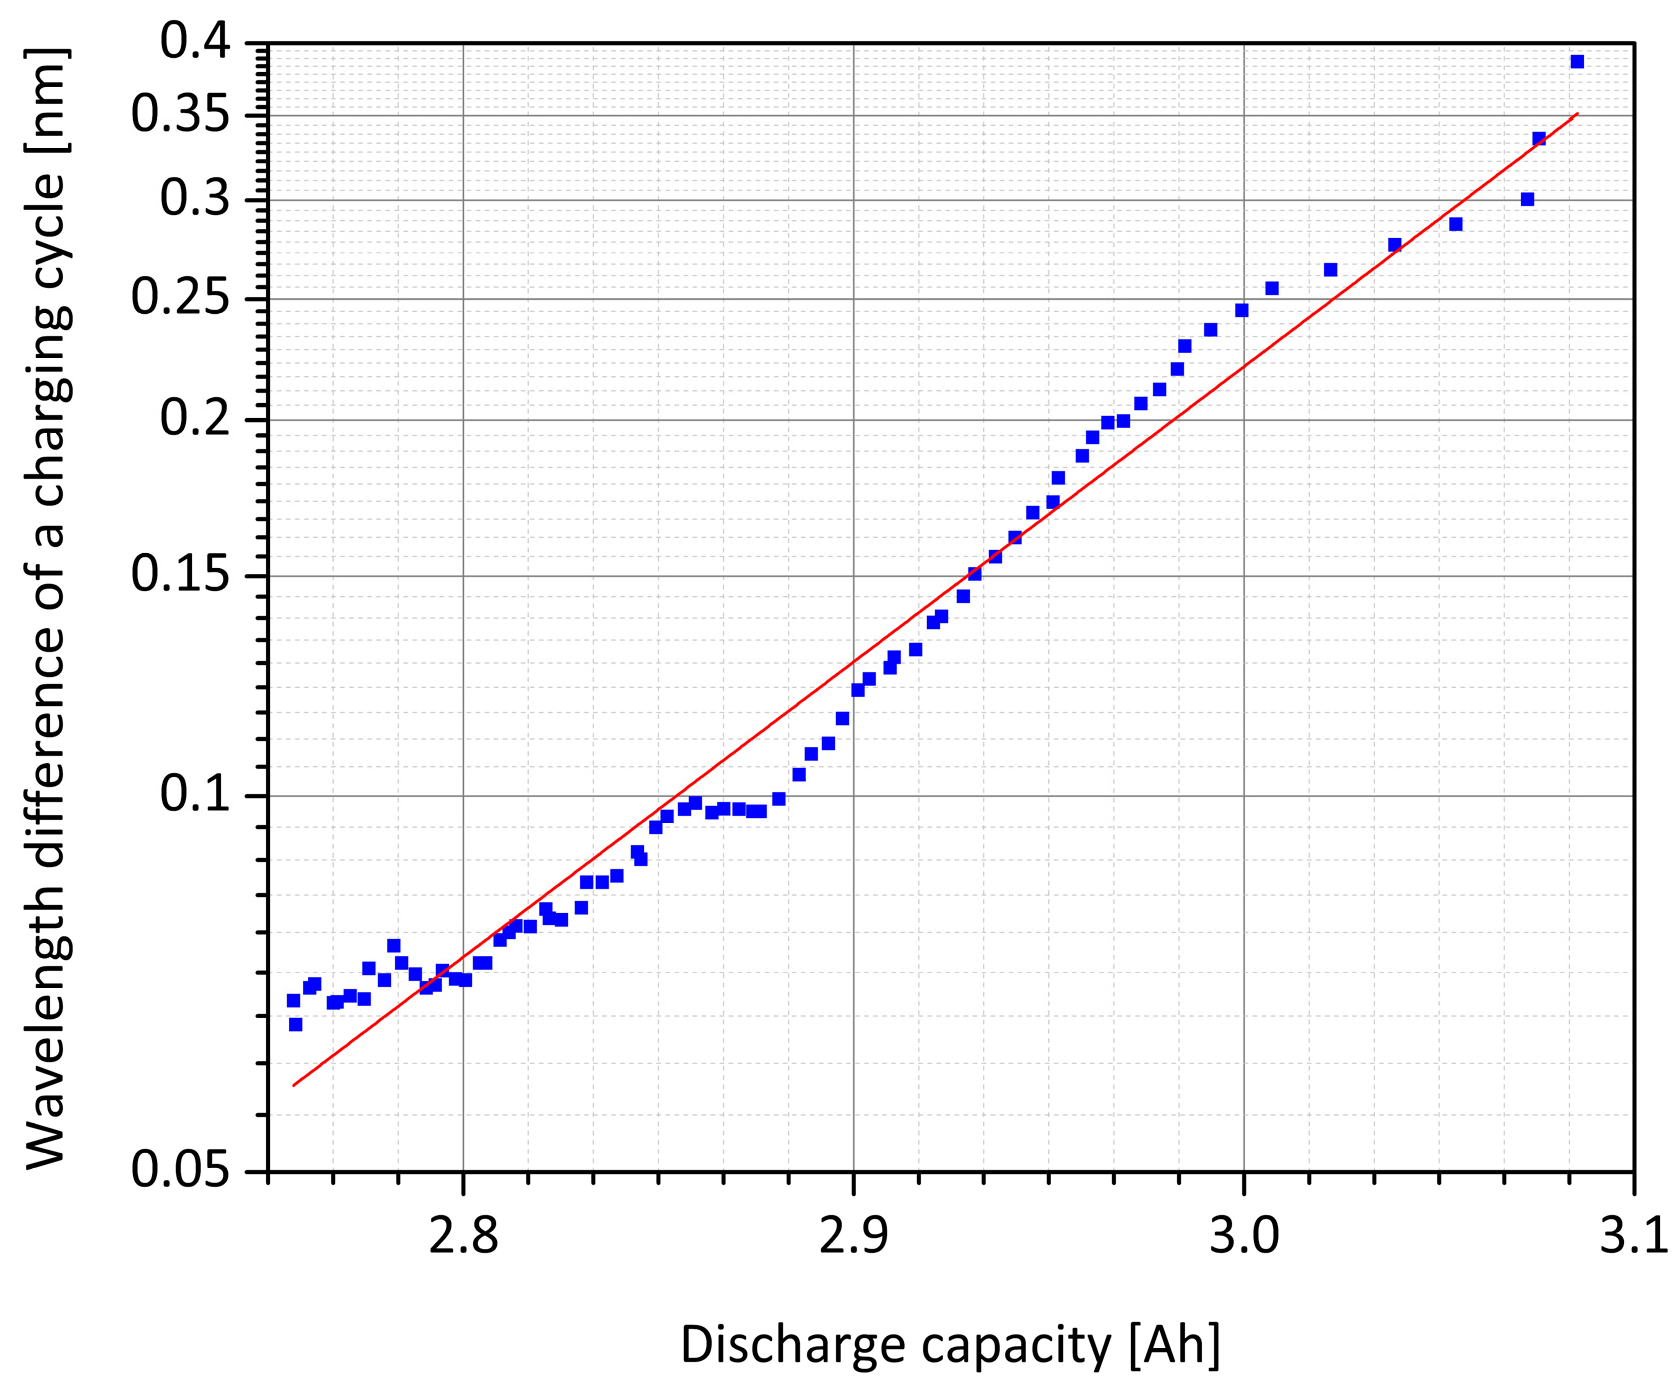
Figure 4, the outlined relationship is illustrated.
With the results of the fiber-optical measurement, the logarithmically plotted exponential decay of the core Bragg grating’s wavelength amplitudes above the linear capacity drop can be approximated to a linear course. With this established correlation, by evaluating the photonic Bragg sensor, the actual cell’s state of health can be concluded. In combination with the measurement of the current wavelength with respect to the initial wavelength, which is indicating the state of charge, a comprehensive optical status analysis of the battery can be performed. By using the equation:
for the present cell type, the residual discharge capacity
C can be logarithmically approximated from the measured wavelength difference Δλ of a full cycle. The findings now have to be verified in long-term studies, in order to be able to investigate a possible influence of the glass fiber inside the active material with enduring cyclization as well as potential detachment processes. In the next section, the potential of anode sensors for detecting safety-critical states of lithium ion batteries is examined.
2.4. Abuse Testing with Optical Anode Active Material Monitoring and Post-Mortem Analysis
After electrical cyclization, both a destructive abuse test as well as a material analysis of the cell interior under a protective gas atmosphere is performed. For the two investigations, two identical experimental cells are manufactured and subjected to the charging and discharging process previously presented. With the first sample, the overcharge experiment, whose course is plotted in
Figure 5 (
Figure 5a: Overcharge;
Figure 5b: Destruction), is conducted.
The ambient temperature during the test is 9.0 °C. To achieve a reproducible state of charge, defined as initial state, the cell is discharged at a current of 10 A at 2C with respect to the original initial capacitance, until reaching a voltage level of 3.0 V. Immediately after the start of the discharge, the voltage drops from 4.1 V to 3.4 V and then continues to fall almost linearly to the discharge end voltage. Due to the deintercalation of lithium ions from the anode, a shrinkage process begins, which can be tracked by the reflection signal of the integrated core Bragg grating. During discharge, the center wavelength of the Bragg reflection shifts by −50 pm, taking into account that the generation of heat loss has an opposite disturbing influence. On the one hand, the wavelength of the signal increases with an increase in temperature, and on the other hand, a higher temperature leads to a material expansion, which in turn directly affects the strain signal. In order to have available temperature information, another optical sensor is attached to the cell surface, which is not mechanically coupled and therefore only sensitive to temperature influences. The optical signal converted into temperature information [
19] indicates a discharge-induced cell temperature increase from 12.0 °C to 15.5 °C. Subsequently, the procedure is interrupted for a rest period of 30 min. The cell voltage again relaxes during this time to a value of 3.75 V and the surface temperature drops to 11.0 °C. Meanwhile, the central wavelength of the signal reflection, originating from the core Bragg grating, further decreases by 50 pm, indicating a direct as well as indirect temperature-influenced wavelength shift for the sensor element of 11 pm/K, since no intercalation-induced extension or compression of the electrode during resting is expected. At approximately the same temperature, the discharge leads to a wavelength reduction of 100 pm, which corresponds to a shrinkage in the longitudinal direction of the glass fiber of 67 µm/m at a sensor Bragg wavelength of 850 nm [
19].
Thereafter, the overcharge with high current charge abuse is carried out at a current rate of 4C, which corresponds to a charging current of 20 A. Also, for a period of 30 min, the voltage rises linear up to a value of 5.3 V. The outer surface temperature follows this trend and increases up to 19.0 °C. At the same time, the wavelength of the anode sensor rises by 300 pm. In comparison, at the end of the continuous cyclization process (see
Figure 3), a shift in wavelength of merely 75 pm between discharged and charged state is observed. This development is followed by a phase of constant cell voltage for about 10 minutes. The increase in temperature accelerates noticeably and reaches up to a value of 27.5 °C; the internal strain signal increases further by 300 pm. In the following segment, it can be seen that the cell voltage suddenly breaks down by about 0.5 V. Concurrently, the surface cell temperature drops by 4.0 °C. It is very likely that a decomposition process, for example of the electrolyte, which is strongly endothermic, sets in. In the internal strain measurement, this effect cannot be determined and the state monitoring signal continuously increases without interruption. The anode, therefore, does not seem to be affected by this specific degradation process. Subsequently, the voltage increases significantly from 4.9 V to 16.0 V in an exponential curve. For the overcharge test, an initial voltage limit of 16.0 V is specified on the charging unit. This is then gradually increased in the course of the experiment. The thermal runaway of the cell eventually takes place upon reaching a voltage level of 35.0 V. At the onset of the exponential voltage curve at experimental minute 110, the surface temperature also increases. However, it follows a logarithmic course and reaches the maximum at about 55.0 °C at experimental minute 132. The interim drops occurring thereafter are essentially due to the lower charge rate, which is caused as a result of the predetermined charging voltage limits. In contrast, the increase in the strain signal is particularly significant. Compared to the initial state, at the maximum point, a shift in wavelength of almost 2000 pm is detected, which corresponds to a considerable swelling of the electrode of approximately 3000 µm/m. After that, there is a break-off of the sensor signal, most likely due to the detachment of the glass fiber from the active material. As a result, only inconsistent values are output by the sensor.
Nevertheless, for the relevant measuring range, this experiment shows that safety-critical states, for example the overcharging of a battery cell, can be reliably detected using an integrated optical anode strain sensor. In the first charging and discharging cycle within the specification area (see
Figure 3), a maximum wavelength shift due to the anode expansion of 400 pm or 600 µm/m is measured. The highest measured value during the initial cycles can be set as a dynamic metrological threshold which decreases with decreasing capacity and outputs a status alarm to the higher-level monitoring system in the event of a malfunction. In the present case of the destructive testing, this would have reliably led to a timely shutdown of a defective charging process. In subsequent investigations, the long-term behavior of optical anode sensors in more cyclically stable cells must be further analyzed. This also implies to any impairment of cell capacity by the inserted foreign body, even though a negative influence cannot be determined in the present tests. On the second available previously cyclized cell, post-mortem analysis is performed to examine visual effects of the integrated glass fiber on the inner cell components. In
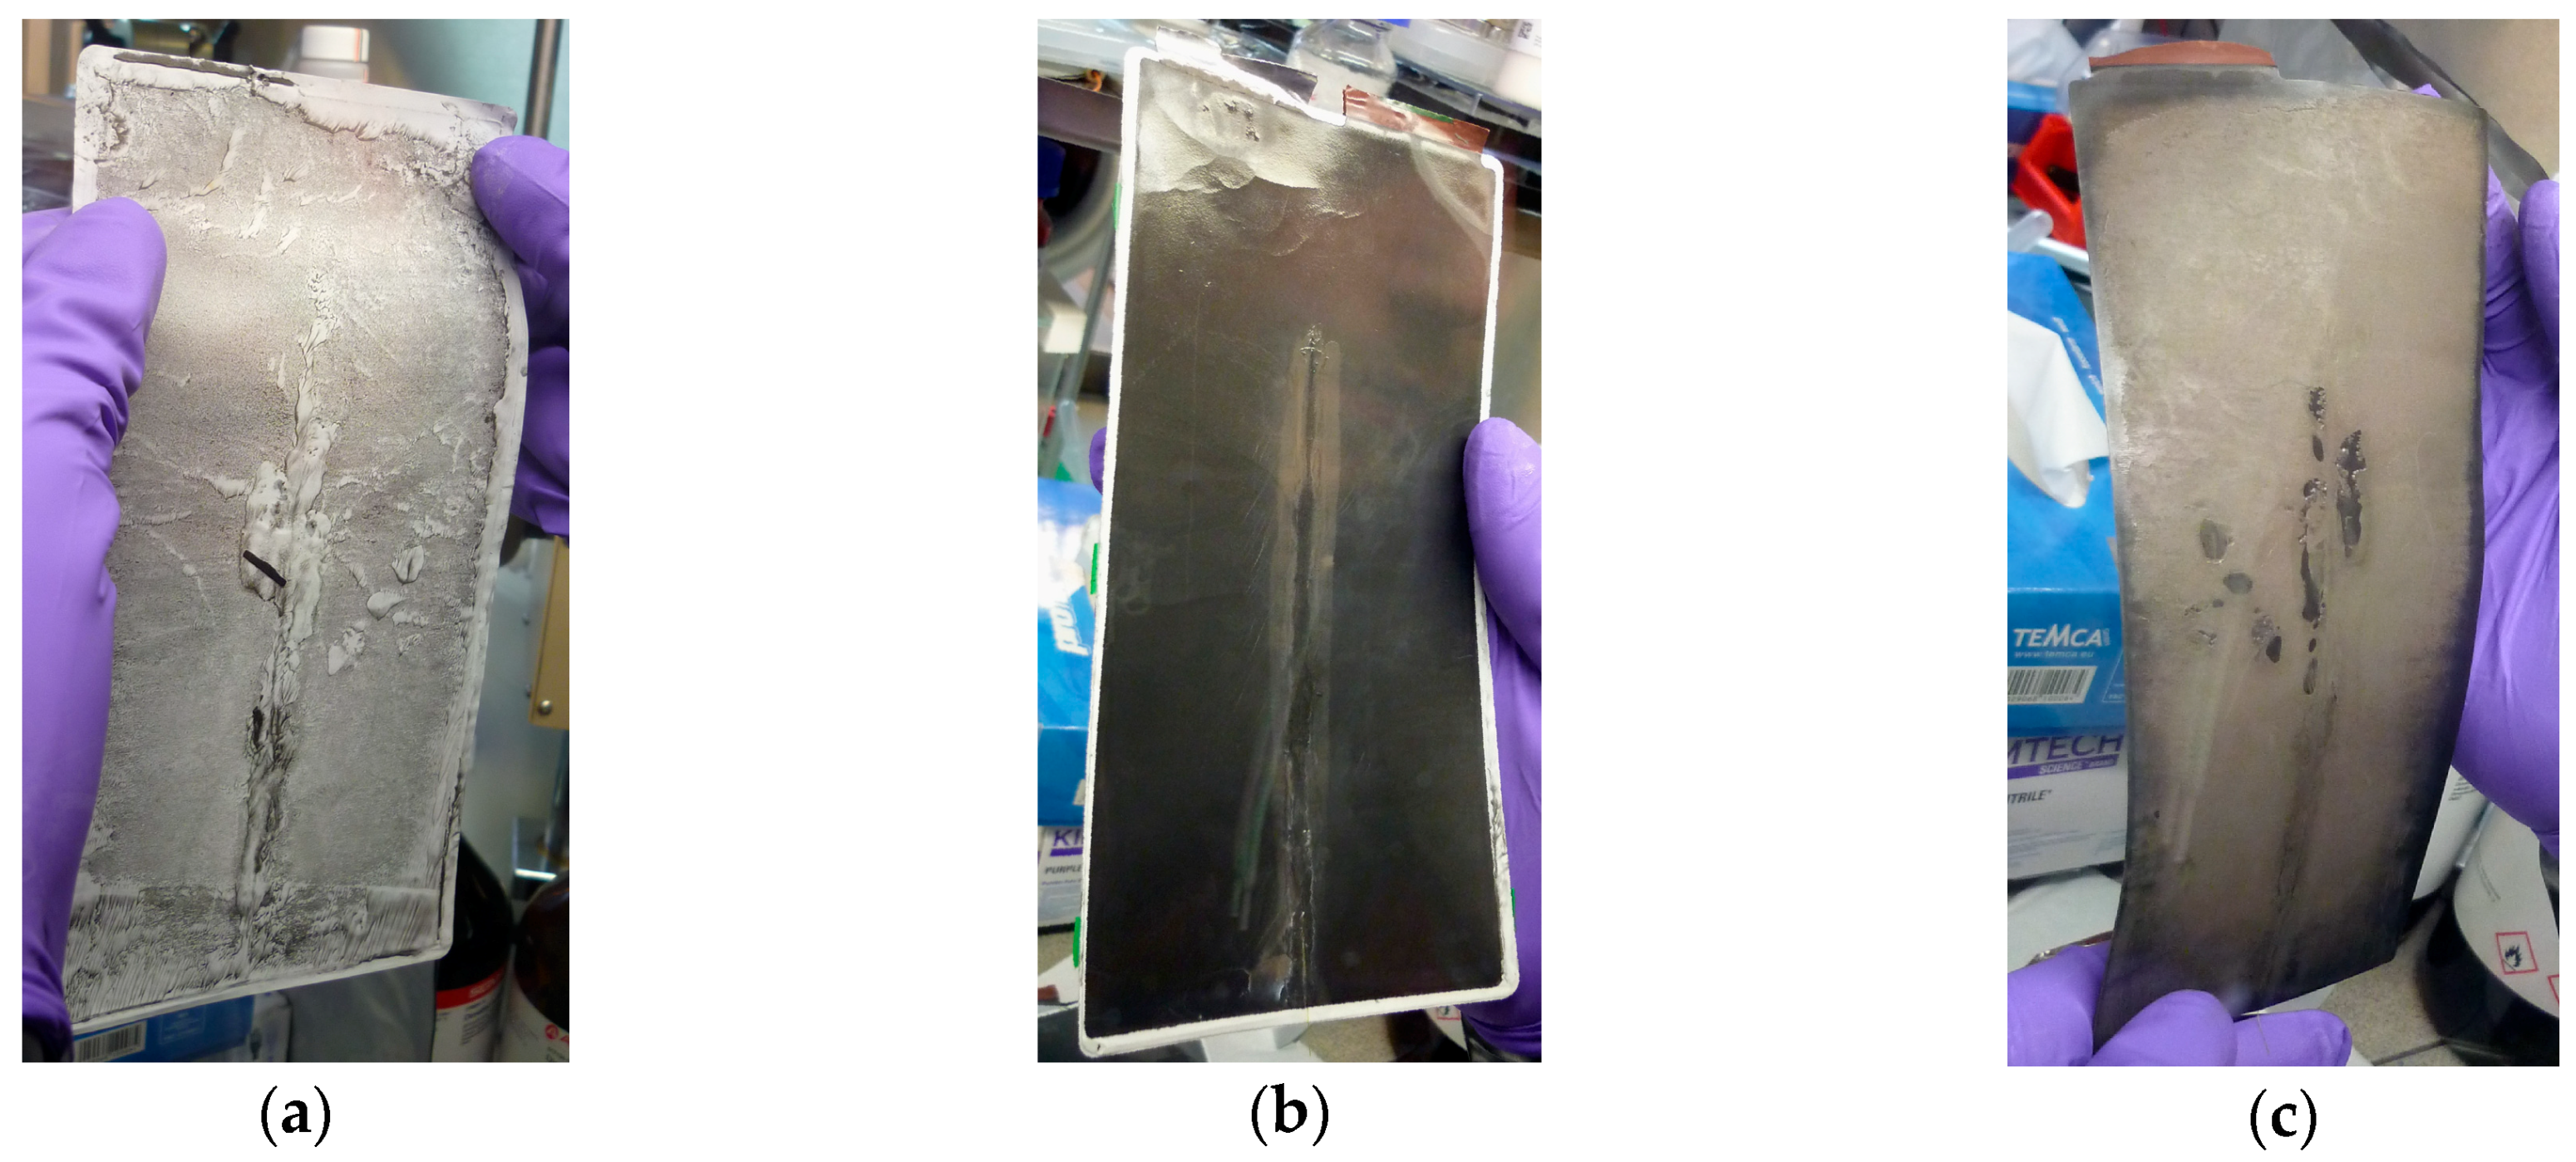
Figure 6, photographs of relevant adjacent surfaces are shown.
In order to better evaluate the impact and the reliability of the fiber sensor, the cell is opened at a state of charge of 100% inside a glovebox under protective argon atmosphere and a remaining water and oxygen content of less than 1 ppm. A visible influence on the surface can be realized on the separator as well as on the backside of the anode. However, comparative investigations do not show a measurable negative influence of the glass fiber on the cell performance, despite the slight recognizable imprints left on the cell components. On the anode surface, by the gray deposits around the sensor, lithium plating, which does not occur by cyclization but already by the fiber integration process, is identifiable. The thickness of the anode coating is slightly lower as a result of the sensor integration, which leads to lithium plating due to unequal proportions. Also on the backside of the anode, lithium plating takes place. This plating is in correlation with a lower thickness of the anode active material on that side.
The manufactured cells are experimental cells without a perfect match in proportions. These circumstances lead to a faster degradation of the samples, indicated by the recognized lithium plating and the relatively large fade in capacity during charging and discharging. Through further improvements in the cell design and a more accurate matching of the components, in future work more cycle-stable sensor-integrated battery cells can be manufactured, with which the influence and the measuring signal of the optical sensors will be examined over a sufficiently longer period of time. For the necessary development steps for the realization of a status monitoring with optical anode strain sensors, the basis is set with the results of this work.
3. Surface Cladding Waveguide Bragg Grating Sensors for Separator-Internal Status Monitoring
3.1. Manufacturing of Surface Cladding Waveguide Bragg Grating Sensors
In the second part of this work, the experimental investigations with the surface cladding waveguide Bragg grating, abbreviated hereafter as the surface Bragg grating, are presented. For this type of optical sensor, again the polyimide-coated single-mode glass fiber (Leoni SMF810-E5/125PI) is used, in which the sensor integration takes place by femtosecond laser technology utilizing the point-by-point inscription method. In order to guide the measuring light proportionally to the glass fiber edge, an additional waveguide has to be processed, which transmits the light out of the core to the glass surface. For this purpose, a sigmoid waveguide is inscribed into the fiber cladding, which runs tangentially parallel to the core at its beginning and parallel to the edge of the glass fiber at its end. During manufacturing, the fiber holding stage (PI N-565.260 linear translation stage) is traversing a three-dimensional trajectory at a speed of 0.25 mm/s, whereby the femtosecond laser emits 5000 pulses per second with a pulse energy of 50 nJ (Ophir PE9-ES-C). Through a total of 21 such movements in the offset shape of a conductor bundle [
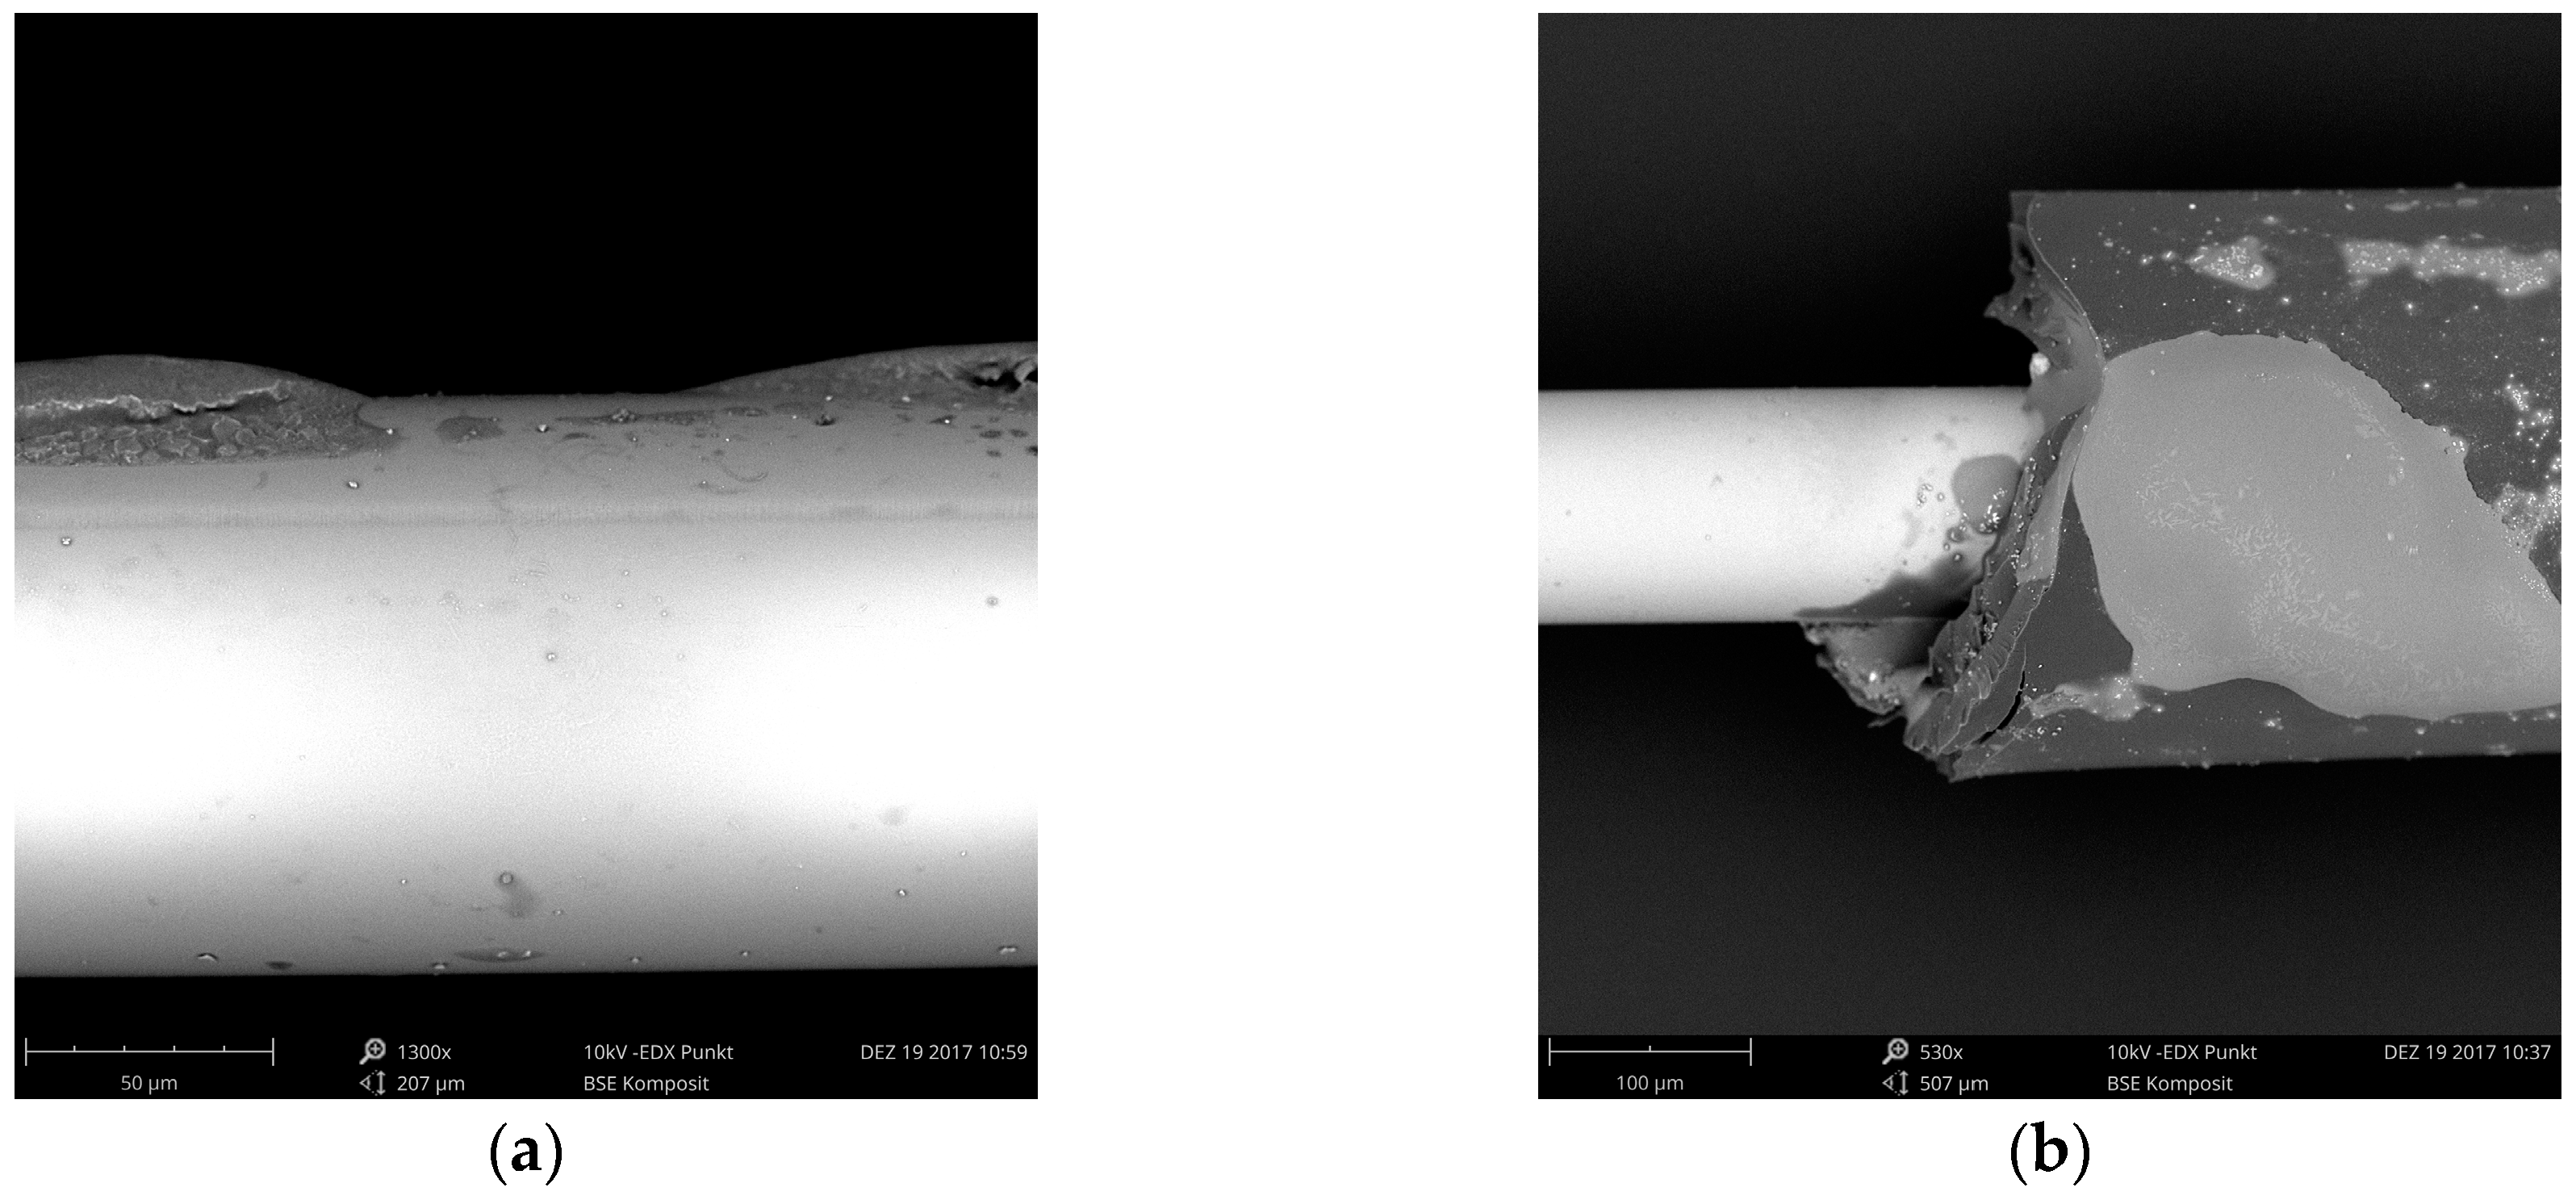
20] and the associated respective refractive index increase, an individually designed waveguide with a diameter of 5.6 µm is formed within the cladding material of the glass fiber. The rectilinear end section parallel to the glass edge region of the fiber is produced with a length of 2 mm. In the rear section with length of 1 mm, again a Bragg grating of the third order with 1200 refractive index variation points and a reflection wavelength of 825 nm is inscribed (surface Bragg grating). Due to the less ideal light guiding characteristics compared to the fiber core and the distribution of the light at the coupling point, the sensor reflectivity is lower for the same applied femtosecond laser parameters. At a pulse energy of 250 nJ, a reflectivity of 10% is achieved. In the next step, a core Bragg grating with the same properties is integrated into the laterally identical position in the fiber core. Only the pulse energy is reduced to 65 nJ, so that a target reflectivity of 3% is reached. In addition, the grating constant is adjusted to obtain a reflection wavelength of 829 nm, so that the surface Bragg grating can be distinguished from the compensating core Bragg grating using an optical spectrometer. For a refractive index-sensitive measurement, the surrounding fiber coating must be detached to expose the surface Bragg grating to ambient air. The removal of the polyimide layer is carried out by sulfuric acid etching with an acid concentration of 98% at 60.0 °C for 20 s. In
Figure 7, scanning electron microscope images of the uncoated sensor position are shown.
In order to increase the sensitivity of the surface Bragg sensor for refractive index variations, the exposed glass surface is gently etched. At an ambient temperature of 0.0 °C, the glass fiber is placed in hydrofluoric acid at a concentration of 8% for 85 minutes. As a result, the intensity of the external sensor drops by about two-thirds, so that both the core Bragg grating and the surface Bragg grating show a reflectivity of approximately 3%. With the optical compensation sensor manufactured in this manner, measurements in media with varying refractive index can henceforth be carried out. Therefore, in order to exclusively analyze this specific measurand, the wavelength shift of the core Bragg grating is subtracted from the total wavelength shift of the surface Bragg grating.
3.2. Refractive Index Measurements Inside Lithium Ion Battery Electrolyte
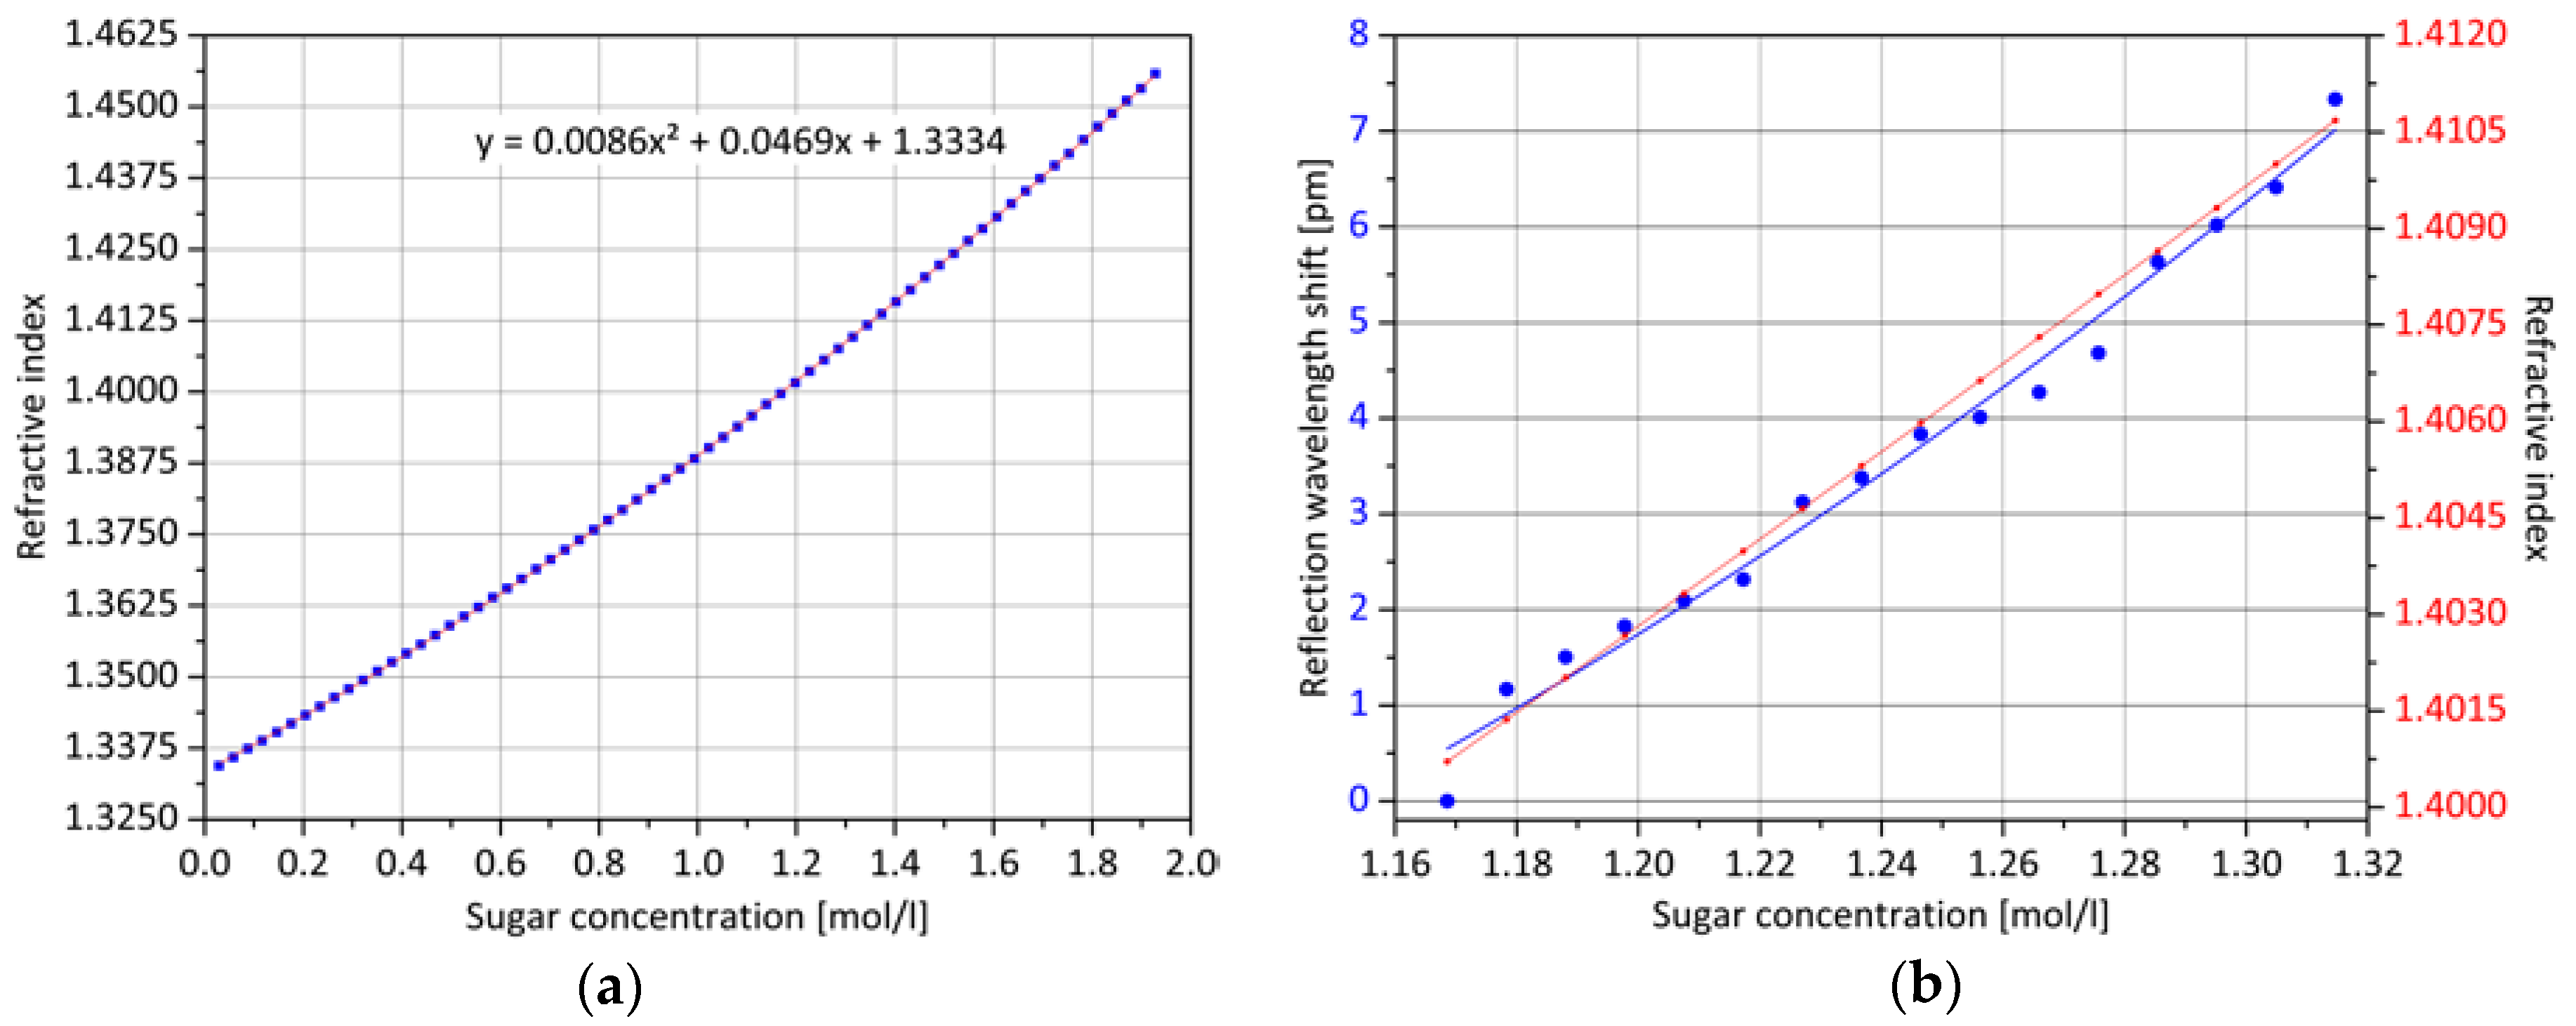
In the first step, at a constant temperature of 20.0 °C, a refractive index analysis of an aqueous solution with increasing sugar content is conducted. Up to a value of 1.9 mol/L, molar concentrations are measured equidistantly 68 times with an Abbe refractometer. The results, shown in
Figure 8a, are fitted by a second order polynomial. Secondly, in a concentration range between 1.16 mol/L and 1.32 mol/L, which is characteristic for subsequent experiments with regard to the expected reflection wavelength range of the optical sensors, 16 measurements with an equidistantly increasing concentration level are carried out with the previously manufactured sensor with integrated surface Bragg grating and compensating core Bragg grating. After each addition of sugar, the solution is stirred for 15 min in the beaker glass and the value recording begins after a waiting period of another 2 min. The result is shown in
Figure 8b. In order to achieve adequate long-term stabilization, for the optical measurement acquisition, a CCD spectrometer (BWTEK Exemplar) is equipped with a precise temperature controller and an internally developed active wave plate depolarization unit. In addition, the back-reflection signals of the Bragg gratings are fitted with a Gaussian curve and for each calculation of the central wavelengths, 200 values are averaged. Since the optical Bragg grating analysis is a relative measurement method, at least the start refractive index value must be known. Over the measuring range illustrated in
Figure 8b, a positive wavelength shift of approximately 7 pm is detected with a refractive index variation of slightly less than 0.01.
The recorded values follow the realistic course of the refractive index increase quite well. The exponential trend is more pronounced, but no measurement value discontinuity occurs. To compensate for any temperature changes, the wavelength shift of the core Bragg grating is subtracted from the total wavelength shift of the surface Bragg grating, taking into account the slightly offset wavelength of the two sensors. It is thus shown that the refractive index changes can be reliably determined by the use of surface Bragg gratings. The sensitivity of the sensor in the current development phase, however, does not meet the requirements of a practical application, since further cross influences would most likely have dominant effects on the signal. The medium to be measured reaches the grating structure only tangentially, so that the influence on the Bragg condition is only slight.
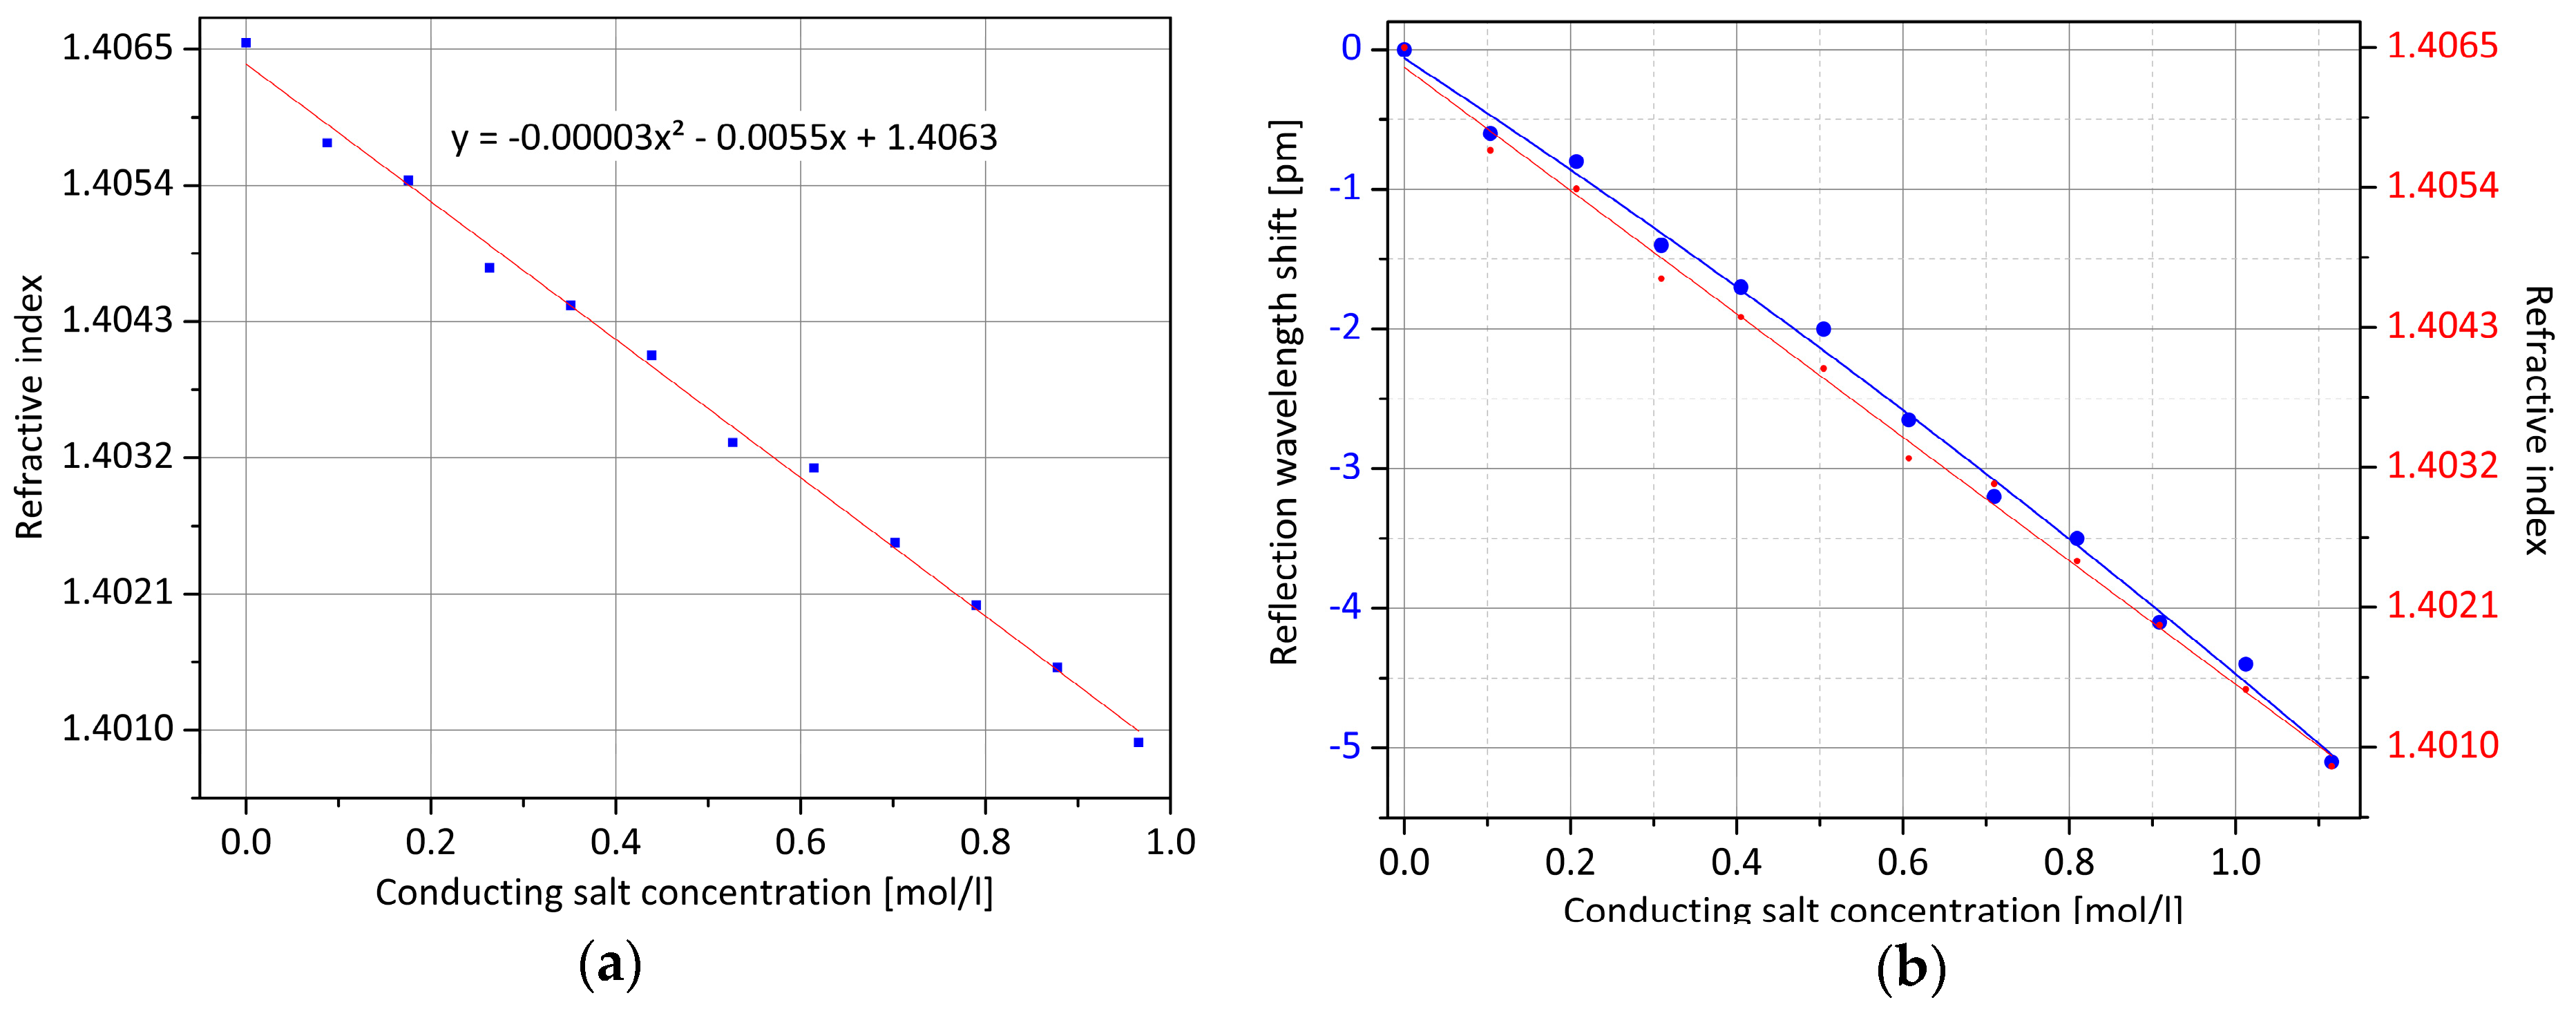
The same experiment is repeated with a typical lithium ion battery solvent combination of ethylene carbonate (EC) and diethyl carbonate (DEC) in equal proportions by volume. The measuring fluid has a constant temperature of 30.0 °C. By the addition of lithium hexafluorophosphate (LiPF
6) in 12 steps, the molar concentration of the electrolyte salt is increased to almost 1 mol/L, which corresponds to a common value for batteries of this type [
21]. For each step, again, the refractive index is determined with the refractometer, and from all measured values, the quadratic equation for the course is approximated, as shown in
Figure 9a. In the optical measurement, which is illustrated by
Figure 9b, a negative wavelength shift of approximately 5 pm is detected in a measuring range up to 1.1 mol/L.
The refractometer and the fiber-optical sensor measurements are mainly consistent for the investigated concentration range, the latter again showing a noticeably more exponential course. Thus, it is shown that the developed optical sensor with temperature compensation and external measurement point has the ability to measure refractive index changes within the battery electrolyte. However, for this experiment as well, it should be noted that the resulting wavelength shift is not sufficient for practical applications since the impact on the Bragg condition is only slight due to the tangential contacting of the surrounding substance. The primary goal of future development work will be, therefore, to increase the sensitivity and to reduce any disturbing influences while maintaining mechanical stability. Current research has shown that the etch rate of silica glass inside hydrofluoric acid increases significantly through femtosecond laser exposure [
22]. Due to a higher pulse energy input, just below the damage threshold, cone cavities form at the focus points of the laser, so that the surrounding medium can penetrate directly into the sensor location and an immediate interaction with the measuring light can be realized.
This work, however, is focusing on the further investigation of the developed novel optical sensor based on a surface Bragg grating, which in the next step is integrated between two separator layers of a lithium ion battery. In the subsequent cyclization, the characteristics of the sensor signal are examined.
3.3. Battery Manufacturing and Surface Cladding Waveguide Bragg Grating Sensor Integration
For the production of the cell, the same electrodes and electrolyte composition, as for the integrated core Bragg grating sensor described in
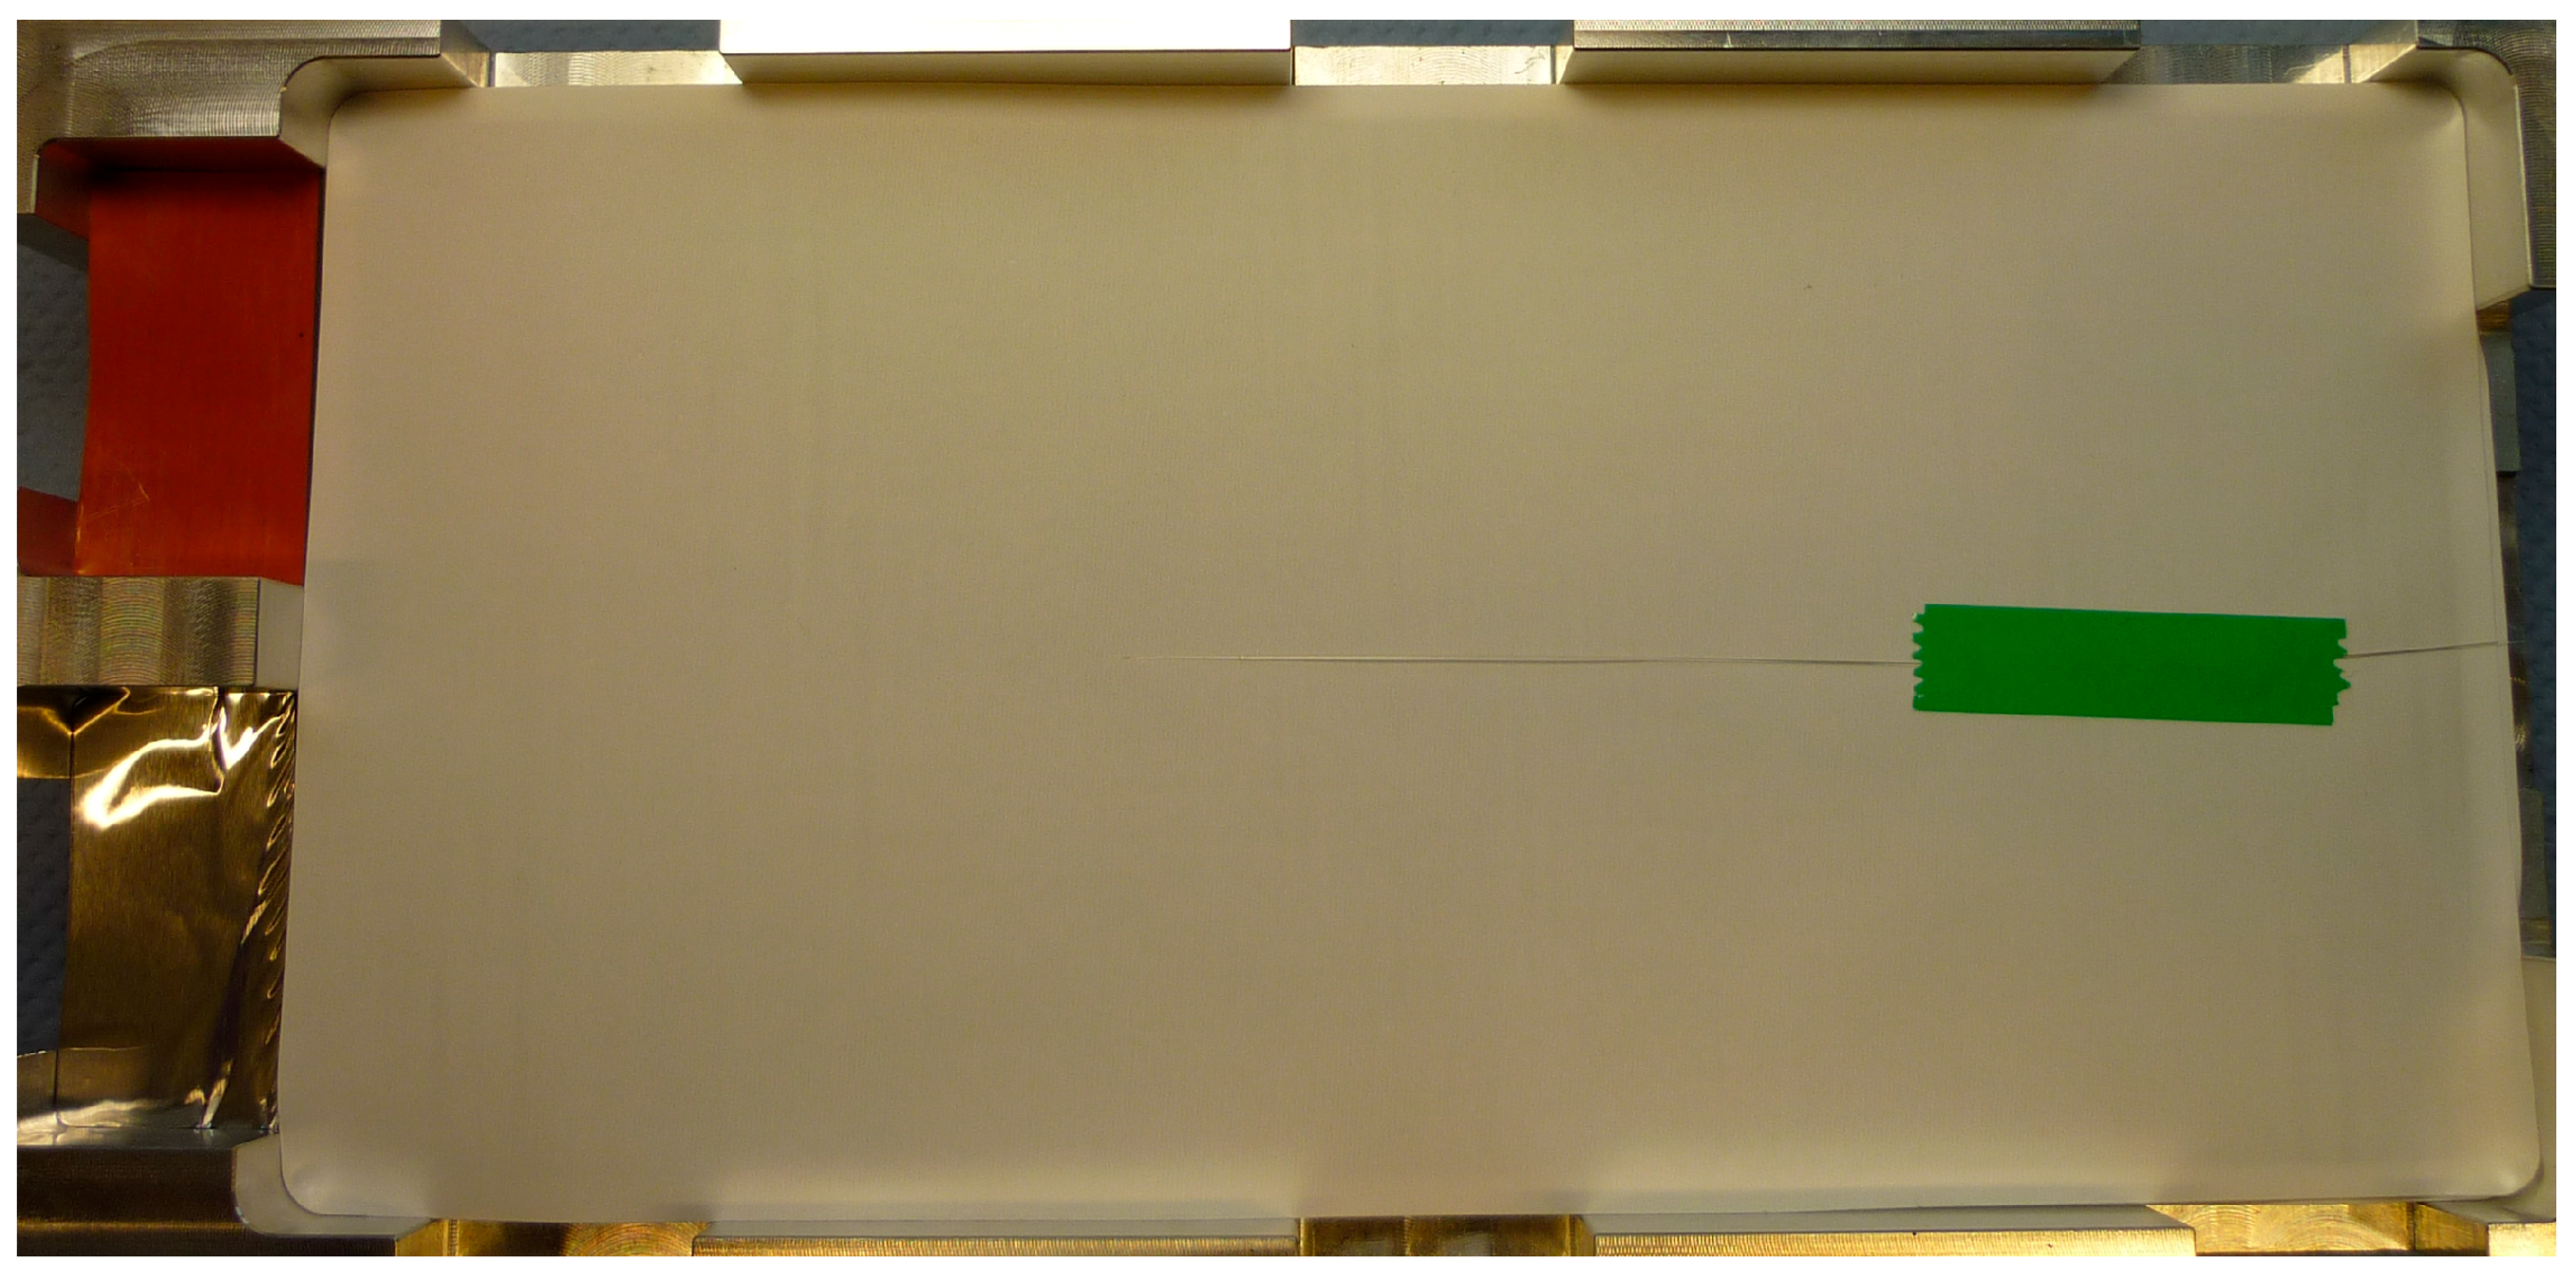
Section 2.2, are used. Again, four anodes and four cathodes are assembled into a stack, respectively. To measure the changes of the electrolyte, the cell is equipped with a double layer of separators, in which the glass fiber is inserted between. As shown in
Figure 10, the surface Bragg sensor is centered in the cell and can go into direct contact with the electrolyte.
In the same manner as in the previous experiment, the cell is filled with 25 ml of electrolyte solution (EC:DEC) and then welded under vacuum condition, taking the sealing of the glass fiber entry point into consideration. In the next step, the electrical examinations are carried out by evaluating the optical sensor signal.
3.4. Cell Formation and Cyclization with Optical Separator Monitoring
For the formation, the cell is cycled between 3.0 V and 4.2 V at a current rate of 0.2C. After forming the solid electrolyte interphase, the cell is cycled with 1C between 3.0 V and 4.2 V for 115 cycles inside a temperature chamber at 23.0 °C. In
Figure 11a, the result of the investigation is illustrated.
During the first six cycles after the formation, the surface Bragg sensor signal is very inconsistent, but becomes stable for the rest of the cyclization. At this point, it can be seen from the electrical values that the discharge capacity rises for some cycles after the initial loss. In this phase, the stabilized optical sensor signal shows variations of up to 350 pm. Both phenomena are most likely caused by an improving contact of the single cell layers and therefore indicate that the obtained optical wavelength shift is predominantly a result of diverse strain influences and not due to changes of the refractive index of the surrounding electrolyte. Although the optical sensor signal over 100 cycles tends to decrease with decreasing cell capacity, this behavior differs from the one obtained by the means of the anode-integrated sensor. It must be taken into account, that the surface Bragg grating is integrated between two separator layers and not incorporated into the anode slurry. Thus, there should be less influence by longitudinal strain of the active material.
At cycle 41 to 44, the capacity increases due to a failure of the temperature chamber, during which the temperature of the cell was equal to the room temperature of 28.0 °C, resulting in a temporally higher discharge capacity. However, it is found that different changes of the cell’s height along the fiber length can also result in slight bending of the fiber, which might result in either compression or stretch at the surface Bragg grating position. This behavior cannot be fully compensated by the core Bragg grating, since it is not sensitive to bending. With these results, the final surface Bragg grating sensor design is chosen to have an additional waveguide positioned in radial direction between the surface Bragg grating and the core Bragg grating position.
3.5. Cell Cylclization with a Self-Compensating Fiber-Optical Sensor
The enhanced photonic sensor with a novel design is schematically shown in
Figure 12. Besides the surface Bragg grating integrated into the outer cladding waveguide, the sensor consists of an additional inner cladding waveguide Bragg grating (in the following abbreviated as cladding Bragg grating), located at half the distance between the fiber core and the glass surface. With this position configuration of Bragg gratings, it is still possible to compensate influences due to strain in the longitudinal direction, since both gratings show the same measurement behavior. Furthermore, the wavelength changes due to influences of temperature can be compensated, because the sensor elements are positioned in proximity to each other. It should be noted, however, that the outer sensor’s wavelength shift is superimposed by a change of the refractive index of the surrounding medium, which can be caused, for example, by a change in temperature.
At a temperature increase of 1.0 K, the non-dimensional refractive index unit of a typical electrolyte solvent (EC:DEC) changes by approximately −0.4 × 10
−3 and therefore influences the wavelength shift in the range of −0.4 pm∙K
−1. In comparison with
Figure 9b, this results in a 5% lower temperature sensitivity of the surface Bragg grating with respect to the cladding Bragg grating. Wavelength changes due to bending of the sensor can be easily compensated with knowledge of the sensor element distances to the neutral axis which is unaffected by bending. For the presented sensor design, the outer Bragg grating has twice the bending sensitivity of the inner Bragg grating. With this understanding, the remaining variable of the measurement is the influence of the effective refractive index, which proportionally shifts the reflected Bragg wavelength. For detailed analysis of the experimental results, in
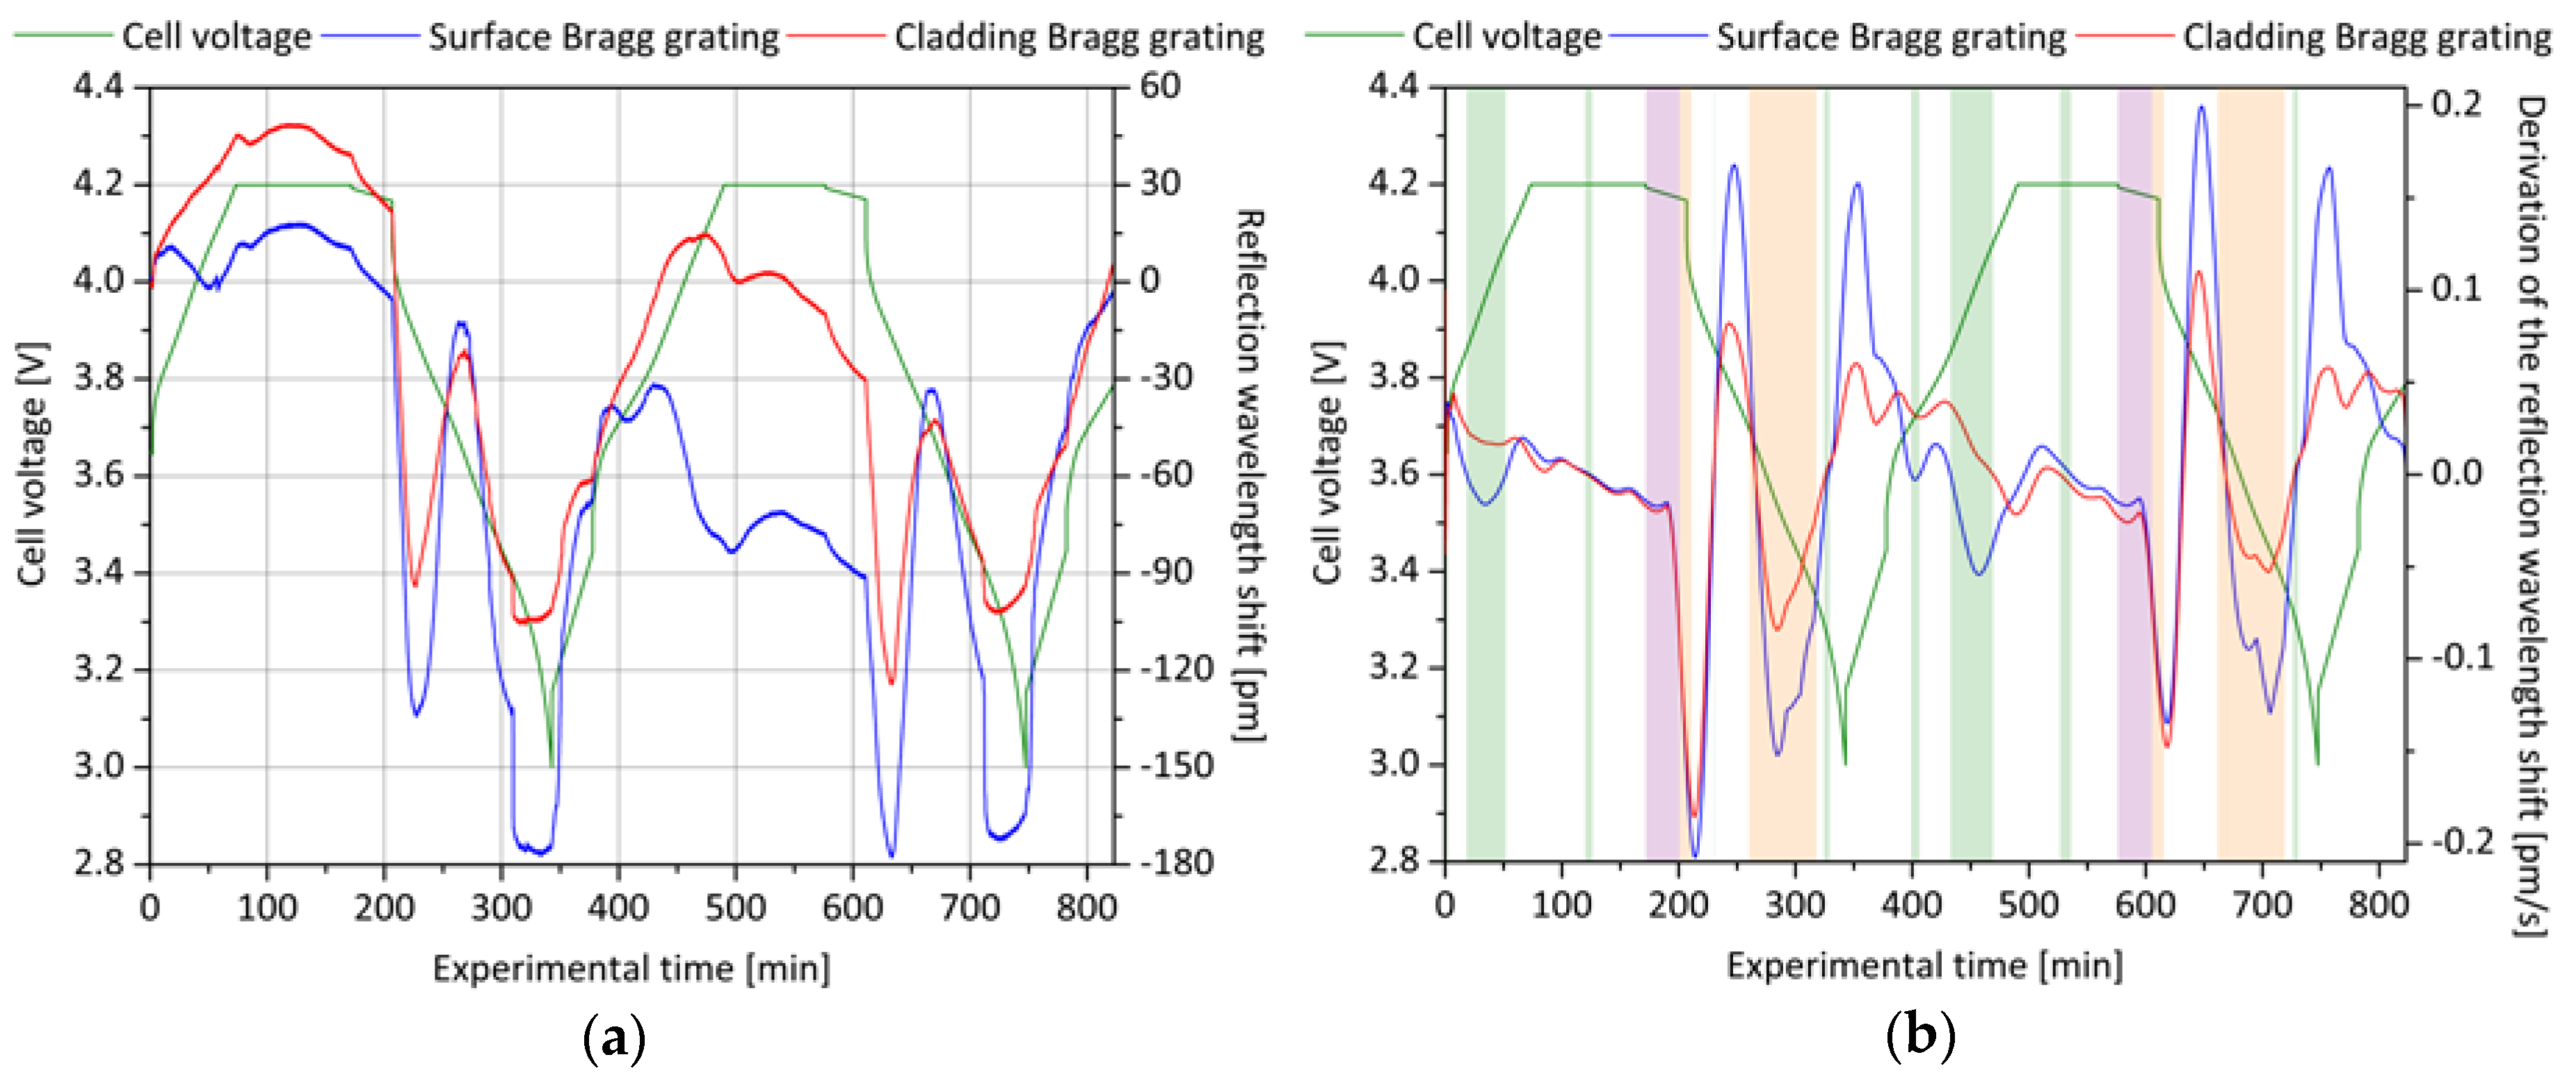
Figure 13a, two exemplary cycles are shown.
The sensor again is inserted between two separator layers of a 5 Ah lithium ion battery and standard cyclization with a current rate of 0.5C is performed, starting with a state of charge of 30%. It can be seen that the two sensor element signals are performing qualitatively equal during most of the experimental time but repetitively different at particular cell voltages. In order to discuss these specific characteristics properly, the differential courses of the optical signals are shown in
Figure 13b and sections of notably higher interest are highlighted.
The parts marked in violet label the resting times after a full charge of the cell. During this time, the cell relaxes and the sensor signals are predominately influenced by a lowering cell temperature. As previously mentioned, the surface Bragg grating is expected to decrease its reflected wavelength by only 95% of the cladding Bragg grating’s value. For the first rest time, this value can be determined to approximately 92% and 80% for the second rest time, respectively. This is in good accordance with the expected behavior, showing that the surface Bragg sensor element is influenced by the refractive index of the surrounding electrolyte.
The parts marked in orange are of particular interest, since during these phases, for both Bragg gratings, a large reduction of the reflection wavelength occurs. Within the first period, after the start of the discharge, both wavelengths drop almost equally by a magnitude of around 120 pm for the first shown electric cycle (experiment minute 210) and 90 pm for the second one (experiment minute 615), respectively. Because of the equal behavior, this reduction is first and foremost influenced by a shrinkage of the cell’s anode as it is observed in the same manner for the anode sensor. During the continuing discharge, the reflected sensor wavelength increases intermittently, as can be seen in
Figure 13a (experiment minute 230 as well as 640). By a factor of approximately 1.6 for the first and 1.7 for the second discharge cycle, the signal of the surface Bragg sensor element rises stronger than the one of the cladding Bragg sensor element. Consecutively, a reduction of the wavelengths can be observed and again, the surface Bragg grating’s decrease is 1.6 times higher for the first and approximately 2.0 times higher for the second discharge cycle than the decrease of the cladding Bragg grating. For this reason, it is obvious that the grating signals are affected by a superimposition of longitudinal compression and additional bending in both directions. However, the sudden drops of the wavelengths at the end of each discharge cycle (experiment minute 310 and 715) cannot be explained sufficiently. At this point, a faulty data acquisition is excluded due to the sensor redundancy.
The experiment phases marked in green represent characteristic parts of the charging process and identify the sections during which the surface Bragg sensor element and the cladding Bragg sensor element show wavelength changes in opposite directions. Because none of the aforementioned phenomena can explain this differential course, there is a strong indication that the signal is dominantly influenced by the effective refractive index of the surrounding electrolyte. Since the attenuation of the surface Bragg grating is too large to result from changes of the conductive salt of the electrolyte, as evident in
Figure 9b, the findings have to be subject to further investigations and are not fully understood yet. Nevertheless, the results demonstrate the potential of internal cell sensing with sophisticated optical sensors. Besides the necessary increase in sensitivity for refractive index changes mentioned in the previous section, an additional core Bragg grating is useful for the signal separation of temperature and strain or bending. A simultaneous readout with integrative analysis of the core Bragg grating, cladding Bragg grating and surface Bragg grating should therefore be the target for future development steps. In order to investigate not only the cyclization behavior but also the measured value characteristics in an abuse test scenario, in the next section, an overcharging experiment with a lithium ion battery cell with an integrated surface Bragg sensor element is performed.
3.6. Abuse Testing with Optical Separator Monitoring and Post-Mortem Analysis
In accordance with
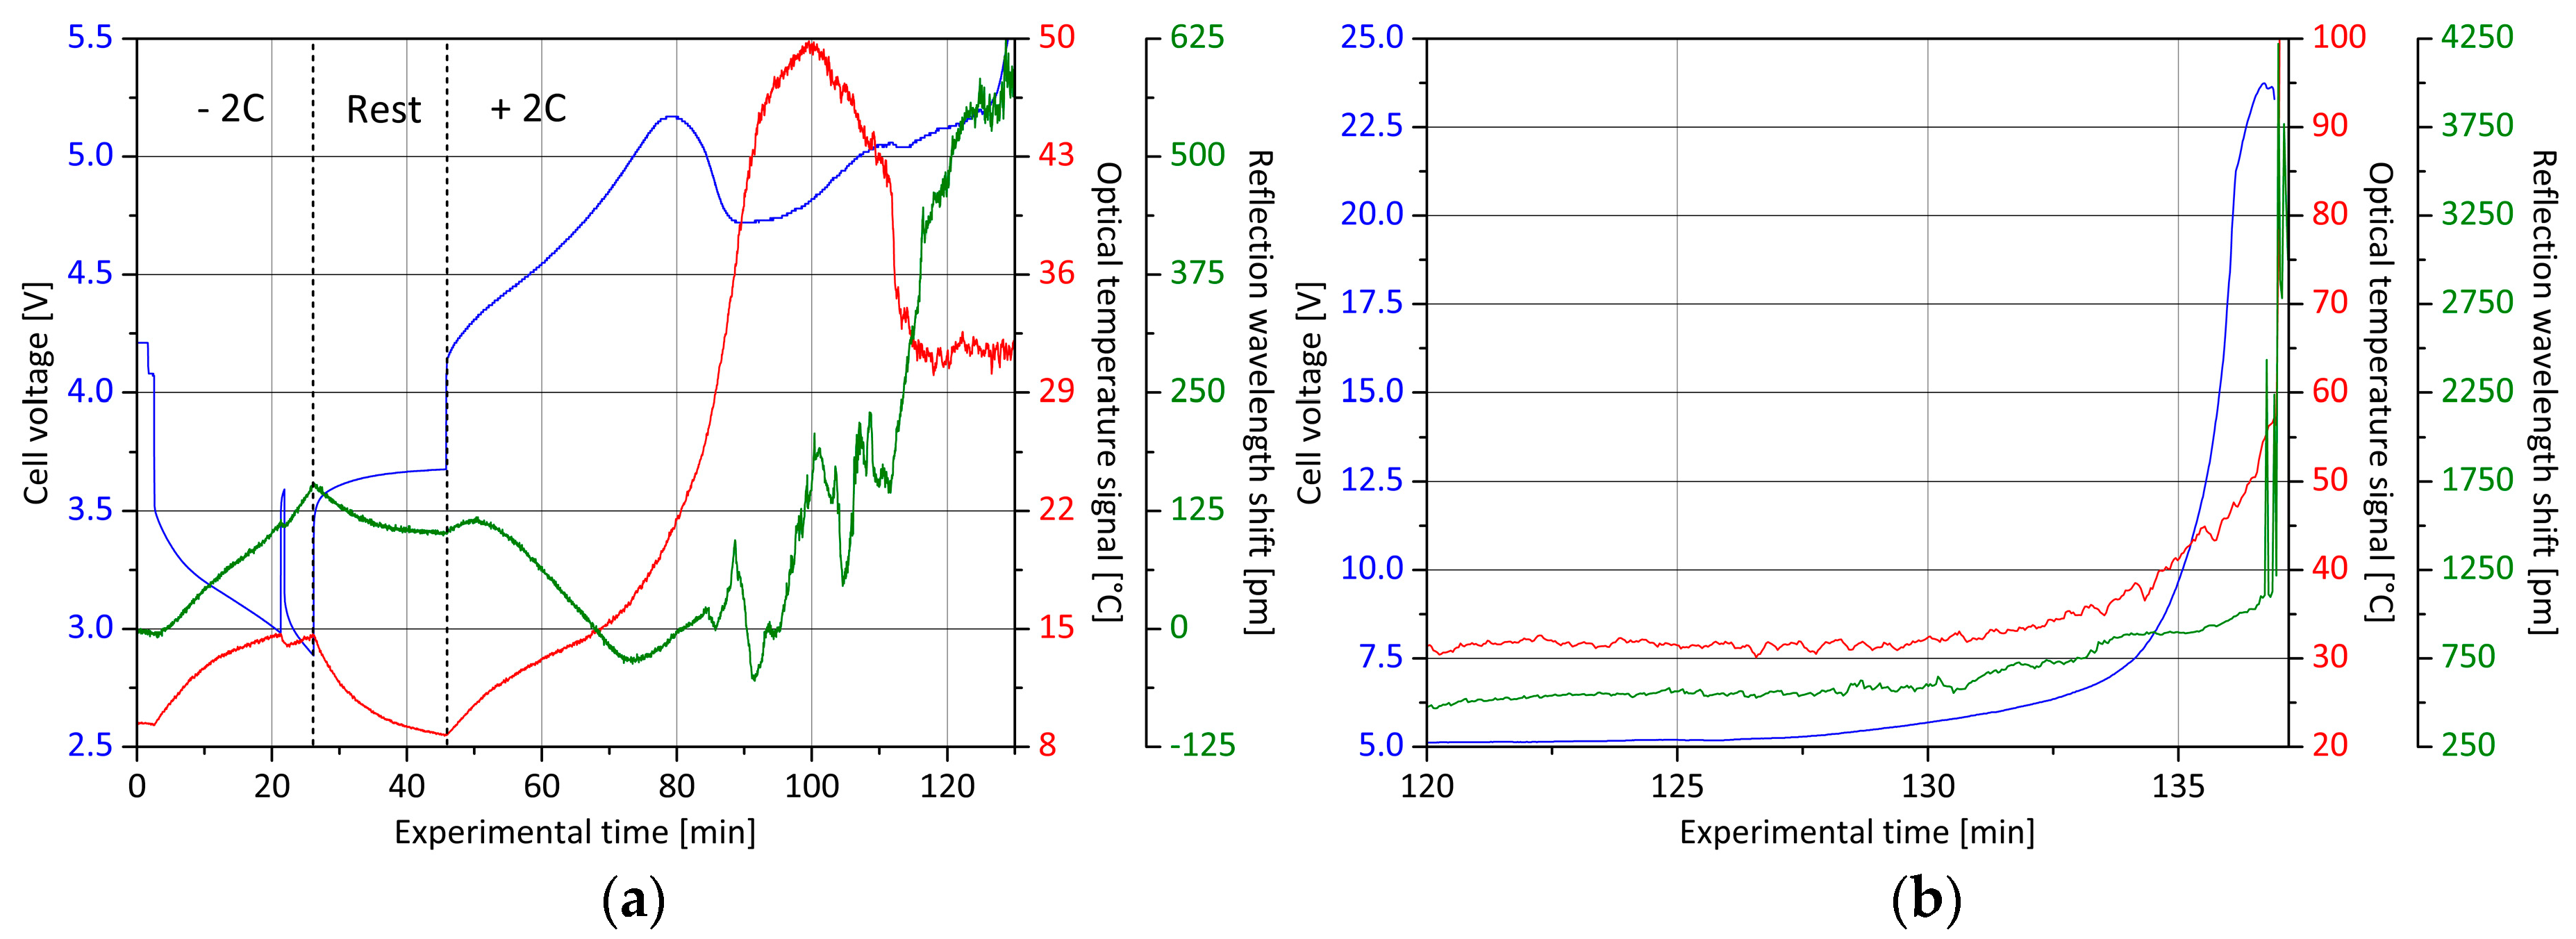
Section 2.4, a destructive overcharge test as well as a post-mortem examination of the internal cell components is also performed with the optical surface sensor element. In the first part, it is again the goal to recognize safety-critical states in a timely and reliable manner. At the beginning of the experiment, at an ambient temperature of 8.0 °C, the cell is discharged at 10 A to a voltage level of 3.0 V, which corresponds to a discharge rate at an initial capacity of 5 Ah of 2C. The discharge is then interrupted at experimental minute 21 and continues for a short time until reaching 2.9 V. In such a way, for rapid electrical state changes, the different performance characteristics of the external optical temperature sensor and the internal separator sensor should be compared. With the aid of
Figure 14, the course of the experiment can be retraced. It is noticeable that the cell surface temperature in the first discharge step rises from 10.0 °C to 15.0 °C and drops immediately during the interruption phase. In contrast, the center wavelength of the Bragg reflection of the inner surface grating increases by 125 pm but does not drop with charge interruption. It remains at a constant level and then continues to rise to a value of 150 pm at the end of the discharge cycle. These measured values represent a superposition of two influencing factors. On the one hand, this is the thermal aspect as a result of heat loss, and on the other hand, actual surrounding condition changes at the site of the separator. Inside the cell, the temperature remains rather constant over a short period of time due to the higher heat capacity [
23,
24], which is why no deviation of the measured value is to be expected for the time frame of the discharge interruption. The internal optical signal is not temperature-compensated in the present case, since during the overcharge test an inner cell’s temperature information from the reaction site is desired. A change in the refractive index, for example, cannot be evaluated separately due to strong mechanical and thermal variations.
After the end of discharge, the cell voltage homogenizes during the rest phase to a value of 3.7 V. Simultaneously, the surface temperature drops from 15.0 °C to 9.0 °C and the internally measured optical signal decreases substantially due to temperature, by about 60 pm. At the onset of the overcharging at a current rate of 10 A, the cell voltage jumps to 4.2 V and then increases mostly linearly to a value of 5.2 V. Additionally, the cell surface temperature follows approximately a linear course and rises to 21.0 °C. Contrary to this trend, the signal of the status monitoring sensor inside the separator shows a negative shift of the reflection wavelength by 125 pm during the considered time period. The brief increases at the beginning and end of this period are again temperature-related. However, the course is not dominated by the influence of temperature, and in addition, changes in chemical composition would not contribute to a signal variation to that extent. Hence, separator deforming mechanical stresses superpose the state information in the relevant phase and are thus signal-determining. The distinctive measurement reading occurs substantially before the externally perceptible cell deformation (see video file enclosed in the
Supplementary Material) and can therefore provide important information about the cell’s state of health.
At experimental minute 80, the cell voltage value breaks down to 4.7 V and subsequently rises over a time frame of 45 minutes in a steady exponential curve until thermal runaway. The externally measured temperature rises rapidly during the voltage drop from 22.0 °C to 50.0 °C, then falls back to 32.0 °C and remains at this level until shortly before destruction. In the same time period, there is an initial detachment of the separator sensor, which in succession no longer delivers a clear measuring signal. The only distinctive feature is the signal increase of 450 pm, at experimental minute 110, which occurs exactly at the moment of the converse surface temperature drop. Subsequently, both measured variables follow a similar course. With the detailed analysis of this measurement, it is shown that the fiber-optical surface Bragg sensor element inside the separator cannot yet be used under real test conditions at its current level of development to yield reliable cell state information. Signal peculiarities and characteristics can, however, be determined in the courses of the values and must be verified in a following series of experiments. In particular, the noticeable cross-sensitivity to mechanical cell-internal deformations currently complicates a clear interpretation of cell states. Analogous to
Section 2.4, a post-mortem analysis is also performed with a second, by cyclization, pre-aged separator-monitored battery cell. In
Figure 15, the examination results are shown.
The cell is again opened at a state of charge of 100% in order to be able to investigate the influence of the glass fiber sensor especially on the surface of the anode. The print of the fiber is identifiable on the anode as well as on the cathode. The anode active material has a clear golden coloration, which is correlated to a fully lithiated electrode. Only in the direct position range of the glass fiber the dark color remains dominant, indicating a lower lithiation. Despite these differences, however, no measureable negative influence on the electrical performance of the cell can be determined. As discussed in the previous chapter, through an improved long-term stability of manufactured cells, a more comprehensive investigation will be accomplished. In addition to the utilization of both a position and temperature compensated optical sensor, furthermore, for example by welding the glass fiber on two battery cell sides, as performed in [
13], a more durable fixation of the fiber on the separator is to be achieved in order to realize reliable measurements outside the laboratory environment.
4. Summary and Outlook
For this scientific work, two different fiber-optical sensors for a cell-internal status monitoring of lithium ion batteries were developed. First, it was demonstrated how a core Bragg grating in a standard telecommunication glass fiber integrated into the anode active material can be utilized to measure the expansion of electrodes and temperature variations directly on the reaction site. Both the state of charge and the state of health indicating capacity loss during long-term cyclization were correlated with the absolute reflection wavelength shift of the optical sensor between the end of the charge and discharge step of each cycle. It was also shown that the electrically inert glass fiber has no influence on the cyclization behavior of the cell during the investigated period of time and that no electrolyte leakage appeared at the battery case composite material’s lead-through point for the optical waveguide.
In the second step, a fiber-optical surface Bragg grating sensor element was developed to measure possible mass composition changes of the electrolyte that directly affect its refractive index. In addition, a temperature-compensating core Bragg grating was integrated into the light-guiding glass fiber. For the proof of concept, tests were initially carried out in pure electrolyte. The sensor was put into a typical lithium ion battery solvent combination of ethylene carbonate (EC) and diethyl carbonate (DEC) in equal proportions by volume and lithium hexafluorophosphate (LiPF6) as conductive salt was then added step-by-step. The received optical signals correlated with the solvent concentration and the redundantly measured refractive index. Thus, it was proven that the developed photonic sensor with temperature compensation and external measuring point has the ability to determine refractive index changes within the battery electrolyte. Subsequently, the surface Bragg grating sensor was integrated into a lithium ion battery. The separator functioned as a mounting component, which was built in a double layer design, so that the glass fiber positioned between is permanently surrounded with electrolyte. The electrical cyclization revealed that the sensor signal is most notably dominated by bending influences caused by the charging and discharging processes. In principle, with the core Bragg grating, in addition to the temperature, expansions can also be compensated, but only those occurring in the longitudinal axis. For this reason, a sensor was manufactured in which the compensation grating is not located in the core, but in the glass cladding of the fiber axially centered to the edge (cladding Bragg grating). As a result, bending-related signal variations, and in addition, refractive index dominated wavelength shifts could be detected. Nevertheless, the signal change capability by the state variables strain and temperature is higher than that by the refractive index, and therefore, a clear measured value separation cannot be adequately performed. According to this, in the next development step, the sensitivity of the surface Bragg grating sensor for refractive index changes must be increased. This is to be achieved by a specific etching of the Bragg grating points, so that the surrounding medium is not only touched tangentially.
As a part of this work, abuse tests were also performed with both sensor types, and it was thereby possible to detect the occurring thermal runaway in an early stage in which the cell temperature still showed no abnormality. The internal sensors, but especially the anode sensor, delivered an above-average signal increase or a conspicuous course, with which dangerous situations could have been identified though a metrological threshold raising an alarm in the event of a malfunction. As a last test, the cells were post-mortem analyzed to investigate if the integrated optical sensors have an apparent influence on the cell components. Marks of the glass fiber and slight deviations in the lithium intercalation were recognized on the respective adjacent electrodes; however, the optical sensor did not measurably affect the electrical performance. The lithium ion battery cells used are laboratory cells whose cyclization stability is not sufficient for a long-term examination. For this reason, the photonic anode sensor and the terms of its sensitivity enhanced electrolyte sensor will be integrated in the next step into battery cells with optimized matching components to implement an accurate analysis of the different degradation mechanisms.

 ,
, 


