Article

Eco-Efficiency of a Lithium-Ion Battery for Electric Vehicles: Influence of Manufacturing Country and Commodity Prices on GHG Emissions and Costs

1
ETEC Department, Vrije Universiteit Brussel (VUB), 1050 Brussel, Belgium
2
Flanders Make, 3001 Heverlee, Belgium
3
CIDETEC, Po. Miramón 196, 20014 Donostia-San Sebastián, Spain
*
Author to whom correspondence should be addressed.
Batteries 2019, 5(1), 23; https://doi.org/10.3390/batteries5010023
Submission received: 14 January 2019 / Revised: 11 February 2019 / Accepted: 14 February 2019 / Published: 19 February 2019
(This article belongs to the Special Issue Sustainable Lithium Ion Batteries: From Production to Recycling)

Abstract

:
Lithium-ion battery packs inside electric vehicles represents a high share of the final price. Nevertheless, with technology advances and the growth of the market, the price of the battery is getting more competitive. The greenhouse gas emissions and the battery cost have been studied previously, but coherent boundaries between environmental and economic assessments are needed to assess the eco-efficiency of batteries. In this research, a detailed study is presented, providing an environmental and economic assessment of the manufacturing of one specific lithium-ion battery chemistry. The relevance of parameters is pointed out, including the manufacturing place, the production volume, the commodity prices, and the energy density. The inventory is obtained by dismantling commercial cells. The correlation between the battery cost and the commodity price is much lower than the correlation between the battery cost and the production volume. The developed life cycle assessment concludes that the electricity mix that is used to power the battery factory is a key parameter for the impact of the battery manufacturing on climate change. To improve the battery manufacturing eco-efficiency, a high production capacity and an electricity mix with low carbon intensity are suggested. Optimizing the process by reducing the electricity consumption during the manufacturing is also suggested, and combined with higher pack energy density, the impact on climate change of the pack manufacturing is as low as 39.5 kg CO2 eq/kWh.

Graphical Abstract

1. Introduction

Up to now, more than four million EVs (electric vehicles) have been sold (cumulative sales) [1]. China in particular is pushing electric mobility, resulting in a fast growth of the market. Since the beginning of its commercialization, the cost of a battery has been gradually decreasing [2]. Recent studies have shown that the share of the battery cost inside an EV application is projected to decrease from almost half of the cost of the vehicle in 2016 to less than 20% in 2030 [3]. Moreover, the introduction of EVs on the market is raising questions regarding the battery cost and its impact on CC (climate change) [2,4]. As a reference, battery cost should decrease below 100 $/kWh for BEVs (battery electric vehicles) to be cost-competitive with ICEVs (internal combustion engine vehicles) [3].
In order to understand the current situation, some key factors need to be introduced. The installed lithium-ion battery (LIB) manufacturing capacity in the world was 103.7 GWh at the beginning of 2017, which is more than the annual new EV sales [5]. New battery plants are still under construction or announced, reaching a total capacity of around 273 GWh by 2021. Today, Asian countries are the main battery-manufacturing countries (China 49.68 GWh, Japan, 13.623 GWh, Korea 6.570 GWh in 2016 [6]). However, they are not the only investing countries; other countries are making an effort to be more and more present in the market, this is the case of the USA (with Tesla Gigafactory), Germany (16.7 GWh), Sweden (8.1 GWh), Poland (5 GWh) and France (1.1 GWh) in 2017 [7]. Accordingly, this increase in the production capacity, and its embedded scale-up economy, seem to enable the decrease of the battery cost [8,9]. As a matter of fact, Brodd and Helou [10] proved that the manufacturing cost of a cell in the United States (USA) and in China is comparable, but they did not study a full battery pack or any European countries. In addition, Ambrose et al. [11] underlined that higher production greenhouse gas (GHG) emissions are correlated with more carbon-intensive electricity for cell manufacturing. Our first objectives are to assess the influence of the manufacturing location and the production volume on the battery manufacturing cost and the GHG emissions.
Eco-efficiency can be understood as a simultaneous study of economic and environmental impacts. Eco-efficiency is a tool that allows focusing on the environmental benefits of a product or a service by avoiding potential trade-offs between environmental and economic performances. This tool can be used as a decision support tool to compare strategies to minimize the ecological impacts while maximizing the economic performances. Different metrics can be used to measure environmental and economic impacts. Coherent boundaries between environmental and economic assessment are needed in order to assess the eco-efficiency of batteries. The chosen cell for the study is a high energy density (250 Wh/kg) Samsung cell that for anode contains graphite with a low content of silicon, and for cathode contains NCA (lithium nickel cobalt aluminium oxide: LiNi0.8Co0.15Al0.05O2) as an active material. NCA is the most used chemistry on the market today [12]. For NCA batteries, studies assess the environmental impacts [11,13,14] or costs [15,16].
In this regard, there are two main objectives in this paper. Firstly, we aim to assess the influence of the manufacturing location and production volume on the battery manufacturing cost and the GHG emissions. The price and availability of lithium are often questioned when evaluating the future of LIBs [17,18]. The availability of lithium may not be a problem for the EV market [19] and the lithium cost is unlikely to influence cell cost [20], but this also has to be evaluated for other materials, such as cobalt and nickel. These two materials are expensive, and their price can be very volatile. They are mainly present in the cathode active material, which is known to be the most expensive cell component [9]. Moreover, cobalt is considered to be a critical raw material by the European Commission [21], and in batteries, it is the second element with the highest supply risk [17]. Accordingly, in this work, a large emphasis will be on assessing the influence of commodity prices on the battery manufacturing cost. In this paper, the focus is on the manufacturing stage. The environmental assessment is a cradle-to-grave LCA (life cycle assessment) that focuses on the impact on CC by evaluating GHG emissions. The inventory is obtained by dismantling a fresh commercial cell, which gives an original life cycle inventory (LCI), which is a key factor for the quality of the environmental assessment [4].
Energy density is a key parameter for the automotive industry, which is why an increase in energy density is expected [22]. At pack level, LIBs could reach 250 Wh/kg in 2020 [9] thanks to increases in material capacity and/or voltage. Post lithium-ion cells will reach the market in 2025 (lithium–sulfur for instance) but this is beyond the scope of this paper. Therefore, our future perspective considers a pack with the same materials, but which active materials are optimized to increase the energy density. The content of inactive materials is also assumed to decrease, as the optimized active materials could lead to fewer cells to connect, monitor, and assemble [9].

2. Materials and Methods

2.1. Goal and Scope

The main goal of this paper is to study the eco-efficiency of the manufacturing of a battery pack for EVs today and find ways to improve it. Therefore, the manufacturing cost and the GHG emissions are assessed for a battery pack. For both economic and environmental assessment, the same system boundaries are used. This paper is a cradle-to-gate (CtG) study; the system boundaries include the raw material extraction, the pack manufacturing, and the transport.
LCA is a procedure that assesses the potential environmental impacts of a product system. It is now widely used and has been standardized [23]. In LCA, the functional unit is the “quantified performance of a product system for use as reference unit” [23]. To properly choose a functional unit, it is important to focus on the product function. The main function of an EV battery is obviously to stock energy, as would a gasoline tank for an internal combustion engine vehicle (ICEV). Using a mass-based functional unit does not allow a comparison of batteries. Therefore, the functional unit that was chosen is a one-kWh energy capacity battery pack, which was transported to Europe. The Ecoinvent 3.4 database was used for the background data for LCA. The impact on CC is calculated with the characterization factors from IPCC 2013 V1.03 (100-year time horizon).
The bill of materials was obtained by dismantling a commercial cell, and for the module and pack level, the literature was used (Table S1). Using this bill of materials helps increase the data quality. For a future perspective, an increase in energy density is expected [22]. Hence, we also assessed a future battery pack with a higher energy density.
Four questions will be answered. (1) What is the influence of the variability of commodity prices on the battery cost? (2) What is the influence of the manufacturing location on the GHG emissions and the battery cost? (3) What is the influence of the production volume on the battery cost? (4) Can a future battery pack with higher energy density improve eco-efficiency? By answering these questions, the eco-efficiency of the studied battery will be evaluated, and some key factors to improve this eco-efficiency will be retrieved.
To answer to our first objective, the market prices of metal and precursors used in the cathode active material from 1990 are evaluated, including aluminum, cobalt, lithium hydroxide, and nickel. To answer to our second objective, seven manufacturing countries are considered: China, France, Germany, Korea, Poland, Sweden, and the USA. To answer our third objective, the battery manufacturing cost is calculated for different production volumes, using BatPac model (Chicago, IL, USA), version 3.1 [24]. This is a bottom–up cost model that accounts for every step in the battery production process. To answer our fourth objective, a future version of the pack is modeled with a reduced weight and the same active materials, but in different quantities.

2.2. Inventory

A Samsung INR21700-48G cell has been dismantled and analyzed in order to obtain the bill of materials. Before the disassembling process, the 4.8-Ah cell was discharged to a defined cut-off voltage suggested by the manufacturer (2.5 V). Since some components of LIBs react with O2 and H2O, a glove box filled with highly pure Ar atmosphere containing H2O and O2 only in the lower ppm range (<0.5 ppm and <0.1 ppm, respectively) was used. In order to avoid external short-circuit during cell opening, a ceramic pipe-cutter was used to remove the metallic case and the positive and negative tabs. The cell was weighed before and after removing these metallic elements to know the weight of the battery core. This package was unrolled to determine the structure and dimensions of the positive and negative electrodes and of the separator. Cell elements were soaked in DMC (dimethyl carbonate) to eliminate the lithium salt traces coming from the electrolyte. To estimate the mass contributions to the total weight of the cell, a known dimension of each electrode was cleaned using NMP (N-methyl-2-pyrrolidone) in order to remove the paste from the corresponding current collector. In Table 1, the different contributions to the total cell mass determined by weight are summarized. The total cell mass before disassembling was 67.02 g, in which the external metallic casing contributed around 18% of the total weight. The remaining 82 wt% corresponded to the core of the cells: positive and negative electrodes separated by a polymeric membrane, as well as to the electrolyte.
Analytical tools were used in order to identify the composition of the cell components. Both X-ray diffraction (XRD) analysis and energy-dispersive X-ray spectroscopy (EDX) were used to determine the positive and negative nature and chemical composition of the active materials. X-ray fluorescence (XRF) and Fourier transform infrared spectroscopy (FTIR) were the techniques that were used for the determination of the composition of the cell container and the separator, respectively.
In order to proceed with our research, the manufacturing factory is assumed to be located in China, France, Germany, Korea, Poland, Sweden, and the USA. The manufacturing energy for cells manufactured in an average-capacity plant is assumed to be an average from the literature [14,25,26,27,28,29,30,31,32,33,34]: 16.7 kWh/kg cell. The manufacturing yields of the different manufacturing steps were taken from BatPac 3.1 [24]. The manufacturing inventory can be found in Table S2. As a result, Figure 1 shows that there is a high variability for this value in the literature: up to three orders of magnitude. The highest value was obtained by Ellingsen et al. [30], but according to them, the likeliest value for an industrial scale is the lowest that they measured. This divides the ratio between the highest and the lowest literature values by two.

2.2.1. Positive Electrode Paste

The active material of the cathode is identified as NCA: lithium nickel cobalt aluminum oxide (LiNi0.8Co0.15Al0.05O2) with carbon black and Polyvinylidene fluoride (PVDF) as the binder. According to [24], for NCA, the solvent is NMP (1.2 g solvent per g of dry cathode paste), and the solvent recovery yield is 99.5%.
The LiNCA oxide and the NCA precursor manufacturing process are modeled according to [35], and the outputs are calculated for mass balance (Tables S3–S5). The precursors are nickel sulfate (modeled based on [36]), cobalt sulfate (modeled according to [32]), aluminum sulfate (dataset from Ecoinvent 3.4), and lithium hydroxide (dataset from Ecoinvent 3.4). According to the manufacturer, the nickel sulfate is processed from nickel class I, which is consistent with Schmidt et al. [37]. The data for nickel is not taken from Ecoinvent 3.4, as the nickel metal data is based on a study with the reference year 1994, whereas the Nickel Institute released a LCI on nickel class I and ferronickel in 2015 [36]. We modeled the nickel class I with the data from Nickel Institute, which represents 52% of the global nickel metal production in 2011. This LCI is in accordance with ISO 14040 and ISO 14044 standards.

2.2.2. Negative Electrode Paste

The negative electrode paste was graphite-based (doped with Si, ~2 wt%), and the slurry solvent was water [24]. The inventory can be found in Table S6.

2.2.3. Electrolyte

The electrolyte could not be analyzed, as it was evaporated for safety reasons. We assume that the lithium salt was one M of LiPF6 solution in ethylene carbonate/dimethyl carbonate 50/50 (v/v) [30].

2.2.4. Electrode Substrates

The positive electrode substrate is an aluminum foil that is assumed to be free from surface treatment. A copper foil was used as the negative electrode substrate; we also assumed that it didn’t receive any surface treatment.

2.2.5. Separator

The separator was identified as a polyethylene foil with a ceramic coating. It was approximated by a polyethylene film coated with alumina [38].

2.2.6. Cell Container

The cell container was composed of a metallic case, a positive tab, and a negative tab. The metallic case was made of ferronickel; we assumed that it was composed of 29% nickel [36]. The negative tab was richer in nickel on the inside than on the outside. We assumed that the tab was composed of 50% of the outside casing and 50% of the inside casing. The positive tab had three parts: a nickel-rich ferronickel outside sheet, a titanium alloy inside sheet, and a nickel-rich ferronickel edge tab.

2.2.7. Module and Pack Housing

The module housing, the BMS (battery management system), the cooling system, and the pack housing were modeled according to [30], assuming 36 cells per module and 32 modules per pack, to reach a 20-kWh battery pack, weighing 154 kg. For a higher battery capacity, modules are added to the battery pack. The BMS, the cooling system, and the pack housing are scaled linearly to the pack energy capacity. This assumption may overestimate the weight of these components for bigger packs.
The pack of the Tesla Model S P100D already reached 176 Wh/kg [39]. In our future perspective, we assume an energy density of 260 Wh/kg, at a pack level that fits the most likely perspective from [25]. This value is twice as high as our base case battery pack. We assume that the active material stays identical, and that the inactive material quantity is also reduced.

2.3. Cell Cost

A NCA cell has been modeled in a modified version of BatPac based on the bill of materials obtained through measurements. In this model, the battery factory is assumed to operate at full capacity. In this study, the annual cell production volume was unknown; therefore, it was evaluated using the validity range of the BatPac model [24] (20% to 500% of the baseline production capacity). The baseline plant has a production volume reaching 6% of the world capacity in 2017 [5].
Considering the high variability of commodity prices (Figure 2), the cathode active material price is studied in detail. For nickel, cobalt, and aluminium, the yearly prices are retrieved from [40]. There is not one established lithium index. The LiOH price is retrieved from [41] for monthly lithium hydroxide prices from 2009 to 2017. For previous years, the lithium hydroxide price is assumed to be 8% of the lithium metal price [40].
The active material cost is calculated using Equation (1). The baseline cost is the sum of the cost for processing, additional raw materials, and the profit margin associated with the manufacture of the materials [42]. In [24], it was set at 20 $/kg for NCA. All of the other material costs were taken from [24], except for the ceramic-coated separators [16] and cell container [12]. Our pack uses cylindrical cells with a ceramic-coated separator, while [24] includes prismatic cells with PP (Polypropylene)/PE (Polyethylene)/PP separators.
C = C 0 + i m i × C i
where
  • C 0 : baseline cost;
  • m i : mass of material i necessary to produce one kg of active material; and
  • C i : cost of material i.
The direct labor cost for battery cells manufactured in Korea is the hourly compensation costs in the manufacturing sector for 2016, including direct pay, social insurance expenditures, and labor-related taxes [43]. For European countries, the direct labor rate was set to the 2017 industry average hourly labor cost [44]. Equipment costs are assumed to be the same [10] in all the locations, meaning that we assume that all of the factories would import the same equipment from the same suppliers. The cost of buildings are adapted for each location [45] (Table 2).
All of the costs in [24] have been evaluated for 2020, and they are in $2010. In this project, costs were converted to €2014, using the CPI (consumer price index), which was retrieved from the local bureau of statistics [46,47,48,49] and 2014 $/€ exchange rate.

2.4. Pack Cost

The cost of the other components of the pack, such as the BMS, the cooling system, and the housings were adapted from the BatPac model. The baseline cells that were modeled in [24] were not cylindrical cells, which affects the pack design; however, Nelson et al. [42] assumed that the BatPac cost modeling is suitable for several pack designs.

3. Results and Discussion

3.1. Cost: Influence of Active Material Price and Production Volume

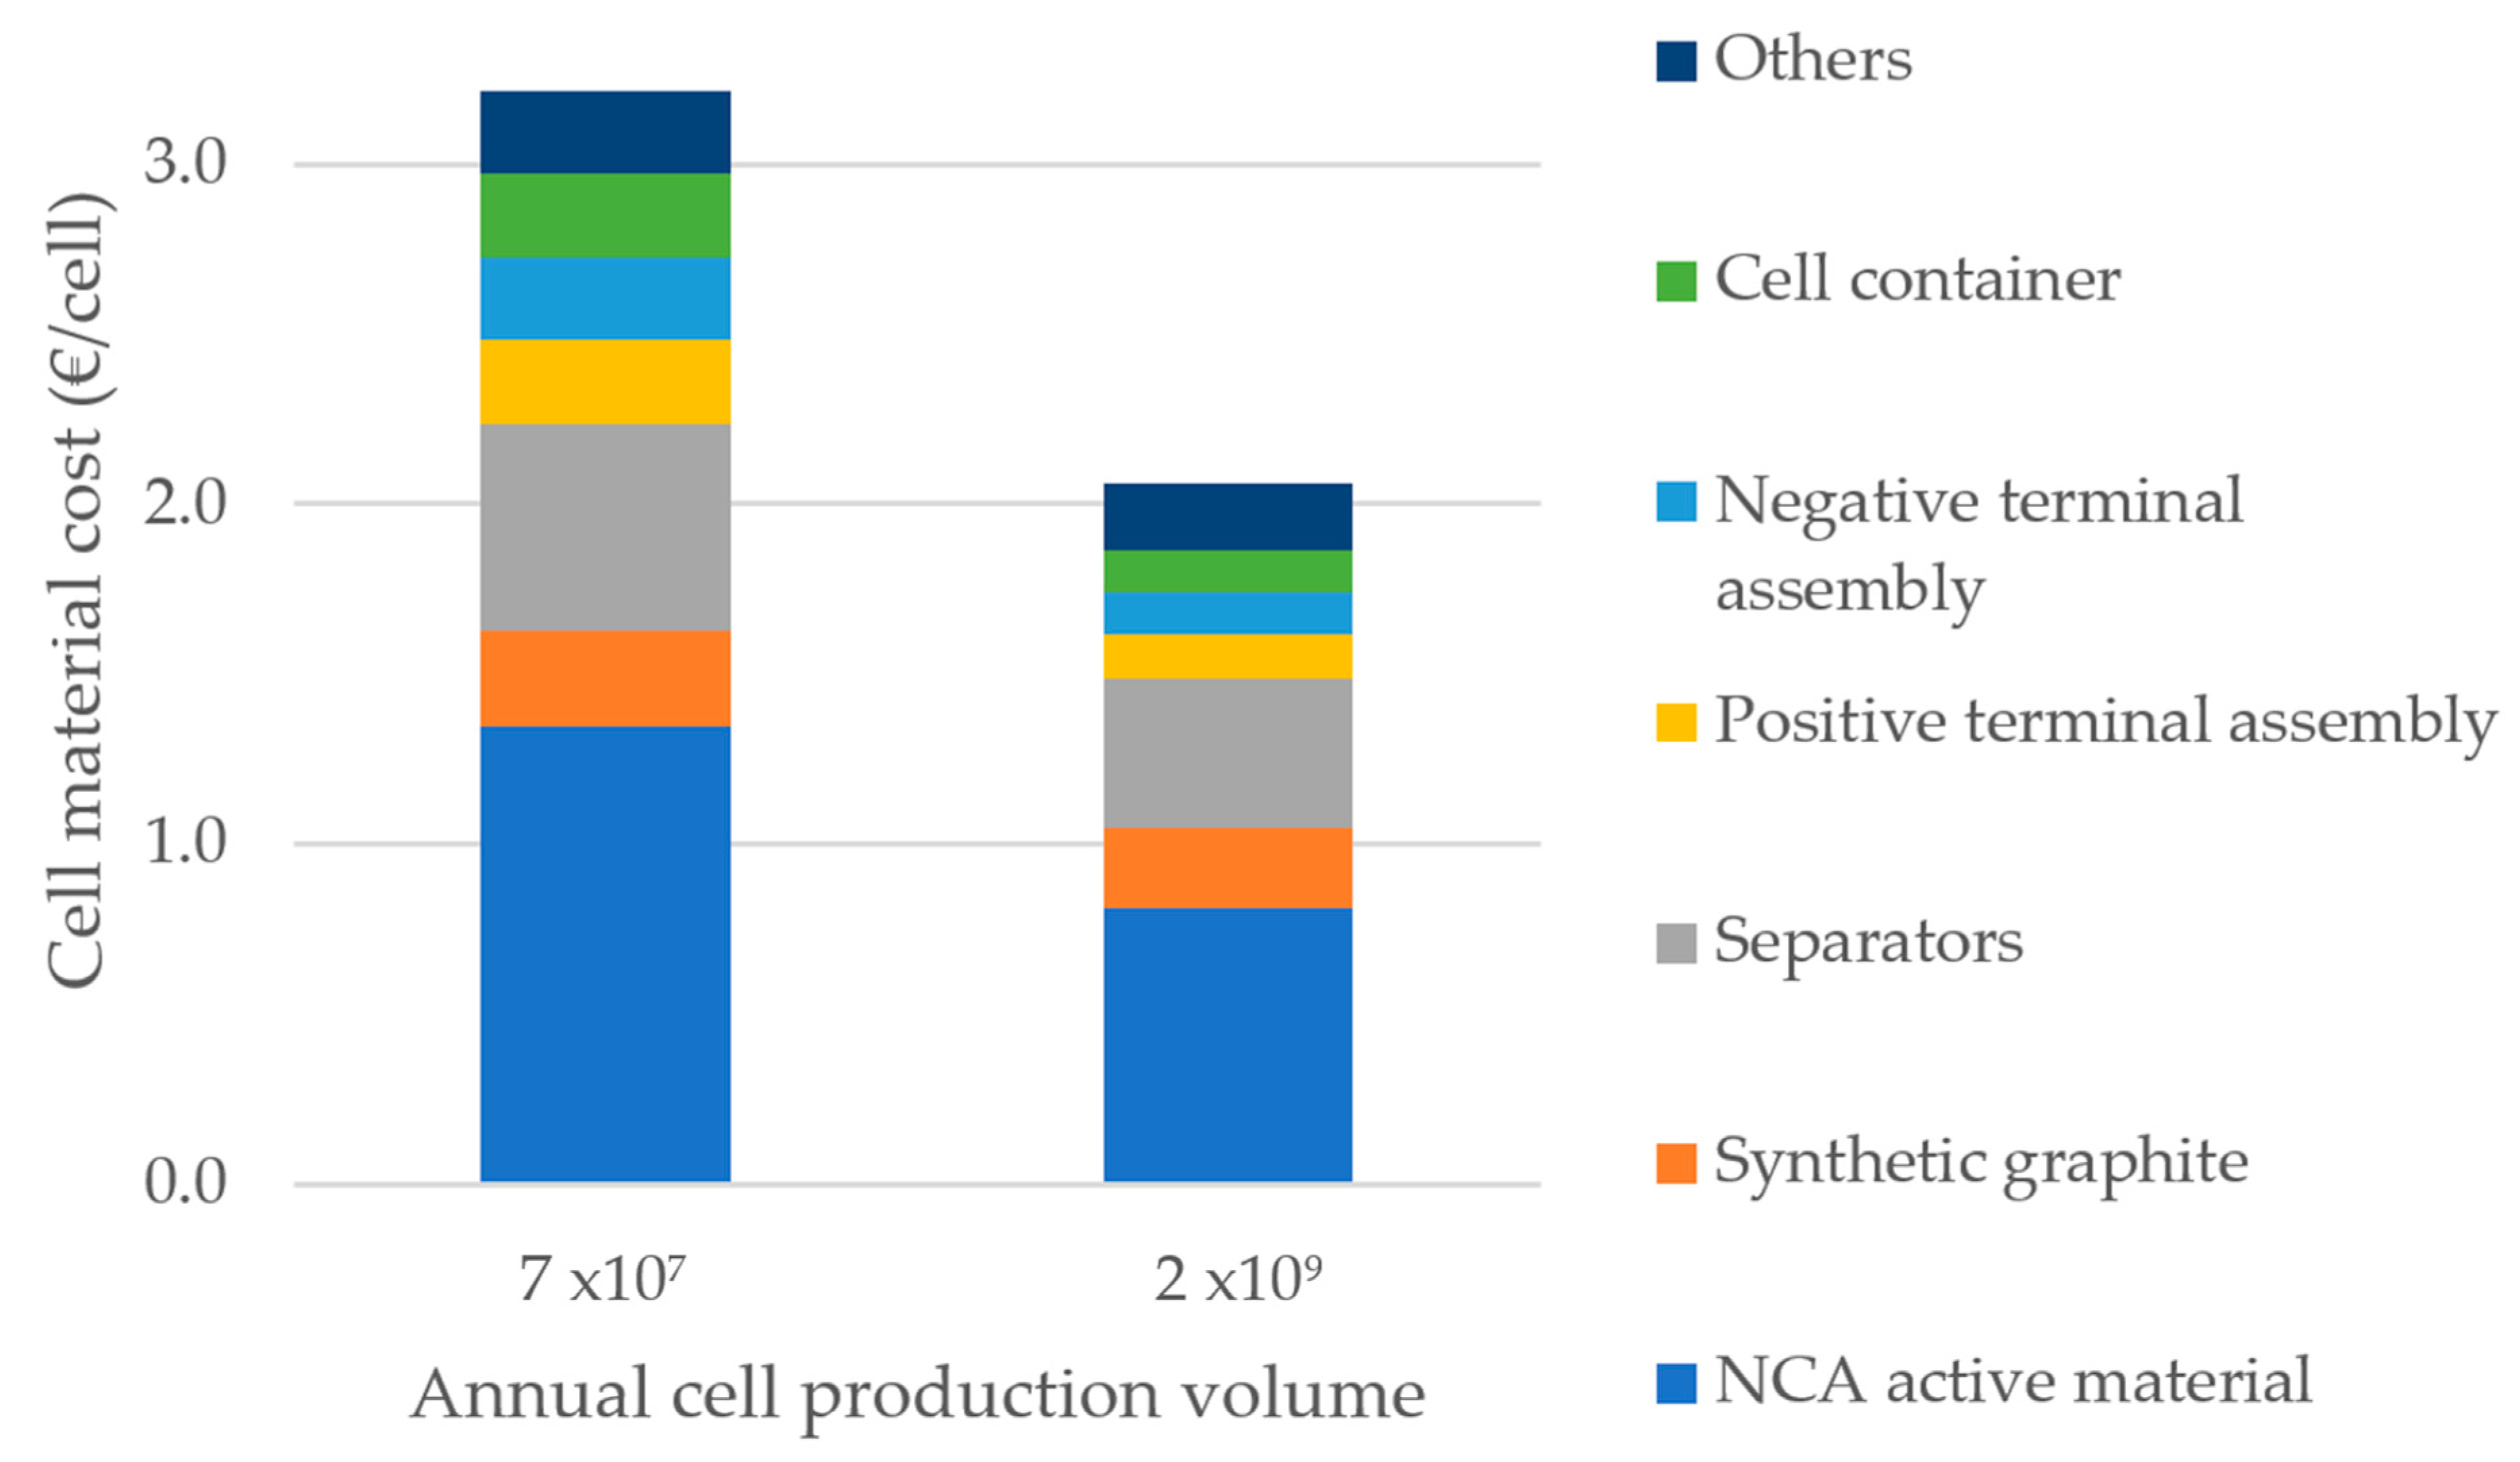
3.1.1. Material Cost
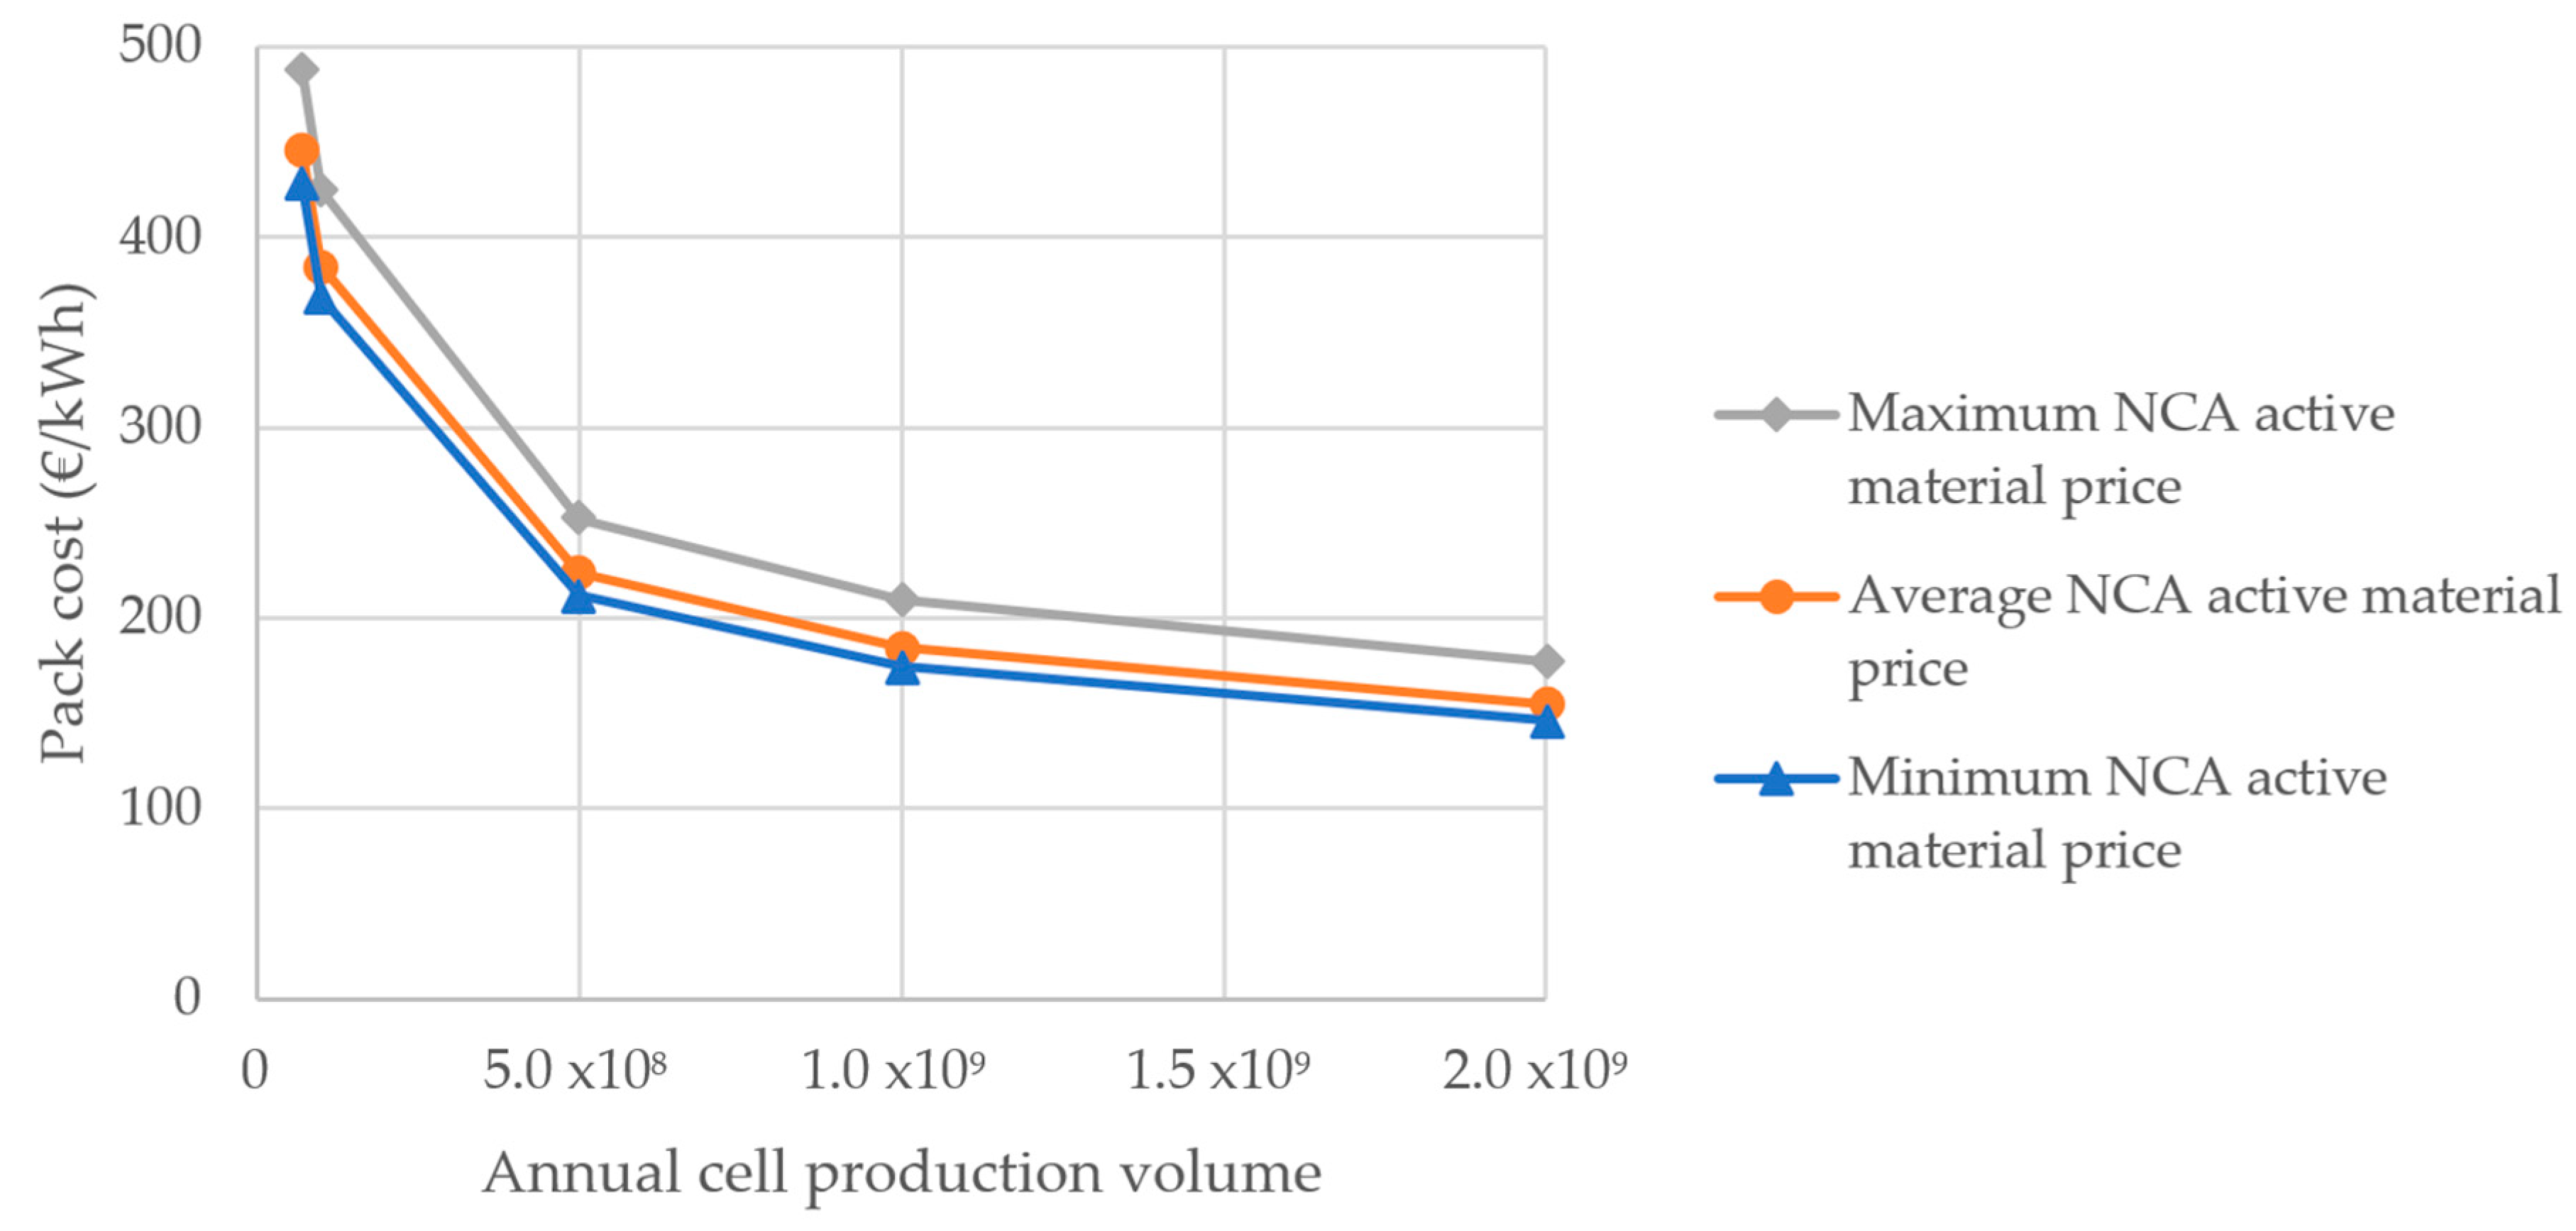
The average active material price was 33 $/kg (minimum 26.9 $/kg in 2002 and a maximum of 49 $/kg in 2007, Figure 3) for the period between 1990–2017, which is 39% higher than the figures in [24], but in accordance with [12,15,16]. Nevertheless, the assessed materials can be slightly different (metal content, particle size, and shape, …), and the production volume can also differ, as pointed out by [16]. However, the baseline cost is the biggest cost contributor to the active material cost. On the other hand, aluminum is the smallest cost contributor, due to its lower cost compared to the other metals that were assessed in this study. Even though the cobalt content in NCA is low compared to other cathode materials, it costs between 10–25% of the active material. Figure 3 shows that the cathode active material is relatively stable over time despite the commodity price volatility.
Even though the active material, NCA, was not manufactured in 1990, prices were evaluated from 1990. Those earlier prices may not correspond to any realistic price, because EVs did not account for commodity demand in those early years.
In the total material costs of a cell, the cathode is—with the separators—the component that has the highest share of the material costs (Figure 4). For an NMC cylindrical cell, Brodd and Helou [10] showed that the cathode active material is the biggest cost contributor, before the cell container, the active anode material, and the separators. However, our cells contain ceramic-coated separators that improve cell thermal stability, but have a higher price per area [16] compared to polyolefin separators.

3.1.2. Pack Cost

The pack cost includes material costs, direct labor, variable overhead, sales and administration, research and development, depreciation, profit, and warranty. Variable overheads are the costs of indirect materials and labor, utilities, and plant maintenance. The manufacturing cost that is obtained is dominated by the material costs (Table 3), as reported previously by [8,9,15,42]. With higher volumes, all of the cost shares decrease except for materials and warranty. Direct labor does not contribute much to the pack cost, as the manufacturing process is highly automated [9,10].
Our pack cost estimate ranges between 147–492 €/kWh (Figure 5), while the pack cost estimate ranges from 171–440 €/kWh for 2020 [2] (using the €/$ exchange rate on 5 November 2018). Most LIB cost assessments focus on LIBs without specific details regarding its chemistry [5,50]; nevertheless, we focus on a battery pack with NCA as active material. Battery manufacturers also tend to reduce prices in order to attract investors to increase their production capacity [5], so the manufacturing cost may not reflect the market price. Our estimate is in accordance or slightly lower than [15] for NCA, even though they do not include profit margin, and calculate cost per kWh of usable energy.
When focusing on cell estimates, the cost of cylindrical cells is higher than prismatic cells, as prismatic cells require less inactive material than cylindrical cells, on a per-kWh basis [12]. We estimate the cost of the disassembled cylindrical cell to be between 134–346 €/kWh, which is in accordance with [12] for NCA 18650 cylindrical cells.
Our results show that the production volume has a high influence on the pack cost. According to [51], 75% of the pack cost depends on the production volume. The variability due to the commodity price is lower than the variability due to the production volume. The Pearson correlation coefficient between the log of the production volume and the pack cost was −0.9721, and the Pearson correlation coefficient between the active material price and the pack cost was 0.1562.

3.2. Environmental Impact

3.2.1. Contribution Analysis

The impact of our battery pack on CC, which was manufactured in an average capacity plant in Korea, was at 71% driven by the cells (Figure 6). The high impact of the cells is common even for other LIB chemistries [30,52,53]. In studies that focused on NCA batteries, the main contributors to the impact of battery production on CC were the cell manufacturing energy, the NCA active material, and aluminum [11,14], which is coherent with our findings.
At the cell level, the manufacturing electricity, the cathode paste, and the cell container make up most of the impact on CC. First of all, more than two-thirds of Korean electricity is produced thanks to fossil fuels (hard coal and natural gas mainly) [54], which explains its impact on the GHG emissions. Secondly, the cathode paste is the heaviest component of the cell (Table 1), and in the cathode paste, nickel sulfate is the material that contributes more, but it is the first precursor in terms of mass content, as the active material is LiNi0.8Co0.15Al0.05O2.
The cylindrical metallic case consists of an iron–nickel alloy, and the electricity that is used for its production drives the impact of that alloy. The cell container is an inactive component; therefore, it would be interesting to reduce its impact. On a mass basis, can cell containers have higher impacts on CC, particulate matter formation and photochemical ozone formation than pouches [55]. Moreover, the mass per battery pack of can containers is higher than the mass of pouches. The potential thermal instability of NCA cells can explain the choice of cylindrical containers. Cylindrical containers have a good mechanical stability, and the space between cells can be used for cooling purposes. Pouch containers are lighter, and there is less void space in a pack containing pouches. Nevertheless, the module packaging must bring the mechanical stability that the cells do not have. Also, in pouch cells, swelling can be a problem due to gassing. Choosing cylindrical cells above pouch cells is an example of a trade-off between environmental impacts and other criteria such as user safety.
The anode paste, the electrode substrates, the electrolyte, and the separators represent 45% of the cell mass; however, their total environmental impact is below 8% of the cell impact. A unified inventory that was used to compare several battery chemistries also shows that those components are not relevant for the global warming potential [55].
A small quantity of aluminum is used in our cell, but the main material of the module and pack housings is aluminum, which explains the impact of the module housing on CC. Aluminum manufacturing is known to be an energy-intensive process. Note that Peters et al. [55] showed that the module and pack housing modeled by Ellingsen et al. [30] had a significantly higher impact on global warming potential than four other studies that are often used as a source of inventories for battery LCA case studies. The reason provided by Peters and Weil is that aluminum is the basis material for the housings.
The production GHG emissions of our battery pack, which was manufactured in an average capacity plant in Korea, were 123 kg CO2 eq/kWh. In the literature, there is more than a fivefold variability in results, from 49 kg CO2 eq/kWh [14] to 272 kg CO2 eq/kWh [11] for NCA batteries. The lowest value is obtained for the manufacturing of a solid-state NCA cell [14]. Ambrose et al. [11] used a probabilistic approach to evaluate the GHG emissions and obtain the highest values (between 252–272 kg CO2 eq/kWh) for NCA battery manufacturing. Their batteries are manufactured with an electricity mix emitting 810 g CO2 eq/kWh (mean value of a log-normal distribution). The carbon intensity of the Korean electricity mix that we used was 639 g CO2 eq/kWh (Ecoinvent 3.4 dataset, evaluated with the IPCC 2013 100a V1.03 characterization factors). Considering the contribution of the electricity mix in our results, this may not be the only reason explaining the differences. Nevertheless, they do not provide enough information on the modeling of the manufacturing to explain it. In [11], the cell manufacturing energy even represents ca. 80% of production emissions, while in our case, it represents 35% in case the cells are manufactured in Korea. If the pack is manufactured in China (carbon intensity of Ecoinvent Chinese electricity mix is 1.14 kg CO2 eq/kWh, evaluated with the IPCC 2013 100a V1.03 characterization factors), the electricity for production emits 78% of CtG GHG.

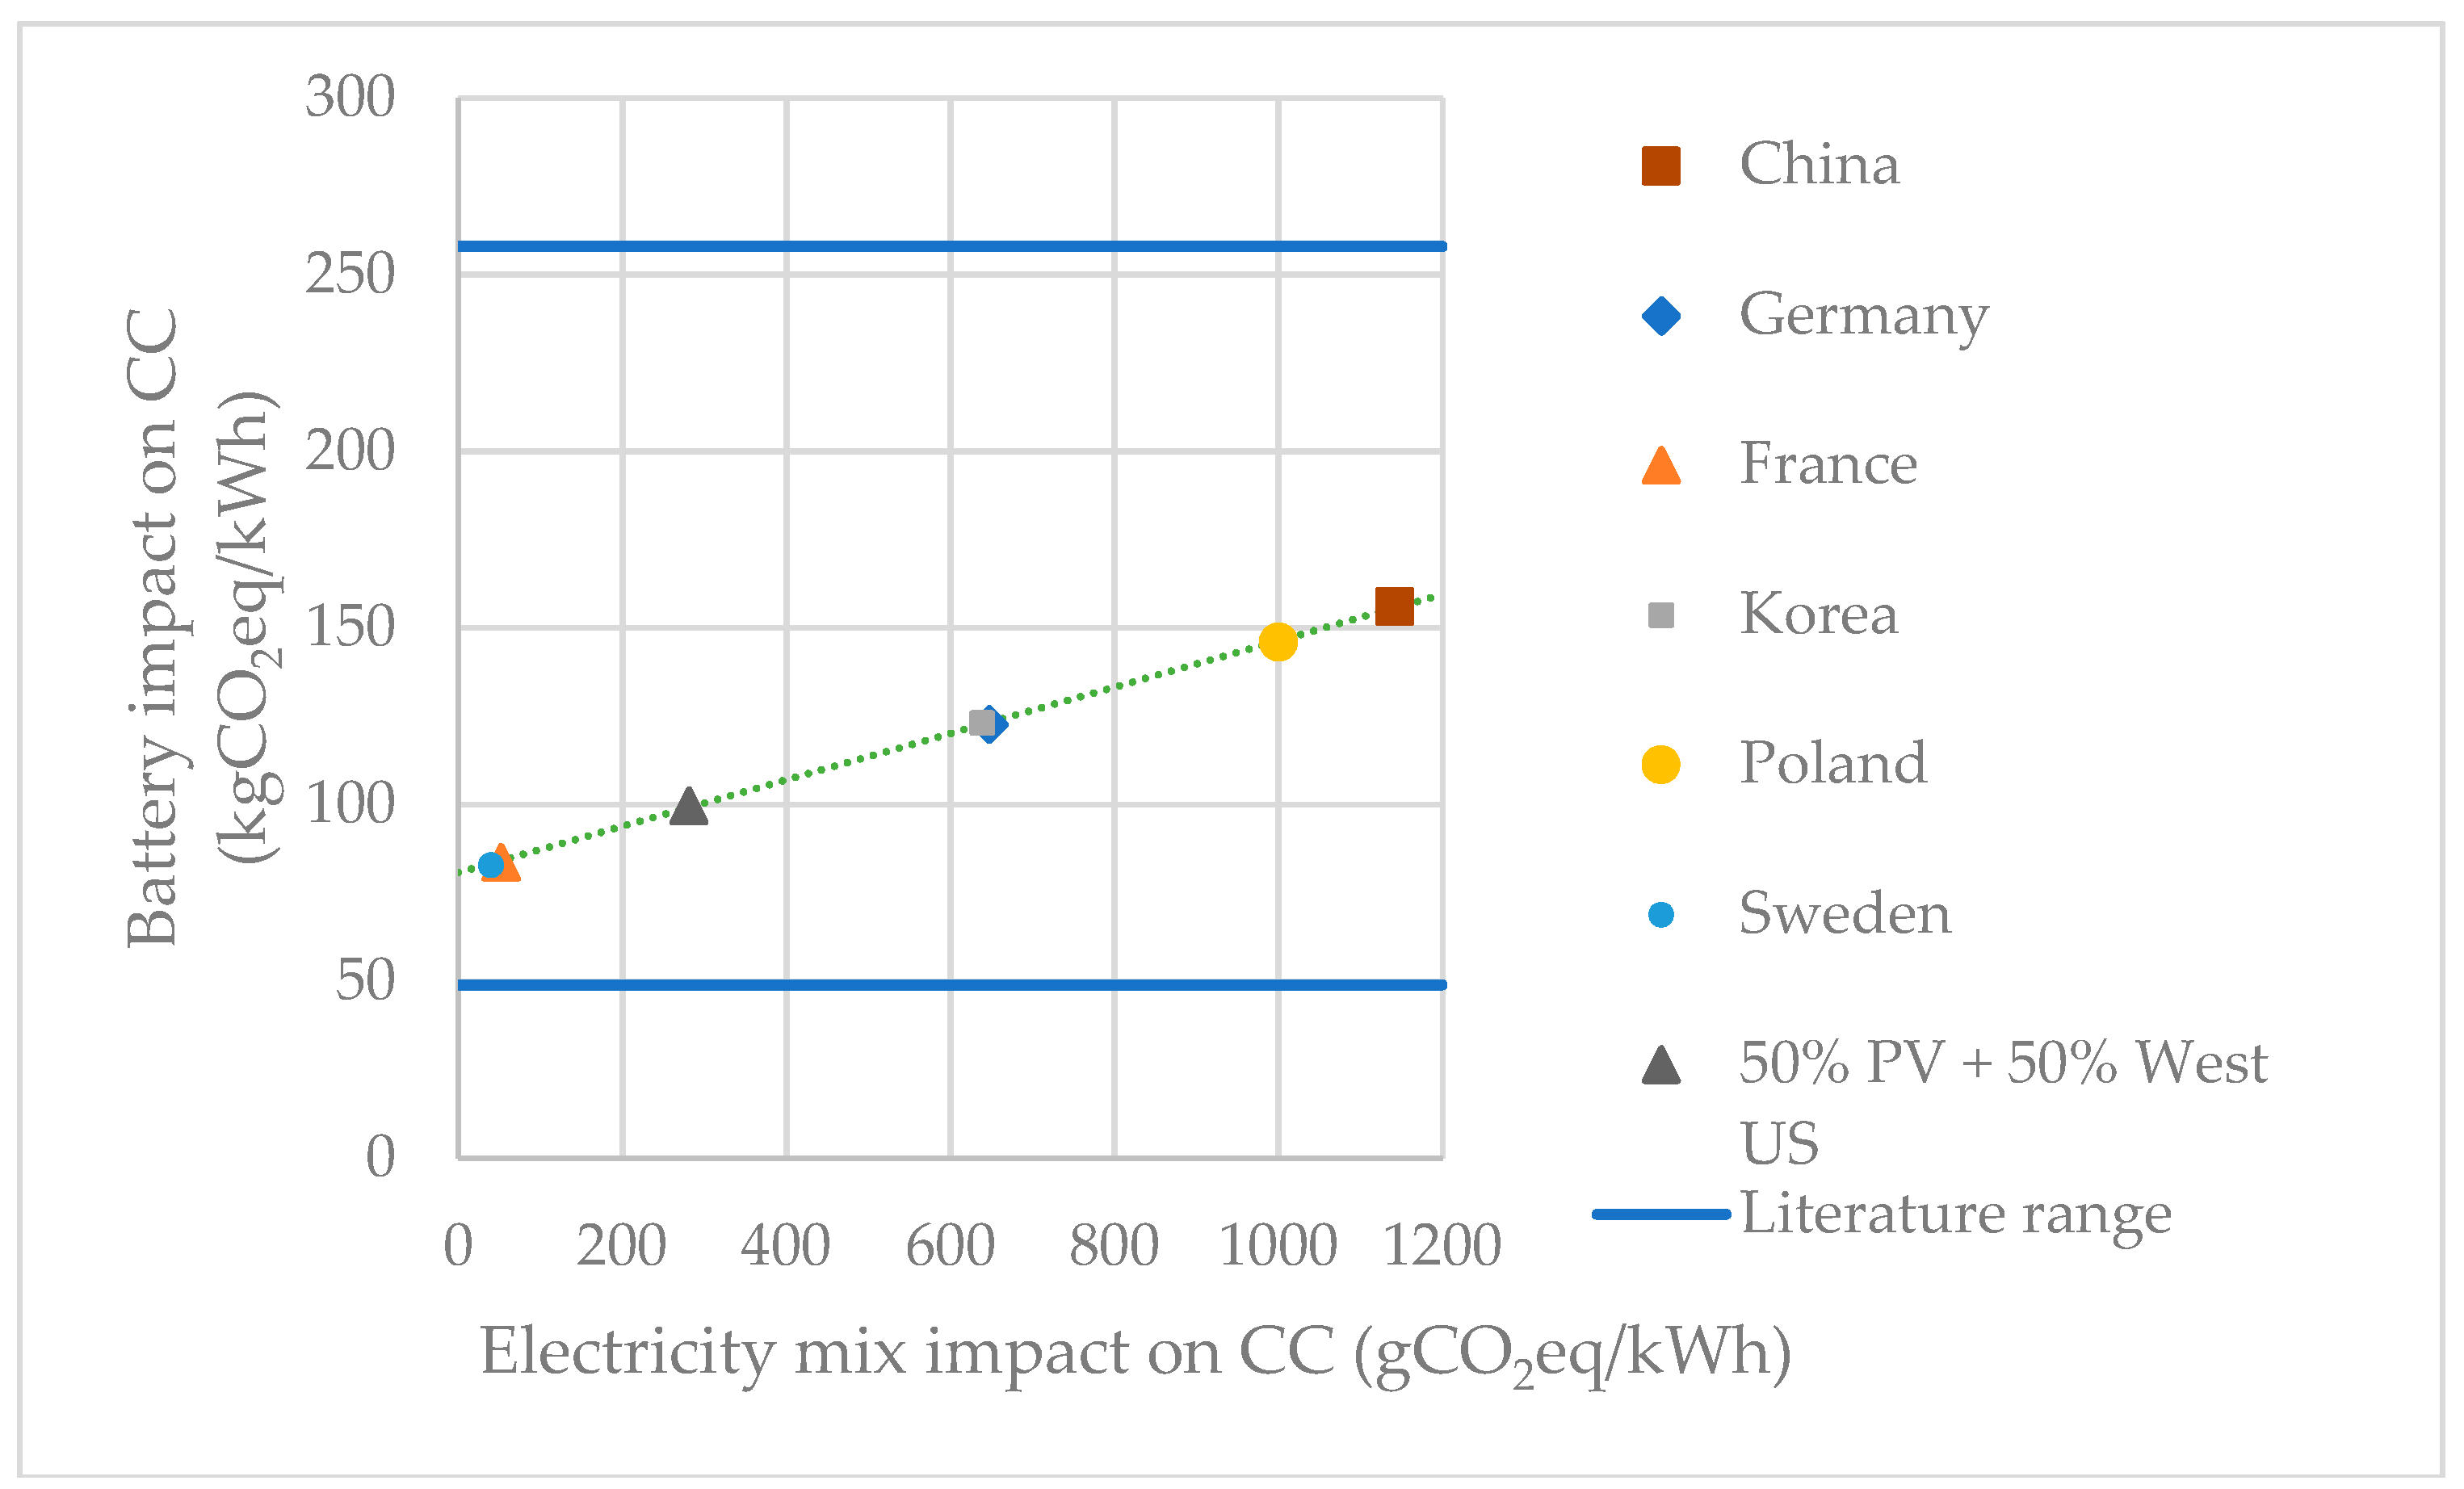
3.2.2. Influence of the Manufacturing Country

For countries with electricity produced mainly from fossil fuels, the impact on CC of a pack is mainly due to the electricity production (60% for a pack manufactured in China). On the other hand, for countries with less carbon-intensive electricity production, materials contribute relatively more. The cathode paste, the cell container, and the module housing emit 26.6%, 19.2%, and 18.8% of the GHG respectively for a pack manufactured in Sweden. The electricity mix that is used to manufacture the pack almost explains the differences between countries that is observed in Figure 7. The correlation between the GHG emissions of the electricity mix and the pack manufacturing impact on CC is shown by a linear regression (R2 = 0.999696). The ratio between the carbon intensity of the Chinese and Swedish electricity mix is almost 30. The Chinese electricity production is mainly based on hard coal, while the Swedish electricity production is based on hydropower and nuclear energy. One of the highest values in the literature (258 kg CO2 eq/kWh) is obtained for a battery manufactured in Asia, with an electricity mix carbon intensity of one kg CO2 eq/kWh [13].

3.2.3. Influence of the Production Volume
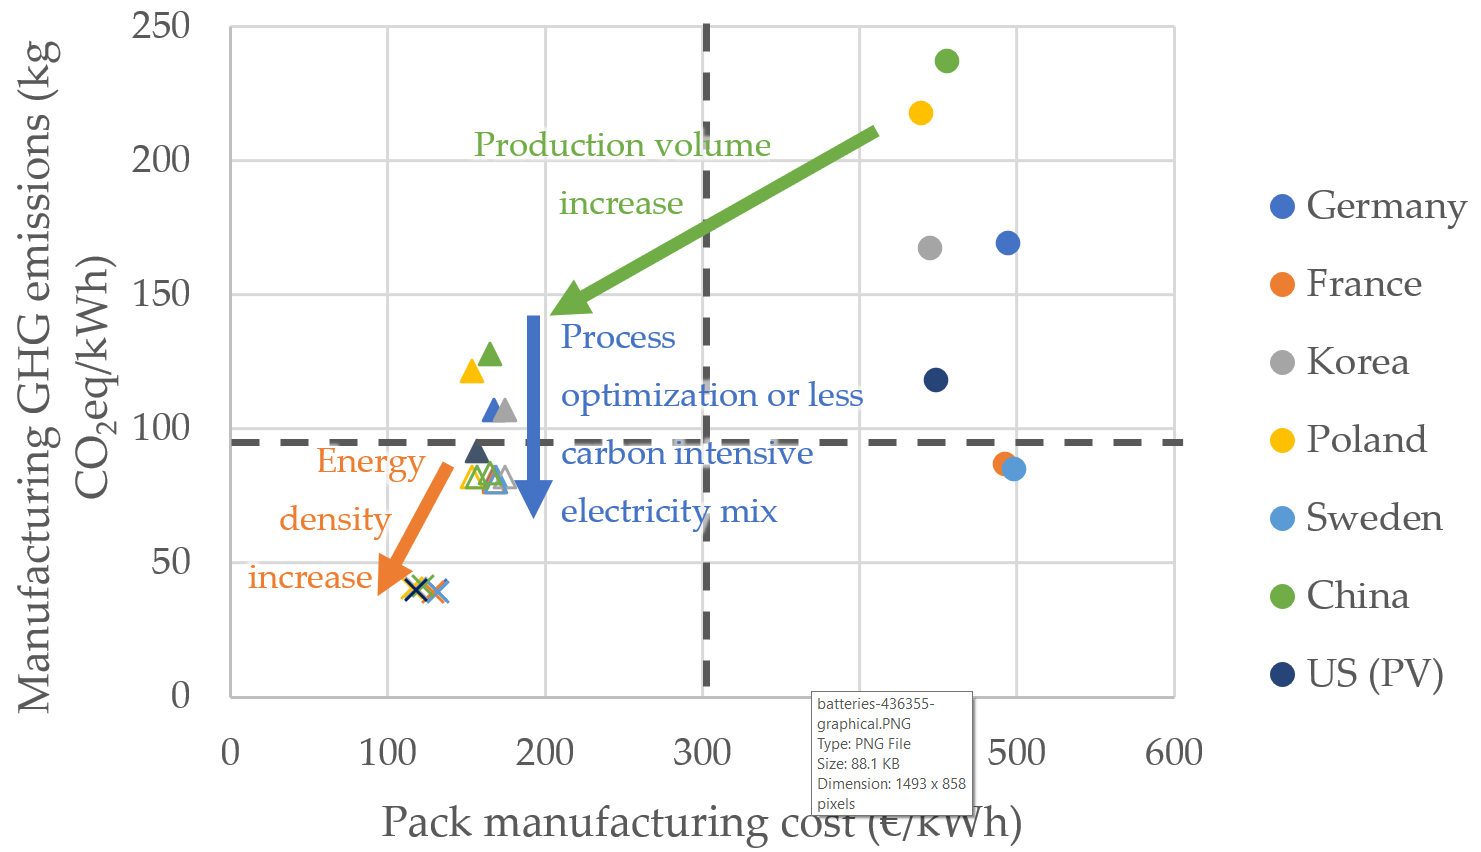
The previous sections only considered an average capacity plant where the manufacturing energy is an average from the literature. However, the economies of scale also affect the manufacturing energy. In the cost assessment, the energy cost is included in the variable overhead costs. In this section, the energy consumption is assumed to be proportional to the variable overhead costs. For the smallest factory considered, the energy to produce the cells is 34.1 kWh/kg cell, which is above the third quartile of the literature values. For the biggest factory considered, the energy to produce the cell is 10.4 kWh/kg cell, which is between the median and the third quartile of the literature values. A lower value will be used in Section 3.3.
Under this assumption, Table 4 shows that the capacity of the manufacturing plant influences the impact on the CC of the battery manufacturing. This is even more true for small production volumes. The economies of scale are smaller for bigger plants. Doubling the plant capacity from 17.4 GWh per year to 35 GWh per year only reduces the GHG emissions by 6%.

3.3. Eco-Efficiency

In this paper, eco-efficiency is presented as the simultaneous consideration of GHG emissions and costs for the manufacturing of a pack. It is disclosed as a scatter plot that assigns the pack manufacturing cost per kWh to the horizontal axis, and the impact on CC per kWh to the vertical axis (see Figure 8). Figure 8 shows that the production volume is a key parameter for manufacturing costs and GHG emissions (green arrow). The manufacturing country is less important for cost, but explains differences in GHG emissions (blue arrow). The influence of the production volume on GHG emissions is higher for small factories and a highly carbon-intensive electricity mix. For a pack manufactured in China, the GHG emissions can be divided by almost two if the production volume is multiplied by almost 30. A pack manufactured in Sweden would only see its GHG emissions reduced by 5% in the same production volume increase.
Batteries can then be grouped in four clusters, as indicated by the four quadrants found in Figure 8. Improving the eco-efficiency of a battery is achieved by targeting the lower left quadrant. In upper quadrants, manufacturing countries are those with an electricity mix with a higher share of fossil fuels (carbon intensity above 200 g CO2 eq/kWh). Right quadrants contain batteries manufactured in a factory with a small production capacity. The effect of the location seems to decrease for higher production volumes (left quadrants).
In Section 2.2, the high variability in the literature of the energy consumption for manufacturing was mentioned. The lowest value found in [31] can be considered an optimized production process, which is 36 times lower than the average value. This value leads to reduced differences in GHG emissions between countries (between 80.3–83.2 kg CO2eq/kWh). Therefore, optimizing the production process is another way to reach the lower left quadrant for factories that are located in countries with an electricity mix based on fossil fuels (blue arrow).
The amount of waste could also be reduced to optimize the process. Reducing the amount of waste would allow reducing the amount of the primary material purchase. This reduction involves reductions in costs and GHG emissions. This reduction could be substantial, as materials contribute to 72% and 65% of costs and GHG emissions, respectively, for a pack manufactured in Korea in an average plant. Wastes are generated during all of the processing steps, including during the cell formation cycles and charge retention tests where complete cells are rejected. There are 1% defective cells in the model featured in [56], but the figure for the BatPac model is 5%. Therefore, the total cell yield could be improved. The component with the lowest yield is the current collectors. The electrode-slitting yield is 92% for both of the current collectors, but the aluminum and copper foils could be recycled. Slurry coating is the second-least efficient step. Improving this step and reducing electrode paste waste is a possibility to improve the eco-efficiency, considering that the cathode paste is the component that contributes the most to cell cost and GHG emissions.
The future battery pack (cross in Figure 8) is a pack with 260 Wh/kg of energy density, which was manufactured in a high-capacity factory with an optimized process (lower energy consumption for manufacturing). This increased energy density decreases both costs and GHG emissions (orange arrow), and also decreases the differences between manufacturing countries (between 39.5–41.4 kg CO2 eq/kWh). The GHG emissions of this future battery pack are below the lowest value in the literature for NCA battery packs.
It is considered that the limit of 100 $/kWh (88€/kWh using the €/$ exchange rate from 5 November 2018) should be reached for the BEVs to be cost-competitive with the ICEVs [3]. For the eco-efficiency to be satisfactory, the battery cost target is below 88 €/kWh, which is not achieved yet by the modeled battery pack. From the economic point of view, the eco-efficiency should be improved. From the environmental point of view, the impact of the battery pack with a doubled energy density is below the lowest literature value [14] for the NCA chemistry. As a consequence, a high energy density battery pack manufactured in a high-capacity factory, with an optimized process or low carbon-intensive electricity mix is needed to reach a good eco-efficiency, at least when considering environmental performances.
Whether for the cost or the GHG emissions, the cathode active material is a significant contributor. Hence, we can wonder if other cathode materials and/or recycled materials could also improve eco-efficiency, but this is out of the scope of this paper. There is a cost benefit in recycling batteries, if the value of the recovered materials is approximated by the virgin material price and if the waste stream is composed of NMC batteries (Nickel Manganese Cobalt) [57]. However, estimating recycling costs and GHG emissions is not straightforward; as recycling at a large scale is not taking place yet, it is subject to uncertainties.
The use stage may be a large part of costs [58] and GHG emissions [59]. Therefore, it would be interesting to put previous results within the perspective of broader system boundaries. Taking the use stage into consideration requires taking into consideration all the efficiencies that are involved in the vehicle consumption: the charger, the battery charge and discharge, the power electronics, the motor, and the transmission. The use stage electricity consumption is dependent on many factors (including driver behavior), and modeling it for an LCA brings several questions. One of them is a question on allocating the vehicle electricity consumption. Should it all be allocated to the battery pack, or only part of it?
It seems evident that the electricity mix that is used for charging needs to have a low carbon intensity to decrease the GHG emissions of the battery life cycle, as the carbon intensity of the electricity mix explains 70% of the variability of results for EV LCA in the literature [59]. Nevertheless, the costs of renewable energies are different than the costs of fossil fuel-based electricity [60], and charging the battery with offshore wind turbines may for instance be more expensive than charging it with combined cycle gas turbines. There may be a trade-off between the GHG emissions and the cost that could be assessed in a future study.
The eco-efficiency of the modeled battery is almost satisfactory, as the GHG emissions are below the lowest literature value, but the cost is above the 100 $/kWh target. To check whether the eco-efficiency is completely satisfactory, the system boundaries should be broaden to include the full powertrain to allow a comparison with a conventional powertrain.

Supplementary Materials

The following are available online at https://www.mdpi.com/2313-0105/5/1/23/s1, Table S1: Inventory for the manufacturing of a pack manufactured in Korea, Table S2: Inventory for the manufacturing of cells in Korea, Table S3: Inventory for the manufacturing of the cathode paste, Table S4: Inventory for the manufacturing of the cathode active material, Table S5: Inventory for the manufacturing of NCA precursor, Table S1: Inventory for the manufacturing of the anode paste.

Author Contributions

Conceptualization, M.P.; Investigation, M.P. and G.A.; Supervision, M.M. and J.V.M.; Writing—original draft, M.P., G.A. and E.A.; Writing—review & editing, M.M.

Funding

This project has received funding from the European Union’s Horizon 2020 research and Batteries 05 00023 i001 innovation program under grant agreements no 769935.

Acknowledgments

We acknowledge Flanders Make for the support to our research group.

Conflicts of Interest

The authors declare no conflict of interest.

References

  1. Bloomberg NEF. Cumulative Global EV Sales Hit 4 Million. Available online: https://about.bnef.com/blog/cumulative-global-ev-sales-hit-4-million/ (accessed on 14 November 2018).
  2. Nykvist, B.; Nilsson, M. Rapidly falling costs of battery packs for electric vehicles. Nat. Clim. Chang. 2015, 5, 329–332. [Google Scholar] [CrossRef] [Green Version]
  3. Bloomberg NEF. Why Battery Cost Could Put the Brakes on Electric Car Sales. Available online: https://about.bnef.com/blog/why-battery-cost-could-put-the-brakes-on-electric-car-sales/ (accessed on 14 November 2018).
  4. Peters, J.F.; Baumann, M.; Zimmermann, B.; Braun, J.; Weil, M. The environmental impact of Li-Ion batteries and the role of key parameters—A review. Renew. Sustain. Energy Rev. 2017, 67, 491–506. [Google Scholar] [CrossRef]
  5. Curry, C. Lithium-Ion Battery Costs and Market. Available online: https://data.bloomberglp.com/bnef/sites/14/2017/07/BNEF-Lithium-ion-battery-costs-and-market.pdf (accessed on 18 October 2018).
  6. Chung, D.; Elgqvist, E.; Santhanagopalan, S. Automotive Lithium-Ion Cell Manufacturing: Regional Cost Structures and Supply Chain Considerations. Available online: www.nrel.gov/publications (accessed on 24 October 2018).
  7. Rolander, N.; Starn, J.; Behrmann, E. The Dirt on Clean Electric Cars. Bloomberg. Available online: https://www.bloomberg.com/news/articles/2018-10-16/the-dirt-on-clean-electric-cars?srnd=hyperdrive (accessed on 29 October 2018).
  8. Berckmans, G.; Messagie, M.; Smekens, J.; Omar, N.; Vanhaverbeke, L.; Mierlo, J.V. Cost projection of state of the art lithium-ion batteries for electric vehicles up to 2030. Energies 2017, 10, 1314. [Google Scholar] [CrossRef]
  9. Cluzel, C.; Douglas, C. Cost and Performance of EV Batteries. Available online: https://www.theccc.org.uk/archive/aws/IA&S/CCC battery cost_ Element Energy report_March2012_Public.pdf (accessed on 12 June 2018).
  10. Brodd, R.J.; Helou, C. Cost comparison of producing high-performance Li-ion batteries in the U.S. and in China. J. Power Sources 2013, 231, 293–300. [Google Scholar] [CrossRef]
  11. Ambrose, H.; Kendall, A. Effects of battery chemistry and performance on the life cycle greenhouse gas intensity of electric mobility. Transp. Res. Part D Transp. Environ. 2016, 47, 182–194. [Google Scholar] [CrossRef] [Green Version]
  12. Ciez, R.E.; Whitacre, J.F. Comparison between cylindrical and prismatic lithium-ion cell costs using a process based cost model. J. Power Sources 2017, 340, 273–281. [Google Scholar] [CrossRef]
  13. Giordano, A.; Fischbeck, P.; Matthews, H.S. Environmental and economic comparison of diesel and battery electric delivery vans to inform city logistics fleet replacement strategies. Transp. Res. Part D Transp. Environ. 2017, 64, 1–14. [Google Scholar] [CrossRef]
  14. Lastoskie, C.M.; Dai, Q. Comparative life cycle assessment of laminated and vacuum vapor-deposited thin film solid-state batteries. J. Clean Prod. 2015, 91, 158–169. [Google Scholar] [CrossRef]
  15. Rempel, J.; Barnett, B.; Hyung, Y. PHEV Battery Cost Assessment. Available online: https://www.energy.gov/sites/prod/files/2014/03/f13/es001_barnett_2013_o.pdf (accessed on 28 May 2018).
  16. Patry, G.; Romagny, A.; Martinet, S.; Froelich, D. Cost modeling of lithium-ion battery cells for automotive applications. Energy Sci. Eng. 2015, 3, 71–82. [Google Scholar] [CrossRef]
  17. Helbig, C.; Bradshaw, A.M.; Thorenz, A.; Tuma, A. Supply risks associated with lithium-ion battery materials. J. Clean Prod. 2017, 172, 274–286. [Google Scholar] [CrossRef]
  18. European Commission. Study on the Review of the List of Critical Raw Materials. Available online: https://publications.europa.eu/en/publication-detail/-/publication/08fdab5f-9766-11e7-b92d-01aa75ed71a1/language-en (accessed on 12 June 2018).
  19. Oliveira, L.; Messagie, M.; Rangaraju, S.; Sanfelix, J.; Rivas, M.H.; Van Mierlo, J. Key issues of lithium-ion batteries—From resource depletion to environmental performance indicators. J. Clean Prod. 2015, 108, 354–362. [Google Scholar] [CrossRef]
  20. Ciez, R.E.; Whitacre, J.F. The cost of lithium is unlikely to upend the price of Li-ion storage systems. J. Power Sources 2016, 320, 310–313. [Google Scholar] [CrossRef] [Green Version]
  21. European Commission. Critical Raw Materials Factsheets. Available online: https://publications.europa.eu/en/publication-detail/-/publication/7345e3e8-98fc-11e7-b92d-01aa75ed71a1/language-en (accessed on 12 June 2018).
  22. Gopalakrishnan, R.; Goutam, S.; Oliveira, M.L.; Timmermans, J.M.; Omar, N.; Messagie, M.; Van den Bossche, P.; van Mierlo, J. A comprehensive study on rechargeable energy storage technologies. J. Electrochem. Energy Convers. Storage 2017, 13, 040801. [Google Scholar] [CrossRef]
  23. ISO. Environmental Management—Life Cycle Assessment—Principles and Framework, ISO 14040:2006. Available online: https://www.iso.org/standard/37456.html (accessed on 28 May 2018).
  24. Nelson, P.A.; Gallagher, K.G.; Bloom, I.; Dees, D.; Ahmed, S. BatPac version 3.1. Available online: http://www.cse.anl.gov/batpac/about.html (accessed on 28 May 2018).
  25. Cox, B.; Mutel, C.L.; Bauer, C.; Beltran, A.M.; van Vuuren, D.P. Uncertain environmental footprint of current and future battery electric vehicles. Environ. Sci. Technol. 2018, 52, 4989–4995. [Google Scholar] [CrossRef]
  26. Richa, K.; Babbitt, C.W.; Nenadic, N.G.; Gaustad, G. Environmental trade-offs across cascading lithium-ion battery life cycles. Int. J. Life Cycle Assess 2017, 22, 66–81. [Google Scholar] [CrossRef]
  27. Deng, Y.; Li, J.; Li, T.; Zhang, J.; Yang, F.; Yuan, C. Life cycle assessment of high capacity molybdenum disulfide lithium-ion battery for electric vehicles. Energy 2017, 123, 77–88. [Google Scholar] [CrossRef]
  28. Deng, Y.; Li, J.; Li, T.; Gao, X.; Yuan, C. Life cycle assessment of lithium sulfur battery for electric vehicles. J. Power Sources 2017, 343, 284–295. [Google Scholar] [CrossRef]
  29. Sanfélix, J. Multiregional Input-Output Life Cycle Analysis of a Battery Pack for Electric Vehicle Applications; VUB PRESS: Brussel, Belgium, 2015; ISBN 978-9-4619734-7-4. [Google Scholar]
  30. Ellingsen, L.A.W.; Majeau-Bettez, G.; Singh, B.; Srivastava, A.K.; Valøen, L.O.; Strømman, A.H. Life cycle assessment of a lithium-ion battery vehicle pack. J. Ind. Ecol. 2014, 18, 113–124. [Google Scholar] [CrossRef]
  31. Li, B.; Gao, X.; Li, J.; Yuan, C. Life cycle environmental impact of high-capacity lithium ion battery with silicon nanowires anode for electric vehicles. Environ. Sci. Technol. 2014, 48, 3047–3055. [Google Scholar] [CrossRef]
  32. Majeau-Bettez, G.; Hawkins, T.R.; Strømman, A.H. Life cycle environmental assessment of lithium-ion and nickel metal hydride batteries for plug-in hybrid and battery electric vehicles. Environ. Sci. Technol. 2011, 45, 4548–4554. [Google Scholar] [CrossRef]
  33. Notter, D.A.; Gauch, M.; Widmer, R.; Wäger, P.; Stamp, A.; Zah, R.; Althaus, H.J. Contribution of Li-ion batteries to the environmental impact of electric vehicles. Environ. Sci. Technol. 2010, 44, 6550–6556. [Google Scholar] [CrossRef] [PubMed]
  34. Zackrisson, M.; Avellán, L.; Orlenius, J. Life cycle assessment of lithium-ion batteries for plug-in hybrid electric vehicles—Critical issues. J. Clean Prod. 2010, 18, 1517–1527. [Google Scholar] [CrossRef]
  35. Benavides, P.T.; Dai, Q.; Kelly, J.; Dunn, J.B. Addition of Nickel Cobalt Aluminum (NCA) Cathode Material to GREET2. Available online: https://greet.es.anl.gov/publication-NCA-Cathode-2016 (accessed on 28 May 2018).
  36. Gediga, J.; Sandilands, J.; Roomanay, N.; Boonzaier, S. Life Cycle Assessment of Nickel Products. Study Commissioned by the Nickel Institute. Available online: https://www.nickelinstitute.org/policy/nickel-life-cycle-management/nickel-life-cycle-data/ (accessed on 28 May 2018).
  37. Schmidt, T.; Buchert, M.; Schebek, L. Investigation of the primary production routes of nickel and cobalt products used for Li-ion batteries. Resour. Conserv. Recycl. 2016, 112, 107–122. [Google Scholar] [CrossRef]
  38. Wood, W.; Lee, D.; Frenzel, J.; Wandera, D.; Spitz, D.; Wimer, A.; Waterhouse, R.; Pekala, R.W. Structure-Property Relationships of Ceramic-Modified Separators. Available online: http://static.entek.com/160323CeramicModifiedSeparators-Final.pdf (accessed on 28 May 2018).
  39. Zubi, G.; Dufo-López, R.; Carvalho, M.; Pasaoglu, G. The lithium-ion battery: State of the art and future perspectives. Renew. Sustain. Energy Rev. 2018, 89, 292–308. [Google Scholar] [CrossRef]
  40. U.S. Department of the Interior, U.S. Geological Survey. Mineral Commodity Summaries 2017: U.S. Geological Survey. Available online: https://minerals.usgs.gov/minerals/pubs/mcs/2017/mcs2017.pdf (accessed on 28 May 2018).
  41. The London Metal Exchange. LME EV Battery Materials. Available online: https://www.lme.com/Trading/New-initiatives/Electric-Vehicle-Battery-Materials (accessed on 28 May 2018).
  42. Nelson, P.A.; Gallagher, K.G.; Bloom, I.; Dees, D.W. Modeling the Performance and Cost of Lithium-Ion Batteries for Electric-Drive Vehicles. Available online: http://www.cse.anl.gov/batpac/files/BatPaC ANL-12_55.pdf (accessed on 24 May 2018).
  43. The Conference Board. International Comparisons of Hourly Compensation Costs in Manufacturing, 2016 —Summary Tables. Available online: https://www.conference-board.org/ilcprogram/index.cfm?id=38269 (accessed on 23 August 2018).
  44. Eurostat. Hourly Labour Costs. Available online: http://ec.europa.eu/eurostat/statistics-explained/index.php/Hourly_labour_costs (accessed on 21 August 2018).
  45. Neal, T.; Rawlinson, S. International Construction Cost Report. Available online: https://www.arcadis.com/media/3/2/5/%7B325E15B1-332B-45FB-A70A-6115404D36B9%7D9110R_International Cost Construction Report.pdf (accessed on 30 October 2018).
  46. Eurostat. Harmonised Index of Consumer Prices. Available online: http://appsso.eurostat.ec.europa.eu/nui/show.do?query=BOOKMARK_DS-055100_QID_-6581D607_UID_-3F171EB0&layout=TIME,C,X,0;GEO,L,Y,0;UNIT,L,Z,0;COICOP,L,Z,1;INDICATORS,C,Z,2;&zSelection=DS-055100UNIT,INX_A_AVG;DS-055100COICOP,CP00;DS-055100INDICATORS,OBS_FLAG (accessed on 23 August 2018).
  47. National Bureau of Statistics of China. National Data. Available online: http://data.stats.gov.cn/english/easyquery.htm?cn=C01 (accessed on 23 August 2018).
  48. Bureau of Labor Statistics. Databases, Tables and Calculators by Subject. Available online: https://data.bls.gov/pdq/SurveyOutputServlet (accessed on 24 August 2018).
  49. Statistics Korea. Prices. Available online: http://kostat.go.kr/portal/eng/pressReleases/9/1/index.board (accessed on 23 August 2018).
  50. Frankel, D.; Wagner, A. Battery Storage: The Next Disruptive Technology in the Power Sector. Available online: https://www.mckinsey.com/business-functions/sustainability/our-insights/battery-storage-the-next-disruptive-technology-in-the-power-sector (accessed on 31 October 2018).
  51. The Boston Consulting Group. Batteries for Electric Cars. Challenges, Opportunities, and the Outlook to 2020. Available online: https://www.bcg.com/documents/file36615.pdf (accessed on 18 June 2018).
  52. Philippot, M.; Smekens, J.; Van Mierlo, J.; Messagie, M. Life cycle assessment of silicon alloy based lithium-ion battery for electric vehicles. In WIT Transactions on The Built Environment; WIT Press: Southampton, UK, 2018. [Google Scholar]
  53. Kim, H.C.; Wallington, T.J.; Arsenault, R.; Bae, C.; Ahn, S.; Lee, J. Cradle-to-gate emissions from a commercial electric vehicle li-ion battery: A comparative analysis. Environ. Sci. Technol. 2016, 50, 7715–7722. [Google Scholar] [CrossRef]
  54. US Energy Information Administration. Levelized Cost and Levelized Avoided Cost of New Generation Resources in the Annual Energy Outlook 2018. Available online: http://www.eia.gov/outlooks/aeo/assumptions/ (accessed on 3 September 2018).
  55. Peters, J.F.; Weil, M. Providing a common base for life cycle assessments of Li-Ion batteries. J. Clean Prod. 2017, 171, 704–713. [Google Scholar] [CrossRef]
  56. Gaines, L.; Burnham, A.; Gaines, L.; Belharouak, I. Life-Cycle Analysis for Lithium-Ion Battery Production and Recycling Paper. Available online: https://www.researchgate.net/publication/265158823_Paper_No_11-3891_Life-Cycle_Analysis_for_Lithium-Ion_Battery_Production_and_Recycling (accessed on 28 May 2018).
  57. Richa, K.; Babbitt, C.W.; Gaustad, G. Eco-efficiency analysis of a lithium-ion battery waste hierarchy inspired by circular economy. J. Ind. Ecol. 2017, 21, 715–730. [Google Scholar] [CrossRef]
  58. Sanfélix, J.; de la Rúa, C.; Schmidt, J.H.; Messagie, M.; Van Mierlo, J. Environmental and economic performance of an li-ion battery pack: A multiregional input-output approach. Energies 2016, 9, 584. [Google Scholar] [CrossRef]
  59. Marmiroli, B.; Messagie, M.; Dotelli, G.; Van Mierlo, J. Electricity generation in lca of electric vehicles: A review. Appl. Sci. 2018, 8, 1384. [Google Scholar] [CrossRef]
  60. International Energy Agency (IEA). Projected Costs of Generating Electricity 2015 Edition. Available online: http://www.iea.org/publications/freepublications/publication/ElecCost2015.pdf (accessed on 3 September 2018).
Figure 1. Cell manufacturing energy in the literature. The grey box shows the quartiles.
Batteries 05 00023 g001
Figure 2. Commodity yearly price from 1990 to 2017.
Batteries 05 00023 g002
Figure 3. Active material price and share of aluminum, cobalt, nickel, and lithium hydroxide.
Batteries 05 00023 g003
Figure 4. Cell material cost for cells manufactured in Korea, with an average cathode active material price of 33 $/kg.
Batteries 05 00023 g004
Figure 5. Cost of a 20-kWh pack manufactured in Korea for a range of NCA active material costs.
Batteries 05 00023 g005
Figure 6. Cradle-to-gate greenhouse gas (GHG) emissions of a pack manufactured in Korea in an average capacity plant. BMS: battery management system.
Batteries 05 00023 g006
Figure 7. Greenhouse gas (GHG) emissions of a NCA pack manufactured in several countries.
Batteries 05 00023 g007
Figure 8. Manufacturing eco-efficiency of a NCA battery pack for electric vehicles (EVs) (circles are for small production volume, triangles are for high production volume, empty symbols are for minimum energy consumption, crosses are for high production volume with a minimum energy consumption and a higher energy density).
Batteries 05 00023 g008
Table 1. Mass repartition of the cell.
ComponentWeightMass Share
Positive electrode paste25.19 g37.58%
Negative electrode paste15.66 g23.37%
Separator1.31 g1.95%
Substrate, positive electrode1.75 g2.61%
Substrate, negative electrode4.79 g7.15%
Electrolyte6.47 g9.65%
Cell container, tab, and terminals11.85 g17.68%
Table 2. Key parameters for manufacturing countries. USA: United States.
CountryCost of Building (€/m2)Labor Cost (€/h)
China19503.1
France439038.1
Germany402039.4
Korea281017
Poland20609.1
Sweden475041.1
USA363613.1
Table 3. Cost repartition of a 20-kWh lithium nickel cobalt aluminium oxide (NCA) pack manufactured in Korea with an average cathode active material price.
Cost ItemCost Contribution
Annual cell production volume (cells)7 × 1071 × 1085 × 1081 × 1092 × 109
Factory capacity (GWh)1.21.78.717.434.8
Materials and purchased items64%66%72%74%77%
Direct labor4%4%2%2%2%
Variable overhead3%3%2%2%2%
General, sales, administration4%4%3%3%2%
Research and development4%3%3%3%2%
Depreciation9%9%7%6%6%
Profit6%6%5%5%4%
Warranty5%5%5%5%5%
Table 4. GHG emissions of a NCA pack manufactured in Korea in plants of different sizes. CC: climate change.
Annual Cell Production Volume (cells)7 × 1071 × 1085 × 1081 × 1092 × 109
Impact on CC (kg CO2 eq/kWh)168157123114107

