Article

Microstructure Investigation on Metal Hydride Alloys by Electron Backscatter Diffraction Technique

1
Department of Chemistry, Wayne State University, Detroit, MI 48201, USA
2
Department of Chemical Engineering and Materials Science, Wayne State University, Detroit, MI 48202, USA
3
BASF/Battery Materials-Ovonic, 2983 Waterview Drive, Rochester Hills, MI 48309, USA
*
Author to whom correspondence should be addressed.
Batteries 2016, 2(3), 26; https://doi.org/10.3390/batteries2030026
Submission received: 28 April 2016 / Revised: 5 July 2016 / Accepted: 18 July 2016 / Published: 1 August 2016
(This article belongs to the Special Issue Nickel Metal Hydride Batteries)

Abstract

:
The microstructures of two metal hydride (MH) alloys, a Zr7Ni10 based Ti15Zr26Ni59 and a C14 Laves phase based Ti12Zr21.5V10Ni36.2Cr4.5Mn13.6Sn0.3Co2.0Al0.4, were studied using the electron backscatter diffraction (EBSD) technique. The first alloy was found to be composed of completely aligned Zr7Ni10 grains with a ZrO2 secondary phase randomly scattered throughout and a C15 secondary phase precipitated along the grain boundary. Two sets of orientation alignments were found between the Zr7Ni10 grains and the C15 phase: (001)Zr7Ni10A//(110)C15 and [100]Zr7Ni10A//[0 1 ¯ 1]C15, and (01 1 ¯ )Zr7Ni10B//( 1 ¯ 00)C15 and [100]Zr7Ni10B//[313]C15. The grain growth direction is close to [313]Zr7Ni10B//[ 1 ¯ 11]C15. The second alloy is predominated by a C14 phase, as observed from X-ray diffraction analysis. Both the matrix and dendrite seen through a scanning electron microscope arise from the same C14 structure with a similar chemical composition, but different orientations, as the matrix with the secondary phases in the form of intervening Zr7Ni10/Zr9Ni11/(Zr,Ni)Ti needle-like phase coated with a thin layer of C15 phase. The crystallographic orientation of the C15 phase is in alignment with the neighboring C14 phase, with the following relationships: (111)C15//(0001)C14 and [1 1 ¯ 0]C15//[11 2 ¯ 0]C14. The alignments in crystallographic orientations among the phases in these two multi-phase MH alloys confirm the cleanliness of the interface (free of amorphous region), which is necessary for the hydrogen-storage synergetic effects in both gaseous phase reaction and electrochemistry.

Graphical Abstract

1. Introduction

Nickel/metal hydride (Ni/MH) batteries have been the choice of energy storage medium for powering hybrid electric vehicles (HEVs) over the past fifteen years due to their unmatched safety record and durable cycle life. Facing challenges from other emerging battery technologies, further improvement in Ni/MH battery performance is needed, especially with regard to energy density. While potential improvement in the positive electrode (nickel hydroxide) is limited, the hope of improving the energy density falls to the negative electrode. Laves phase based metal hydride (MH) AB2 alloys have a great potential in gravimetric specific energy, compared to currently used AB5 alloys [1,2,3,4,5]. A Mn-rich AB2 MH alloy (Ti0.9Zr0.1Mn1.6Ni0.4) with the electrochemical capacity of 438 mAh·g−1 after 150 formation cycles has been reported [6]. Another Ni-rich AB2 MH alloy, Ti0.62Zr0.38V0.41Cr0.30Mn0.36Ni0.89, exhibited a discharge capacity of 424 mAh·g−1 after activation in a 30% KOH bath at 110 °C for 4.5 h [7]. These capacity values are 40% higher than the 320 mAh·g−1 found in commercially available AB5 alloys. Although higher in energy density, Laves phase based AB2 MH alloys have lower nickel content in their chemical compositions due to the lower B/A ratio of 2, compared to 5 for AB5 alloys. This deficiency in nickel makes AB2 less catalytic in electrochemical reactions [8]. One way to improve the electrochemical performance in AB2 alloys is through the introduction of minor secondary phases. Through synergetic effects between neighboring phases, the electrochemical properties of the multi-phase AB2 alloys can be much improved [9,10,11,12]. Therefore, investigation of the primary/secondary phase interactions can provide very important insight in this area. We have previously reported results from studies of the synergetic effects in gaseous phase hydrogen storage [13], electrochemical charge/discharge [14], and a comparison between the two [15]. In both gaseous phase and electrochemistry, a “coherent” interface (free from amorphous, highly defective, and other interruptive region in between two different phases) was proposed to diffuse hydrogen and protons, and transfer stress from the hydrogenated side to the un-hydrogenated side (Figure 1). A few analytical works have been used to study the microstructure of the interface between the matrix and minor phases. Akiba and Iba [16,17] reported a microstructure between C14 and body-centered-cubic (bcc) phases by scanning electron microscopy (SEM). Chen and her coworkers reported the alignment in crystallographic orientations between the C15 and bcc phases [18]. Song and his coworkers [19,20,21] reported the microstructures among the C14, C15, (Zr,Ti)Ni, and Zr9Ni11 phases. Shi and his coworkers [22] reported the crystallographic orientation alignment between the C14 and C15 phases. In addition, C14, face-centered-cubic (fcc), and bcc phases were also examined by Shibuya et al. [23]. The microstructures of the secondary phases in AB2 MH alloys, including Zr7Ni10, Zr9Ni11, and TiNi, were studied by SEM and transmission electron microscopy (TEM) by Boettinger, Bendersky, and their coworkers [24,25].
Electron backscatter diffraction (EBSD), also known as backscatter Kikuchi diffraction or orientation imaging microscopy (OIM), is a microstructural-crystallographic technique that examines the crystallographic orientation of the constituent phases in a polycrystalline material. Combined with information of the chemical composition from X-ray energy dispersive spectroscopy (EDS), the capabilities of both techniques can be enhanced, including insight into the microstructure study of grains with mixed compositions and orientations [28]. In the past, we had employed EBSD in a study of Zr7Ni10 based MH alloys [29], but the details regarding the crystallographic orientations were not discussed. We have also employed this technique to show the clean grain boundary in the C14/bcc multi-phase MH alloys [30]. In this paper, we further explore the strength of EBSD to study the crystallographic connection between the main and secondary phases of two MH alloys.

2. Experimental Setup

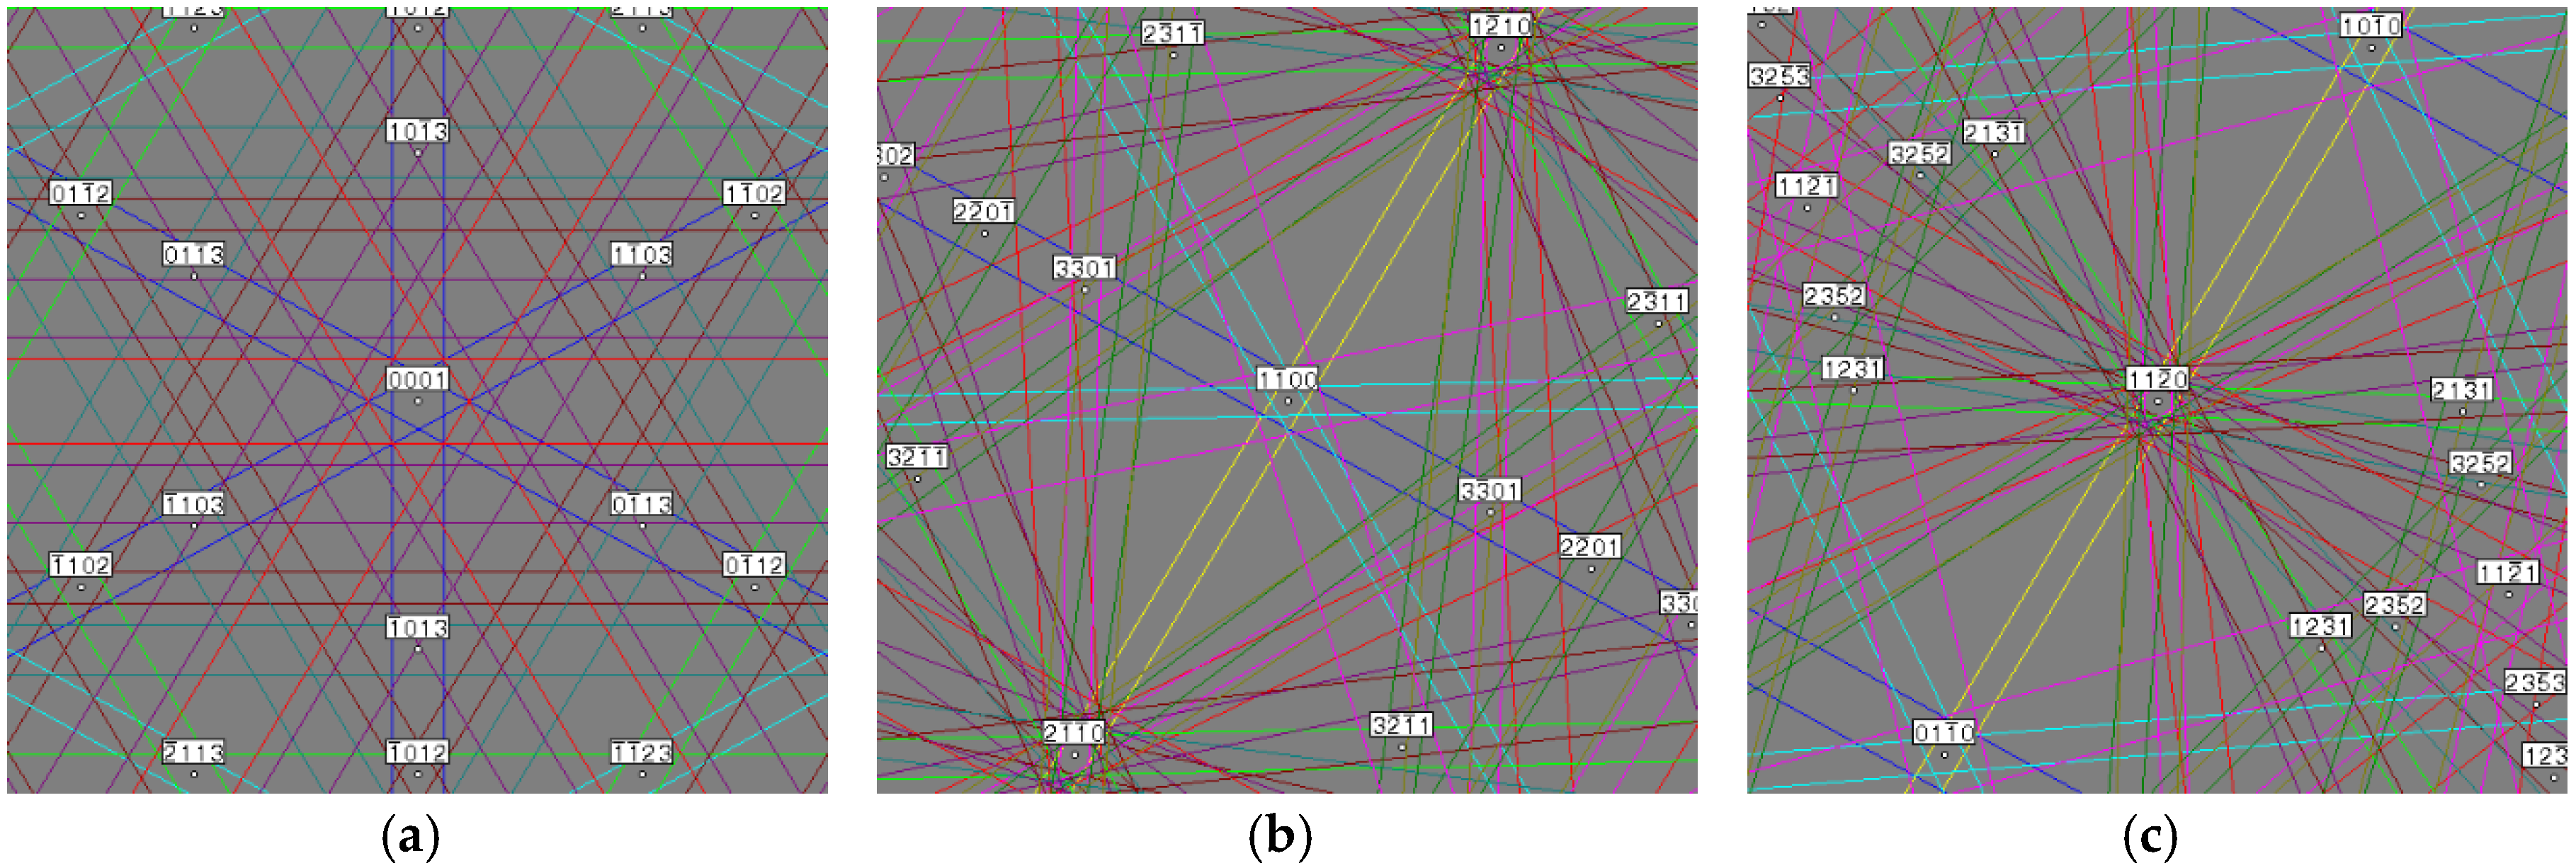
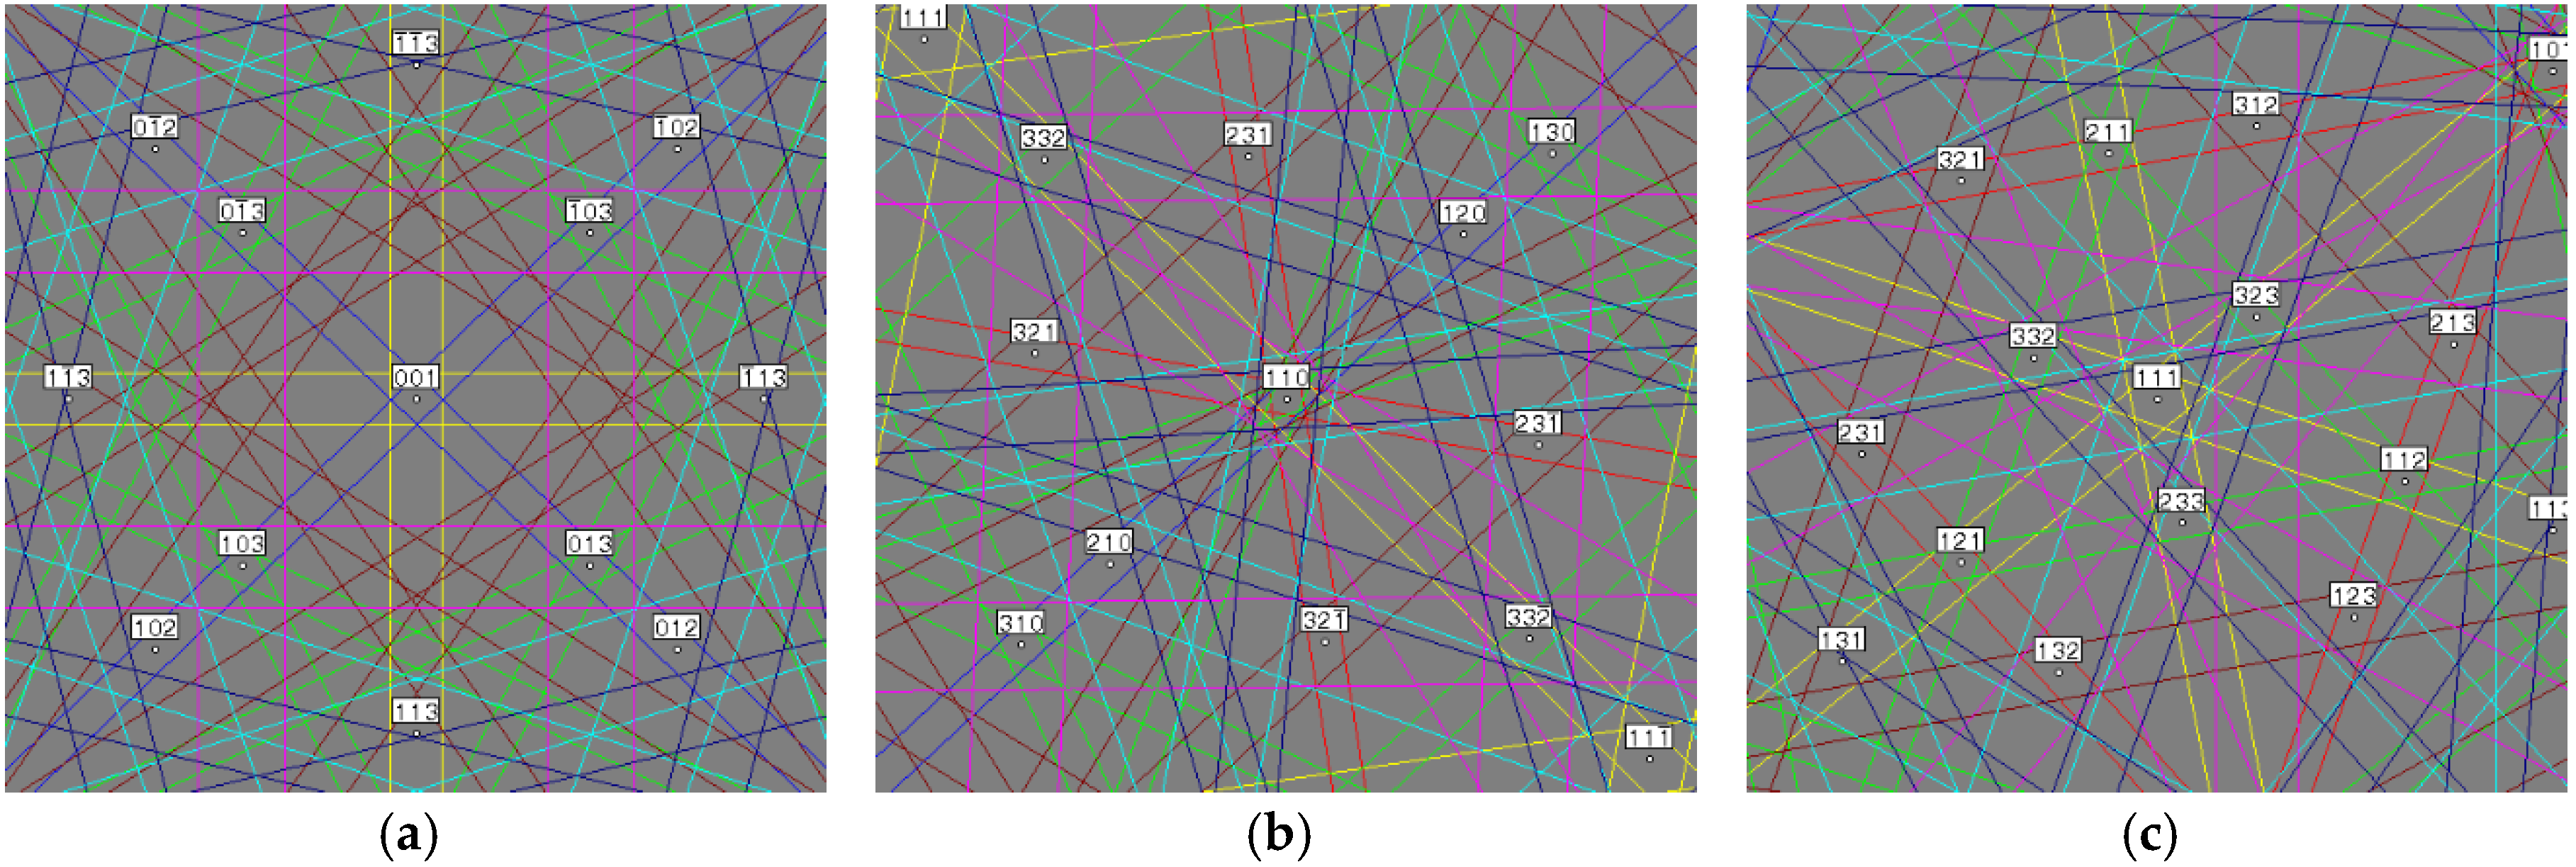
Ingot samples were prepared by induction melting under an argon atmosphere in a 2 kg induction melting furnace using an MgAl2O4 crucible, an alumina tundish, and a steel pancake-shaped mold. A Philips X’Pert Pro X-ray diffractometer (XRD, Philips, Amsterdam, The Netherlands) was used to study the constituent phases in the samples. A piece of the ingot was cut off and went through a series of mechanical polishes. Final polishing was conducted by soaking the sample in a 0.05 μm silica colloidal suspension for several hours. It has been demonstrated that samples mechanically polished in this way show high quality Kikuchi patterns obtained by EBSD. The sample was observed using a backscattered electron (BSE) detector to show the contrast of different phases under a Hitachi S-2400 SEM (Hitachi High-Technologies Corp., Tokyo, Japan) equipped with EDS (EDAX Inc., Mahwah, NJ, USA) and EBSD/OIM systems. Diffraction patterns (Kikuchi patterns) were obtained by the EBSD system, which was attached to the SEM. The EBSD system was made by HKL Technology (Hobro, Denmark, now merged with Oxford Instruments, Inc., Abingdon, UK). The C14 phase exhibited an MgZn2 type crystal structure with space group P63/mmc (#194), while C15 phase has the MgCu2 type crystal structure with space group Fd3m (#227). Acquired using the EBSD pattern acquisition Software Flamenco 5.0 (Oxford Instruments Inc., Abingdon, UK), the computer simulated EBSD patterns for the C14 and C15 crystal structures are illustrated in Figure 2 and Figure 3, respectively. The main differences between the two sets of EBSD patterns are: a four-fold symmetry exists in the (100) pole of the C15 (cubic) structure (Figure 3a) but not in the C14 (hexagonal) structure; [1 1 ¯ 0] bands near the (110) pole of the C15 structure (yellow lines connecting poles (110) and (111) in Figure 3b) but not in the equivalent (1 1 ¯ 00) plane in the C14 structure (Figure 2b); and [3 1 ¯ 3 ¯ ] bands near the (111) pole of the C15 structure (pink lines connecting poles (231) and (332) in Figure 3c) but not in the equivalent (0001) projection in the C14 structure (Figure 2a). The operating voltage was 25 kV. Local chemical compositions were analyzed by EDS. Statistical analysis on the microstructure was performed by using “Scion Image”, which is the PC version of the free software “NIH Image” (Scion Corp., Frederick, MD, USA) [31].

3. Results

Two multi-phase MH alloys were chosen for this study. Their structures and hydrogen storage properties are summarized in Table 1 based on previous studies [29,32]. The first alloy (ZN06) is from a Zr7Ni10 based alloy family targeted to increase storage capacities [29]. The second alloy (AB2#2) is from a group of 33 high-performance AB2 alloys prepared for composition optimization [32]. Although these alloys are not the most optimized, their simpler structures make them better candidates for the EBSD studies.

3.1. Zr7Ni10-Based Alloy

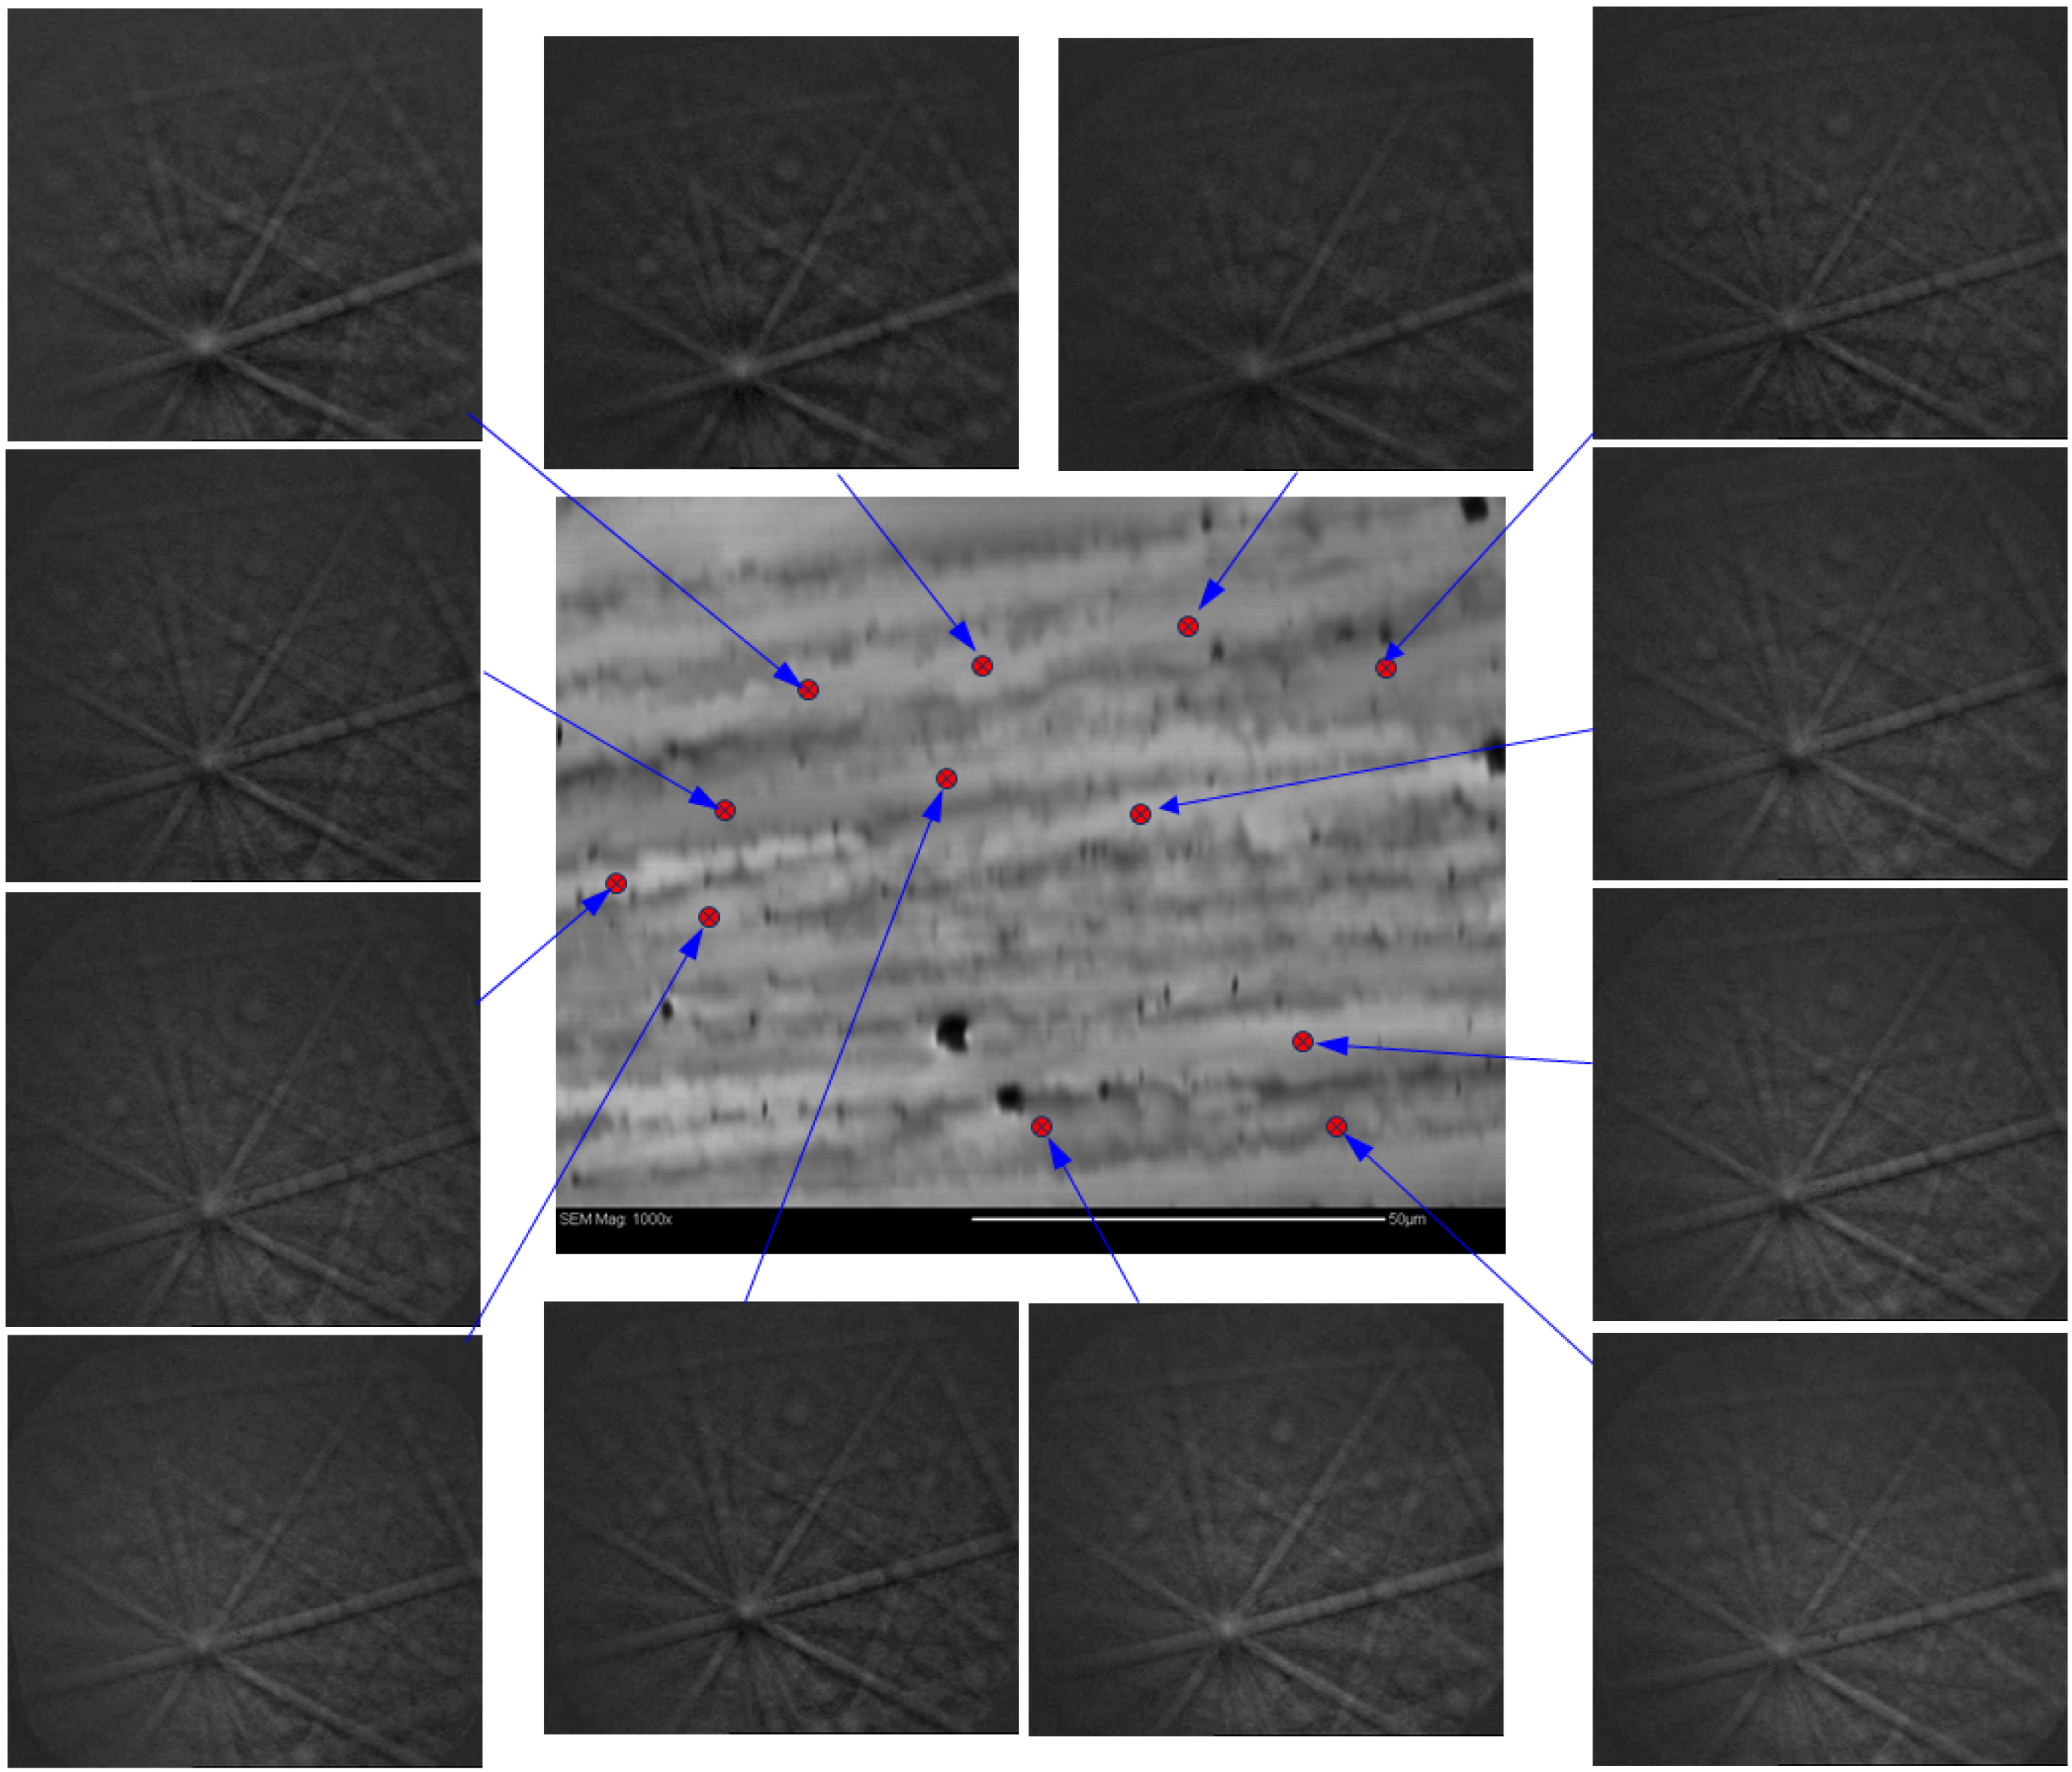
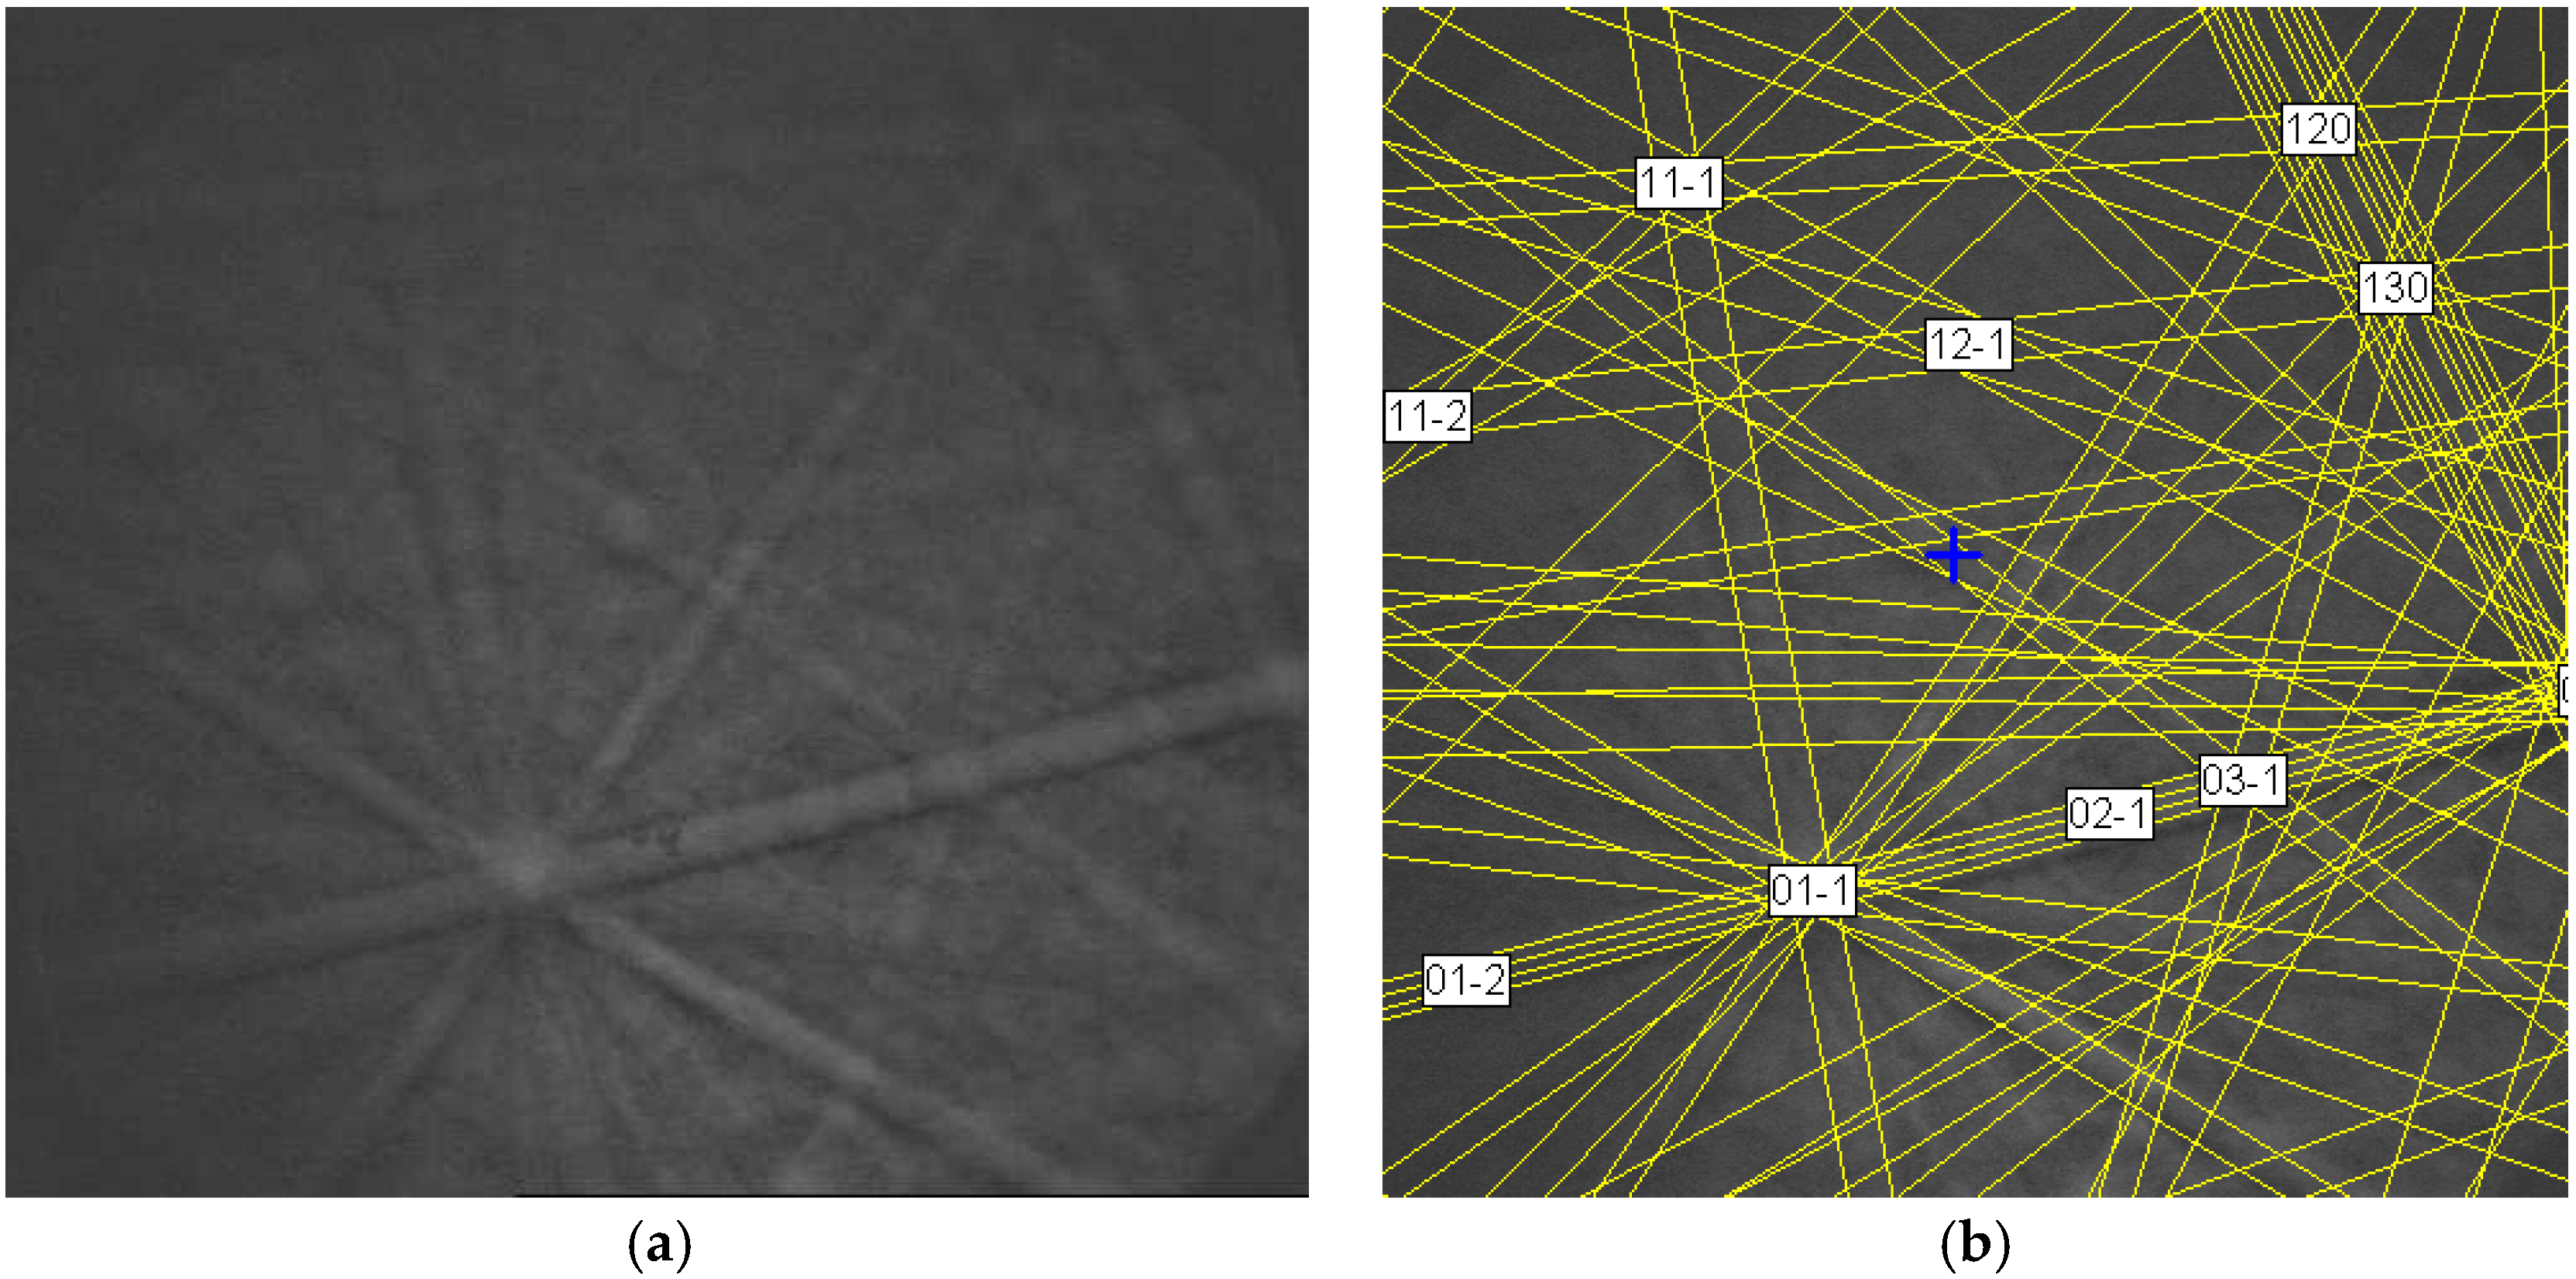
The ZN06 (Ti15Zr26Ni59) alloy from a previous study on TixZr7−xNi10 MH alloys [29] was chosen for further structural studies using the EBSD technique. XRD analysis indicates an orthorhombic Zr7Ni10 main phase and a C15 secondary phase (Figure 1 in [29]) in ZN06. A representative SEM-BSE image from the ZN06 alloy is shown in Figure 4. The main matrix showing different gray scale contrast is the Z7Ni10 phase. The dark areas at the grain boundary and black boulders are C15 and ZrO2 phases, respectively. The chemical compositions in the numbered areas (main matrix) in Figure 4 were analyzed by EDS and the results are listed in Table 2. The EDS technique is generally considered as only a semi-quantitative analytic tool and the results have to be interpreted carefully. The B/A ratios obtained using EDS (1.22–1.24) are well lower than the ideal Zr7Ni10 stoichiometry (B/A = 1.43). The composition range of Zr7Ni10 in the Zr-Ni binary phase diagram includes Zr content from 0.41 to 0.45, which corresponds to a B/A ratio of 1.22–1.44. The B/A ratios found in this study lie near the low end of the allowable solubility of the Zr7Ni10 phase. Small variations in the compositions listed in Table 2 can be observed. The standard deviation in % for Ti, Zr, and Ni-contents are 2.1, 1.0, and 0.24, respectively. Most of the deviations are in the A-site atoms, especially for Ti. The variation in contrasts, as seen from the BSE image in Figure 4, is electron channeling contrast (ECC) due to the different orientations of the grains. The difference in orientation of the grain is sometimes very little, but, due to diffraction, can cause very different contrast, even due to mis-orientation between sub-grains. In order to confirm the source of the contrast, EBSD patterns were taken from an area with laminated layers exhibiting various BSE contrasts, as shown in Figure 5. The crystallographic orientations of these areas align very well, which includes the possibility of the contrast originating from different orientations. A typical EBSD pattern and a computer generated index from a Zr7Ni10 phase are present in Figure 6 for reference.
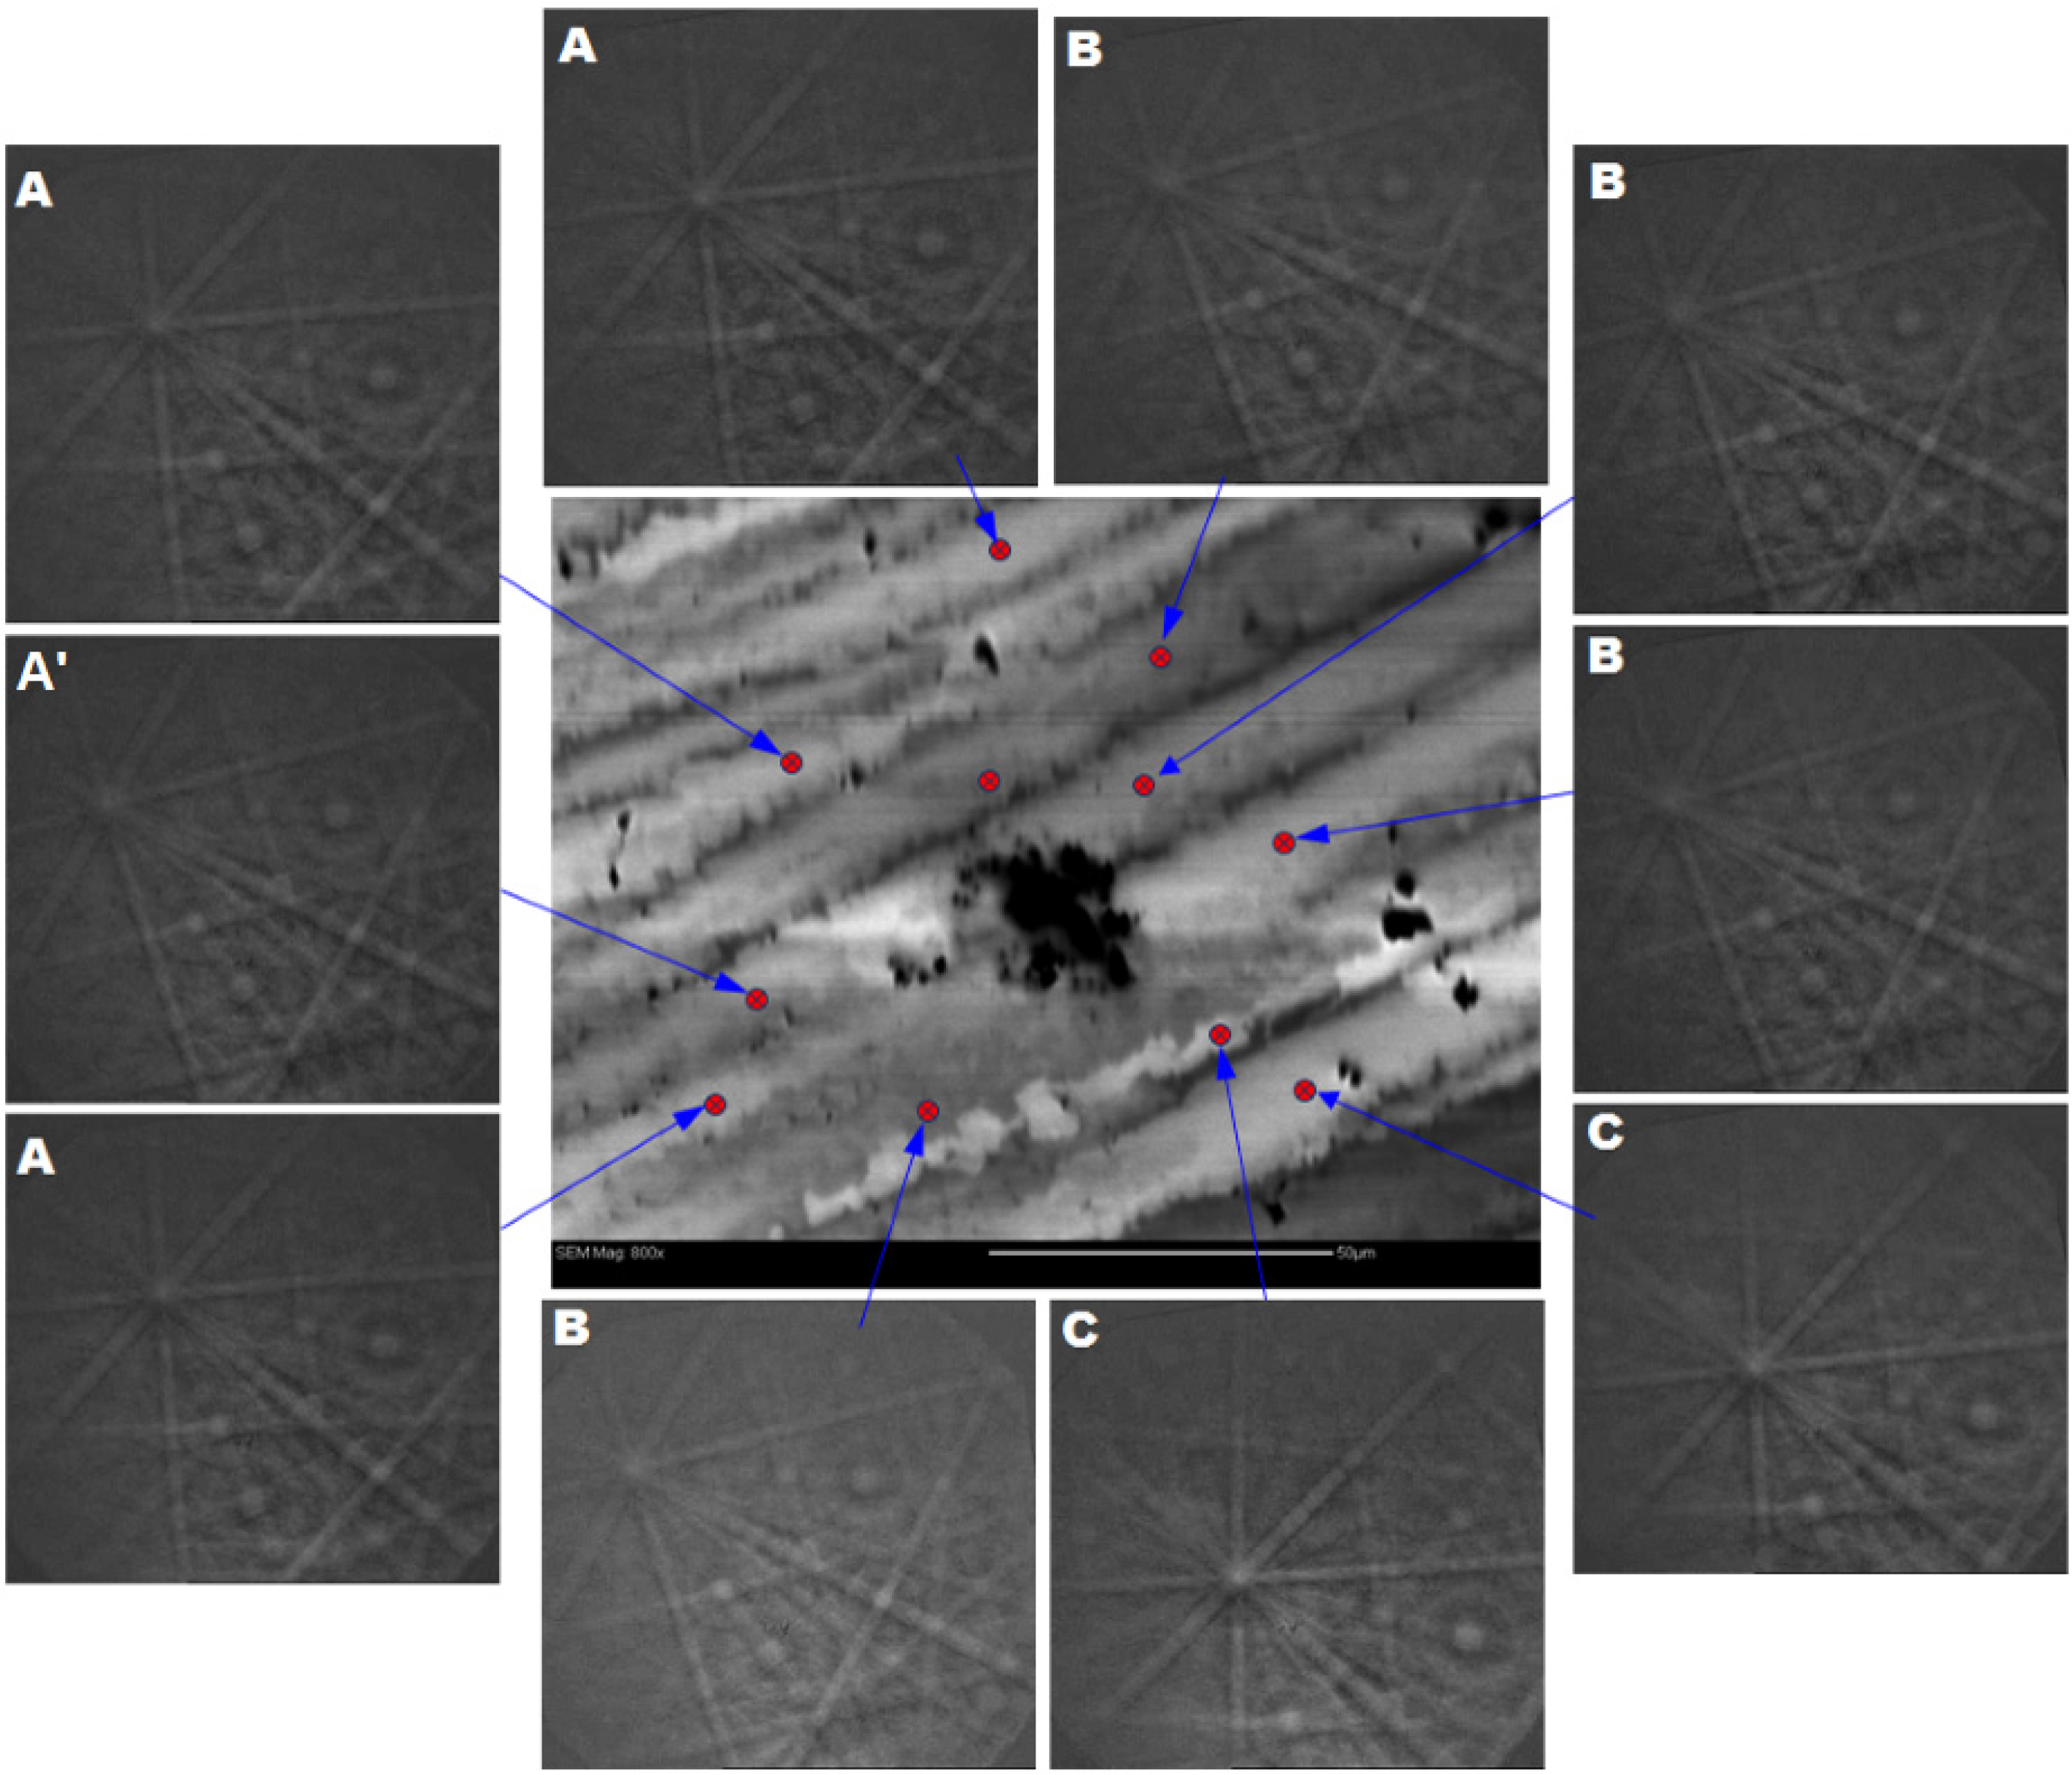
The SEM micrograph, together with the four EBSD patterns from two Zr7Ni10 phases, one C15 phase, and one ZrO2 phase are shown in Figure 5 in [29]. Eight more EBSD patterns from the Zr7Ni10 phase in the same area are presented in Figure 7. The Zr7Ni10 phase has an orthorhombic structure with space group Cmca (#64). There are three distinctive orientations (A, B, and C) for the Zr7Ni10 phase as shown in Figure 7. The orientations A and B deviate by only approximately 5° and the crystallographic orientation alignment between A and C is (29 3 ¯ )Orientation A//(01 1 ¯ )Orientation C and [313]Orientation A//[111]Orientation C. The alignments in the crystallographic orientation of Zr7Ni10 and C15 phases in Figure 5 in [29] are (01 1 ¯ )Zr7Ni10B//( 1 ¯ 00)C15 and [100]Zr7Ni10B//[313]C15, and (001)Zr7Ni10C // (110)C15 and [100]Zr7Ni10C//[0 1 ¯ 1]C15. The grain growth direction projected on the plane is close to: [313]Zr7Ni10B//[ 1 ¯ 11]C15.
From the crystallographic orientation alignments among Zr7Ni10 phases and between the Zr7Ni10 and C15 phases, the following solidification sequence is thought to occur during cooling. A Zr7Ni10 phase with the average composition in the liquid is solidified congruently first, and then the Ni-rich C15 phase (average composition of Ti17Zr20Ni63 [29]) is formed at the grain boundary as a solid reaction, resulting in the Zr7Ni10 phase being pushed to be hypo-stoichiometric (average composition of Ti15Zr28Ni57 [29]). This is different from the C14-C15-B2 solidification sequence found in the Ti-Zr-Ni alloy, which is closer to B/A ~ 2.0 [24].

3.2. Laves Phase Based AB2 Alloy

A Laves phase based AB2 alloy with the composition Ti12Zr21.5V10Ni36.2Cr4.5Mn13.6Sn0.3Co2.0Al0.4 from a previous study (Alloy #2 in [32]) was chosen for the EBSD study. The B/A in this alloy is 1.99. The XRD pattern of this alloy (shown in Figure 1b in [32]) shows it is C14-dominant. SEM-BSE images of the same alloy at different magnifications, shown in Figure 8, also reveal the same dendritic microstructure. Through careful and long-time mechanical polishing with 0.05 μm silica colloidal, the sample surface is almost free of lattice distortion caused by deformations from mechanical polishing. In addition to the Z-contrast shown in [32], ECC becomes available. This is because the BSE signals due to ECC are from the top surface of the sample. The different contrasts shown in Figure 8 are channeling contrasts representing the mis-orientation of different dendritic crystals. Therefore, the additional contrast observed in Figure 8b is from the crystallographic mis-orientation. In addition to the contrast from dendritic microstructures in Figure 8b, a different type of area can be found, as indicated by the arrows (Figure 8b). Figure 8c shows a magnified image of a similar area, where needle-like phases can be seen. The average chemical compositions of these areas, as measured by EDS are listed in Table 3. The composition of the grey and dark areas are very similar. For example, the difference in Ni content is 1.9%, which is lower than the 4.5% in Ni content between the phases identified in [32]. From the ratio of A site atoms (Ti and Zr) and B site atoms (V, Cr, Mn, Co, and Ni), both the grey and dark areas approach an AB2 stoichiometry, while the needle-like secondary phase is closer to A7B9. There is no known intermetallic phase among the constituent elements matching an A7B9 stoichiometry, and, therefore, it can be considered as a mixture of a few possible intermetallic alloys. From a separate TEM study, it was found that this needle-like secondary phase was first solidified into a B2 structure and then decomposed into Zr7Ni10, Zr9Ni11, TiNi, and ZrNi phases through a solid-state chemical reaction [25]. By statistical analysis, the abundance of this mixture area is about 4.3% by volume fraction.
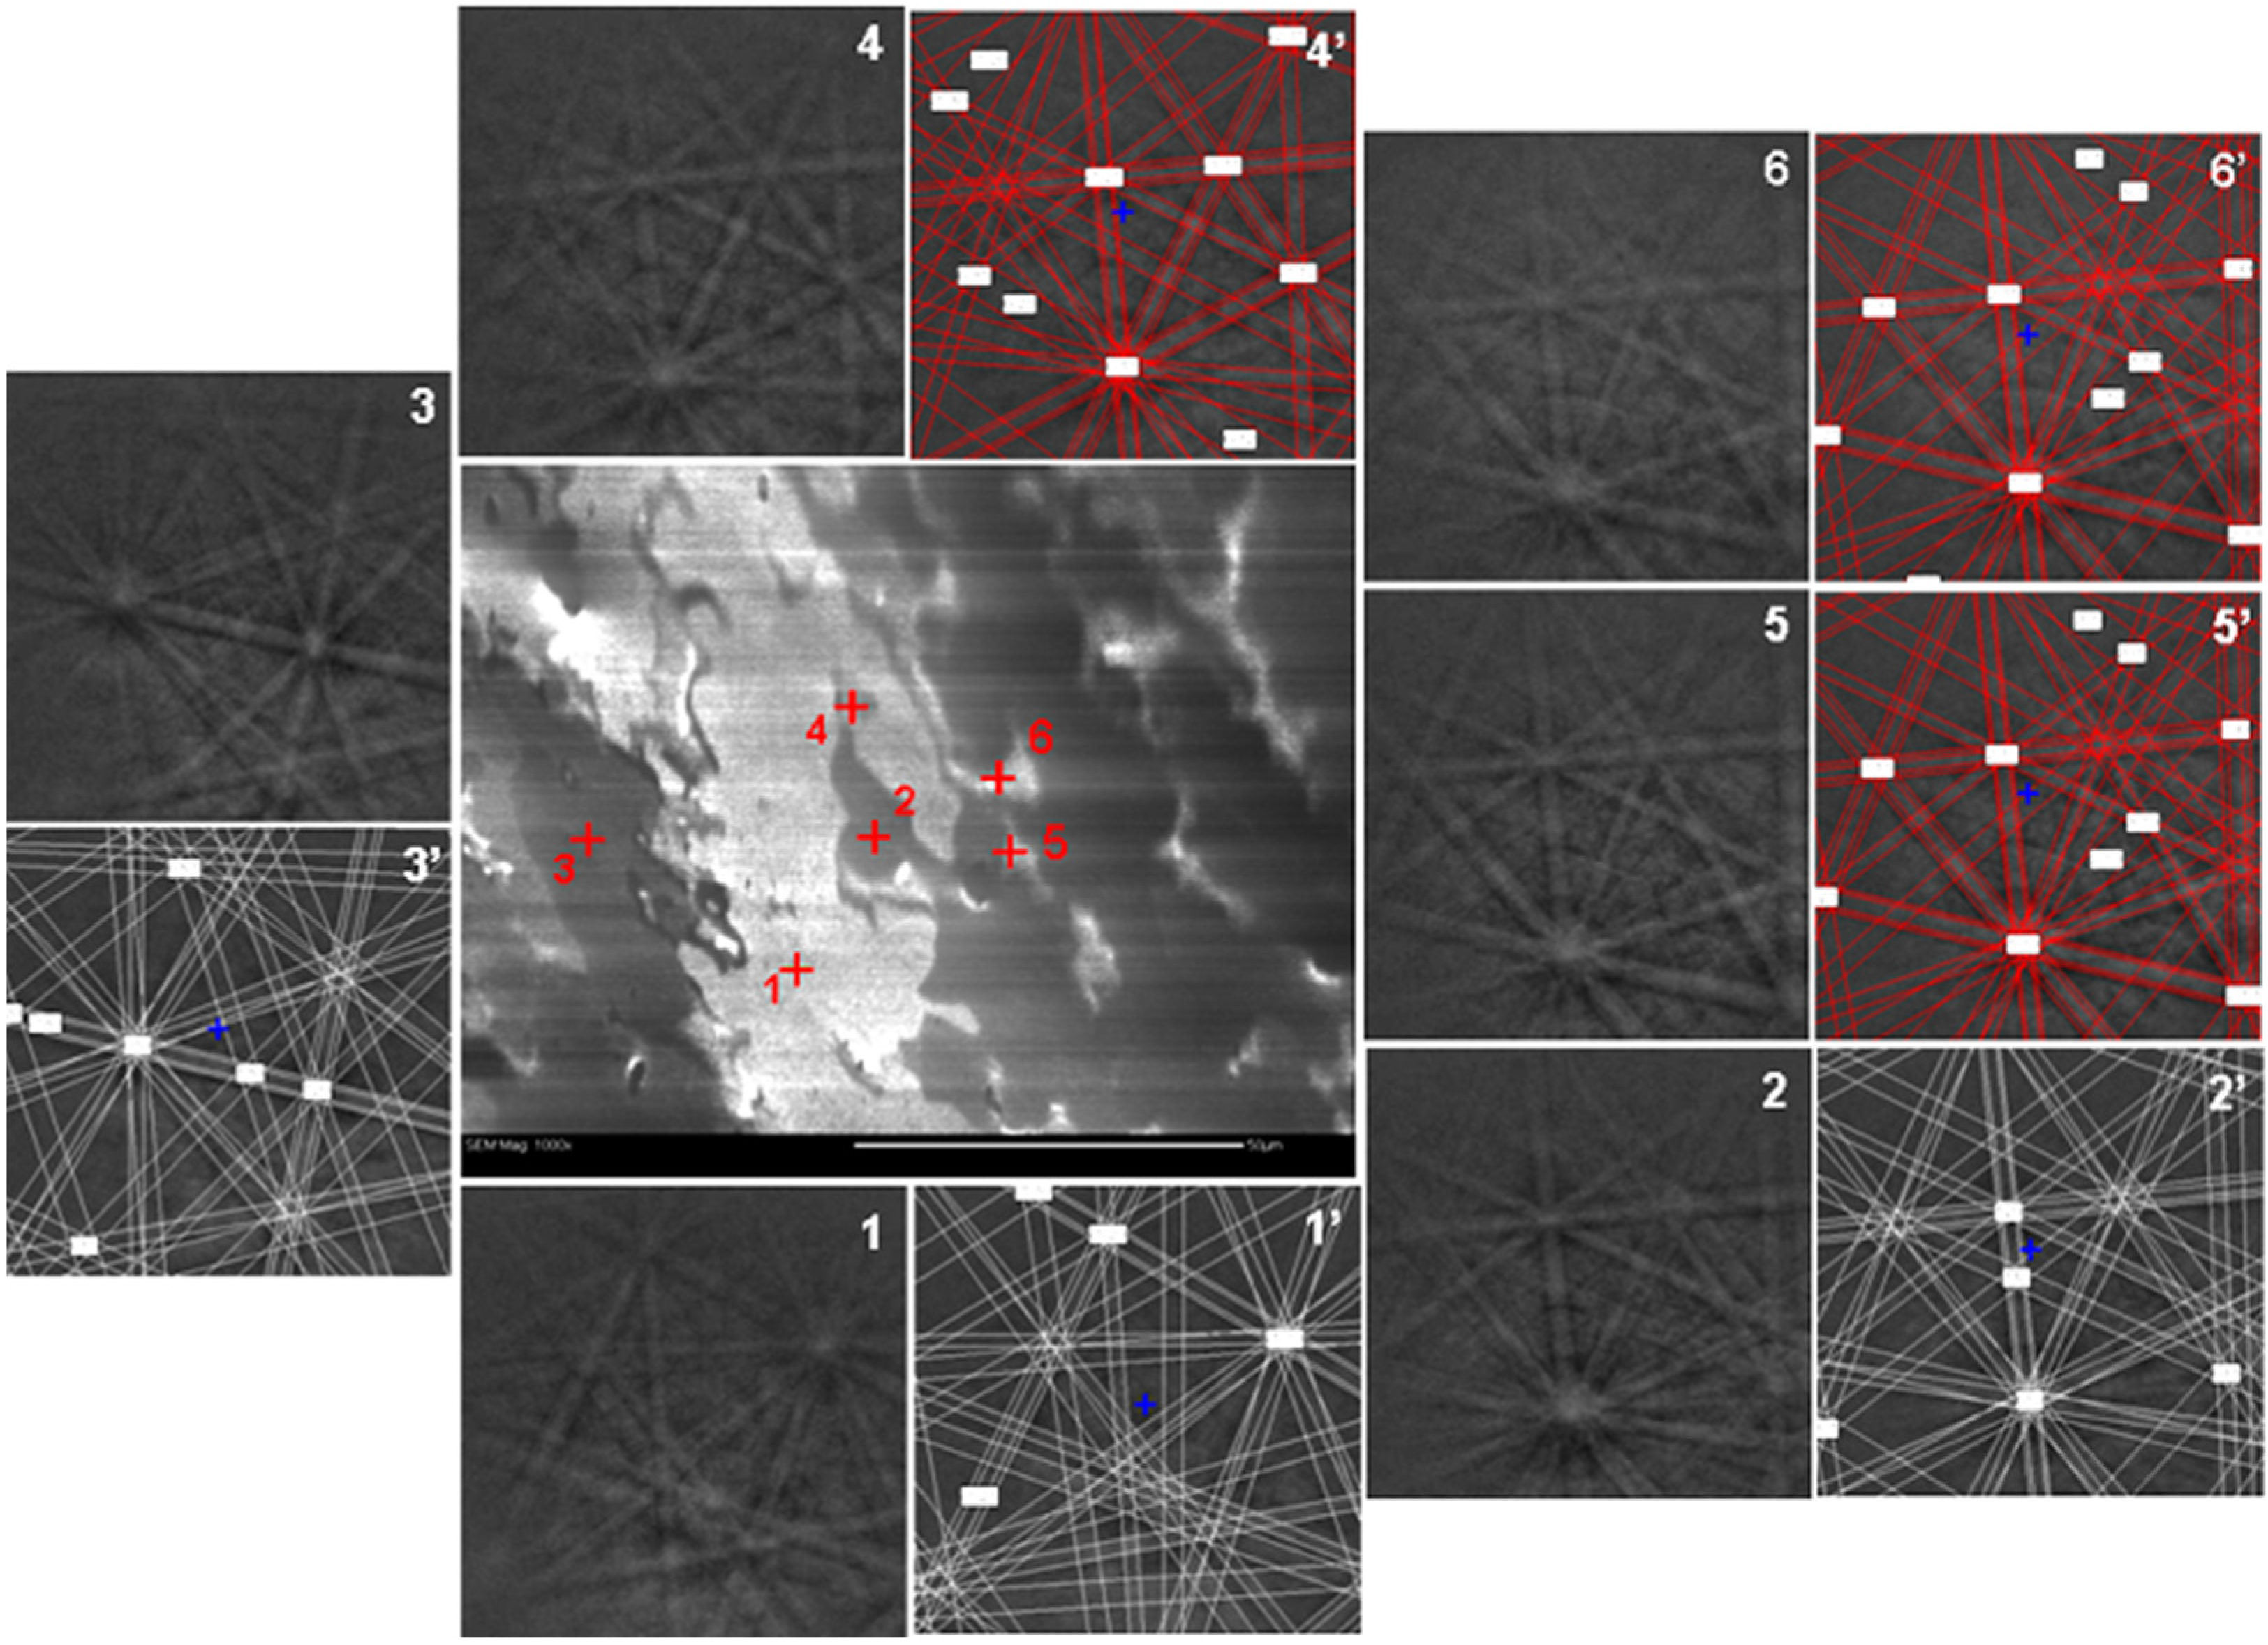
A dendrite microstructure usually forms due to a high cooling rate for alloy solidification, during which the nucleated grains may extend from the interface between the solid and liquid, and continue growing along the specific crystal orientations and along the temperature gradient, until the remaining area is solidified [33]. For this reason, the grains in the dendrite microstructure usually are sub-grains with close orientations that are different from the orientations of the matrix. This is the reason that the BSE images in Figure 8 show ECC between the dendritic area and the matrix, which was confirmed by obtaining EBSD patterns from different locations in the sample, as shown in Figure 9. The C14 phase has a hexagonal crystal structure and belongs to the P63/mmc space group [34], while the C15 phase has an fcc crystal structure and belongs to the Fd3m space group [35]. They are both AB2 type Laves phases, which are very common in intermetallic alloys. The C14/C15 ratio can be influenced by the A/B atomic radii ratio [36], difference in electronegativity [37], electron concentration [38], stress [39,40], and process conditions [41,42]. In Figure 9, it can also be seen that most of the area is occupied by the C14 Laves phase, while only small isolated areas contain the C15 Laves phase. Locations 1, 2, and 3 in Figure 9 were indexed as C14 Laves phase, having different crystallographic orientations, while Locations 4, 5, and 6 were assigned to the C15 Laves phase. It is interesting to discover that Locations 1, 2, and 3, all having the C14 structure with very similar chemical compositions but different orientations, gave such a large contrast in the BSE micrograph. The EBSD patterns from Locations 2, 4, 5, and 6 aligned very well with each other. The C15 and neighboring C14 phases are aligned, with the following relationships: (111)C15//(0001)C14 and [1 1 ¯ 0]C15//[11 2 ¯ 0]C14, which was reported before from TEM study [22,40]. The contrasts in Locations 4, 5, and 6 are similar to each other, but differ significantly from Location 2 (C14). Therefore, we conclude that both the structure and orientation contribute to the contrast observed in the BSE micrographs.
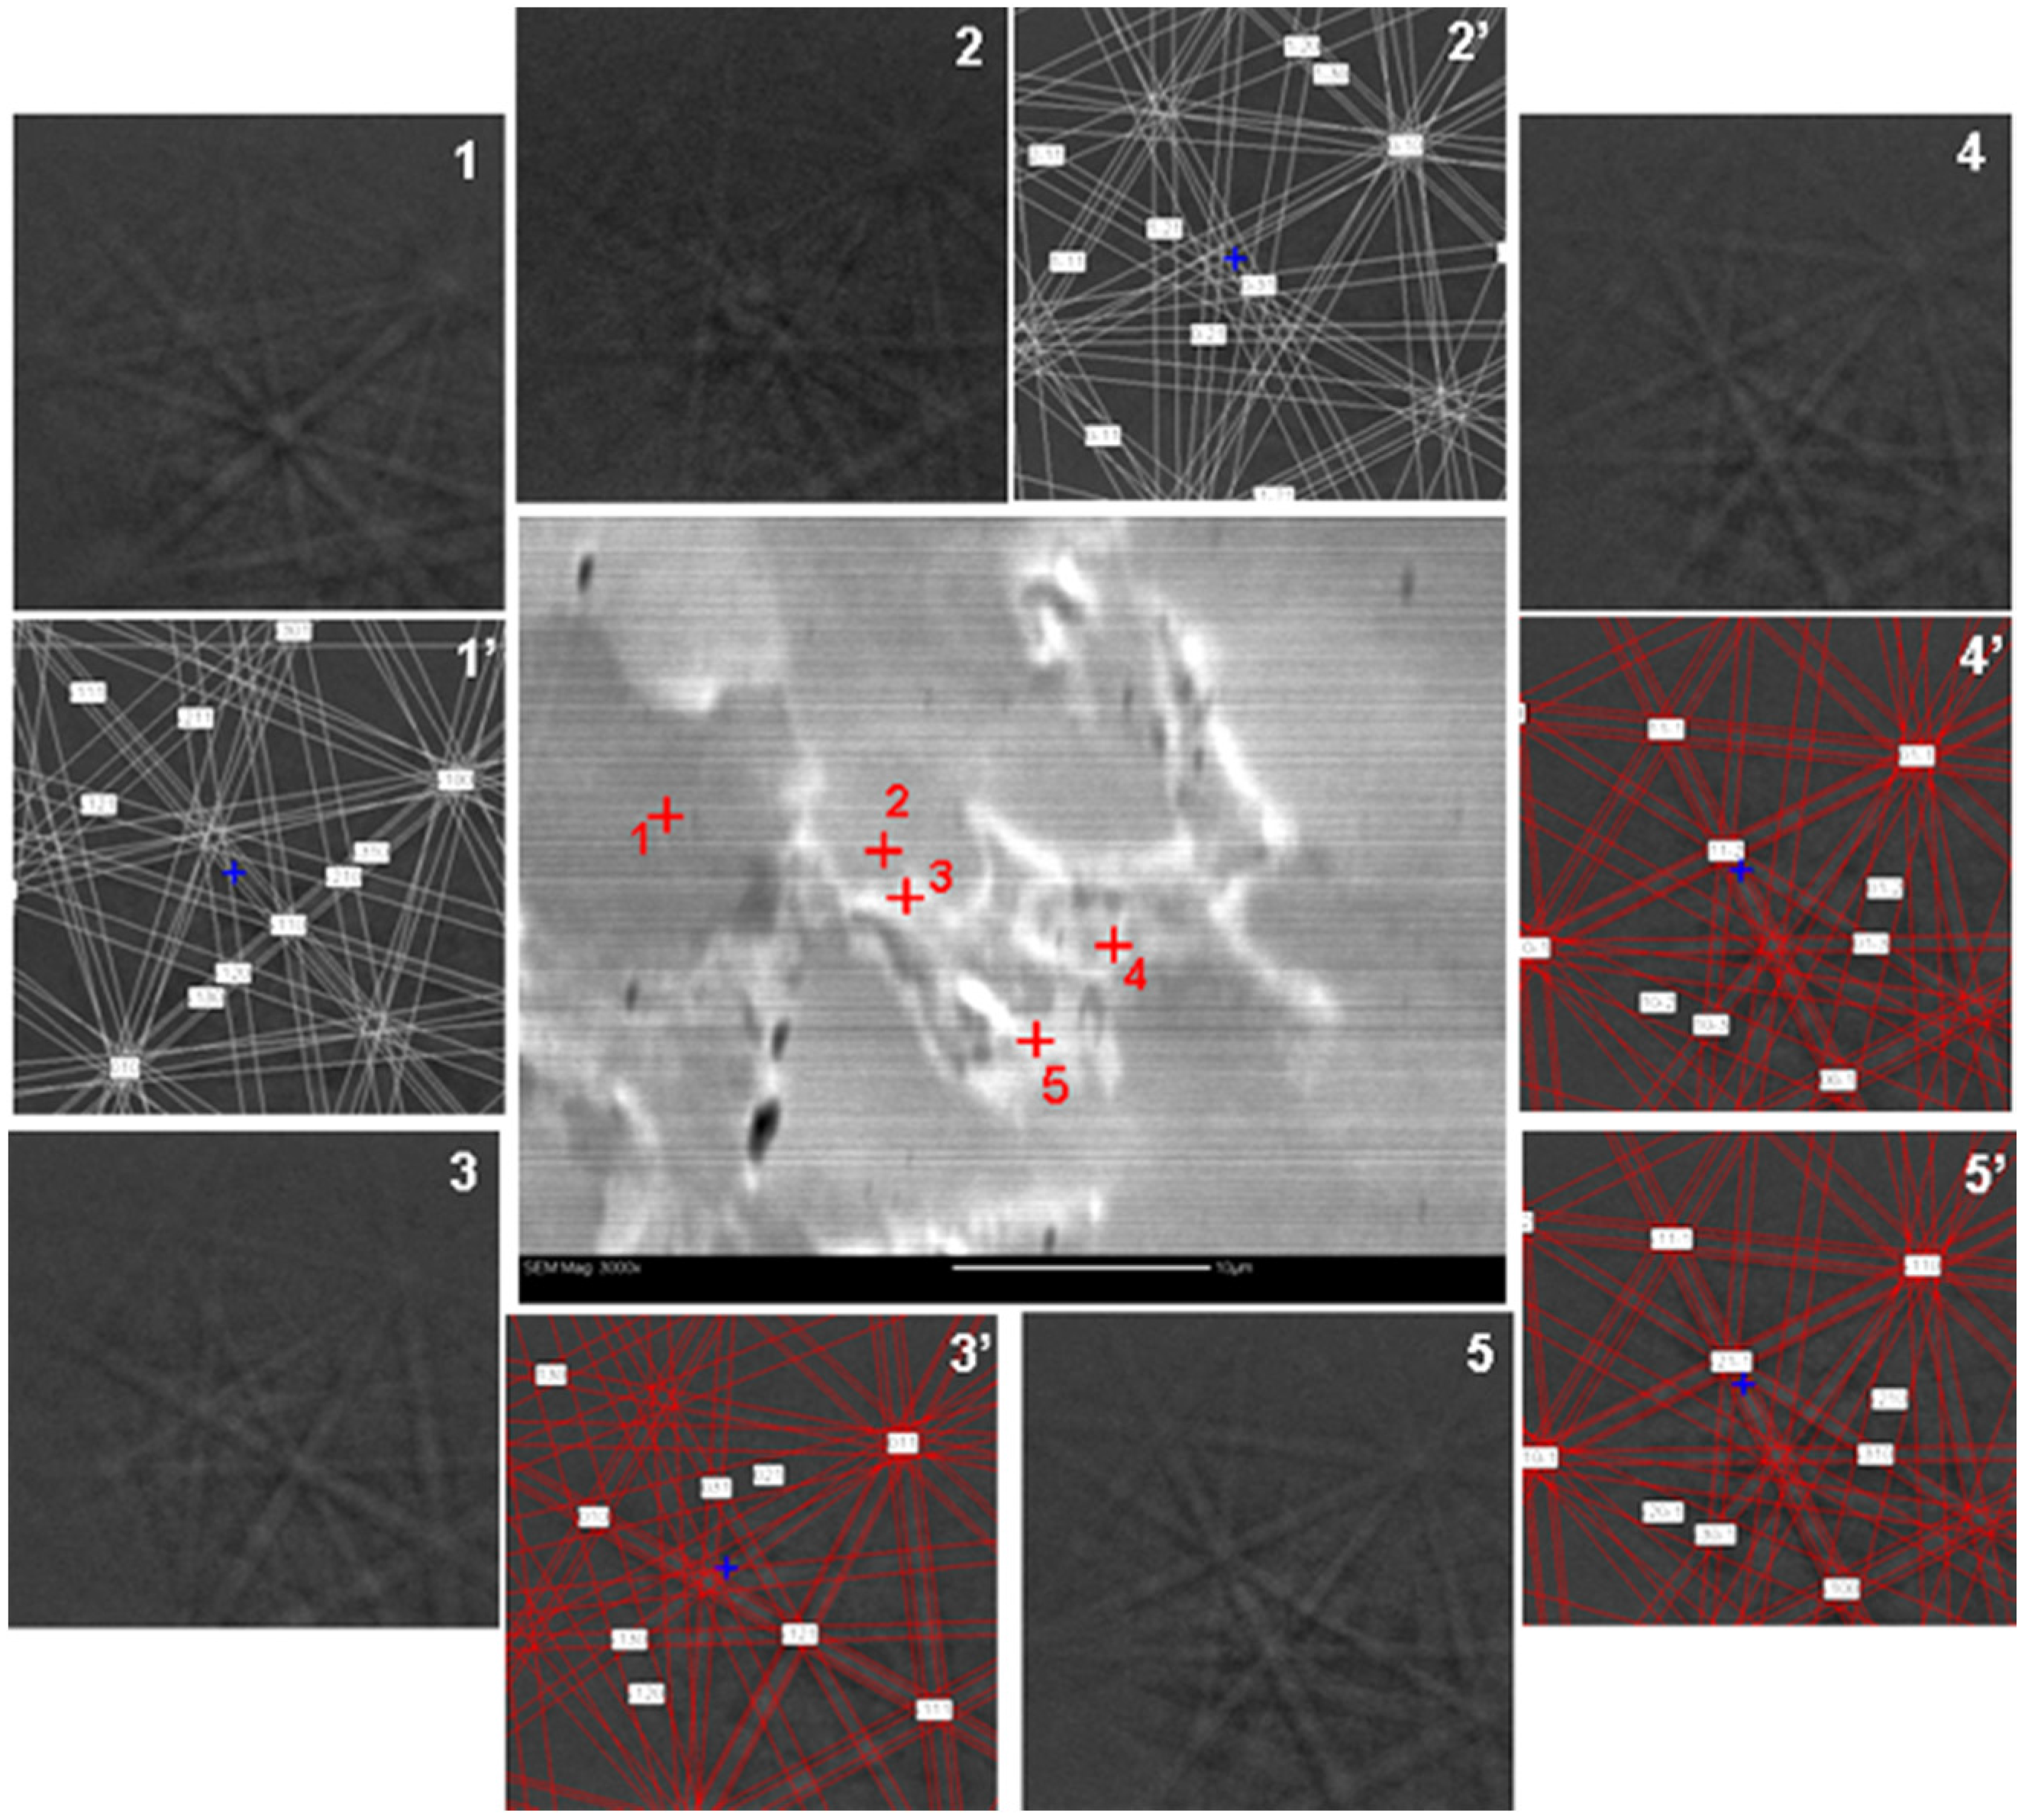
Figure 10 shows another example of the microstructure at the interface between the C14 and C15 phases. In the middle of the micrograph is the needle-like secondary phase that has an average composition of A7B9. Locations 1 and 2 were indexed as C14 Laves phase with different crystallographic orientations. Locations 3, 4, and 5 were indexed as C15 Laves phase. The EBSD from Location 3 (C15) overlaps with that from Location 2 (C14), with the same relationships seen in Figure 8. The EBSD from Location 4 matches with that from Location 5 with the needle structure in between. This suggests that, during solidification, the C14 phase solidifies first, the C15 crystals grow secondarily, and the needle-like structure grows last inside the C15 phase as a peritectic phase. Comparing the EBSD patterns from Locations 2 and 4, we obtained the following relationships: (101)loc.2//(101)loc.4 and [ 1 ¯ 21]loc.2//[ 1 ¯ 21]loc.4. This is the micro-twinning of a cubic C15 structure, which is well-known in the field [43,44]. Some models have been proposed to explain the cause of the micro-twinning, which include stacking faults [20,45], dislocation movement [46], and phase growth [18]. This further proves that, at one stage of solidification, Locations 3 and 4 are connected but with micro-twinning in between.
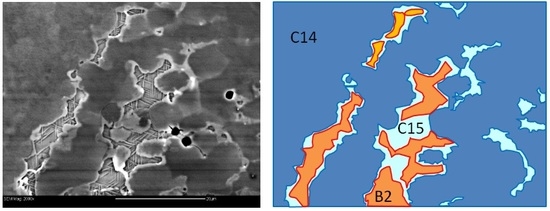
A compromise was made between high probe current mode and high resolution mode in the SEM experiments. In order to obtain high quality EBSD patterns, the SEM was adjusted to a high probe current mode, sacrificing resolution of the image, and thus the image shown in Figure 10 is not very clear. However, compared with Figure 11, it is apparent that the C15 Laves phase usually exists near the needle-like areas.
From the binary alloy phase diagrams of Ti-Cr and Zr-Cr, it can be demonstrated that the C14 phase formed at a higher temperature and later transformed into a C15 structure under a slow cooling condition [47]. Therefore, the solidification path during cooling is when the C14 phase forms the dendrite structure with the same crystallographic orientation, and later a second C14 phase with a similar chemical composition forms the majority of the matrix. Finally, a needle-like secondary phase is formed with most of the vanadium and chromium segregated into the outside C15 layer and the A7B9 mixture forming the needles inside. Therefore, the cooling sequence of C14-C15-B2 in the AB2 MH alloy proposed by Boettinger et al. [24] is verified. Similar microstructures observed by SEM in other AB2 multi-phase MH alloys are reported before [48,49].
The secondary phases are very important to the electrochemical performance of the multi-phase MH alloys. Eliminating (reducing) secondary phases through annealing results in severe degradations in capacity and high-rate dischargeability [9,12,50,51,52,53,54]. The secondary phases benefit the electrochemical reaction through the synergetic effects which require a clean, non-interrupted, and coherent interface adjacent to the main phase [14]. The highly aligned crystallographic orientations from various phases found in this study provide a strong support for the synergetic effect. Similar study with the same conclusion by EBSD and TEM has been performed on another multi-phase MH alloy family with a Laves phase related bcc structure [30].

4. Conclusions

EBSD techniques have been successfully employed to identify the structure and crystallographic orientation dependence of the phases from two Ti-Zr-Ni based MH alloys. This information contributed to the investigation of the cooling sequence of various phases. While the Zr7Ni10-based alloy (B/A = 1.43) was found to form a laminar-type solid, followed by solid-state phase segregation of Ni into the grain boundary and formation of the C15 secondary phase, the phase formation sequence is C14-C15-B2 in the AB2-based alloy (B/A = 1.99). The alignment observed in the crystallographic orientation strongly indicates the presence of a clean and coherent interface for the synergetic effects to occur in both the gaseous phase and electrochemical hydrogen storage.

Acknowledgments

This work was financially supported by the Michigan Initiative for Innovation & Entrepreneurship (2009).

Author Contributions

Yi Liu performed the microscope work and prepared part of the manuscript, and Kwo-Hsiung Young organized the results and prepared the manuscript.

Conflicts of Interest

The authors declare no conflict of interest.

Abbreviations

MHMetal hydride
bccbody-centered-cubic
fccface-centered-cubic
PCTPressure-concentration-temperature
SEMScanning electron microscopy
TEMTransmission electron microscopy
EBSDElectron backscatter diffraction
OIMOrientation imaging microscopy
EDSX-ray energy dispersive spectroscopy
XRDX-ray diffraction
BSEBackscattered electron
ECCElectron channeling contrast

References

  1. Ovshinsky, S.R.; Fetcenko, M.A.; Ross, J. A nickel metal hydride battery for electric vehicles. Science 1993, 260, 176–181. [Google Scholar] [CrossRef] [PubMed]
  2. Ovshinsky, S.R.; Fetcenko, M.A. Development of high catalytic activity disordered hydrogen-storage alloys for electrochemical application in nickel-metal hydride batteries. Appl. Phys. A 2001, 72, 239–244. [Google Scholar] [CrossRef]
  3. Bowman, R.C., Jr.; Fultz, B. Metalic hydrides I: Hydrogen storage and other gas-phase application. MRS Bull. 2002, 27, 688–693. [Google Scholar] [CrossRef]
  4. Joubert, J.M.; Latroche, M.; Percheron-Guegan, A. Metallic hydrides II: Materials for electrochemical storage. MRS Bull. 2002, 27, 694–698. [Google Scholar] [CrossRef]
  5. Fetcenko, M.A.; Ovshinsky, S.R.; Reichman, B.; Young, K.; Fierro, C.; Koch, J.; Zallen, A.; Mays, W.; Ouchi, T. Recent advances in NiMH battery technology. J. Power Sources 2007, 165, 544–551. [Google Scholar] [CrossRef]
  6. Fetcenko, M.A.; Ovshinsky, S.R.; Young, K.; Reichman, B.; Fierro, C.; Koch, J.; Martin, F.; Mays, W.; Ouchi, T.; Sommers, B.; et al. High catalytic activity disordered VTiZrNiCrCoMnAlSn hydrogen storage alloys for nickel-metal hydride batteries. J. Alloys Compd. 2002, 330–332, 752–759. [Google Scholar] [CrossRef]
  7. Young, K.; Ouchi, T.; Koch, J.; Fetcenko, M.A. The role of Mn in C14 Laves phase multi-component alloys for NiMH battery application. J. Alloys Compd. 2009, 477, 749–758. [Google Scholar] [CrossRef]
  8. Young, K.; Fetcenko, M.A.; Regmi, R.K.; Lawes, G.; Liu, Y. Comparisons of metallic clusters imbedded in the surface oxide of AB2, AB5, and A2B7 alloys. J. Alloys Compd. 2010, 506, 831–840. [Google Scholar] [CrossRef]
  9. Zhang, W.K.; Ma, C.A.; Yang, X.G.; Lei, Y.Q.; Wang, Q.D.; Lu, G.L. Influences of annealing heat treatment on phase structure and electrochemical properties of Zr(MnVNi)2 hydrogen storage alloys. J. Alloys Compd. 1999, 293–295, 691–697. [Google Scholar] [CrossRef]
  10. Zhang, Q.A.; Lei, Y.Q.; Yang, X.G.; Du, Y.L.; Wang, Q.D. Effects of annealing treatment on phase structure, hydrogen absorption-desorption characteristics and electrochemical properties of a V3TiNi0.56Hf0.24Mn0.15Cr0.1 alloy. J. Alloys Compd. 2000, 305, 125–129. [Google Scholar] [CrossRef]
  11. Bououdina, M.; Soubeyroux, J.L.; Fruchart, D. Study of the hydrogenation/dehydrogenation processes of ZrCr0.7Ni1.3, a Laves phase-rich multi-component system, by in-situ neutron diffraction under hydrogen gas pressure. J. Alloys Compd. 2001, 327, 185–194. [Google Scholar] [CrossRef]
  12. Visintin, A.; Peretti, H.A.; Ruiz, F.; Corso, H.L.; Triaca, W.E. Effect of additional catalytic phases imposed by sintering on the hydrogen absorption behavior of AB2 type Zr-based alloys. J. Alloys Compd. 2007, 428, 244–251. [Google Scholar] [CrossRef]
  13. Wong, D.F.; Young, K.; Nei, J.; Wang, L.; Ng, K.Y.S. Effects of Nd-addition on the structural, hydrogen storage, and electrochemical properties of C14 metal hydride alloys. J. Alloys Compd. 2015, 647, 507–518. [Google Scholar] [CrossRef]
  14. Young, K.; Ouchi, T.; Meng, T.; Wong, D.F. Studies on the synergetic effects in multi-phase metal hydride alloys. Batteries 2016, 2. [Google Scholar] [CrossRef]
  15. Mosavati, N.; Young, K.; Meng, T.; Ng, K.Y.S. Electrochemical open-circuit voltage and pressure-concentration-temperature isotherm comparison for metal hydride alloys. Batteries 2016, 2. [Google Scholar] [CrossRef]
  16. Iba, H.; Akiba, E. The relation between microstructure and hydrogen absorbing property in Laves phase-solid solution multiphase alloys. J. Alloys Compd. 1995, 231, 508–512. [Google Scholar] [CrossRef]
  17. Akiba, E.; Iba, H. Hydrogen absorption by Laves phase related BCC solid solution. Intermetallics 1998, 6, 461–470. [Google Scholar] [CrossRef]
  18. Chen, K.C.; Allen, S.M.; Livingston, J.D. Microstructures of two-phase Ti-Cr alloys containing the TiCr2 Laves phase intermetallic. J. Mater. Res. 1997, 12, 1472–1480. [Google Scholar] [CrossRef]
  19. Song, X.; Zhang, X.; Lei, Y.; Zhang, Z.; Wang, Q. Effect of microstructure on the properties of Zr-Mn-V-Ni AB2 type hydride electrode alloys. Int. J. Hydrog. Energy 1999, 24, 455–459. [Google Scholar] [CrossRef]
  20. Song, X.; Zhang, Z.; Zhang, X.; Lei, Y.; Wang, Q. Effect of Ti substitution on the microstructure and properties of Zr-Mn-V-Ni AB2 type hydride electrode alloys. J. Mater. Res. 1999, 14, 1279–1285. [Google Scholar] [CrossRef]
  21. Song, X.Y.; Chen, Y.; Zhang, Z.; Lei, Y.Q.; Zhang, X.B.; Wang, Q.D. Microstructure and electrochemical properties of Ti-containing AB2 type hydrogen storage electrode alloy. Int. J. Hydrog. Energy 2000, 25, 649–656. [Google Scholar] [CrossRef]
  22. Shi, Z.; Chumbley, S.; Laabs, F.C. Electron diffraction analysis of an AB2-type Laves phase for hydrogen battery applications. J. Alloys Compd. 2000, 312, 41–52. [Google Scholar] [CrossRef]
  23. Shibuya, M.; Nakamura, J.; Enoki, H.; Akiba, E. High-pressure hydrogenation properties of Ti-V-Mn alloy for hybrid hydrogen storage vessel. J. Alloys Compd. 2009, 475, 543–545. [Google Scholar] [CrossRef]
  24. Boettinger, W.J.; Newbury, D.E.; Wang, K.; Bendersky, L.A.; Chiu, C.; Kattner, U.R.; Young, K.; Chao, B. Examination of multiphase (Zr,Ti)(V,Cr,Mn,Ni)2 Ni-MH electrode alloys: Part I. Dendritic solidification structure. Metall. Mater. Trans. 2010, 41, 2033–2047. [Google Scholar] [CrossRef]
  25. Bendersky, L.A.; Wang, K.; Boettinger, W.J.; Newbury, D.E.; Young, K.; Chao, B. Examination of multiphase (Zr,Ti)(V,Cr,Mn,Ni)2 Ni-MH electrode alloys: Part II. Solid-state transformation of the interdendritic B2 phase. Metall. Mater. Trans. 2010, 41, 1891–1906. [Google Scholar] [CrossRef]
  26. Park, J.; Lee, J. Thermodynamic properties of the Zr0.8Ti0.2(MnxCr1−x) system. J. Less Common Met. 1991, 167, 245–253. [Google Scholar]
  27. Lv, J.; Zhang, B.; Wu, Y. Effect of Ni content on microstructural evolution and hydrogen storage properties of MgxNi3La (x = 5, 10, 15, 20 at.%) alloys. J. Alloys Compd. 2015, 641, 176–180. [Google Scholar] [CrossRef]
  28. Matiland, T.; Sitzman, S. Electron Backscatter Diffraction (EBSD) Technique and Materials Characterizations Examples. In Scanning Microscopy for Nanotechnology Techniques and Applications; Zhou, W., Wang, Z.L., Eds.; Springer: New York, NY, USA, 2007. [Google Scholar]
  29. Young, K.; Ouchi, T.; Liu, Y.; Reichman, B.; Mays, W.; Fetcenko, M.A. Structural and electrochemical properties of TixZr7−xNi10. J. Alloys Compd. 2009, 480, 521–528. [Google Scholar] [CrossRef]
  30. Shen, H.; Young, K.; Meng, T.; Bendersky, L.A. Clean grain boundary found in C14/body-center-cubic multi-phase metal hydride alloys. Batteries 2016, 2. [Google Scholar] [CrossRef]
  31. NIH Image Home Page. Available online: http://rsb.info.nih.gov/nih-image/ (accessed on 21 April 2006).
  32. Young, K.; Ouchi, T.; Fetcenko, M.A. Roles of Ni, Cr, Mn, Sn, Co, and Al in C14 Laves phase alloys for NiMH battery application. J. Alloys Compd. 2009, 476, 774–781. [Google Scholar] [CrossRef]
  33. Reed-Hill, R.E. Physical Metallurgy Principles, 2nd ed.; Van Nostrand Company: Princeton, NJ, USA, 1973. [Google Scholar]
  34. Friauf, J.B. The crystal structure of magnesium di-zincide. Phys. Rev. 1927, 29, 34–40. [Google Scholar] [CrossRef]
  35. Friauf, J.B. The crystal structures of two intermetallic compounds. J. Am. Chem. Soc. 1927, 49, 3107–3114. [Google Scholar] [CrossRef]
  36. Nakano, H.; Wakao, S.; Shimizu, T. Correlation between crystal structure and electrochemical properties of C14 Laves-phase alloys. J. Alloys Compd. 1997, 253–254, 609–612. [Google Scholar] [CrossRef]
  37. Zhu, J.H.; Liu, C.T.; Pike, L.M.; Liaw, P.K. Enthalpies of formation of binary Laves phases. Intermetallics 2002, 10, 579–595. [Google Scholar] [CrossRef]
  38. Zhu, J.H.; Liaw, P.K.; Liu, C.T. Effect of electron concentration on the phase stability of NbCr2-based Laves phase alloys. Mater. Sci. Eng. 1997, 239–240, 260–264. [Google Scholar] [CrossRef]
  39. Stein, F.; Palm, M.; Sauthoff, G. Structure and stability of Laves phases. Part 1. Critical assessment of factors controlling Laves phase stability. Intermetallics 2004, 12, 713–720. [Google Scholar] [CrossRef]
  40. Hu, Y.; Vasiliev, A.; Zhang, L.; Song, K.; Aindow, M. Polymorphism in the Laves-phase precipitates of a quinternary Nb-Mo-Cr-Al-Si alloy. Scr. Mater. 2009, 60, 72–75. [Google Scholar] [CrossRef]
  41. Zhang, Q.A.; Lei, Y.Q.; Yang, X.G.; Ren, K.; Wang, Q.D. Annealing treatment of AB2-type hydrogen storage alloys: I. crystal structure. J. Alloys Compd. 1999, 292, 236–240. [Google Scholar] [CrossRef]
  42. Shu, K.; Lei, Y.; Yang, X.; Liu, G.; Wang, Q.; Lu, G.; Chen, L. Effect of rapid solidification process on the alloy structure and electrode performance of Zr(Ni0.55V0.1Mn0.3Cr0.55)2.1. J. Alloys Compd. 1999, 293–295, 756–761. [Google Scholar] [CrossRef]
  43. Takasugi, T.; Yoshida, M. The effect of ternary addition on structure and stability of NbCr2 Laves phases. J. Mater. Res. 1998, 13, 2505–2513. [Google Scholar] [CrossRef]
  44. Kumar, K.S.; Hazzledine, P.M. Polytypic transformation in Laves phases. Intermetallics 2004, 12, 763–770. [Google Scholar] [CrossRef]
  45. Yoshida, M.; Takasugi, T. TEM observation for deformation microstructures of two C15 NbCr2 intermetallic compounds. Intermetallics 2002, 10, 85–93. [Google Scholar] [CrossRef]
  46. Zhou, O.; Yao, Q.; Sun, J.; Smith, D.J. Effect of V addition on the structure of ZrCr2 Laves phase: A high-resolution transmission electron microscope study. Philos. Mag. Lett. 2006, 86, 347–354. [Google Scholar] [CrossRef]
  47. Massalski, T.B. Binary Alloy Phase Diagrams; ASM International: Materials Park, OH, USA, 1990. [Google Scholar]
  48. Chang, S.; Young, K.; Ouchi, T.; Meng, T.; Nei, J.; Wu, X. Studies on incorporation of Mg in Zr-based AB2 metal hydride alloys. Batteries 2016, 2. [Google Scholar] [CrossRef]
  49. Young, K.; Ouchi, T.; Nei, J.; Moghe, D. The importance of rare-earth additions in Zr-based AB2 metal hydride alloys. Batteries 2016, 2. [Google Scholar] [CrossRef]
  50. Zhang, Q.A.; Lei, Y.Q.; Yang, X.G.; Ren, K.; Wang, Q.D. Annealing treatment of AB2-type hydrogen storage alloys: II. Electrochemical properties. J. Alloys Compd. 1999, 292, 241–246. [Google Scholar] [CrossRef]
  51. Bououdina, M.; Lenain, C.; Aymard, L.; Soubeyroux, J.L.; Fruchart, D. The effects of heat treatments on the microstructure and electrochemical properties of the ZrCr0.7Ni1.3 multiphase alloy. J. Alloys Compd. 2001, 327, 178–184. [Google Scholar] [CrossRef]
  52. Young, K.; Ouchi, T.; Huang, B.; Chao, B.; Fetcenko, M.A.; Bendersky, L.A.; Wang, K.; Chiu, C. The correlation of C14/C15 phase abundance and electrochemical properties in the AB2 alloys. J. Alloys Compd. 2010, 506, 841–848. [Google Scholar] [CrossRef]
  53. Nei, J.; Young, K.; Salley, S.O.; Ng, K.Y.S. Effects of annealing on Zr8Ni19X2 (X = Ni, Mg, Al, Sc, V, Mn, Co, Sn, La, and Hf): Hydrogen storage and electrochemical properties. Int. J. Hydrog. Energy 2012, 37, 8418–8427. [Google Scholar] [CrossRef]
  54. Young, K.; Chao, B.; Huang, B.; Nei, J. Studies on the hydrogen storage characteristic of La1xCex(NiCoMnAlCuSiZr)5.7 with a B2 secondary phase. J. Alloys Compd. 2014, 585, 760–770. [Google Scholar] [CrossRef]
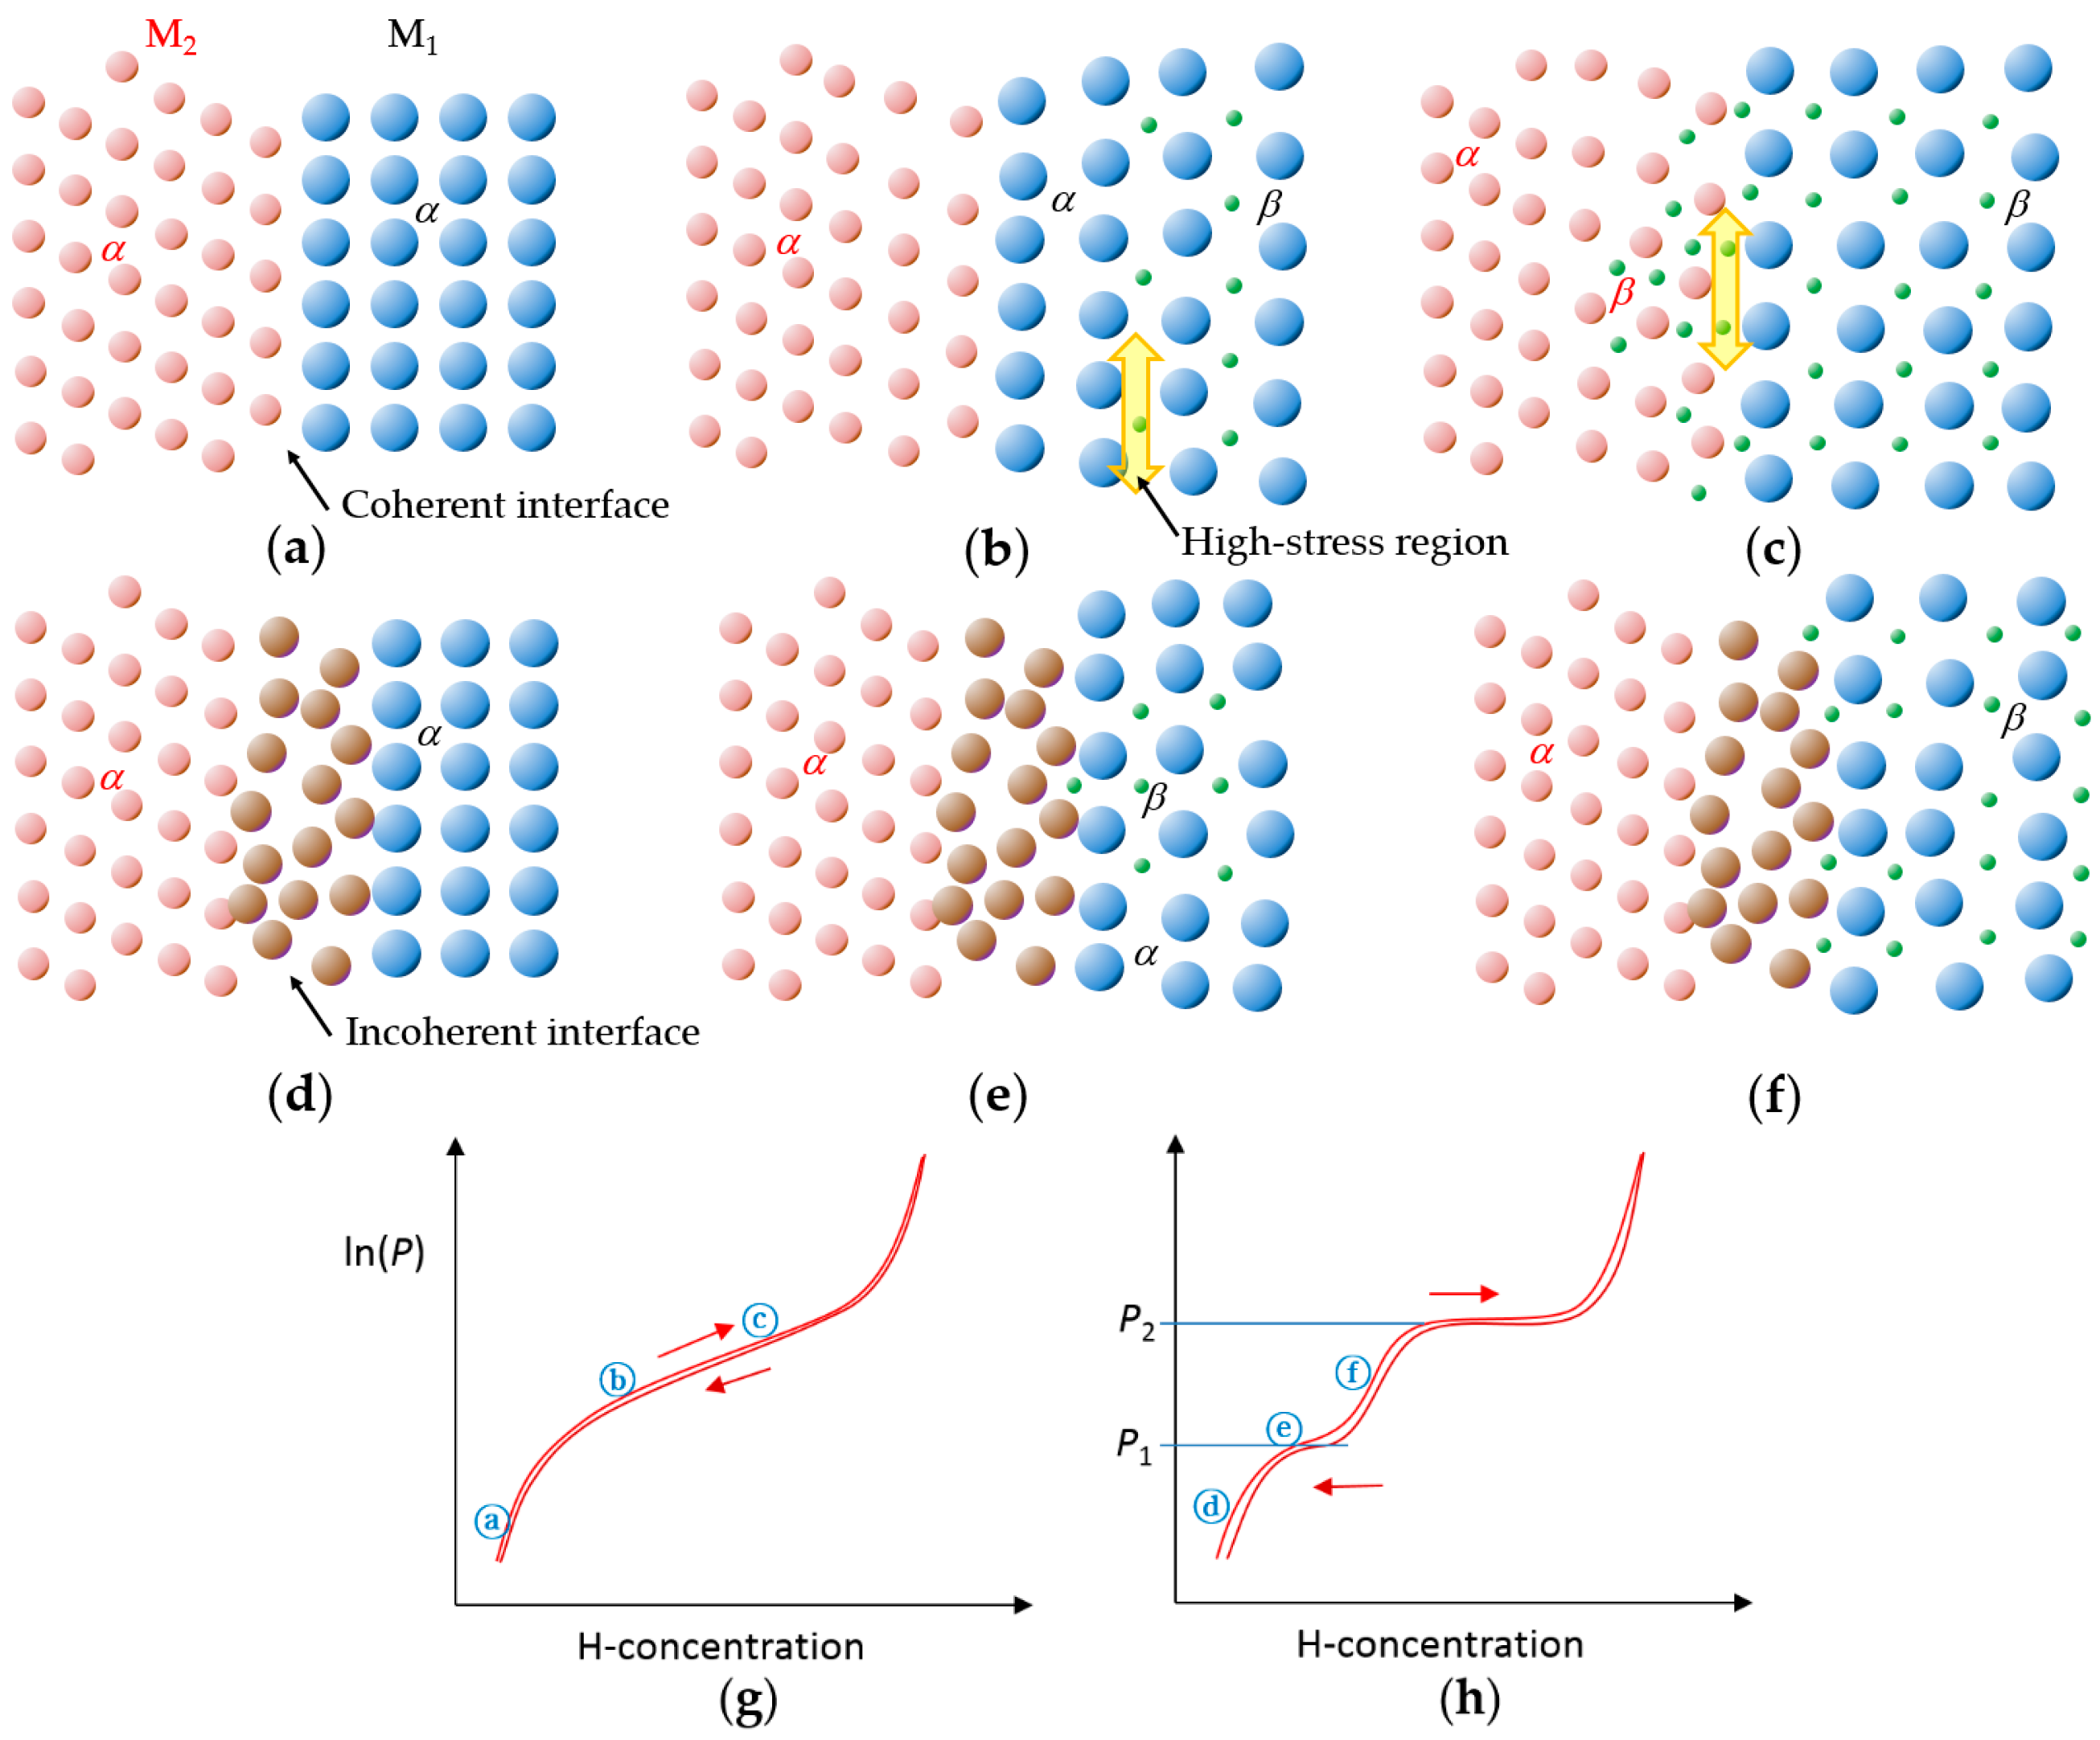
Figure 1. Schematic diagrams showing a coherent interface between the M1 (blue balls) and M2 (red balls) phases at the stages of (a) no hydrogen; (b) M1 partially hydrided and the metal (α)–metal hydride (MH, β) phase boundary carrying the high-stress; and (c) M1 completely hydrided and the M2 lattice expanded due to the stress from the M1 side, which facilitates the entrance of hydrogen (green dot) to enter the M2 side, an incoherent interface at the stage of (d) no hydrogen; (e) M1 with mixed α and β phases; and (f) M1 in the β phase and M2 in the α phase, and pressure-concentration-temperature (PCT) isotherms corresponding to a multi-phase MH alloy with (g) a coherent interface (ac) and (h) an incoherent interface (df). P1 and P2 are the equilibrium pressures for the M1 and M2 phases, respectively. Forward and backward arrows represent absorption and desorption isotherms, respectively. While (g) PCT isotherm can be found in most of the AB2 multi-phase MH alloys with strong synergetic effects from secondary phases ([26], for instance), (h) isotherm can be found in a discrete system such as Mg2Ni and Ni mixture [27].
Batteries 02 00026 g001
Figure 2. Computer generated electron backscatter diffraction (EBSD) patterns for: (a) (0001); (b) (1 1 ¯ 00); and (c) (11 2 ¯ 0) surfaces of a C14 (hexagonal) crystal structure.
Batteries 02 00026 g002
Figure 3. Computer generated EBSD patterns for: (a) (001); (b) (110); and (c) (111) surfaces of a C15 (cubic) crystal structure.
Batteries 02 00026 g003
Figure 4. A scanning electron microscopy (SEM)-backscattered electron (BSE) micrograph from the ZN06 alloy. The main matrix, black phase in the grain boundary, and black boulders correspond to the Zr7Ni10, C15, and ZrO2 phases. The chemical compositions in the numbered areas were analyzed by X-ray energy dispersive spectroscopy (EDS) and the results are listed in Table 2.
Batteries 02 00026 g004
Figure 5. EBSD patterns of 12 different spots on a ZN06 alloy sample showing the crystallographic orientations of all the studied Zr7Ni10 grains are well aligned.
Batteries 02 00026 g005
Figure 6. (a) A typical EBSD pattern; and (b) a computer generated index from a Zr7Ni10 phase.
Batteries 02 00026 g006
Figure 7. EBSD patterns at 10 different spots on a ZN06 alloy sample with three major crystallographic orientations (A, B, and C) and one minor crystallographic orientation with a small angle grain boundary (A’) present in Zr7Ni10 grains.
Batteries 02 00026 g007
Figure 8. SEM-BSE micrographs from Alloy #2 at different magnifications. The scale bars represent: (a) 500 μm; (b) 100 μm; and (c) 10 μm.
Batteries 02 00026 g008
Figure 9. An example of EBSD point analysis on possible phases in the as-prepared Alloy #2. Points 1, 2, and 3 were indexed as C14 Laves phase, while Points 4, 5, and 6 were indexed as C15 Laves phase.
Batteries 02 00026 g009
Figure 10. A further EBSD analysis around the needle-like phase area from Alloy #2. Points 1 and 2 are taken from the main C14 phase. The C15 Laves (Points 3, 4, and 5) phase is found to be along the boundary of needle-like phase area.
Batteries 02 00026 g010
Figure 11. (a) A BSE image; and (b) a schematic showing the phases in different shades for a typical cross-section of Alloy #2. It was the alignment of the orientation for the fine needle structures observed in the SEM micrograph that initiated this series of microstructure studies.
Batteries 02 00026 g011
Table 1. Chemical compositions and hydrogen storage properties of two alloys used in this study. Compositions are in at%. High-rate dischargeability is defined as the ratio of the discharge capacities obtained from C/7 and C/70 rates in a half-cell configuration.
AlloyMajor PhaseMinor Phase(s)Gaseous Phase Storage @30 °C (wt%)Electrochemical Capacity (mAh·g−1)High-Rate Dischargeability
ZN06Zr7Ni10C151.121860.74
AB2#2C14C15, Zr7Ni10, Zr9Ni11, ZrNi1.663840.98
Table 2. Chemical compositions as measured by EDS in different areas shown in Figure 4 (in at%).
LocationTiZrNiB/A Ratio
112.6532.3055.051.224
212.8331.7655.401.242
312.7531.8855.371.241
412.4432.4355.131.229
512.0832.6555.261.235
Standard deviation (%)2.11.00.240.55
Table 3. Chemical compositions measured by EDS in different areas in Figure 8c (in at%).
RegionTiZrVCrMnCoNiB/A Ratio
Grey10.222.011.56.615.52.232.02.11
Dark11.121.810.75.614.62.234.12.03
Second Phase18.521.23.81.77.11.646.11.29