1. Introduction
Electric vehicles (EVs) have become an important component of modern transportation ecosystems due to their low greenhouse gas emissions and high energy efficiency. Despite these advantages, limited battery capacity and charging infrastructure pose substantial challenges to long-distance travel. In this context, accurate EV range prediction has emerged as a critical research problem for improving driving reliability and user confidence.
Range estimation is the analytical process of predicting the maximum distance an electric vehicle can travel under specific operational and environmental conditions before its usable energy capacity is exhausted [
1,
2]. It is currently an active topic in intelligent transportation systems due to the growing shift toward sustainable EVs and the increasing demand for robust distance-prediction systems [
3]. Providing reliable projections of driving distance is required to mitigate the critical issue of ‘range anxiety’—the psychological distress—experienced by users, thereby encouraging drivers to switch from conventional gasoline vehicles to electric mobility [
4]. Accurate range estimation directly affects driver confidence, charging planning, route optimization, energy management, battery utilization, and driver decision-making processes.
Range estimation and State-of-Charge (SoC) estimation are two closely related yet fundamentally different tasks in electric vehicle research. While SoC represents the instantaneous ratio of the available battery energy to total battery capacity, typically expressed as a percentage between 0% and 100%, range estimation projects this available energy to spatial travel distance (km) based on vehicle dynamics and driving conditions. SoC estimation is primarily an internal electrochemical monitoring task that quantifies the remaining capacity inside the battery pack using local cell sensors (i.e., voltage, current, temperature). In contrast, range estimation is further compounded by highly stochastic external variables, including driving style, vehicle characteristics (e.g., tire type), ambient climate, route type, and auxiliary power consumption.
Range prediction is a highly challenging task because energy consumption in EVs is influenced by numerous dynamic and uncertain internal and external factors [
5]. For instance, environmental conditions such as ambient temperature, wind resistance, and road gradient can significantly affect battery efficiency and energy usage. Similarly, operational parameters, including vehicle speed, acceleration, driving style (i.e., aggressive, normal, or eco-friendly), auxiliary heating/cooling use, and traffic situations, may drastically impact the effective driving range of EVs. Moreover, vehicle-specific parameters such as vehicle mass, battery characteristics, battery aging level, powertrain efficiency, and tire properties can also directly influence EV energy consumption behavior and, therefore, driving range performance. The interactions among all these factors are often highly complex and difficult to model using traditional linear approaches. The presence of nonlinear dependencies, uncertain operational conditions, heterogeneous driving patterns, and a lack of high-quality driving datasets further complicates the EV range estimation problem. Despite initial studies in this field, achieving highly accurate and stable range prediction under real-life conditions remains an open research problem.
The current literature reveals several limitations and drawbacks in existing range estimation frameworks [
1,
3]. Some previous data-driven studies relied on simulation-based datasets that might not fully represent real driving variability [
1]. Some studies used simplified linear models that may fail to capture the stochastic and complex nature of driving operations [
3]. Conversely, while deep learning approaches could offer high precision, they are often regarded as “black-box” models, lacking the interpretability required for critical transportation systems. In addition, they usually require computationally expensive architectures and extensive parameter processes [
3]. Additionally, some previous studies still suffer from issues such as reliance on expensive optimization strategies, a lack of high-quality driving datasets, and insufficient environmental variability under unseen driving conditions [
1]. These limitations indicate that further research is still needed to develop more robust and practical EV range-estimation frameworks.
This study aims to overcome the aforementioned challenges through the proposed M5Boost framework, which simultaneously addresses predictive accuracy, efficiency, and model transparency. By leveraging a real-world dataset, this research focuses on enhancing the reliability of range estimation for Volkswagen EVs.
The main contributions of this study can be summarized as follows:
- (i)
It proposes an M5Boost framework for the EV range estimation that establishes an additive regression mechanism with model trees in order to iteratively reduce prediction errors while simultaneously constructing localized regression models.
- (ii)
Unlike conventional boosting approaches that utilize constant-valued leaf nodes, the proposed approach employs multivariate regression models at leaf nodes to generate more flexible and region-specific predictions.
- (iii)
The proposed approach incorporates specialized model tree pruning and smoothing operations within the boosting process to improve prediction continuity, robustness, and generalization capability.
- (iv)
It also contributes to the literature by systematically extending a benchmark EV dataset with newly collected real-world battery-related driving records, resulting in a comprehensive dataset spanning more than 11 years.
- (v)
Experimental validations revealed that the developed model significantly outperformed the state-of-the-art models reported in the literature on the same dataset.
The structural flow of this research is outlined as follows.
Section 2 synthesizes current knowledge by reviewing existing literature on EV range prediction.
Section 3 describes the theoretical methodology of M5Boost, along with its formal mathematical foundations.
Section 4 serves as the experimental core, detailing the dataset, feature engineering operations, implementation details, the empirical setup, a comprehensive analysis of the results, and statistical evaluation findings.
Section 5 presents a comparative performance assessment against competing benchmarks to validate the effectiveness of the approach. Finally,
Section 6 concludes the study and discusses potential avenues for future advancements in the field.
2. Related Work
As the transition to electric mobility accelerates, researchers have focused on developing intelligent models capable of predicting driving range under diverse operational and environmental conditions. They have attempted to address “range anxiety” by building diverse EV range forecasting frameworks aimed at providing driver confidence. The studies still struggle to provide a balance among high-precision forecasting, computational efficiency, and interpretability across volatile real-world driving scenarios.
In the literature, EV range estimation approaches are generally categorized into 3 particular groups: model-based, rule-based, and data-driven methods. (i) Model-based approaches [
6,
7] rely on mathematical and physical formulations derived from vehicle dynamics, battery behavior, and energy consumption equations. These approaches generally require detailed physical parameters and simplified system assumptions, which may limit their applicability under highly dynamic real-world conditions and complex driver behaviors. (ii) Rule-based approaches [
8,
9], such as Fuzzy Logic, utilize predefined heuristics, expert-system-driven techniques, and manually designed decision mechanisms to handle driving inputs. However, these systems are frequently limited by their inability to adapt to data patterns not explicitly defined by the designer. Furthermore, their performance highly depends on the quality of manually designed rules. (iii) Data-driven approaches [
10], on the other hand, utilize machine learning algorithms to learn relationships directly from historical, large-scale, high-dimensional driving data. Moreover, hybrid approaches, i.e., integrating physical constraints with data-driven insights, have also been investigated for EV range prediction. However, their integration may increase computational complexity without a proportional gain in practical reliability.
Table 1 presents a comprehensive summary of recent studies related to EV range estimation, including their vehicle brands, employed machine learning methods, geographic information, prediction objectives, strengths, and reported limitations. This table highlights the evolving landscape of the field, moving from basic regression models to complex ensemble and deep learning architectures.
Machine learning approaches have been investigated for EV range estimation problems due to their ability to model relationships between driving conditions and energy consumption characteristics. Traditional ML techniques such as K-Nearest Neighbors (KNN) [
11], Support Vector Machine (SVM) [
12,
13], and Artificial Neural Networks (ANN) [
13,
14,
15] have been employed in previous studies. Despite their use, these methods often suffer from high sensitivity to noise or fall short of yielding satisfactory performance. Ensemble learning approaches, including Random Forest (RF) [
11,
15], CatBoost [
12], LightGBM [
16], XGBoost [
11,
17], and Extra Trees [
18,
19] have also been utilized for EV range prediction tasks. In addition, probabilistic sequential learning approaches such as Hidden Markov Models (HMM) [
20] have been implemented to capture stochastic driving behaviors. More recently, deep learning-based approaches, including Convolutional Neural Networks (CNN) [
21], Deep Q-Networks [
22], Generative Adversarial Networks (GAN) [
23], Long Short-Term Memory networks (LSTM) [
18], Bidirectional LSTM (BiLSTM) [
24], and Deep Neural Networks (DNN) [
25], have been proposed to process EV driving data. However, these DL models often rely on computationally expensive architectures or black-box learning structures with limited interpretability.
The source of data remains a critical factor in model validation. While some studies relied on simulation environments [
14,
17] to generate synthetic driving cycles and battery behaviors, others [
26,
27,
28,
29,
30,
31,
32] utilized real-world operational EV datasets collected under practical conditions. Since simulation-based studies provide controlled experimental environments, they may not fully reflect the variability and uncertainties encountered in real-life EV usage.
A diverse range of EV brands has been analyzed in the literature, including vehicles from manufacturers such as Tata [
11,
13], Nissan [
16,
28,
29,
31], Hyundai [
16], MG [
11], Musoshi [
19], Tesla [
24,
31], BYD [
24], Rover [
29], MG [
11], GAC [
24], Kia [
30], Fiat [
31], and Toyota [
24]. In addition to passenger vehicles, several studies [
15,
26,
27] have extended their scope to electric buses. Furthermore, range estimation challenges have also been explored for specialized heavy-duty electric vehicles, such as those within the Freightliner fleet [
27]. In the present study, the experimental analysis specifically focuses on Volkswagen e-Golf EVs using a real-world battery-related driving dataset collected from different users.
Geographically, the investigations span different regions worldwide with varying climatic and infrastructural characteristics. Significant research has been conducted in China [
12,
15,
18,
20,
21,
24,
26,
32], followed by the United States [
16,
23,
27,
28], India [
11,
13], Turkey [
19], Holland [
25], and Canada [
30]. Some studies additionally utilized multinational or web-based datasets obtained from multiple countries [
16,
22,
29,
31]. All these findings indicate that EV range estimation research has become a globally active research area with increasing industrial and academic interest. The empirical analysis in this study is based on a comprehensive dataset sourced from a German web-based platform that reflects real-world driving conditions in the region.
The literature further indicates that EV range prediction studies are typically bifurcated into two major categories: Driving-Range Estimation (DRE) and Remaining-Range Estimation (RRE). Although both aim to estimate a distance for an EV, they differ in their prediction objectives and input data. DRE refers to predicting the distance that an EV can travel under specified operating conditions, typically considering vehicle characteristics, driving style, traffic conditions, environmental factors, and battery-related parameters such as battery State-of-Health (SoH). For example, DRE can be used before or at the beginning of a trip to estimate how far a vehicle is expected to travel under planned driving conditions. In contrast, RRE focuses on predicting how far the EV can still travel based on its current battery state during an ongoing trip. In other words, it primarily relies on the current battery State-of-Charge (SoC) together with instantaneous vehicle measurements to continuously update the remaining driving distance. For example, RRE computes that an EV operating with an active 45% SoC under aggressive highway driving behavior can travel exactly 115 km further before full depletion. Accordingly, DRE mainly supports trip planning and route selection, whereas RRE is intended for real-time and continuous range monitoring during vehicle operation. Several studies concentrated on DRE problems [
16,
25,
26,
33], whereas other studies focused on RRE tasks [
12,
15,
17,
28,
34]. The existing studies primarily focus on one of these estimation types rather than investigating both of them.
As performance evaluation metrics, Mean Absolute Error (MAE) and Root Mean Squared Error (RMSE) are universally employed benchmarks due to their suitability for regression-based estimation problems. MAE-based evaluations were frequently reported in studies such as [
26,
27,
28,
29], whereas RMSE-based analyses were emphasized in studies including [
30,
31]. These metrics provide quantitative insight into the deviation between actual and predicted EV range values under different driving conditions. However, some previous studies [
32] report only a single evaluation metric, which may limit the comprehensiveness of model performance assessment.
In addition to ML model development, several studies have examined how various operational and environmental variables impact the precision of range estimation. It has been noted that vehicle mass serves as a prominent factor affecting EV range behavior [
19]. Furthermore, road slope and elevation variations were shown to affect energy consumption and driving distance significantly [
19,
35]. Ambient temperature levels were similarly recognized as critical factors due to their effects on battery efficiency and auxiliary energy demands [
19,
36,
37]. Driving cycles remain essential for model calibration [
14,
31,
32]. Moreover, factors such as vehicle speed [
19,
38], acceleration patterns [
19,
39], and specific driving modes (e.g., Aggressive, Normal, or Gentle) [
40] were likewise reported as influential variables affecting the accuracy of EV range estimation.
Alternative methodologies adopted a two-stage estimation strategy in which the battery State of Charge (SoC) is first predicted and subsequently utilized for EV range estimation [
28,
41,
42,
43]. Although this approach also provides battery-state information, prediction errors occurring during the SoC estimation stage may propagate into the final range estimation results, thereby increasing the overall uncertainty of the prediction framework. In addition, this two-stage approach adds computational complexity.
As shown in
Table 1, previous data-driven studies still suffer from issues such as limited accuracy, insufficient interpretability, dependence on simulation environments, reliance on expensive optimization strategies, lack of environmental variability, high computational complexity, and reduced generalization capability under unseen driving conditions. These limitations indicate that further research is needed to develop more robust and practical EV range-estimation frameworks.
Unlike previous studies, this research investigates the M5Boost framework that integrates the robust error-correction capabilities of additive regression with M5 Model Trees for the range estimation task. In contrast to existing studies that rely solely on conventional boosting algorithms, M5Boost combines residual-based iterative learning with localized multivariate regression modeling. M5Boost aims to provide an interpretable and computationally efficient prediction structure while maintaining high prediction accuracy. By integrating specialized tree-pruning and smoothing stages into a boosting loop, the approach provides a highly precise and continuous prediction surface that bridges the gap between traditional linear models and complex “black-box” deep learning algorithms.
3. Materials and Methods
3.1. Proposed Framework
This study proposes a comprehensive ML-based framework for precise driving-range estimation in electric vehicles (EVs). The framework was designed to transform raw vehicle usage records into an intelligent model capable of accurately estimating the distance that an EV can travel under various driving conditions. The developed framework is intended to support transportation systems, energy management, trip/charging planning, and decision-making processes by providing reliable range predictions. Given the complex non-linear dependencies inherent in EV energy depletion, it offers utility in alleviating range anxiety under dynamic real-world operational conditions.
The core element of the proposed framework is an M5Boost-based machine learning methodology that combines additive residual learning with a model-tree-based prediction structure. M5Boost iteratively fits base model trees to the residual errors of prior iterations to effectively capture both localized multi-variate trends and global non-linear variations across heterogeneous driving datasets. Critically, it leverages the interpretability advantages inherent in model trees. Incorporating dedicated pruning and smoothing operations, the proposed approach aims to improve prediction accuracy, robustness, and generalization capability for practical EV range estimation scenarios.
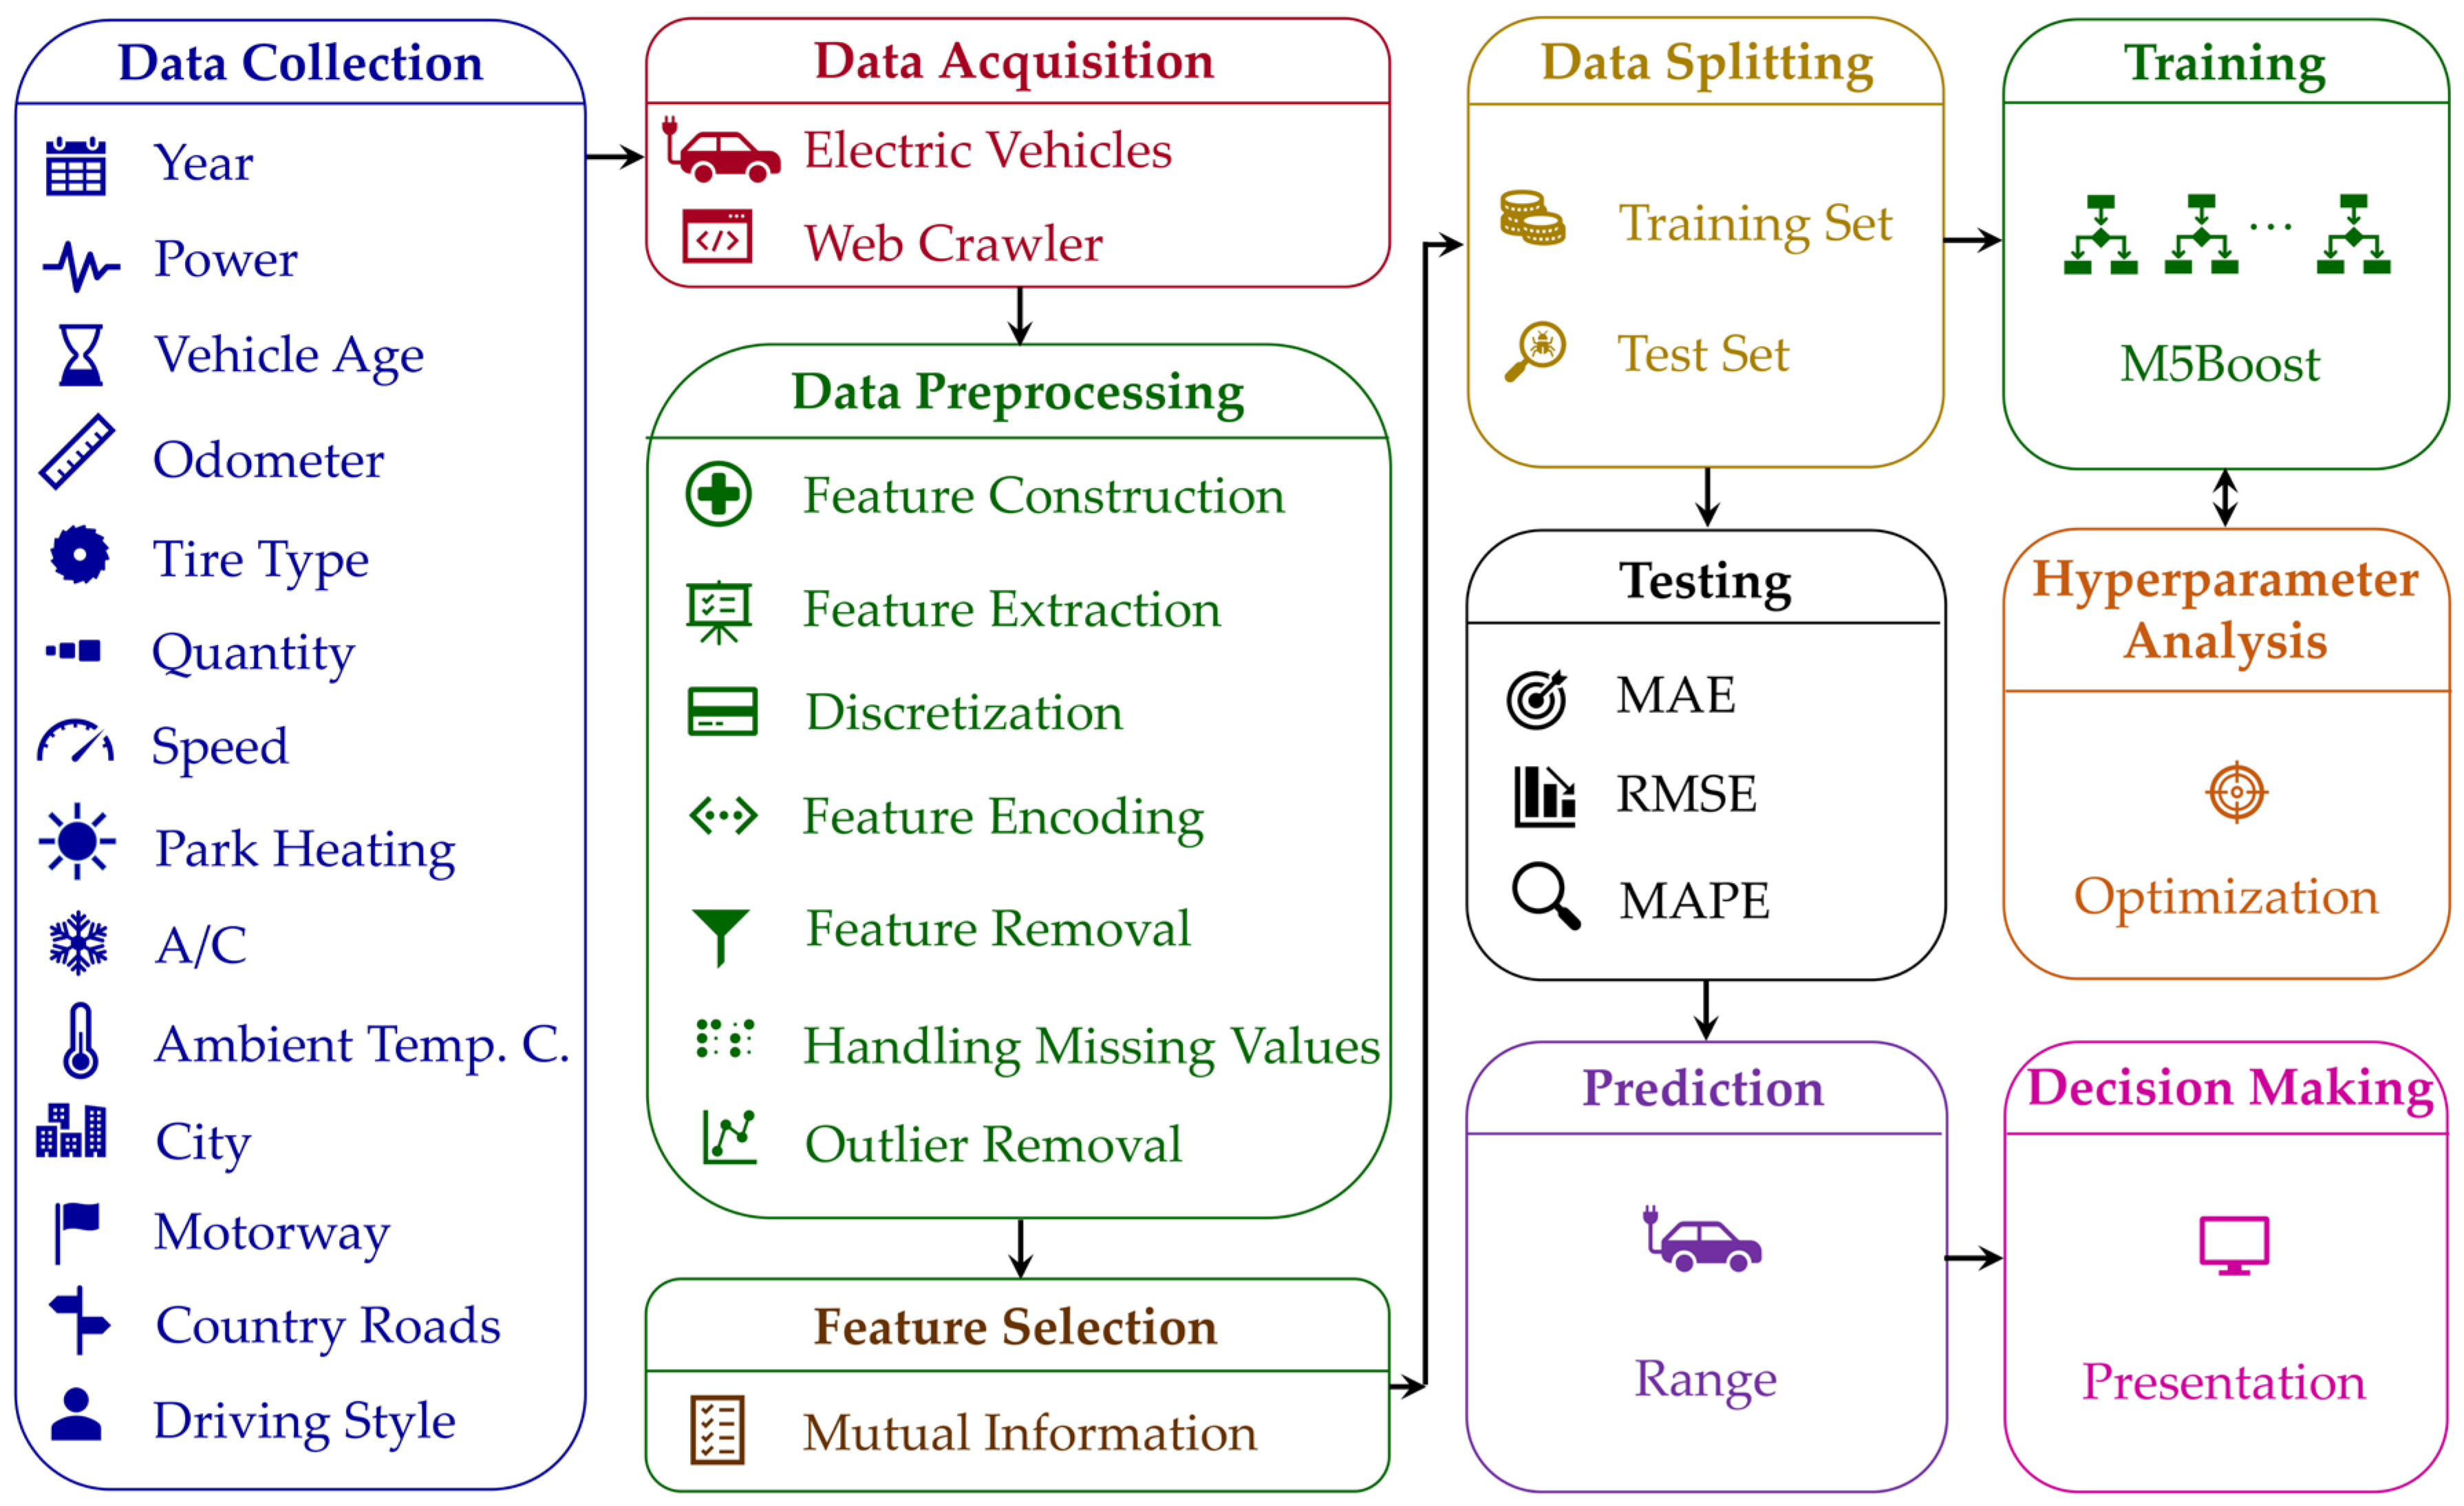
Figure 1 illustrates the entire procedural architecture of the proposed framework. It delineates the pipeline from raw data harvesting to the final presentation layer. Specifically, the proposed framework systematically integrates data acquisition, preprocessing, feature selection, model training, hyperparameter optimization, performance evaluation, and decision-making stages.
The framework begins with the “Data Collection” stage, where crucial factors affecting EV driving range are obtained from drivers. These variables include vehicle-related specifications such as production year, power, and vehicle age; energy-related metrics such as consumed energy quantity; operational parameters including odometer reading and average driving speed; environmental factors such as ambient temperature category and road usage types including city, motorway, and country roads; vehicle equipment activation variables such as air conditioning (A/C) and park heating; and driver behavior characteristics represented by driving style.
The “Data Acquisition” stage uses a specialized web crawler to automatically retrieve, extract, aggregate, and store vehicle records in a structured dataset for subsequent analysis. To ensure high data quality, a “Data Preprocessing” stage is executed, consisting of multiple sequential operations, including Feature Construction, Feature Extraction, Discretization, Feature Encoding, Feature Removal, Handling Missing Values, and Noise/Outlier Removal. Feature construction generates new variables, such as vehicle age, while feature extraction derives additional information from existing attributes, such as driving month information from the date value. Discretization is applied to improve data representation, whereas feature encoding converts categorical variables into machine-readable numerical formats. Redundant attributes are eliminated during feature removal, missing records are handled appropriately, and abnormal observations are identified and removed using outlier detection techniques.
Once the data is cleaned, a “Feature Selection” stage is employed to identify the most informative variables for EV range estimation. In this study, the Mutual Information method was used to mathematically assess the dependency between the input features and the target variable. The aim of this stage is to discard irrelevant information, reduce computational cost, and improve model accuracy. The resulting dataset then undergoes “Data Splitting” to be divided into two distinct subsets: the training set and the test set. The training set is used to construct predictive models, while the test set is reserved for performance evaluation.
During the “Training” phase, the core M5Boost algorithm is fitted to the training partition and operates in direct coordination with the “Hyperparameter Analysis” stage to dynamically determine suitable model parameters. The optimization process explores various parameter combinations to improve predictive performance while maintaining generalization capability. Subsequently, the “Testing” phase utilizes statistical metrics, namely Mean Absolute Error (MAE), Root Mean Squared Error (RMSE), and Mean Absolute Percentage Error (MAPE) to evaluate the effectiveness of the trained model on the test set. These metrics quantify the deviation between actual and predicted driving ranges and provide an objective evaluation of model accuracy. Finally, the framework proceeds to the “Prediction” stage to generate range predictions for unseen EV driving conditions. The predicted range values are then used in the “Decision-Making” stage, where results are presented to drivers to support operational planning, route selection, charging management, and other range-related decisions. Through this end-to-end workflow, the proposed framework provides a practical and effective solution for EV range estimation applications.
The advantages of M5Boost can be summarized as follows:
Enhanced Non-linear Mapping: By combining additive regression with model trees, M5Boost can approximate highly complex non-linear functions more accurately compared to a single tree.
Reduced Bias: The iterative nature of M5Boost systematically reduces the bias of the model by focusing on previously unexplained variance in each step; therefore, it successively minimizes global error.
Interpretability: Since each learner in M5Boost is a model tree, the decision boundaries remain human-interpretable compared to black-box boosting methods. Furthermore, leaf coefficients provide insights into feature importance.
Handling High Dimensionality: M5Boost effectively performs feature selection during the tree-building process, focusing on the most relevant predictors for residual reduction.
Smooth Predictions: Through the integration of child and parent predictions, M5Boost produces smoother output transitions across the feature space than standard regression tree ensembles. In this way, it reduces abrupt changes in estimates between neighboring regions.
Advanced Leaf Nodes: Unlike traditional Gradient Boosting that uses constant values in leaves, M5Boost employs multivariate regression models at leaf nodes, allowing the method to generate more flexible and region-specific predictions.
Robustness to Overfitting: The shrinkage parameter in the additive stage provides a dual-layer defense against noise.
Efficient Handling of Continuous Data: M5Boost is natively designed for regression tasks involving continuous numerical features, eliminating the need for extensive data discretization.
Efficiency: M5Boost is computationally efficient compared to many deep learning-based methods while still maintaining high predictive performance.
Stability: The pruning mechanism reduces unnecessary model complexity and improves model stability.
3.2. M5Boost-Based Methodology
This study proposes a boosting-based approach, referred to as M5Boost, that is based on additive regression and model trees. Specifically, it integrates the M5 model tree structure with an additive regression meta-learning strategy in order to improve prediction accuracy for estimation problems. This approach iteratively constructs multiple M5 Model Trees, where each newly generated model aims to reduce the prediction errors of the previous ensemble.
Let the training dataset be represented as:
where
is the number of training instances,
represents the
-dimensional input feature vector of the
-th instance, and
refers to the corresponding target variable. Each instance is defined in the feature space:
where
is the
-th feature value in the
-th instance.
The M5Boost process begins with an initialization step,
, which is defined as the mean value of the target attribute across the training set:
This initial global average serves as the baseline for the subsequent additive updates, ensuring that the first tree focuses on the variance around the mean.
In each
-th iteration, M5Boost calculates the residual for each instance, which represents the unexplained variance of the current ensemble. The residual
for instance
at iteration
is formulated as:
where
denotes the ensemble prediction obtained from the previous iteration. Following the residual calculation, a new training subset is defined as:
This
dataset is then used to build a new M5 Model Tree,
. Unlike conventional standalone regression trees, M5Boost incrementally refines the prediction model by adding correction functions generated by successive M5 Model Trees. The ensemble is updated at each iteration by adding the newly trained tree to the existing model. The update rule for the
-th iteration of M5Boost is expressed as:
where
denotes the shrinkage parameter controlling the contribution of each M5 Model Tree to the final prediction model. The shrinkage mechanism reduces the impact of individual learners and improves the generalization capability of M5Boost by preventing excessively large corrective updates during training.
After
boosting iterations, the final M5Boost prediction model is defined as the cumulative sum:
where
denotes the
-th M5 Model Tree and
represents the shrinkage parameter (learning rate) used to control the contribution of each tree. This final M5Boost model provides a comprehensive mapping of the input features to the target by systematically reducing the global error through these local approximations.
M5Boost minimizes the Mean Squared Error (MSE) loss function defined as:
At each iteration, the newly generated M5 Model Tree attempts to minimize the remaining residual error of the current ensemble model. Consequently, M5Boost gradually improves prediction performance by sequentially correcting previously misestimated observations.
The M5Boost model can simultaneously capture nonlinear partitioning structures within data. This modeling capability makes M5Boost particularly suitable for complex EV range estimation problems involving heterogeneous driving conditions, nonlinear energy consumption behavior, and environmental variations.
3.3. Formal Description of M5Boost
M5Boost builds multiple model trees within the additive regression framework to iteratively minimize residual prediction errors. In the ensemble framework, each tree recursively partitions the feature space into multiple subregions and constructs local regression models at leaf nodes. This learning structure enables M5Boost to simultaneously capture nonlinear feature interactions and localized relationships within estimation problems.
Let the dataset associated with a tree node be represented as:
where
denotes the number of samples belonging to node
.
During the tree construction stage of M5Boost, candidate splitting attributes are evaluated using the Standard Deviation Reduction (SDR) criterion. The standard deviation of node
is calculated as:
where
denotes the standard deviation and
denotes the mean target value of the samples located at node
.
Suppose that a candidate splits partitions node
into
child subsets denoted by
. The expected standard deviation after splitting is computed as:
Accordingly, the SDR value used by M5Boost is expressed as:
In M5Boost, the splitting attribute and threshold that yield the maximum SDR are selected for recursive partitioning. M5Boost aims to maximize this expression to ensure the residuals in the child nodes are more homogeneous. The recursive partitioning process continues until predefined stopping criteria are satisfied, such as insufficient variance reduction or minimum sample constraints.
Unlike conventional regression trees that assign constant prediction values to leaf nodes, the M5Boost method constructs multivariate linear regression models at leaf nodes. For a leaf node
, the local regression model is defined as:
where
denotes the intercept coefficient,
represents the regression coefficient associated with the
-th feature, and the variable
represents the dimensionality of the input feature space.
M5Boost ensures model robustness through two critical post-processing steps: pruning and smoothing.
To improve generalization capability and reduce overfitting, the proposed approach employs pruning operations during tree construction. In the pruning stage, subtree structures are recursively evaluated and replaced by regression models whenever the estimated prediction error of the subtree exceeds the error generated by the corresponding model. The estimated pruning error (
) used in M5Boost is defined as:
where
represents the number of training instances associated with node
,
denotes the number of parameters (coefficients) in the corresponding regression model,
represents the residual value of the
-th sample at boosting iteration
, and
denotes the prediction generated by the model for input sample
. This pruning mechanism simplifies the tree structure while maintaining predictive performance and reducing unnecessary model complexity.
M5Boost also employs smoothing operations between parent and child nodes in order to reduce abrupt prediction discontinuities between neighboring leaf nodes. The smoothing process combines the predictions generated by a child node and its parent node, thereby improving prediction stability and robustness throughout the tree structure. The smoothing equation used in M5Boost is expressed as:
where
denotes the final smoothed prediction value,
represents the prediction generated by the child node,
refers to the prediction generated by the parent node,
is the number of training samples associated with the child node, and
denotes the smoothing constant controlling the contribution of the parent prediction.
During the prediction stage, an input sample is first routed through the hierarchical decision structure of the M5 Model Tree according to the learned splitting conditions. After reaching the corresponding leaf node, the prediction value is obtained from the associated local regression equation.
By integrating recursive partitioning, local regression modeling, tree-pruning operations, smoothing mechanisms, and additive residual correction, M5Boost provides an effective and interpretable solution for estimation problems characterized by nonlinear and complex relationships.
Algorithm 1 presents pseudocode illustrating the iterative execution flow of M5Boost and detailing how the final predictive model is systematically constructed. First, the algorithm is initialized by computing the mean target value of the training dataset to establish a baseline
. At each boosting iteration, residual errors are computed by subtracting the current ensemble predictions from the actual target values and the subset
is defined. Subsequently, a new M5 Model Tree is trained using these residual values in order to fit the remaining prediction errors that could not be captured by the previous ensemble structure. During the tree construction stage, candidate splitting attributes are recursively evaluated using the standard deviation reduction (SDR) criterion, and the attribute providing the maximum SDR value is selected to partition the data into more homogeneous subsets. Accordingly, the current node
is recursively partitioned into left (
) and right (
) child subsets, and the node collection is updated. This recursive partitioning process continues until the predefined stopping criteria are satisfied, resulting in a hierarchical tree topology
. After the tree topology has been established, local multivariate linear regression models are generated for all leaf nodes
. The algorithm maps the tree topology
and its corresponding leaf equations into a base tree structure,
. To improve predictive robustness and generalization capability, pruning and smoothing are subsequently applied to the constructed model tree as post-processing operations. After all these phases, the newly generated M5 Model Tree is incorporated into the ensemble model through the additive regression updating mechanism. By applying the shrinkage parameter
to each tree, M5Boost gradually refines the ensemble’s accuracy while maintaining generalization. This iterative learning process continues until the predefined number of boosting iterations (
) is reached. As a result, M5Boost constructs a strong ensemble regression model composed of multiple complementary model trees.
| Algorithm 1: M5Boost |
while do while stopping criteria not satisfied do end while end while return
|
4. Experimental Studies
4.1. Dataset Description
This study used a publicly available dataset obtained from the SpritMonitor (
https://www.spritmonitor.de/) (accessed on 25 April 2026) platform and stored in a GitHub version 2.55.0 (
https://github.com/armiro/crawlers/tree/master/SpritMonitor-Crawler) (accessed on 25 April 2026) repository [
44]. SpritMonitor is a collaborative crowdsourced web platform where vehicle owners voluntarily share detailed information regarding their charging events and driving activities. The platform contains extensive real-world operational data for electric vehicles, including trip distance, average speed, driving conditions, and additional vehicle-related information. Unlike standardized laboratory data, this platform stores dynamic field data from thousands of electric vehicle users, encompassing diverse driving styles, environmental conditions, and inherent variability of EV usage. Due to its extensive scale and continuously updated structure, it serves as a high-potential data source for developing and evaluating advanced range estimation models in the EV domain.
The original dataset [
44] was collected using web crawlers from the website and included records over the 2014–2019 period. In this study, the dataset was further systematically extended with newly collected records from the same platform. As a result, the final dataset spans the period from 18 December 2014 to 7 April 2026, corresponding to a total duration of more than 11 years.
The experiments were conducted using data belonging to the Volkswagen e-Golf, which was selected due to its large number of available records and balanced distribution across various users. The final dataset consists of records collected from 10 distinct EVs owned by different drivers. In total, the dataset contains 8501 trip records that reflect diverse real-world battery-aware driving scenarios.
Table 2 summarizes the specifications of the vehicles incorporated in the dataset, including production year, power rating, gearbox type, number of records, total traveled distance, and data collection period.
Table 3 describes the features integrated into the study. A total of 14 input features and 1 target variable were used in the proposed ML-based range estimation framework. The input space is categorized into five primary domains: (i) Vehicle Specifications: It captures intrinsic hardware attributes such as production year, maximum power output, and the relative age of the EV. (ii) Usage Info: It incorporates ordinal-encoded odometer readings and nominal tire types to account for mechanical wear and rolling resistance. (iii) Energy Metrics: It contains continuous variables, including trip-specific energy consumption (kWh) and average speed (km/h), which serve as primary indicators of energy intensity. (iv) Environmental Factors: It accounts for external influences through seasonal temperature categories and binary indicators for auxiliary energy loads (A/C and Park Heating). (v) Driving Profiles: It represents the spatial context of the trip (City, Motorway, Country Roads) and the subjective driving style, ranging from normal to fast.
Table 4 presents representative sample records within the dataset used in this study. These sample instances demonstrate the diversity of the dataset in terms of vehicle production year, tire type, driving style, ambient temperature conditions, and average driving speed. The presented records also highlight the variability in the traveled EV trip range under different operational conditions, which is essential for developing a robust and generalized ML-based range estimation model.
4.2. Feature Engineering
Feature engineering plays a critical role in ML-based range estimation frameworks since the driving range of EVs is impacted by numerous operational, vehicle-related, and environmental factors. In this study, several feature engineering operations were performed to improve data quality and therefore enhance prediction performance. The overall process consisted of feature construction, feature extraction, discretization, feature encoding, feature removal, handling missing values, and noise/outlier removal.
In the first stage, a new feature named Vehicle Age was constructed by subtracting the vehicle production year from the charging year. The age of an EV can significantly affect its driving range due to battery degradation over time. For instance, lithium-ion batteries gradually lose their energy storage capacity as the number of charge–discharge cycles increases. Older vehicles generally exhibit reduced battery efficiency and lower usable battery capacity compared to newer vehicles. As a result, the same amount of energy yields a shorter driving distance in older EVs.
In the second stage, the month information was extracted from the date value and then used as an indicator of ambient temperature. Ambient temperature has a direct impact on EV driving range. In cold weather conditions, the kinetics of electrochemical reactions within the battery cells inherently slow down, leading to reduced battery capacity and increased energy consumption. Moreover, cabin heating systems consume additional electrical energy, which further decreases the available driving range. In contrast, hot weather conditions may also negatively affect the net vehicular range due to increased air-conditioning usage and active thermal regulation requirements.
While discretization may reduce the granularity of numerical information and potentially lead to information loss, directly feeding highly fluctuating real-world variables into tree-based architectures can amplify noise effects and reduce the stability of decision boundaries due to data variability. To evaluate whether discretization is beneficial for the considered EV range estimation problem, a comparative analysis was conducted using both the raw continuous representations and the discretized versions of the ambient temperature and odometer features. The empirical evaluation revealed that the discretized representation achieved superior predictive performance (MAE = 3.8411, RMSE = 7.8485) compared with the continuous representation (MAE = 3.9145, RMSE = 8.0680). This observation confirmed that the discretization process effectively captured meaningful insights while filtering out non-informative micro-variations, thereby enhancing the predictive accuracy of the global model.
Since the adopted real-world dataset does not provide recorded ambient temperature measurements or geographic information (e.g., city or region) for individual trips, the month value was used as a proxy for seasonal weather conditions. Since feeding continuous month/temperature approximations into the model actually degraded the prediction performance as described above, the months December, January, and February were categorized as Cold, the months from June to August were assigned to Hot, and the remaining months were labeled as Mild. Furthermore, the numerical Odometer feature was converted into three-tier categorical usage levels based on the cumulative distance traveled by the vehicle. Vehicles with odometer values not exceeding 40,000 km were categorized as Low usage level and denoted by 0, vehicles with mileage from 40,000 km to 90,000 km were assigned to Medium usage level and denoted by 1, and finally, vehicles exhibiting odometer readings greater than 90,000 km were classified as High usage level and denoted by 2. The total traveled distance of a vehicle may influence EV range due to long-term battery degradation and mechanical aging effects. Vehicles with higher odometer values are generally subjected to a greater number of charging cycles, which may consequently lead to reduced battery performance and operational efficiency. Instead of using raw odometer values directly, discretization was applied to simplify the interpretation of vehicle wear levels, reduce the influence of extreme numerical values, and improve the generalization of the M5Boost model within the ML framework.
During this stage, several categorical attributes were encoded into numerical representations to ensure compatibility with ML algorithms. The Driving Style feature was mapped to ordinal values: Normal = 0, Moderate = 1, and Fast = 2. Driving behavior is one of the influential factors affecting EV range. Fast and aggressive driving generally leads to higher acceleration rates, increased power demand, and greater energy consumption. Consequently, the available driving range decreases significantly under high-speed driving conditions. Similarly, the Tire Type attribute was encoded as follows: Winter tires were represented by 0, All-year tires by 1, and Summer tires by 2. Tire characteristics directly influence rolling resistance and thereby dictate vehicle energy efficiency. Winter tires generally exhibit higher rolling resistance due to the inherent nature of their softer rubber compounds and specialized tread structures, which may increase energy consumption and reduce the achievable driving range. Summer tires typically provide reduced rolling resistance and enhanced efficiency under suitable temperature conditions, while all-year tires offer a balanced intermediate performance.
In this preprocessing stage, several features were removed from the data since they did not provide statistically meaningful discriminative information for machine learning. Since the dataset only contains Volkswagen e-Golf vehicles, the attributes manufacturer, model, and version consisted of a single unique value throughout the entire dataset and were therefore discarded. Similarly, the fuel-type attribute was eliminated because all vehicles in the dataset were solely EVs. Furthermore, the consumption feature was excluded since it is computationally derived from energy quantity and trip distance values. Including this variable could introduce redundancy and potentially lead to data leakage during M5Boost model training.
In this stage, a small number of records with missing values were removed from the dataset since they could negatively affect the M5Boost model training and evaluation processes. They were particularly observed in the Average Speed attribute and the target attribute, Trip Distance.
In the final preprocessing stage, noise and outlier samples were eliminated using the Isolation Forest algorithm. Isolation Forest is an effective anomaly detection method that can successfully identify abnormal observations based on random partitioning principles without requiring assumptions about data distribution. Outlier removal is particularly important in EV range estimation problems since sensor errors, incorrect user entries, or unrealistic trip records may negatively affect the model learning and reduce prediction accuracy.
Table 5 presents the descriptive statistics for the numerical features in the cleaned dataset after completing the feature engineering operations. The table summarizes the minimum, maximum, mean, and standard deviation values of the attributes used in the proposed EV range estimation framework. According to the statistics, the Quantity feature ranges from 0.01 kWh to 34.97 kWh, with an average value of 8.71 kWh, indicating considerable fluctuations in energy consumption patterns among different trips. Similarly, the Average Speed attribute reflects the diversity of driving environments and driver behaviors contained in the dataset. The Vehicle Age feature spans from 1 to 11 years, demonstrating that the dataset includes both relatively new and aged EVs, which is essential for analyzing battery aging effects on driving range. Furthermore, the Trip Distance target variable, with a mean value of 58.99 km, highlights the diverse nature of real-world EV driving conditions and trip characteristics.
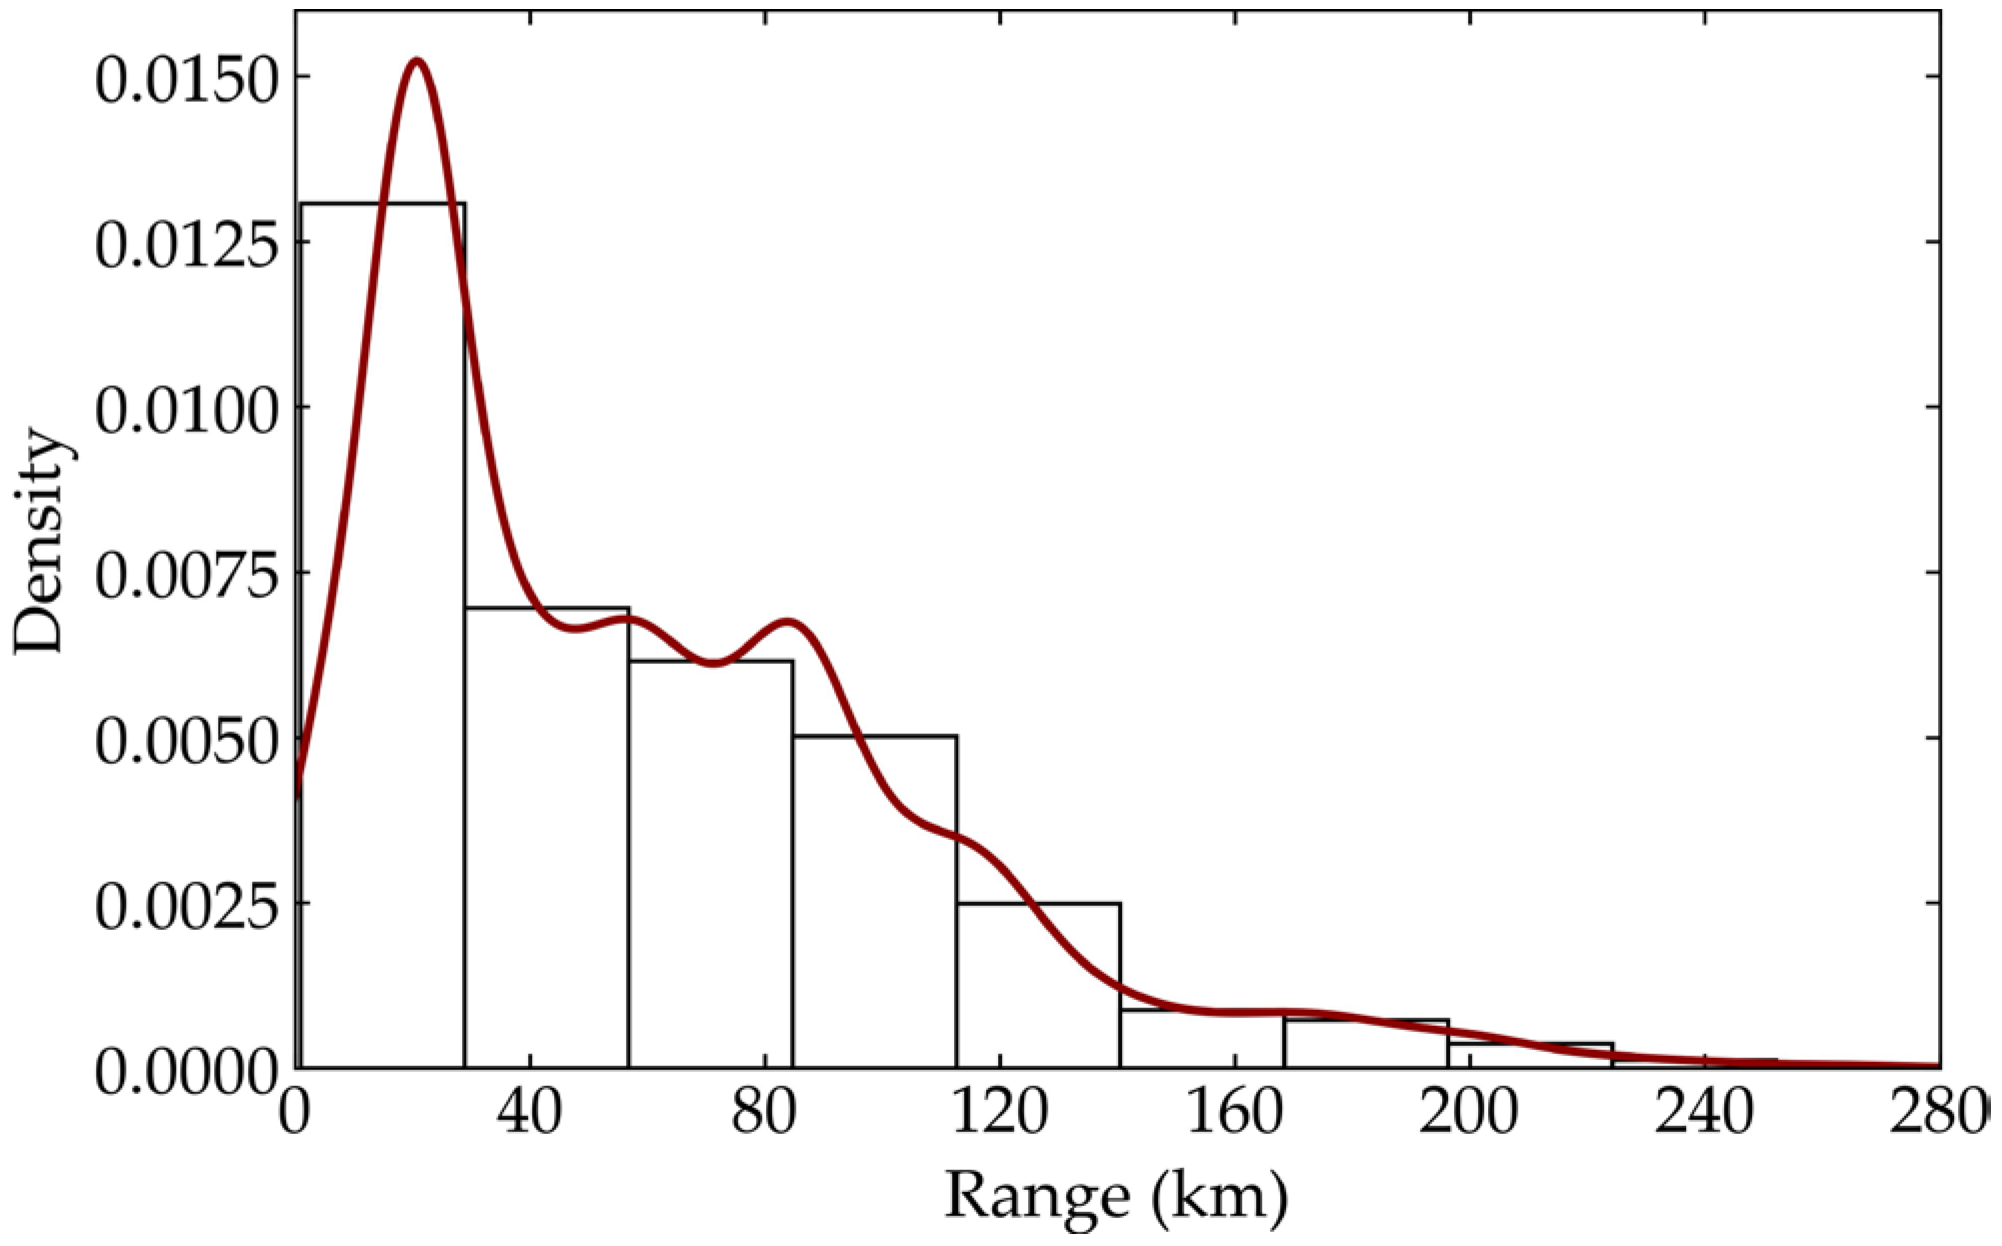
Figure 2 presents the distribution of driving range values for the entire dataset, with a probability density histogram superimposed on a Kernel Density Estimation (KDE) curve. As can be observed, the dataset is naturally skewed toward shorter driving ranges (below 120 km), with progressively fewer samples for long-distance trips (up to 280 km). This distribution accurately reflects the empirical nature of real-world electric vehicle utilization, where daily regional routines and urban commutes dominate the dataset, while long-range inter-city trips represent a smaller fraction of operations.
4.3. Feature Selection
Feature selection is a critical phase in the machine learning pipeline, as it directly influences the predictive performance and interpretability of models. This process systematically examines the underlying statistical relationships between the input feature space and the target variable. By identifying and selecting the most informative attributes, it effectively achieves significant computational complexity reduction, model generalization capability improvement, and the elimination of redundant or irrelevant information. In this study, Mutual Information (MI) was employed as the feature selection technique. Formally, MI quantifies the amount of information obtained about a variable through observing the other. Higher MI values indicate stronger dependency and greater predictive relevance between the feature and the target variable. It is calculated as:
where
denotes an input feature and
refers to the continuous target variable,
is mutual information between them. Specifically, the symbol
corresponds to the joint probability of these values (
and
). Here, the notations
and
are the individual marginal probabilities of
and
, respectively. According to the foundational theorem: If
and
maintain absolute indpendence then
, which simplifies the logarithmic component to
and
. Conversely, whenever
provides information about
, the MI score strictly exceeds zero.
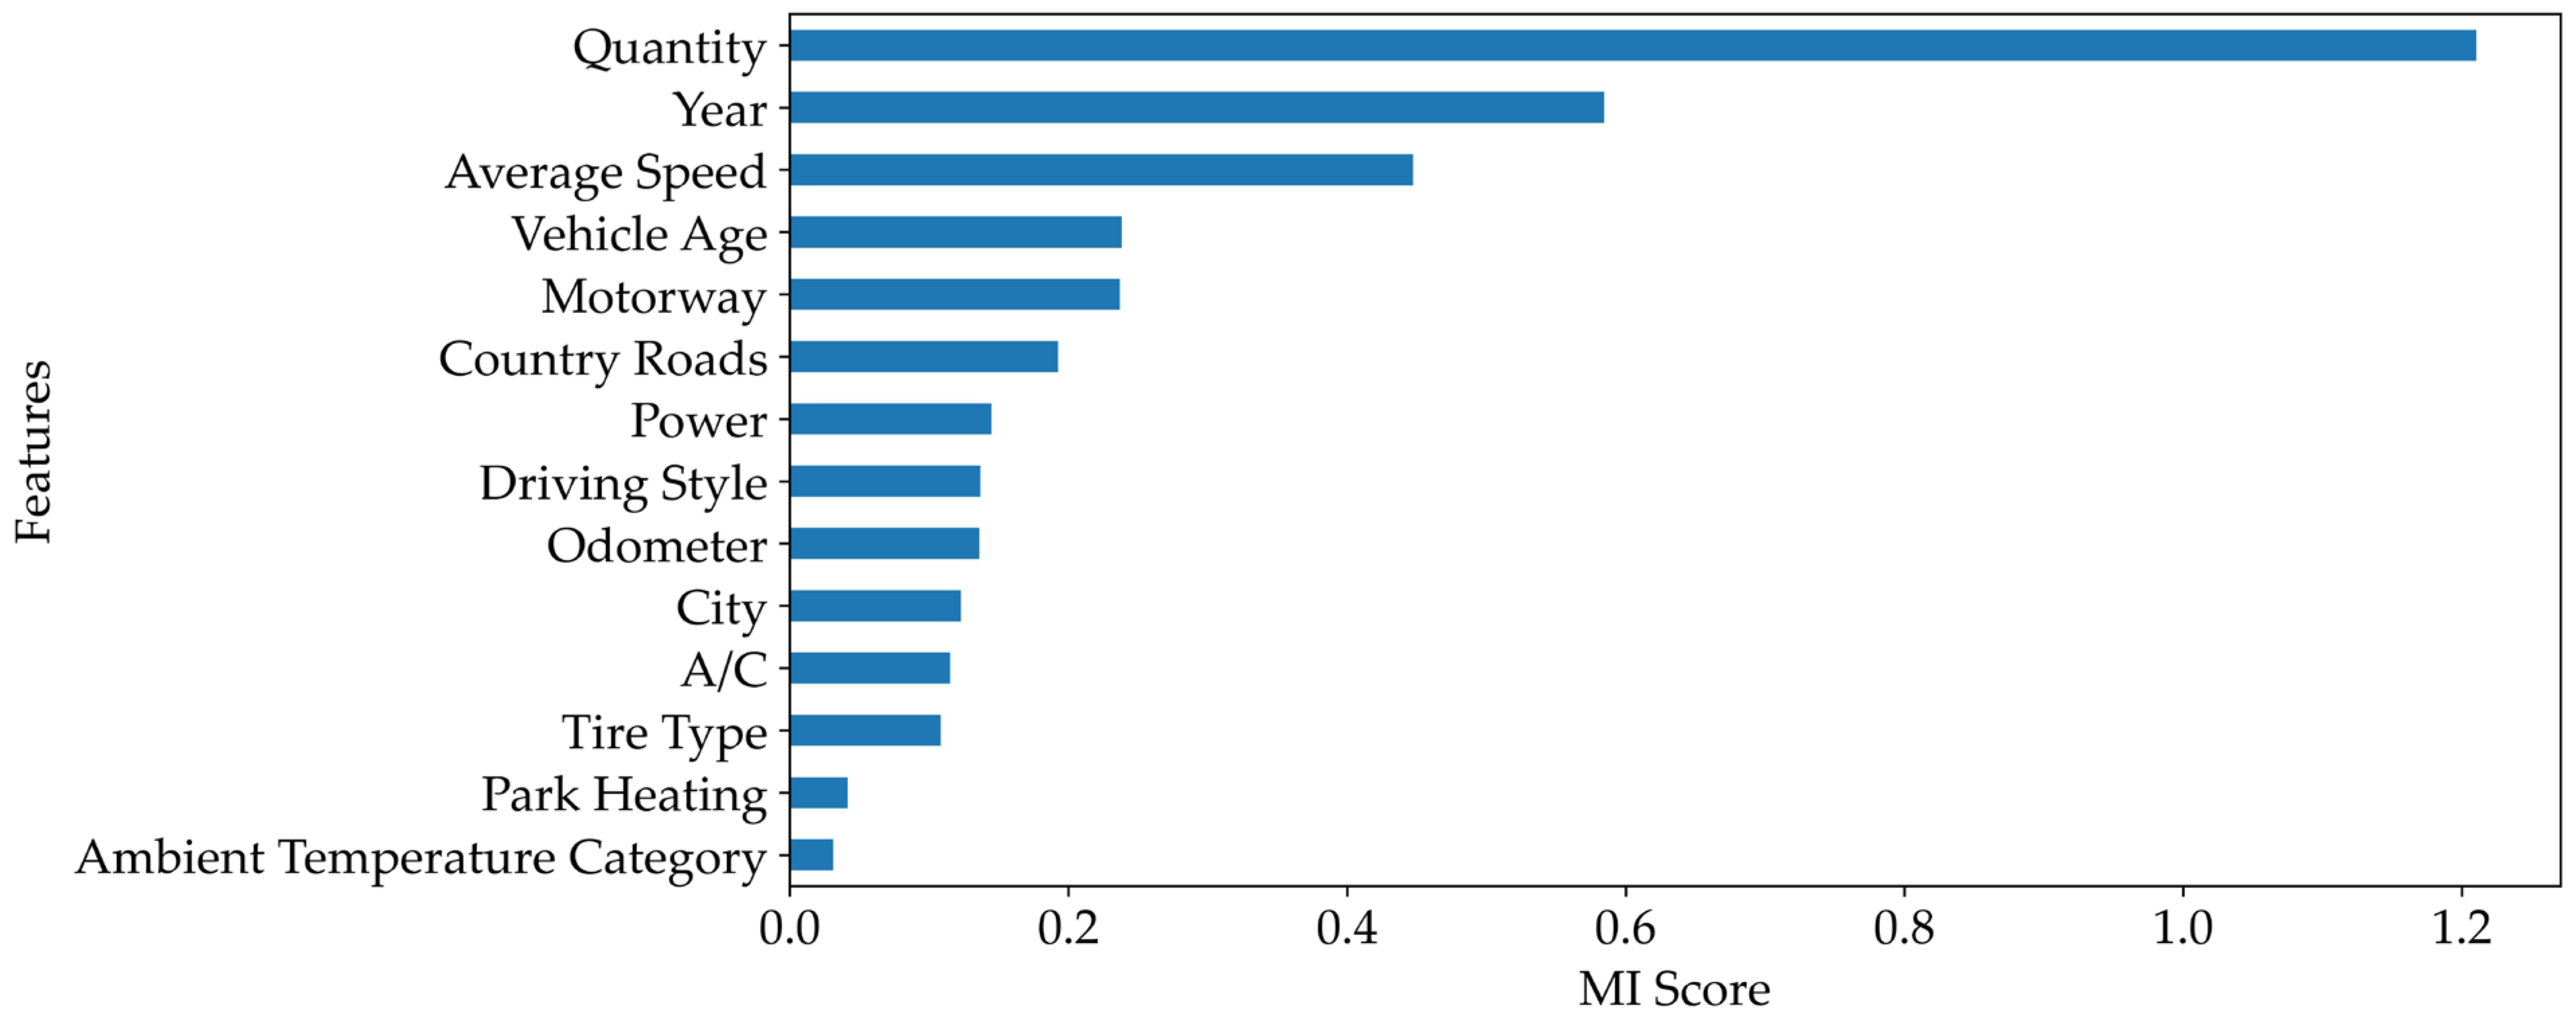
Figure 3 shows the calculated MI scores for all candidate features in descending order. As revealed by the empirical data, Quantity exhibited the highest informational gain, indicating its role as the most influential predictor of EV range estimation. This is followed by temporal and dynamic factors, namely Year and Average Speed. Furthermore, vehicle age, motorway usage, and country road driving also demonstrated relatively high MI values, suggesting their significant contributions to range estimation. Overall, the results confirm that range estimation is influenced by a combination of vehicle characteristics, energy-related variables, driving conditions, and operational factors.
To determine the optimal feature subset, an iterative analysis was conducted using the MI ranking results. Starting from the lowest-scoring attributes, features were systematically removed one by one, and the model was retrained after each elimination step.
Table 6 presents the performance metrics obtained during this sequential elimination procedure. The findings demonstrated that the best predictive performance was achieved when the top eight features were used. These results indicate that a compact subset of highly informative features can provide better generalization capability while reducing model complexity.
4.4. Implementation Details
M5Boost was implemented in the Java programming language by leveraging the extensive algorithmic capabilities of the Weka version 3.8.6 (University of Waikato, Hamilton, New Zealand) machine learning library [
45] within the Eclipse IDE version 4.26.0 (The Eclipse Foundation, Brussels, Belgium) development environment. The implementation process included the integration of the M5 Model Tree algorithm [
46] with the additive regression meta-learning strategy in order to construct a boosting-based EV range estimation framework.
To comprehensively validate the effectiveness of M5Boost, performance comparisons were carried out against 11 prominent ML regression approaches. The compared methods include K-Nearest Neighbors (KNN), KStar, Locally Weighted Learning (LWL), Linear Regression, Neural Network, Support Vector Machine (SVM), Random Forest, ElasticNet, Light Gradient Boosting Machine (LightGBM), Extreme Gradient Boosting (XGBoost), and Categorical Boosting (CatBoost).
Prior to the training phase, feature selection was applied to identify the most informative attributes affecting EV range estimation performance. The details of the feature selection procedure are presented in
Section 4.3. For evaluation, the experimental workflow followed a hold-out validation strategy. Specifically, 90% of the dataset was allocated for model training, while the remaining 10% was reserved strictly for final blind performance testing. This experimental configuration enabled the proposed M5Boost framework and the competing ML models to be assessed under identical data distribution conditions. Furthermore, as described in
Section 4.6, hyperparameter tuning processes were performed for all ML models to ensure fair and reliable performance comparisons. Specifically, the entire training pipeline was repeatedly executed from scratch using different hyperparameter configurations through independent runs, and the predictive performance of each configuration was assessed using previously unseen test samples. In each run of the grid-search methodology, the model was trained exclusively on the training partition, and the test partition was never used during model fitting. Therefore, no information from the test data was incorporated into the training process. Moreover, a specialized sensitivity analysis was integrated into the study to evaluate the impact of human-centric variables on the model’s performance, which is detailed in
Section 4.7.
For evaluation, the experimental workflow followed a hold-out validation strategy. Specifically, 90% of the dataset was allocated for model training, while the remaining 10% was reserved for final performance testing. This experimental configuration enabled M5Boost and the competing ML models to be assessed under identical data distribution conditions.
To evaluate the predictive accuracy of the proposed M5Boost framework for EV range estimation, three widely used regression assessment measures, namely Mean Absolute Error (MAE), Root Mean Squared Error (RMSE), and Mean Absolute Percentage Error (MAPE), were used. In EV range estimation problems, these measures are specifically tailored to analyze the deviation between the actual and predicted driving ranges obtained from the machine learning model.
Mean Absolute Error (MAE): It provides a direct measure of how many kilometers, on average, the M5Boost model’s predictions deviate from the true range. For the range forecasting task in this study, it is formulated as:
where
is the number of trips in the test set,
denotes the true range recorded for the
-th trip, and
is the corresponding distance projected by the model. A lower MAE value indicates a more consistent and reliable prediction for the EV user.
Root Mean Squared Error (RMSE): Since the RMSE metric penalizes larger discrepancies in range estimation, it provides additional insight related to the stability and robustness of models under challenging driving conditions. It evaluates the square root of the average squared difference between the actual EV range and the predicted EV range. The RMSE formulation employed for range prediction is defined as:
Lower RMSE values indicate that the proposed M5Boost model produces more reliable and consistent EV range predictions across different operational scenarios.
Mean Absolute Percentage Error (MAPE): It is adopted as a core statistical metric by computing the normalized percentage deviation between the projected distances and the actual trip lengths. The MAPE is mathematically formulated as follows:
4.5. Results
Table 7 presents the comparative performance of M5Boost against 11 popular ML models on MAE, RMSE, and MAPE. According to the experimental outcomes, the proposed M5Boost model outperformed all other models, producing the lowest error rates with a MAE of 3.8411. These results indicate that M5Boost achieved more accurate range estimation performance compared to its alternative approaches. Among the competing ensemble learning algorithms, XGBoost and LightGBM also demonstrated strong performance; however, their prediction errors remained higher than those of the proposed M5Boost model. In contrast, traditional regression methods such as Linear Regression exhibited significantly larger error rates, indicating limited capability for modeling complex EV range estimation patterns. The superior performance of M5Boost can be attributed to the combination of additive residual learning, localized regression modeling, pruning operations, and smoothing mechanisms provided for the tree-based structure.
The MAPE results provide insights into the relative prediction accuracy of the developed models across trips with different driving ranges. While relatively high MAPE values may mainly be attributed to short-trip samples with small actual range values, lower MAPE values indicate that the predicted driving ranges are closer to the actual ranges in percentage terms.
To statistically validate the predictive precision of the proposed M5Boost approach, two different non-parametric tests (Friedman Aligned Ranks Test and Quade Test) were performed at a significance level of 0.05 in a one-vs-all configuration. The null hypothesis (H0) states that the performances of two or more methods are statistically equivalent. The Friedman Aligned Ranks Test obtained a p-value of 0.04823, which is lower than the significance threshold of 0.05, leading to the rejection of the null-hypothesis (H0). Similarly, the Quade Test resulted in a highly significant p-value of 0.00242, further confirming the rejection of H0. Therefore, the null-hypothesis was rejected in both statistical tests. These findings demonstrate that the performance differences between M5Boost and the competing ML methods are statistically significant and not due to random chance drift. Consequently, the experimental results confirm the robustness of M5Boost for EV range estimation problems.
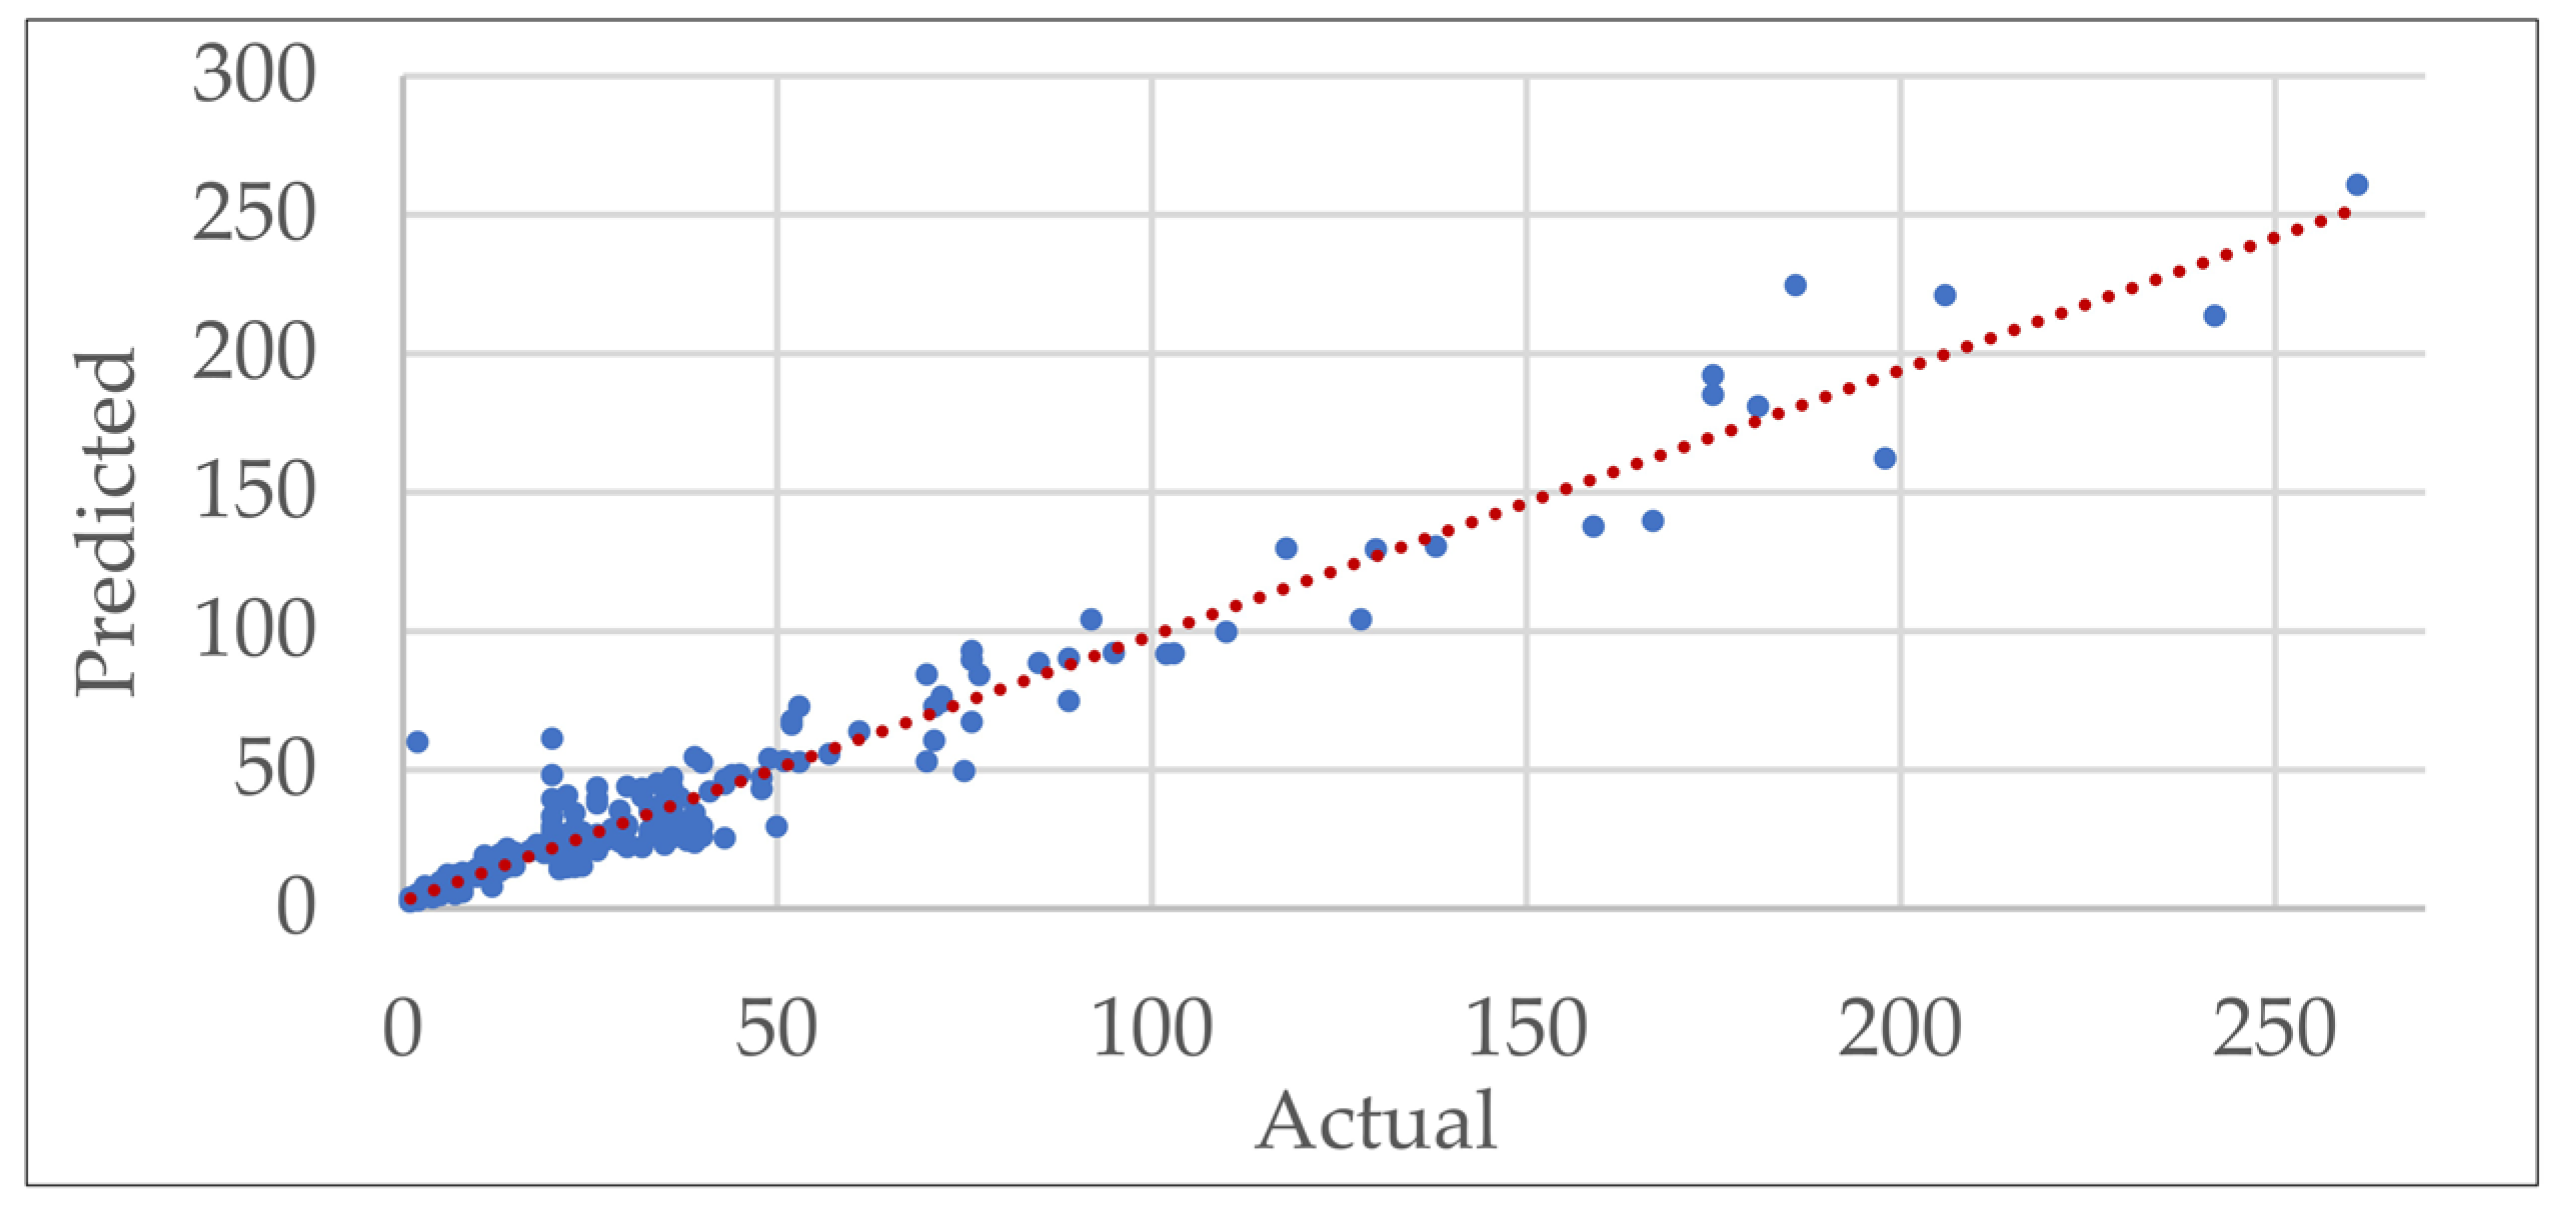
Figure 4 presents the scatter plot of actual versus estimated values generated by M5Boost for the EV range. Ideally, accurate predictions are expected to be distributed close to the dashed diagonal line (
=
), indicating a high degree of agreement between actual and projected range values. As illustrated in the figure, the estimation points are generally concentrated near the reference line, demonstrating the high predictive accuracy of M5Boost across both short-range trips and longer-distance trips. The overall distribution confirms that M5Boost successfully captures the underlying patterns of EV driving range characteristics under varying operational conditions.
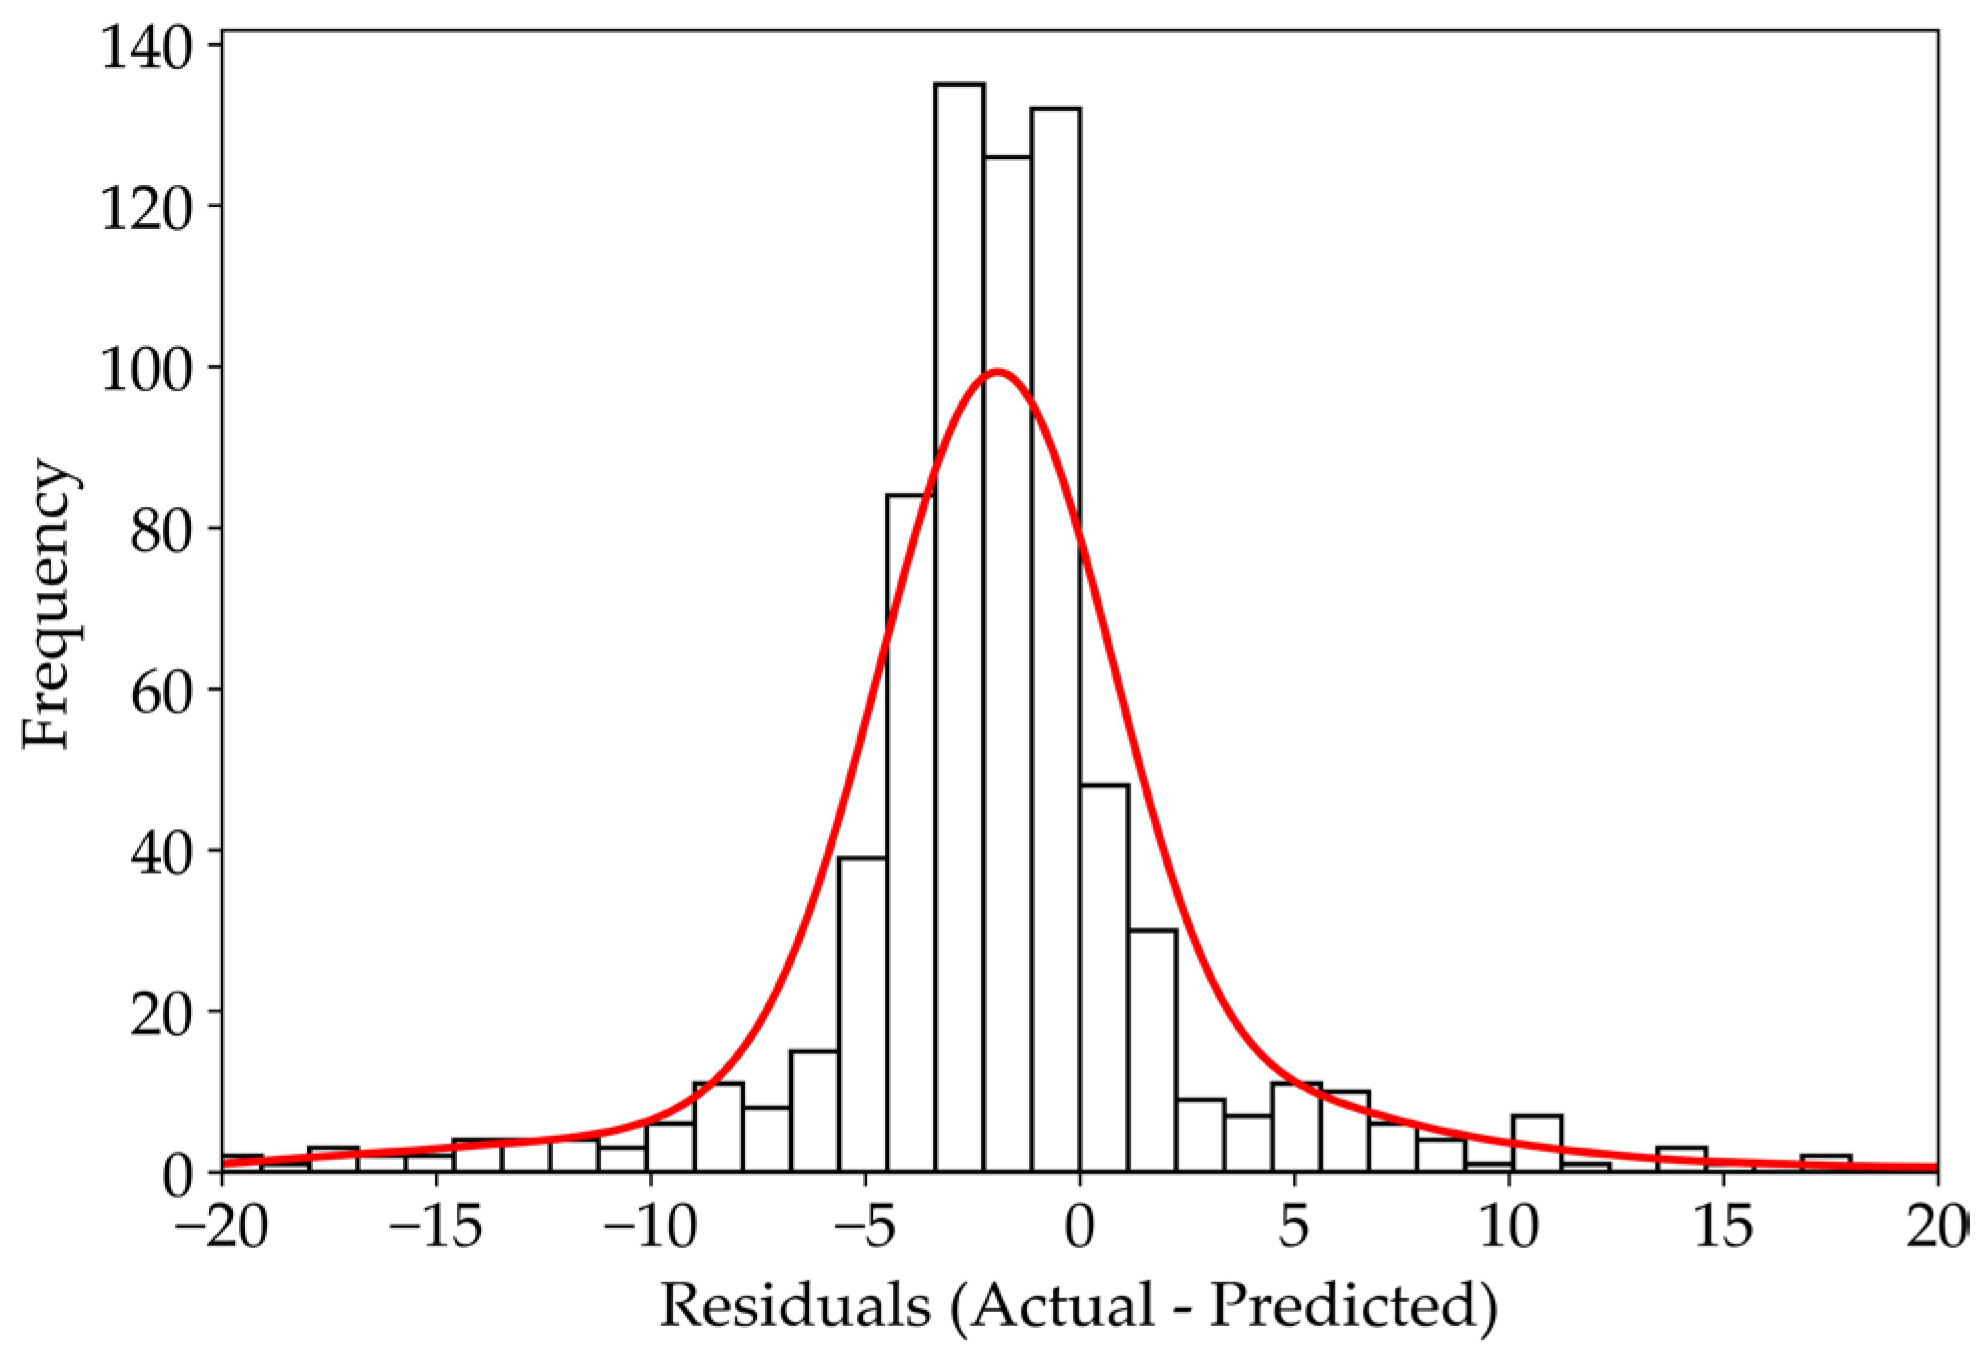
Figure 5 illustrates the distribution of residuals, representing the differences between actual and predicted driving range values. The histogram shows that the residuals are primarily centered around zero, indicating that M5Boost produced predictions with relatively small estimation errors. Furthermore, the residual distribution exhibits an approximately symmetric structure, following a nearly normal distribution as indicated by the overlaid density curve. The lack of significant skewness in the distribution confirms that the model does not consistently overestimate or underestimate the range, demonstrating unbiased predictive behavior across different EV operating conditions and trip characteristics. The relatively narrow spread of residual values is highly acceptable for real-world EV range estimation.
To illustrate the prediction behavior of the model across different scales,
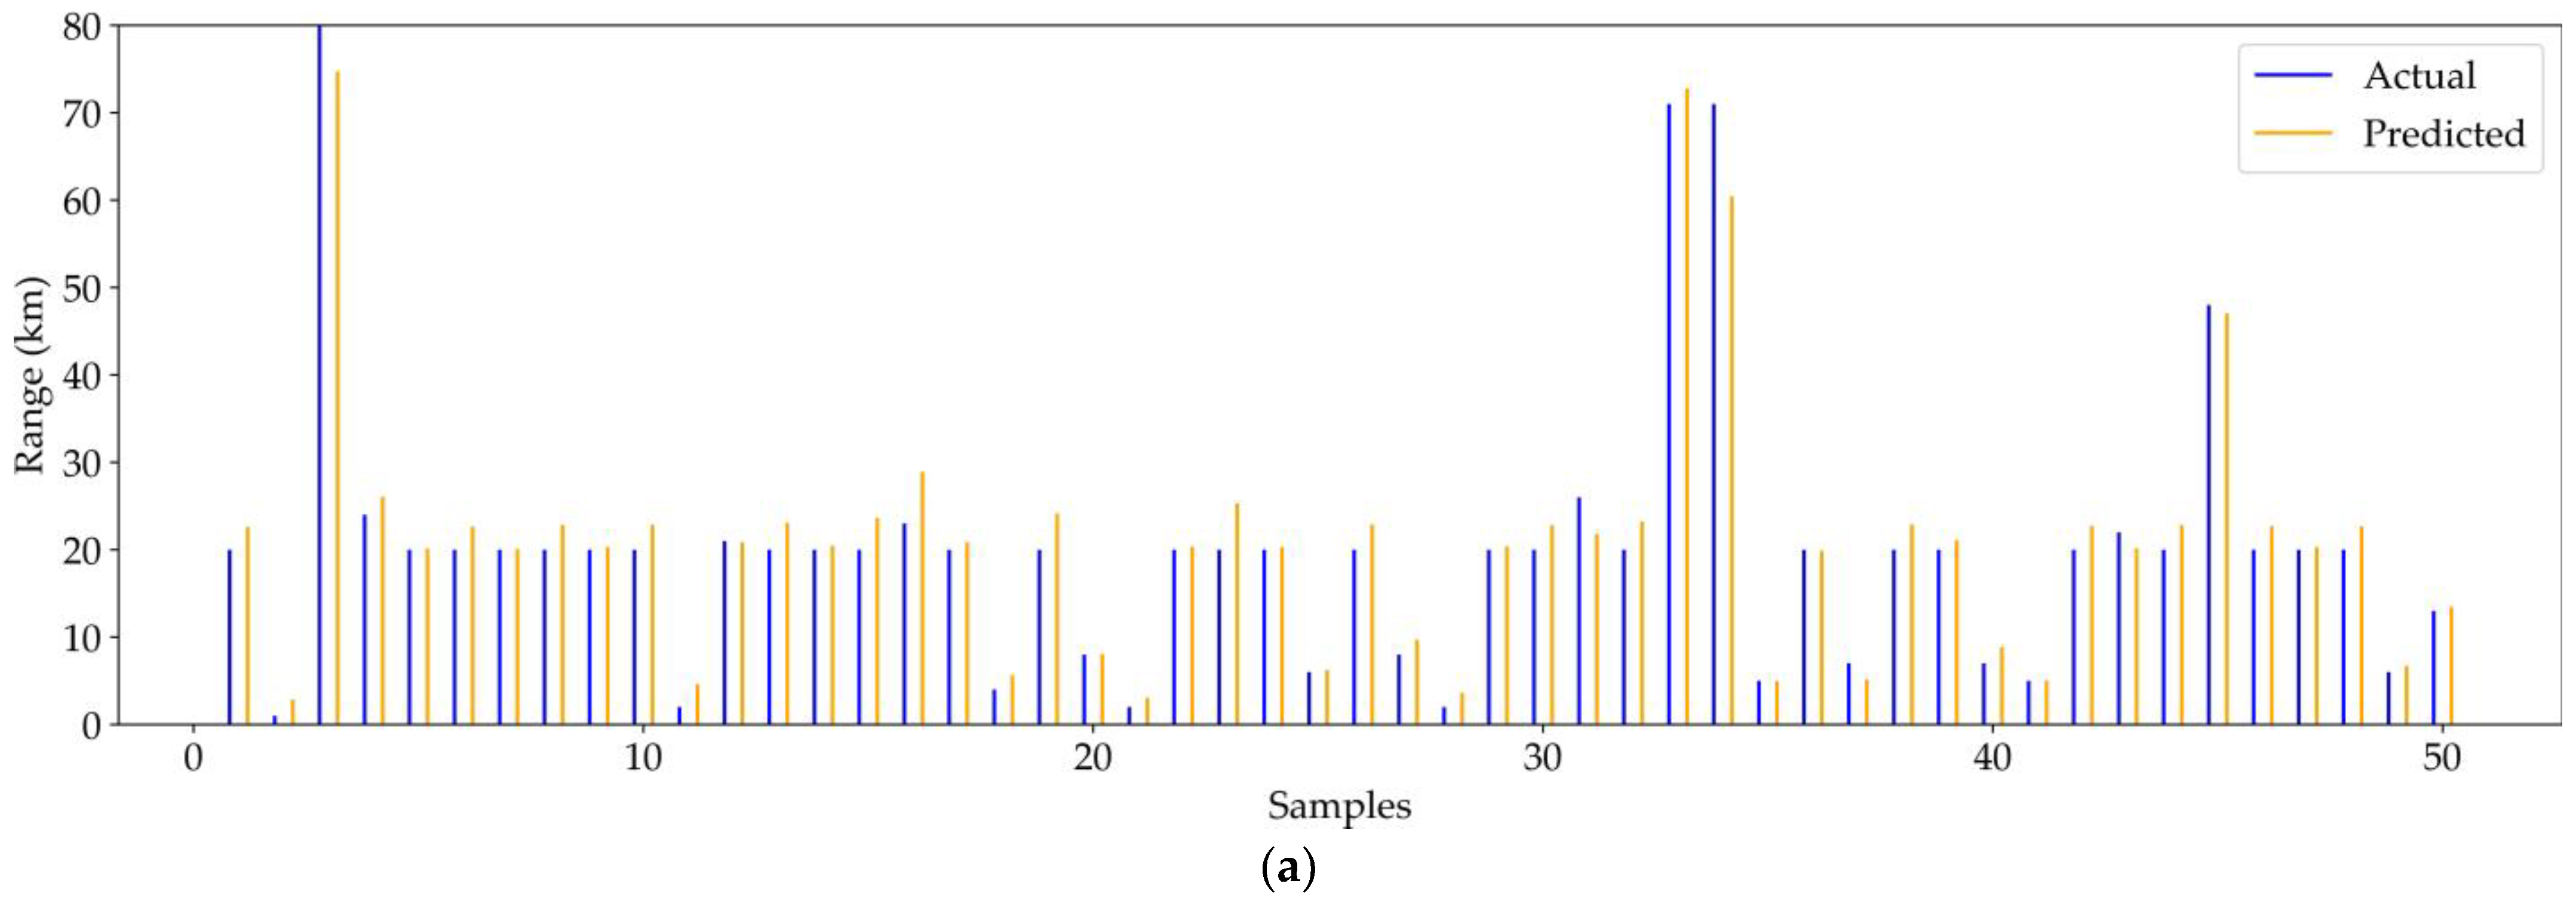
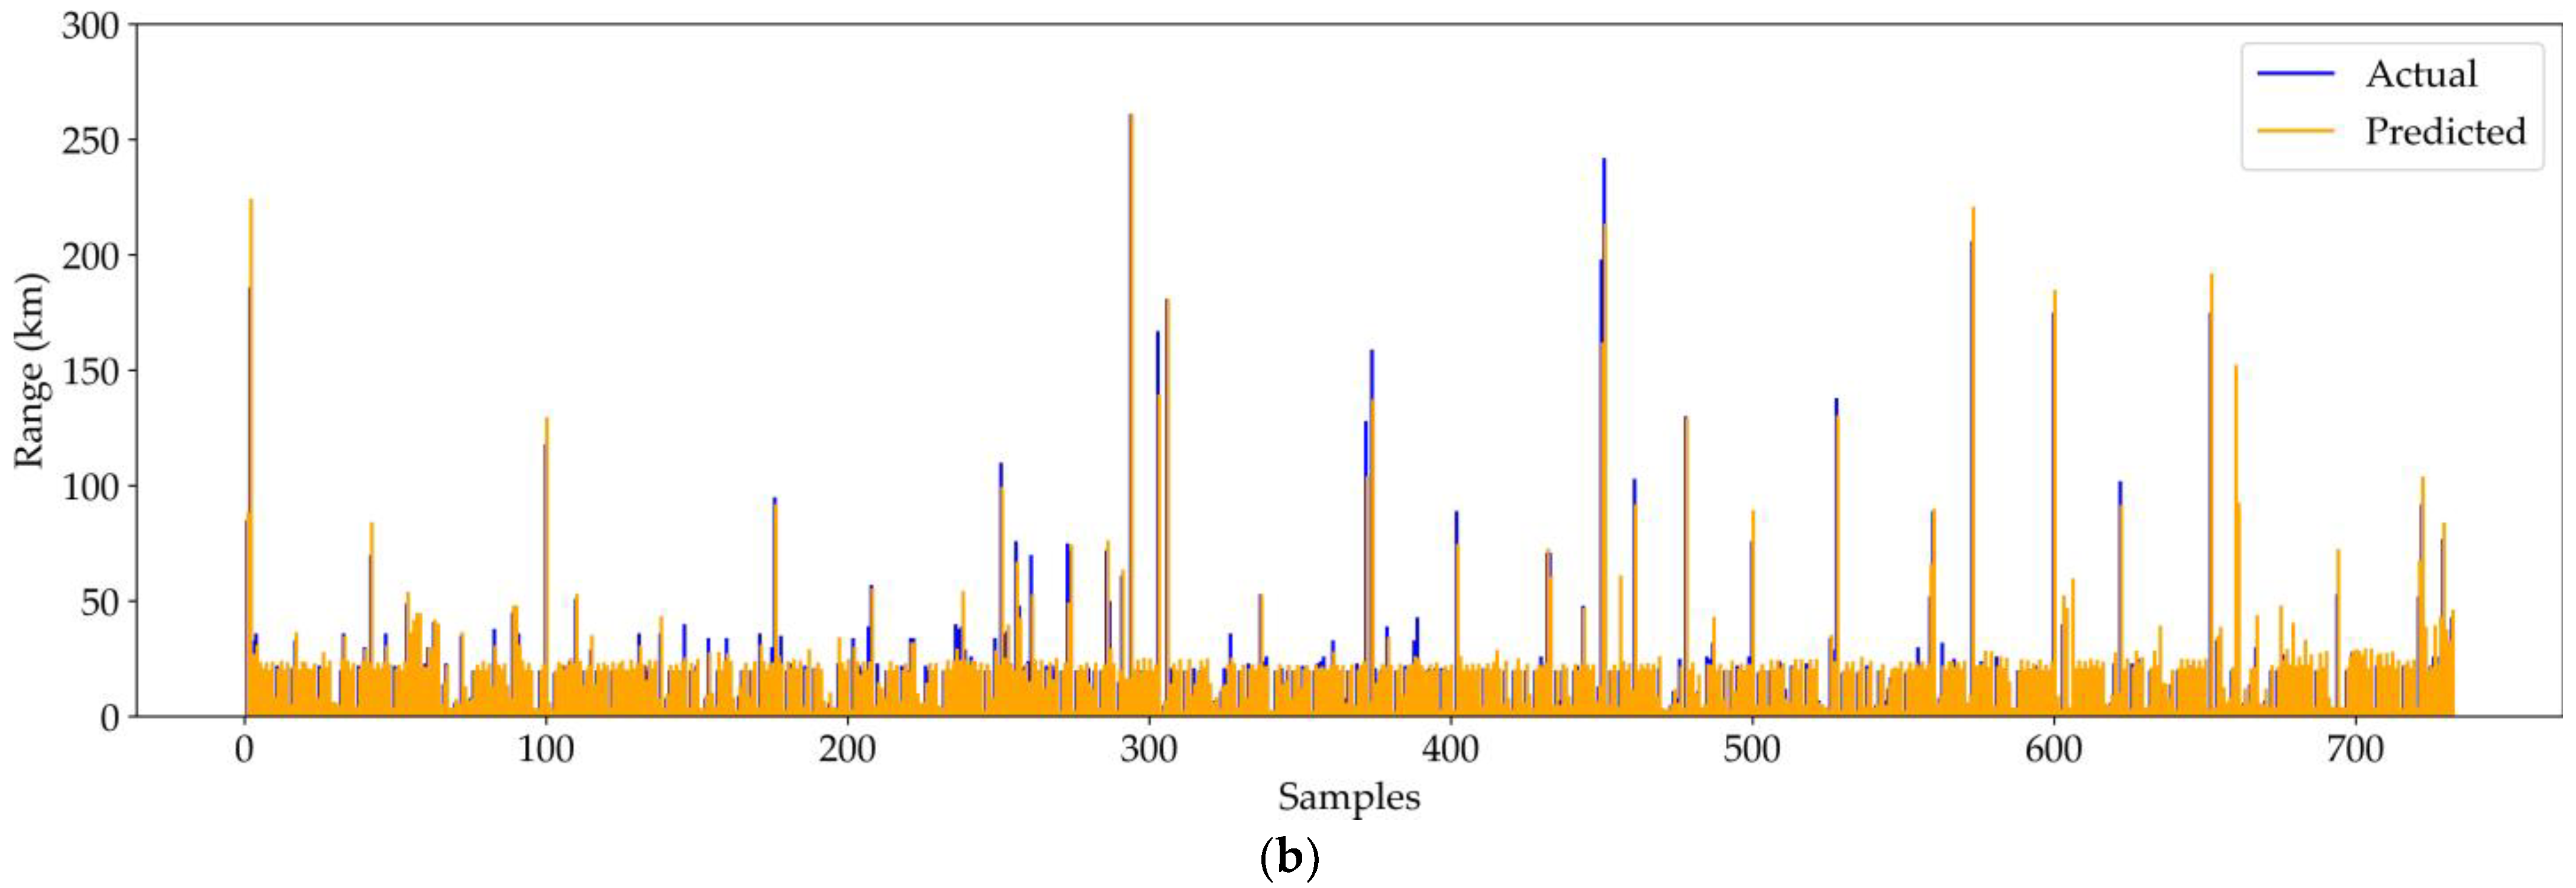
Figure 6 provides a two-part stem plot visualization comparing the actual and corresponding estimated range values generated by M5Boost. Specifically,
Figure 6a presents a clear, zoomed-in look at a subset of 50 trips to prevent visual clutter, while
Figure 6b displays the entirety of the test samples across the full distribution of trip lengths to provide a comprehensive overview. As observed, the blue lines (actual) and orange lines (predicted) show remarkable synchronization across test samples. The predicted range values closely follow the actual range values, demonstrating the capability of M5Boost to accurately estimate EV driving range under different operating conditions. This sample-based comparison confirms that the proposed framework is robust enough to handle the volatility inherent in real-world driving data.
4.6. Hyperparameter Analysis
Choosing appropriate hyperparameters is one of the most important stages for building a robust and high-performing predictive machine learning model. It directly regulates the learning behavior, structural complexity, convergence characteristics, and overfitting tendency of the model and prevents generalization errors. Since range estimation involves highly heterogeneous and nonlinear driving patterns, selecting suitable hyperparameter configurations becomes particularly important for achieving satisfactory prediction performance under varying EV operational conditions. Therefore, a grid search was conducted for all evaluated ML approaches in this study, ensuring a fair and systematic comparison under optimized experimental settings.
For each ML method used in the experimental analysis,
Table 8 presents the alternative hyperparameter configurations and the corresponding optimal values that yielded the peak estimation accuracy on the dataset. For instance-based learning methods, neighborhood-related parameters such as the number of nearest neighbors were analyzed to find a balance between localized patterns and noise smoothing. For linear regression-based approaches, regularization-related parameters were investigated to control model complexity and prevent overfitting. In the neural network configuration, learning rate and hidden layer architecture were optimized to improve nonlinear learning capability. For ensemble learning approaches, maximum tree depth, iteration count, and learning rate parameters were searched due to their significant impact on prediction capability.
The hyperparameter tuning for M5Boost was carefully executed to harmonize its additive learning structure with the underlying multivariate regression models. The optimization space for M5Boost explicitly targeted the shrinkage factor, the minimum number of instances per leaf node (minNumInstances), and the total number of boosting iterations (numIterations). As shown in
Table 8, M5Boost achieved the highest accuracy with a shrinkage parameter of 0.1, a minimum node capacity of 35, and 50 boosting iterations. This hyperparameter configuration enabled M5Boost to construct sufficiently generalized model trees while iteratively minimizing residual estimation errors without excessive overfitting.
4.7. Sensitivity Analysis
Sensitivity analysis constitutes a fundamental procedure in evaluating the structural stability and behavior of a machine learning model under different parameter settings. In this study, an analysis was conducted to investigate the operational impact of three critical hyperparameters governing M5Boost: the number of iterations (), the shrinkage factor (), and the minimum number of instances per leaf node (minNumInstances). The objective of this analysis is to identify appropriate parameter values that achieve an effective trade-off between prediction accuracy, model complexity, and generalization capability.
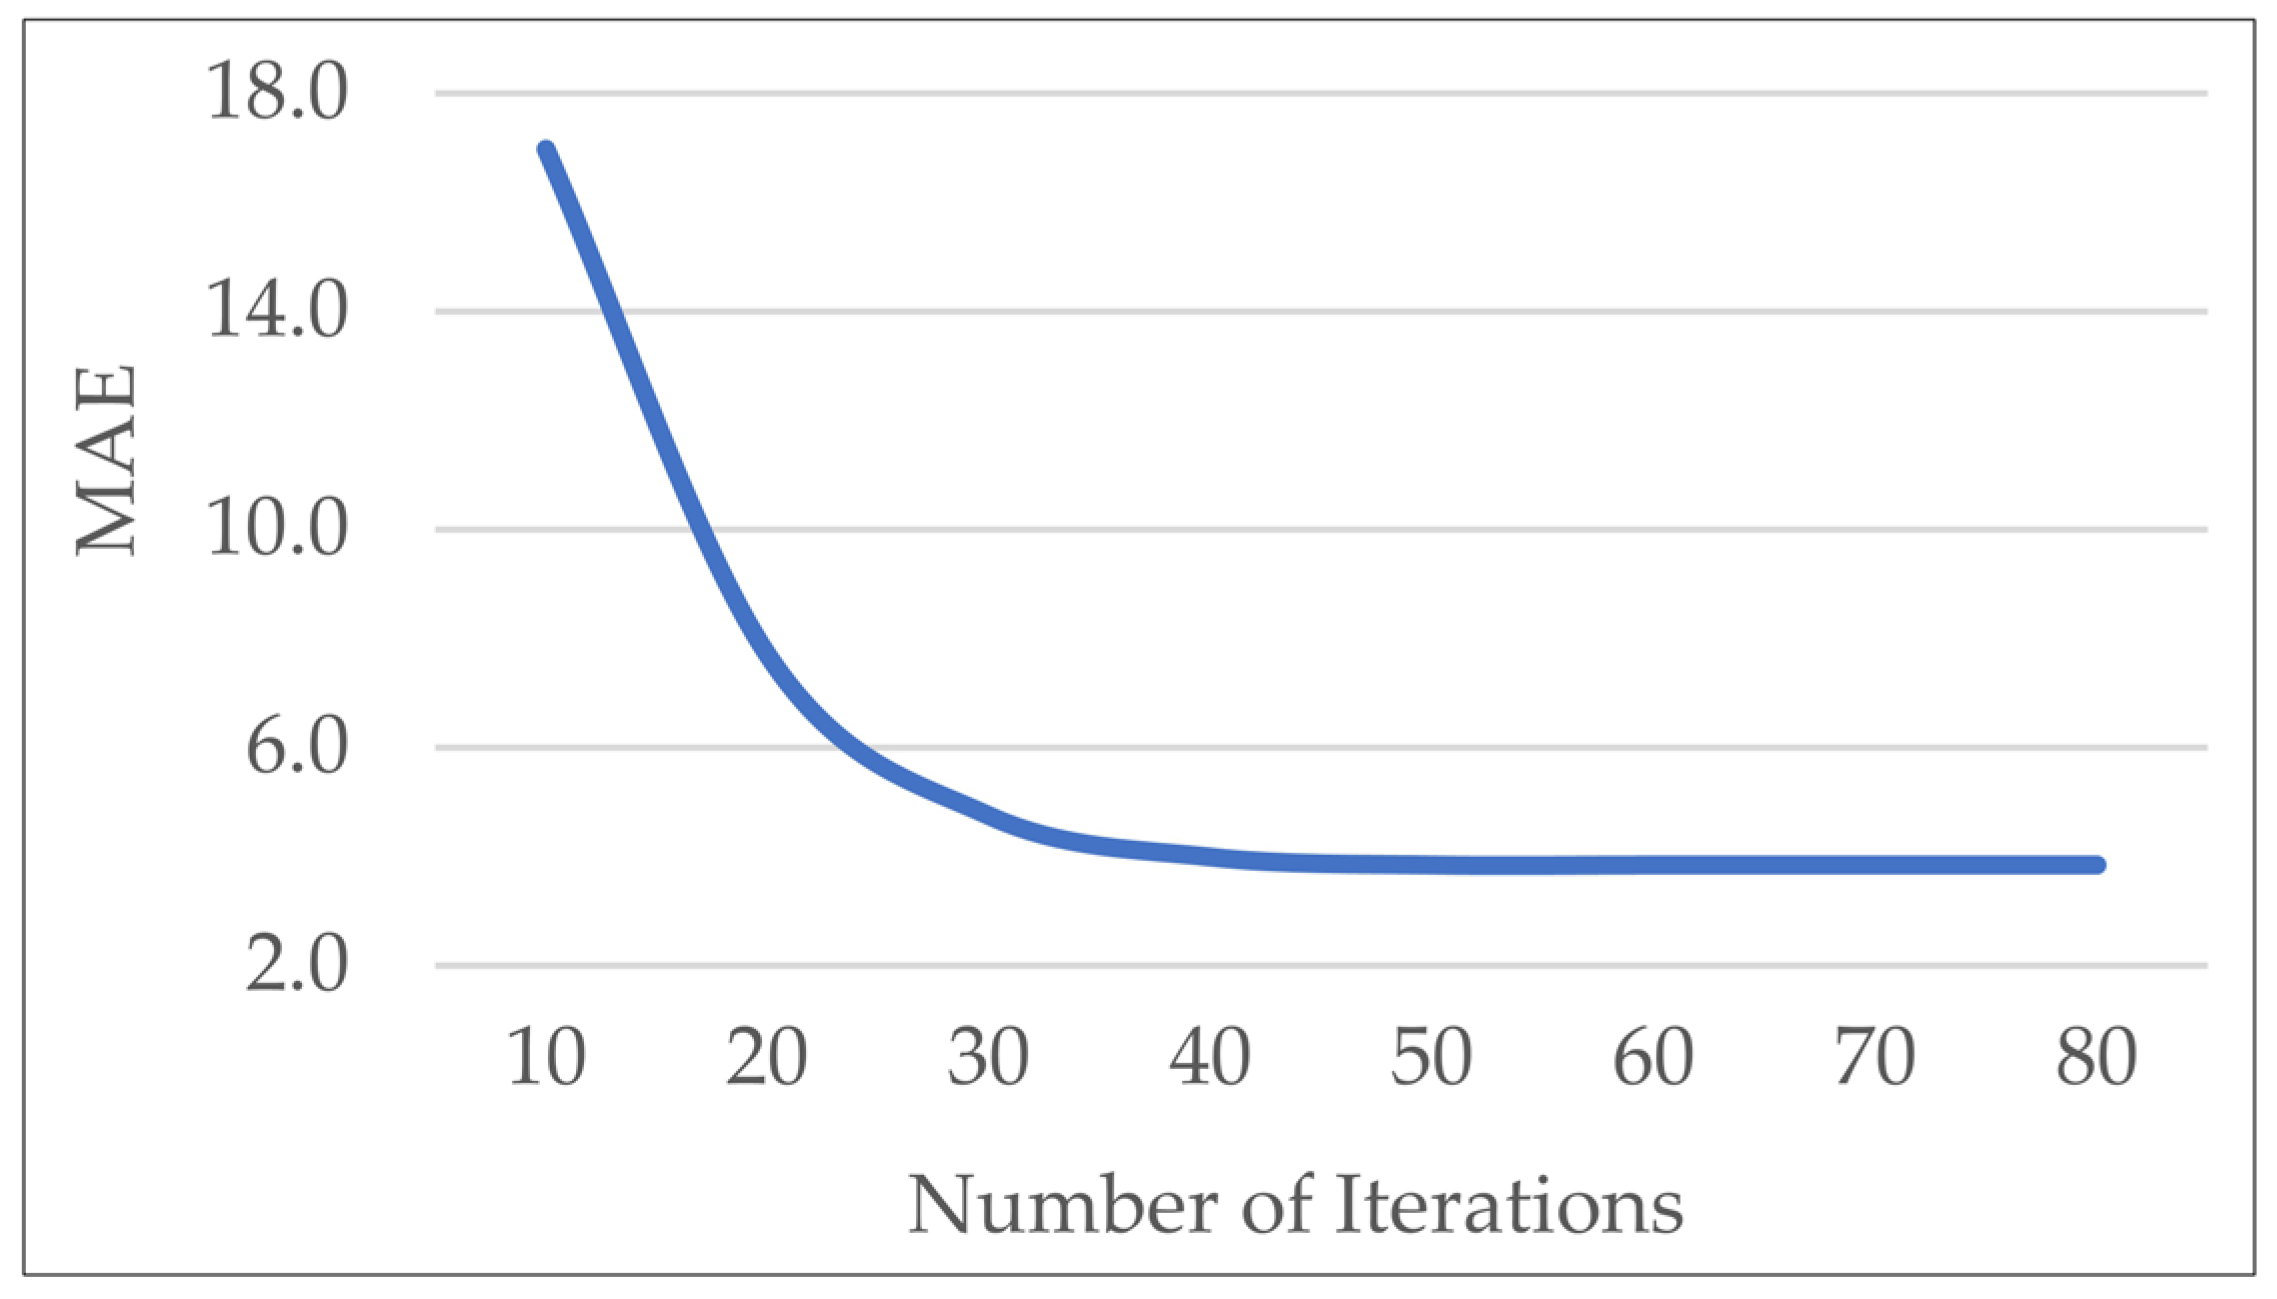
Figure 7 illustrates the convergence behavior of the model against a progressively increasing number of boosting iterations. A sharp reduction in MAE was visible in the initial phases, demonstrating the effectiveness of the additive residual learning mechanism. Upon reaching 50 iterations, the error margin attained its minimum value and stabilized, indicating that the algorithm had already captured the majority of the learnable information contained in the dataset. Therefore, additional iterations did not provide any further predictive gains and only increased computational cost. Based on these findings, the optimal number of iterations was selected as 50.
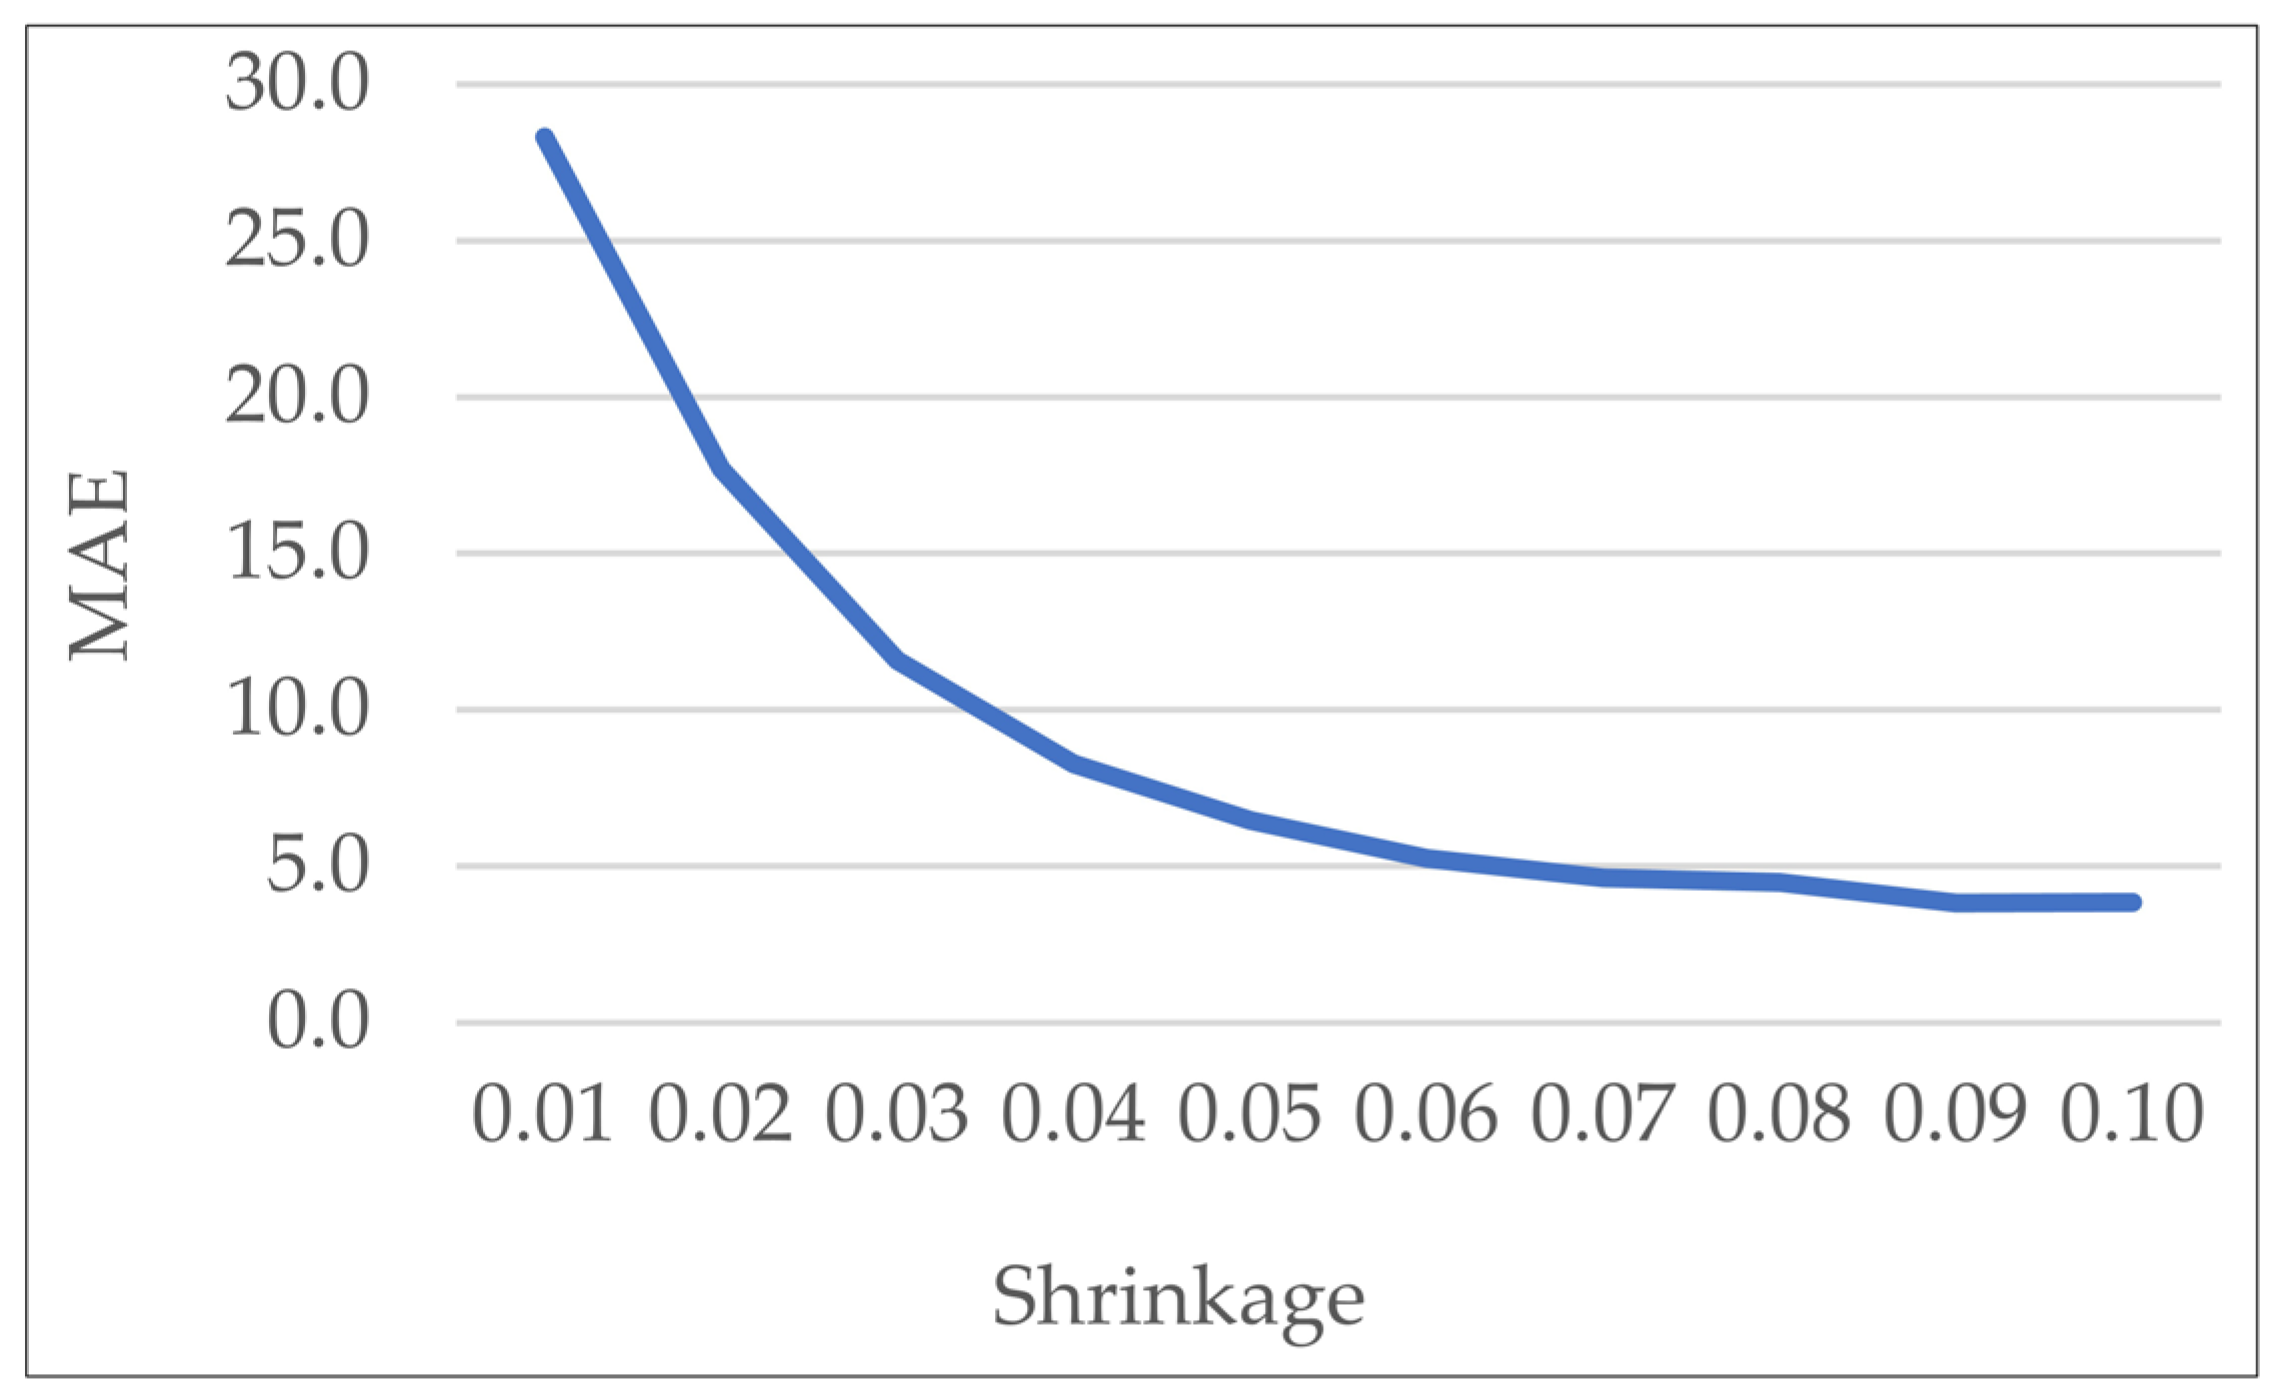
In M5Boost, the shrinkage parameter acts as a regularization component. Smaller shrinkage values lead to slower learning and require more iterations, whereas larger values accelerate the learning process.
Figure 8 presents the relationship between the shrinkage factor and the resulting MAE scores. The empirical curve demonstrated that the error decreased consistently as the shrinkage value increased, indicating the importance of the parameter in controlling the learning dynamics of M5Boost. Furthermore, it could be observed that the MAE stabilized around a shrinkage value of 0.1, indicating that larger values did not significantly alter the final prediction performance. Consequently, a shrinkage value of 0.1 was selected for the proposed M5Boost framework.
Table 9 presents the error values obtained across varying thresholds for the minimum number of instances per leaf node (minNumInstances), ranging from 5 to 45 in increments of 10. This parameter regulates the granularity of the recursive partitioning process; smaller values allow highly intricate tree topologies that risk overfitting, while excessively large values induce underfitting by restricting local linear model fitting. The experimental results demonstrated that the best performance was successfully achieved at a value of 35, suggesting the best balance between model complexity and predictive accuracy. Therefore, this value was selected in the final M5Boost configuration to address the EV driving range prediction problem.
Table 10 shows the prediction performance of M5Boost under alternative train-test partitioning strategies, including 75:25, 80:20, 85:15, and 90:10. As the proportion of training samples increases, the model is able to learn more representative patterns from the data, resulting in improved prediction accuracy. The 90:10 split provided sufficient training samples for effectively learning the underlying nonlinear complex relationships while maintaining an independent test set for reliable performance evaluation. Furthermore, train-test partitions with high training ratios are widely adopted in machine learning applications involving small datasets, as they provide a sufficient number of training samples to effectively learn the volatile patterns while yielding a statistically robust test boundary.
A leave-one-vehicle-out evaluation was also conducted, in which one vehicle was entirely excluded from the training process and used exclusively for testing, representing a substantially more challenging evaluation scenario than the adopted hold-out strategy. The experimental observations showed that prediction performance decreased under this protocol, indicating that vehicle-specific driving behavior, battery characteristics, and operational conditions introduce inter-vehicle variability into the range estimation problem. Nevertheless, since the objective of this study is to construct a generalized prediction model using a fleet of real-world driving records, the adopted hold-out evaluation protocol provides an appropriate and representative experimental setting for the targeted application.
4.8. Tree Structure of the Proposed Machine Learning Model
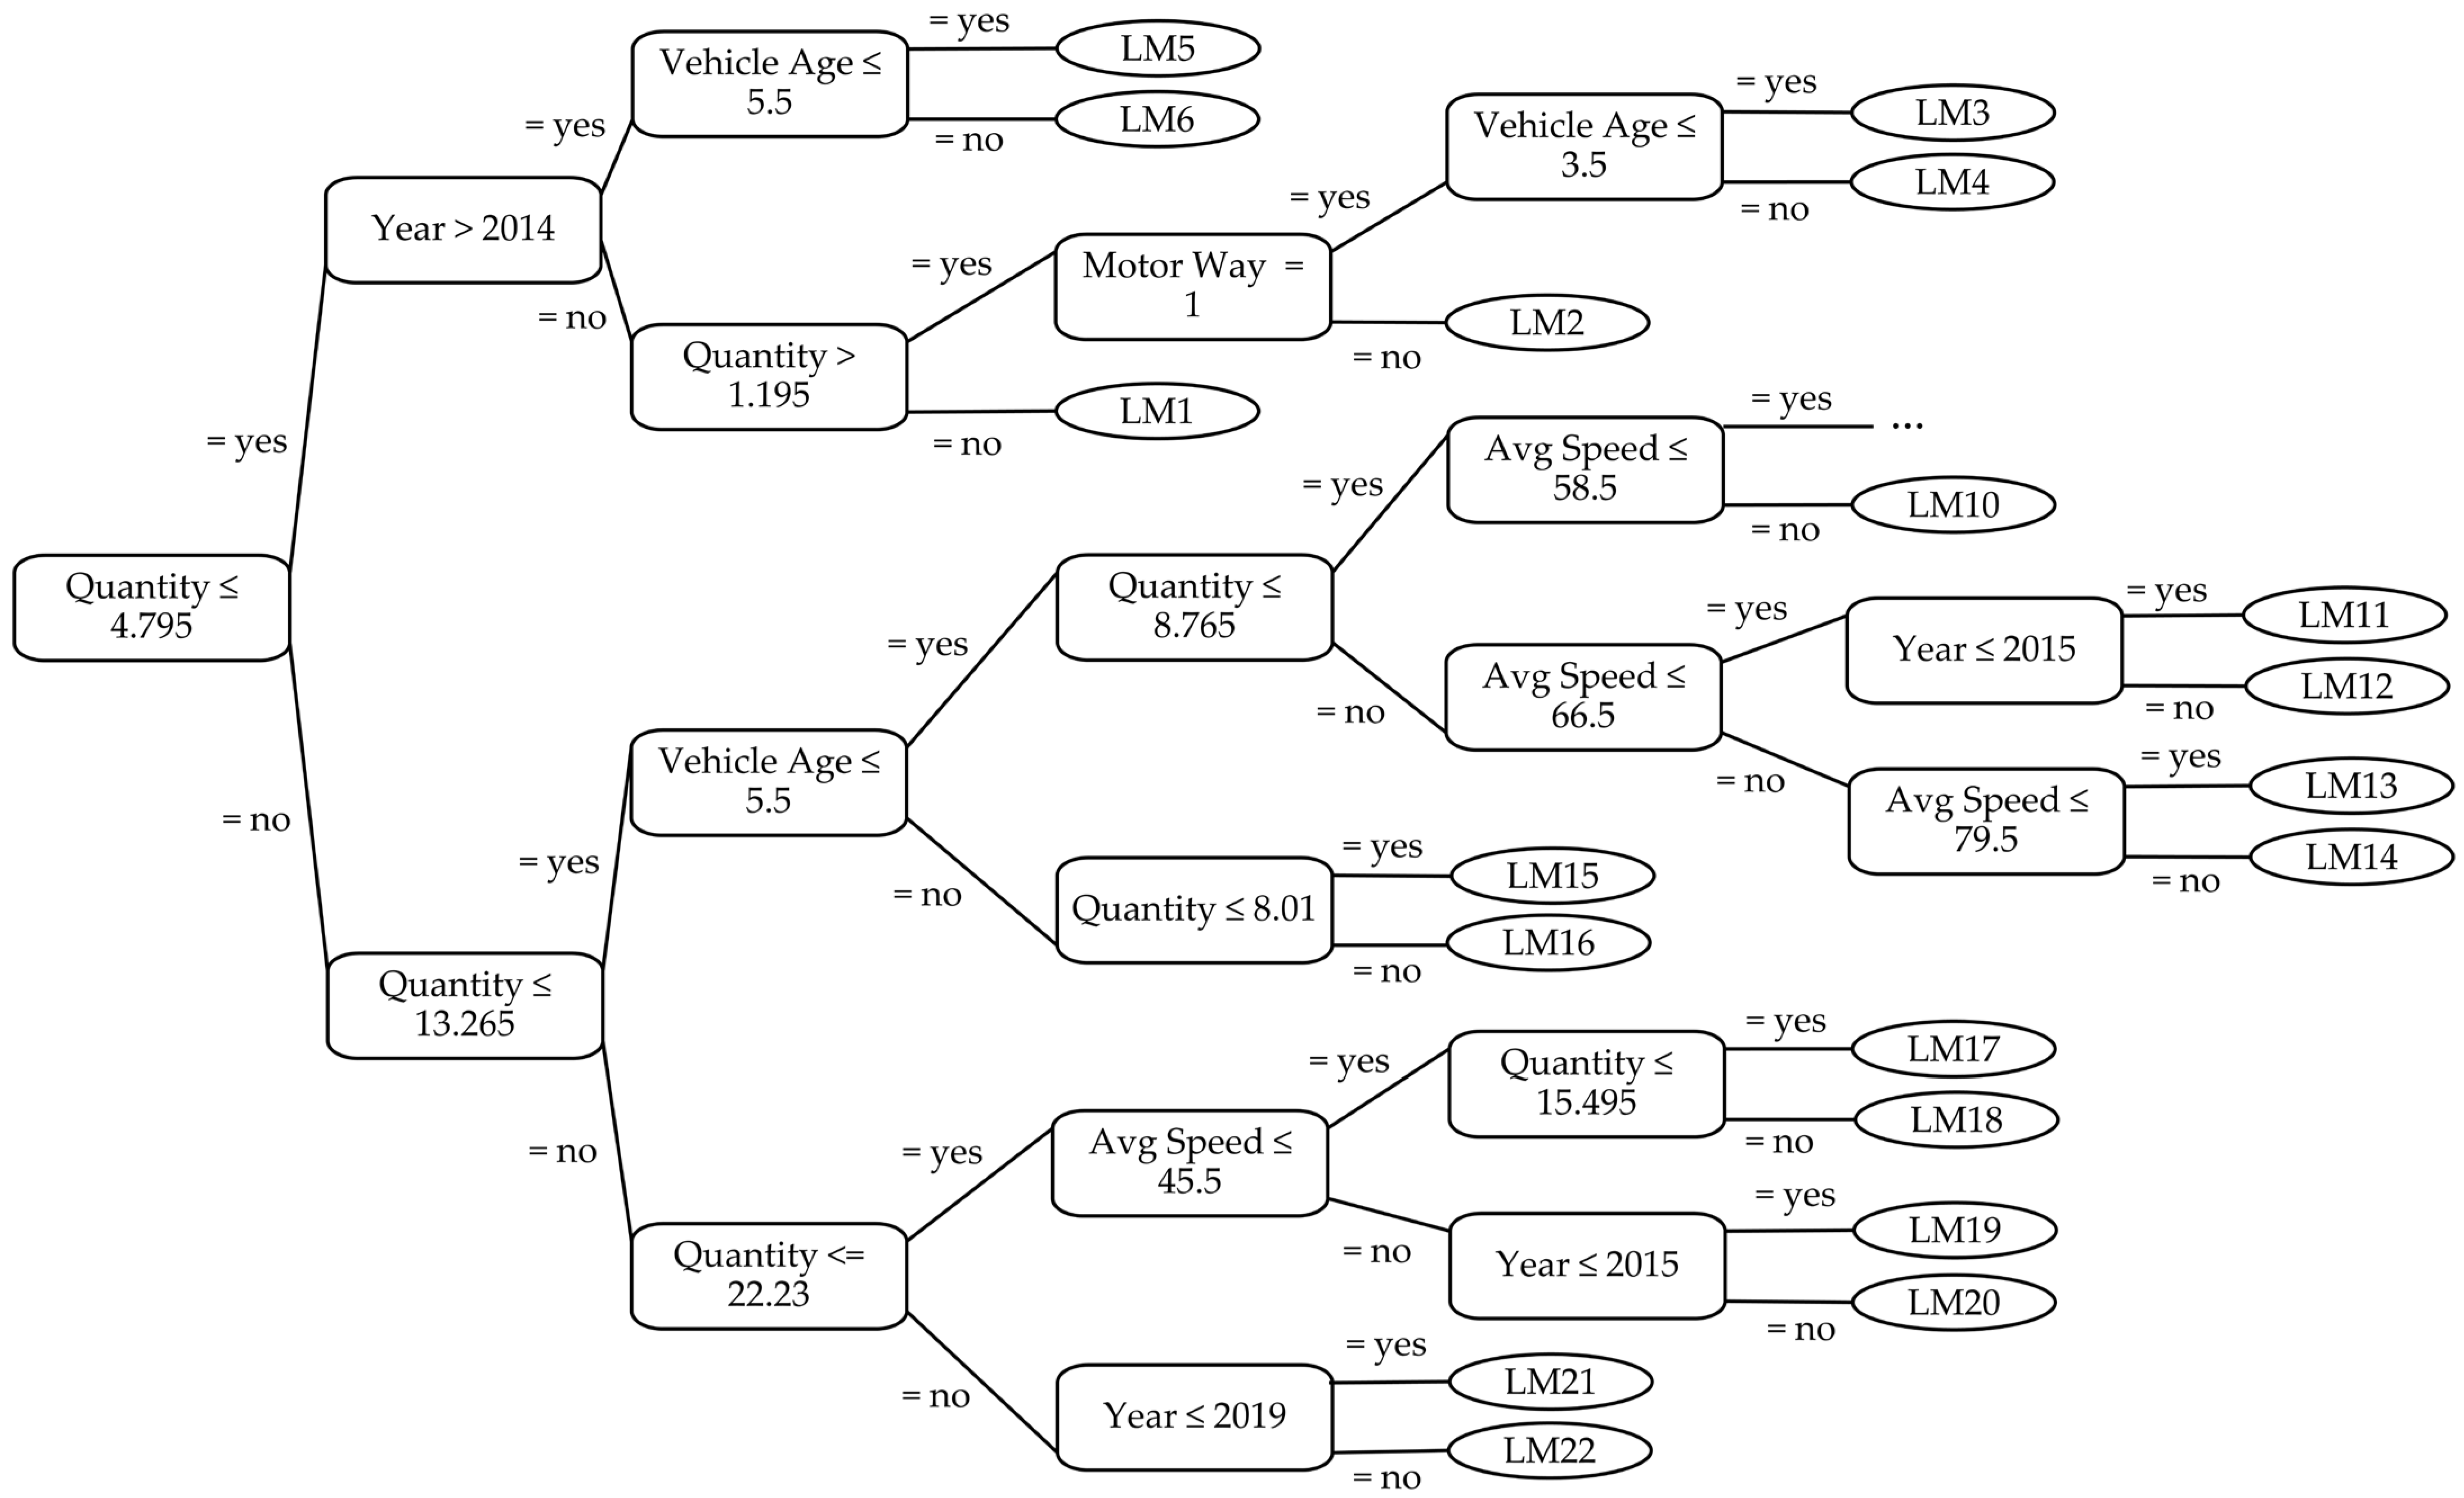
To demonstrate the structural transparency and internal decision logic,
Figure 9 presents a tree topology corresponding to a base learner within the M5Boost model. Through two main components (decision nodes and leaf nodes), the proposed method reveals its routing pathways explicitly. The decision nodes define the structural boundaries by partitioning the feature space according to threshold-based conditions, whereas the leaf nodes contain local regression models used to generate the final prediction values. During prediction, an input instance strictly traverses the tree based on the established split criteria until it reaches a terminal leaf node. The corresponding local regression model is then used to estimate the driving range. For instance, the recursive partitioning begins at the root node, which performs the initial data split based on the condition Quantity ≤ 4.795. If a given driving sample satisfies this condition (=yes), the algorithm routes the instance to the left branch; otherwise, it follows the right branch. Subsequent decision boundaries further partition the feature space using variables such as year, vehicle age, motorway, and average speed. Instead of outputting static constant values, the leaf nodes represent localized, multivariate linear regression models, denoted by LM1, LM2, …, LM22. These localized equations compute precise numerical estimations tailored specifically to the data partition that falls into that particular leaf. For example, the mathematical formulation of the local regression model associated with LM1 is given in Equation (20).
The tree structure significantly contributes to the Explainable Artificial Intelligence (XAI) property of M5Boost, providing operational transparency. Unlike many black-box machine learning approaches, the decision boundaries generated by this approach remain human-readable and can be directly interpreted by users. Drivers can easily audit, trace, and validate how a specific EV driving range estimation is generated. Furthermore, the hierarchical structure of the tree also provides valuable information about feature importance, since features appearing near the root generally have a greater influence on the prediction process than those at deeper levels. According to
Figure 9, the Quantity feature is the most prominent variable because it is selected as the root splitting attribute. This observation is consistent with the Mutual Information analysis presented earlier.
In addition to global feature positioning, the localized regression models at the leaf level also provide deeper insights into feature importance through their mathematical weights. As shown in Equation (19), the largest regression coefficient belongs to the Quantity feature, indicating its dominant contribution to range estimation. These representative examples demonstrate that both the decision boundaries and the leaf-level regression equations remain highly interpretable and transparent compared to traditional black-box boosting methods. By providing insights into the prediction mechanism, the proposed M5Boost approach bridges the gap between high-precision accuracy and human-understandable model interpretability.
5. Comparison with Existing Methods
To objectively evaluate the practical significance of the proposed approach, a comprehensive benchmarking was performed against previously reported methods [
47,
48,
49,
50,
51] on the same dataset [
44].
Table 11 presents a comparative analysis between M5Boost and various state-of-the-art models spanning from conventional regression techniques to sophisticated deep learning frameworks. According to the reported results, the proposed M5Boost framework achieved the most superior result across the evaluation metric, yielding an MAE value of 3.9888. Compared to the most recent study presented in [
47], M5Boost significantly outperformed the ETRARO_DRP model (MAE: 6.6380) and other ensemble variants like LightGBM, CatBoost, and XGBoost. Similarly, it demonstrated superior precision over the results in [
48], reducing the RMSE value from 11.8738 to 8.0282. M5Boost also surpassed deep learning-based approaches such as DNN [
47] reported in previous studies. In comparison with the deep learning-focused study [
50], which produced a MAE of 5.1150 with Deep MLP, M5Boost provided a further error reduction (MAE: 3.9888). These findings demonstrated that the integration of the iterative error-correction mechanism of additive regression with M5 model trees enabled the proposed framework to provide more accurate and stable EV range estimation performance than existing state-of-the-art approaches. The superior performance of M5Boost can be attributed to its capability to iteratively reduce residual estimation errors while simultaneously modeling region-specific regression behaviors through the tree structure.
To provide a broader evaluation perspective, M5Boost was compared with a model-based approach reported in the literature [
51]. The model-based baseline yielded an MAE of 8.9137 and an RMSE of 14.4949, whereas M5Boost significantly reduced these errors to 3.9888 and 8.0282, respectively. Furthermore, comparisons with recent hybrid approaches [
49] showed that M5Boost consistently achieved lower prediction errors. Although hybrid methods combine multiple paradigms, they often suffer from severe drawbacks in terms of model complexity, higher computational requirements, and reduced explainability, which limit their deployment in real-world vehicle electronic control units. In contrast, M5Boost offers a favorable balance between predictive performance, efficiency, and interpretability through its model-tree-based structure, making it highly suitable for practical EV range estimation applications.
6. Conclusions and Future Work
This study presents a machine learning approach, M5Boost, aimed at improving the accuracy of EV range estimation. Accurate prediction of EV driving range is essential for reducing uncertainty during driving and enabling more efficient trip planning, charging schedules, and battery utilization. However, EV range prediction remains a highly challenging problem due to the complex and nonlinear interactions among environmental conditions, driving behaviors, traffic situations, battery characteristics, and vehicle operational parameters. Current studies still suffer from issues related to limited interpretability, dependence on simulation-based scenarios, high computational complexity, and insufficient robustness under diverse real-world driving conditions.
M5Boost establishes multiple model trees with additive regression as a boosting strategy in order to iteratively reduce residual estimation errors while constructing localized regression structures. In addition, specialized tree pruning and smoothing operations were incorporated into the learning process to improve robustness and generalization capability. Unlike conventional boosting mechanisms that rely on constant-valued terminal nodes, the proposed framework utilizes multivariate linear regression models at its leaf nodes. This synergistic design improves robustness and mathematical interpretability.
To validate the efficacy of M5Boost, a benchmark dataset was systematically extended with newly collected real-world driving records for battery-related use cases, resulting in a comprehensive dataset spanning more than 11 years of EV operational data. Extensive experimental studies were conducted using eleven prominent ML methods, including KNN, KStar, LWL, LR, ANN, SVM, RF, ElasticNet, LightGBM, XGBoost, and CatBoost. Experimental results demonstrated that M5Boost achieved the best overall predictive performance among all evaluated algorithms. Statistical tests additionally confirmed that the observed performance improvements were statistically significant. Moreover, comparative analyses with previously published state-of-the-art studies conducted on the same dataset showed that M5Boost significantly outperformed existing approaches across both MAE and RMSE metrics. All these empirical results confirm that M5Boost effectively captures the highly nonlinear and complex dynamics of the EV range estimation problem without compromising computational efficiency. Therefore, the proposed approach has a strong potential for practical intelligent transportation and EV energy management systems operating under diverse environmental and driving conditions.
The generalizability of data-driven estimation models across diverse electric vehicle brands, models, and powertrain configurations represents a critical operational consideration. In this study, the empirical evaluation was conducted utilizing real-world driving data collected from Volkswagen e-Golf vehicles. Although the reported performance values are directly associated with this vehicle family, M5Boost is designed as a generic machine learning framework rather than a vehicle-dependent model. The input features, such as speed, vehicle age, ambient temperature, tire type, driving style, and road environment characteristics, represent common factors that influence the driving range of other battery electric vehicles as well. Consequently, the structural logic of the M5Boost approach is inherently brand-agnostic. Since it is fundamentally rooted in universal vehicle physics and principles, the framework can be systematically retrained and adapted to different EV models without requiring structural modifications, when representative training data are available.
As future work, a user-friendly graphical interface is planned to be developed in order to improve the accessibility and usability of the proposed M5Boost framework for real-world EV users and intelligent transportation web/mobile applications. This digital tool will aim to visualize dynamic range predictions under varying driving profiles, allowing users to interactively assess information and seamlessly manage their charging schedules during active trip planning.