1. Introduction
Lithium-Ion Batteries (LIBs) have become the dominant electrochemical energy-storage technology for electric mobility and other high-demand applications due to their high specific energy, high power density, long cycle life, and versatile packaging options [
1]. In Electric Vehicles (EVs), the trend toward larger battery packs with increased stored energy, as well as greater structural integration within the vehicle chassis [
2], has intensified concerns about the consequences of crash-induced mechanical abuse [
3]. Such incidents can directly compromise the structural integrity of individual cells and the overall battery pack assembly. Severe mechanical deformation can result in the fracture of internal components, collapse or rupture of the separator, and unintended contact between electrodes, each of which can initiate internal short circuits and rapid, localized heat generation [
4]. If the generated heat exceeds the cell’s thermal dissipation capacity, these failure mechanisms can escalate into Thermal Runaway (TR), potentially leading to a fire or explosion [
5].
Published studies in the literature have characterized the mechanical response of fresh LIB cells under quasi-static conditions [
6,
7,
8,
9] and dynamic loading regimes [
10,
11,
12,
13], with additional attention to the effects of the loading configuration, State-of-Charge (SoC) [
14,
15,
16], temperature [
17,
18], and cell chemistry [
19]. In real-world battery packs, however, cells experience service-dependent degradation due to diverse thermal and electrical operating conditions [
20]. Electrochemical aging is typically characterized by a Loss of Lithium Inventory (LLI) and a Loss of Active Material (LAM), and an increase in internal resistance (IR) due to interfacial degradation and transport limitations [
21,
22,
23]. Additional irreversible changes, including Solid Electrolyte Interface (SEI) thickening, active-material cracking, and binder degradation, can further alter the stiffness, cohesion, and fracture susceptibility of cell constituents by progressively compromising interfacial integrity and load-transfer pathways within the electrode assembly [
21,
24,
25,
26].
Electrochemical aging, particularly under accelerated protocols involving high C-rates and low ambient temperatures, leads to significant morphological and compositional changes affecting electrodes, separators, current collectors, and their interfacial layers [
27]. Among the degradation mechanisms observed in aged cells, lithium plating is particularly critical, as it simultaneously accelerates irreversible capacity loss and increases safety risks [
28]. Lithium plating predominantly occurs under high-current, low-temperature conditions, resulting in High Surface Area Lithium (HSAL) deposits with low reversibility and limited thermal stability [
29]. These deposits further increase internal resistance and exacerbate current heterogeneity within the cell, thereby elevating the risk of localized heating and internal short circuits during mechanical loading [
30].
Despite growing recognition of these phenomena, the safety implications of aging-induced degradation remain incompletely resolved and sometimes contradictory (
Table 1). A key reason is that aging effects under mechanical abuse are not universal, but depend on the cell format, internal architecture, SoC, aging pathway, casing constraint, and test boundary conditions. Consequently, trends observed in one cell format or test configuration cannot be assumed to apply directly to another.
Large-format, tabless cylindrical 4695 cells are increasingly adopted in EV packs [
43]. However, their mechanical abuse response cannot be inferred directly from the existing evidence base on pouch cells, legacy 18650 formats, or tabbed cylindrical designs. In tabbed cells, regions near the tabs are prone to locally elevated current density and have been associated with lithium plating, local overheating, and separator pore closure under demanding cycling conditions [
44]. In contrast, tabless cells distribute current around the electrode circumference and thereby modify the spatial pattern of electrochemical inhomogeneity. At the same time, the rigid steel housing of large cylindrical cells constrains radial expansion and interacts with dedicated gas-release features that influence venting and thermal propagation [
45]. These format-specific characteristics suggest that electrochemical aging may couple differently to mechanical, electrical, and thermal failure than in previously studied cell types.
Despite the growing relevance of this format, published evidence on the mechanical abuse of aged large-format tabless cylindrical cells remains very limited. The study by Spettmann et al. [
40] provides an important example of format-dependent aging effects under mechanical intrusion. They reported that low-temperature-aged 18650 cylindrical cells exhibited a left-shifted force–displacement response, increased apparent stiffness, and earlier internal fracture, whereas pouch cells investigated under related aging conditions showed substantially different trends. This comparison indicates that aging does not produce a universal mechanical signature across cell formats. Instead, similar broad degradation conditions may be associated with delayed failure in pouch cells, but earlier failure in casing-constrained cylindrical cells.
The present work builds directly on this evidence but differs from Spettmann et al. [
40] in several safety-relevant aspects. First, it investigates large-format tabless 4695 cylindrical cells rather than 18650 cells. Second, the indentation tests are performed at 100% SoC, whereas all tests in Spettmann et al. were conducted at 0% SoC. Third, the present study compares two distinct aging routes at the same end-of-life criterion of 80% SoH, thereby separating pathway-dependent effects from the residual-capacity level. Fourth, the analysis is not limited to force–displacement behavior, but combines mechanical margins to an internal short circuit (ISC), voltage-collapse behavior, post-ISC surface-temperature exposure, and venting direction. Thus, no directly comparable published study has, to the best of our knowledge, examined electrochemically aged tabless 4695 cells under quasi-static indentation at 100% SoC with combined mechanical, electrical, thermal, and venting diagnostics.
The present study addresses this gap by investigating the quasi-static indentation response of tabless 4695 cells after two practically relevant and deliberately different aging routes, both brought to the same end-of-life criterion of 80% SoH and tested at 100% SoC. Cycling at 20 °C and 20 A serves as a moderate reference condition, under which aging is expected to be governed primarily by interfacial growth, SEI thickening, electrolyte consumption, and a comparatively gradual increase in IR [
46]. In contrast, cycling at −10 °C and 45 A probes a low-temperature/high-current regime in which transport limitations and elevated overpotentials increase the likelihood of lithium plating, pore closure near the anode–separator interface, and spatially heterogeneous resistance growth [
47]. Similar boundary conditions have previously been linked to safety-relevant degradation in pouch cells and older cylindrical formats [
38,
40], but corresponding evidence for large tabless 4695 cylindrical cells remains scarce.
The primary contribution of this work lies in extending the existing evidence from aged pouch and 18650 cells to large-format tabless 4695 cells by experimentally comparing how two degradation histories affect the coupled mechanical, electrical, thermal, and venting response under identical 100% SoC indentation conditions.
The remainder of this paper is organized as follows.
Section 2 describes the experimental methodology, including the selection of commercial tabless 4695 cylindrical cells, the two electrochemical aging protocols, CT-based structural inspection, dimensional measurements, quasi-static hemispherical indentation testing, and the post-processing procedures used to extract mechanical, electrical, and thermal safety metrics.
Section 3 presents the experimental results, beginning with the electrochemical aging behavior and aging-induced structural and geometrical changes, followed by the mechanical force–displacement response, voltage-collapse behavior, post-ISC thermal exposure, and observed venting pathways.
Section 4 discusses these findings in relation to aging pathways, cell format, casing constraints, ISC development, thermal severity, venting directions, and implications for the safety assessment and modeling of large-format cylindrical cells. Finally,
Section 5 summarizes the main conclusions and outlines the relevance of aging history as a governing variable in the mechanical–electrical–thermal safety response of tabless 4695 cells.
2. Methods
2.1. Cell Selection
This study aims to examine the quasi-static indentation response of large-format commercial lithium-ion cells under abuse conditions, with a focus on understanding specific design features that influence vent path directionality and structural integrity. The EVE Energy 4695E cylindrical cell (NMC811, outer diameter 46 , length 95 ) was selected as a representative recent development in high-energy density, large-format cells.
The housing is a
steel case. Both terminals (positive and negative) are located on the top endcap. The electrode stack features a tabless collector concept: continuous foil overhangs connect via collector plates to the endcaps, yielding axial current collection across the jellyroll [
48,
49,
50]. A central hollow core with a diameter of
is present along the axis of the wound stack.
Figure 1 shows a longitudinal CT cross-section of the EVE Energy 4695E cell, highlighting the key geometric and safety-relevant features, including the outer diameter, notched region, central hollow core, top opening, axial length, and steel shell thickness. The bottom endcap incorporates circumferential notches and a rupture disk designed as predefined rupture locations. Together with the axial hollow core, these provide a directed vent path to the bottom. A similar downward-venting concept has been described for other large cylindrical formats [
51].
The cells used in this study were manufactured by EVE Energy, model 4695E. The manufacturer specifications were taken from the technical datasheet: a nominal capacity of 30
, a nominal voltage of
, and a standard charge/discharge rate of 0.33 C. The upper and lower cutoff voltages are set at
and
, respectively, as specified in [
52].
A total of nine cells were assigned to three experimental groups, with three cells per group. Three cells were kept uncycled and served as the fresh reference group. The remaining six cells were electrochemically aged under two distinct cycling protocols, resulting in the aged groups A20,20 and A−10,45. All nine cells were subsequently tested under identical quasi-static hemispherical indentation conditions.
2.2. Aging Protocol
Six cells were assigned to two protocols to induce degradation under defined thermal and electrical conditions. The protocol at 20 °C and 20 was selected as a moderate reference condition within the typical operating window of LIBs, where aging is expected to be dominated primarily by interfacial growth, SEI thickening, and a comparatively uniform increase in IR. The protocol at −10 °C and 45 was chosen as a low-temperature/high-current boundary condition, for which transport limitations and charge-transfer overpotentials are expected to increase the likelihood of lithium plating and spatially heterogeneous degradation. Together, both protocols bracket two practically relevant but mechanistically distinct aging pathways within the same 4695 format. Both aging protocols were terminated at the same end-of-life capacity criterion of 80% SoH to enable a matched-capacity comparison between aging pathways. The protocol was therefore not intended to resolve the evolution of abuse response over multiple SoH levels, but to isolate whether different degradation histories can lead to different mechanical–electrical–thermal responses once the same remaining-capacity threshold has been reached.
Protocol (i) applied full-depth cycling (Depth of Discharge (DoD) 100%) at 20 °C with CCCV charging and CC discharging at 0.67 C with a 0.10 C cutoff on a NEWARE CT-4008-5V20A-A inside an ACS DY200 climate chamber. Protocol (ii) applied DoD 100% at
°C with CCCV charging and CC discharging at 1.50 C with a 0.10 C cutoff on a Bitrode MCV-100-5 inside a Vötsch VT 4021 chamber. Capacity reference tests were performed at 20 °C at 0.33 C with a 0.10 C cutoff to track capacity fading. Cycling continued until SoH reached 80%. The resulting groups are denoted as
fresh (uncycled),
A20,20 (20 °C, 20
), and
A−10,45 (
°C, 45
). During electrochemical aging, the cells were cycled in a free-standing condition inside the climate chambers, i.e., no additional external radial confinement or axial preload was applied. Unlike pouch or prismatic cells, which often require artificial external preload, for example, by flat platens, to simulate module compression, the present 4695 format utilizes its
steel can to provide an intrinsic, highly rigid radial constraint to the wound electrode assembly. Furthermore, in state-of-the-art cell-to-pack vehicle architectures, such cylindrical cells are typically embedded in compliant structural foams or adhesives rather than rigid mechanical clamps [
53]. The free-standing aging condition thus preserves the natural, casing-dominated confinement history that is characteristic of this format in modern pack integrations.
Prior to indentation, cells were brought to 20 °C, charged to 100% SoC using CCCV at 0.33 C to with a 0.10 C cutoff, rested for 4 h at an open circuit, and SoC was verified by an Open Circuit Voltage (OCV) check.
To probe low-temperature kinetics and qualitative indicators of lithium plating in A
−10,45, we adopted the post-charge relaxation approach of Lüders et al. [
54]. Cells were charged to
SoC at
°C with 0.10 C as the reference and the actual 1.50 C used in A
−10,45, followed by a 4 h rest. The Open Circuit Voltage
and its time derivative
were recorded. According to the mechanism described by Lüders et al., plated lithium chemically intercalates during rest at an approximately constant rate, and the amount of plated lithium is qualitatively reflected by the duration of the near-constant-voltage regime, operationally captured here by the time to the local minimum of
after the early transient.
IR was measured with a HIOKI 3554 Battery HiTester (AC four-terminal, 1 ) at 20 °C and SoC after a 4 h rest. For each protocol, three cells were measured before and after aging.
2.3. CT Scanning
To visualize morphological changes caused by electrochemical aging, CT scans were acquired on a Phoenix V|tome|x S system. Scans were performed at a nominal isotropic voxel size of 27 ; the X-ray tube power was held at approximately 22 . Mid-plane slices were analyzed for concentricity, local buckling, delamination, and voiding, and used as qualitative context for the indentation response.
2.4. Thickness Measurement of Cells
Cell thickness was determined before and after electrochemical cycling using an ORION electronic micrometer (radial; resolution 1 ) and an ORION digital dial gauge (axial; resolution 1 ). Instruments were zeroed before each session and verified against a length reference. Measurements were performed at 20 °C To standardize the electrochemical state, all cells were charged to 8 followed by a 1 h rest at open circuit conditions immediately prior to measurement.
Axial length: The overall axial length was measured along the cell’s central axis (
) between the bottom seating plane and the top endcap reference plane (between the upper and lower terminal (
Figure 2a). Three repeated measurements were taken per position.
Radial thickness: Thickness was recorded at three axial heights referenced to the endcaps: (i) 5
from the top edge, (ii) mid-height at
, and (iii) 7
from the bottom edge (
Figure 2b). At each height, three repeated measurements were taken per position.
2.5. Mechanical Testing of Full Cell
Quasi-static hemispherical indentation was conducted on nine cells in total: three fresh cells and three aged cells per aging protocol. Tests were executed on a hydraulic press using a 50
diameter steel impactor and a high-precision load cell (GTM K 150
, accuracy class ± 0.02%). The bench and data acquisition chain followed [
55]: force was recorded with a National Instruments bridge module (NI-9237, 50
, 24 bit), cell voltage with an NI-9229 (0–60
, 24 bit) and indentation depth by a linear glass scale (resolution 1
, accuracy ±
−1). Tests were performed at 1
−1 up to 28
indentation. Three Type K thermocouples were fixed with Kapton tape to the surface of the cells, positioned at the top, middle and bottom positions.
All tests were carried out at 100% SoC (upper voltage limit ) and 24 °C laboratory ambient. Cells were tested lying horizontally. A massive steel backing ensured reproducible sphere-on-cylinder contact conditions. The backing was a half-rounded steel plate with an inner diameter of . It supported the cell over a length of , corresponding to a wrap angle of approximately . This geometry stabilizes the point contact without clamping the cell.
A schematic and a photograph of the setup are provided in
Figure 3.
2.6. Signal Post-Processing and Metrics
Post-processing was performed in Python. The force signal was filtered with a zero-phase low-pass filter corresponding to CFC180. The voltage signal was filtered with a zero-phase second-order low-pass filter with a cutoff frequency of 10 .
2.6.1. Contact Alignment and Force Bias Correction
The contact index was defined as the first sample at which the filtered force exceeded 1000 . To correct for small force offsets, a baseline force was estimated from samples acquired at least before the detected contact time and subtracted from the full force history. Displacement was then referenced to the corrected contact point such that at contact, where denotes indentation displacement. All reported force–displacement curves and derived mechanical metrics are based on these corrected signals.
2.6.2. ISC Detection
The onset of a major ISC was detected from the high-frequency voltage trace as the first sustained drop of at least
(
) relative to the initial baseline. This threshold was guided by Liu et al. [
1], who classify short-circuit signatures with an initial voltage-drop magnitude above approximately
as major ISC events. At the same time, defining an ISC only by a voltage drop to zero would be too restrictive, because a mechanically induced ISC can produce different voltage-decay patterns depending on the short-circuit mode and its subsequent evolution [
1]. The additional persistence criterion of
was introduced to suppress high-frequency electrical noise and isolated voltage spikes. In the present tests, the subsequent voltage drops were substantially larger than
. Thus the threshold provided a reproducible onset criterion.
2.6.3. Force/Displacement and Energy
To characterize the mechanical response at the onset of an ISC, two primary metrics were extracted from the measured force–displacement curve. First, the ISC force
was defined as the indentation force measured at the displacement where the ISC begins. It was calculated using Equation (
1):
where
represents the force at the onset of an ISC, and
is the corresponding indentation displacement.
Second, the absorbed mechanical energy up to ISC initiation (
) was obtained by integrating the force–displacement curve from the beginning of indentation to the ISC displacement, as defined in Equation (
2):
where
denotes the mechanical energy absorbed before ISC initiation, and
is the force measured as a function of displacement. The absorbed energy was obtained by numerical integration of the experimental force–displacement curve up to
.
In addition to the ISC-related metrics, the peak mechanical response was characterized by the maximum indentation force and by the displacement at which this maximum force occurred. The peak force (
) was defined as the maximum value of the measured force–displacement curve over the investigated displacement range, as given by Equation (
3):
where
denotes the measured indentation force as a function of the displacement
, and
represents the displacement range considered in the test.
The displacement corresponding to the peak force (
) was then determined as the displacement at which
reaches its maximum value, as defined in Equation (
4):
where
denotes the displacement associated with the maximum measured force, such that
. For discretely sampled experimental data,
corresponds to the measured displacement sample associated with the maximum force value.
2.6.4. Detection of the First Characteristic Force–Displacement Kink and Effective Stiffness
The first characteristic kink in the force–displacement response was identified from the force signal . This kink was used as a descriptive mechanical marker of the transition in the indentation response and was not interpreted as a separate failure criterion. To avoid identifying minor fluctuations near initial contact, the search was restricted to the displacement interval between the first substantial force build-up and the global force maximum.
The curvature of the force–displacement curve was evaluated using the second derivative
where
denotes the local curvature of the force–displacement curve. Within the predefined search interval, the point of maximum negative curvature was first identified. The displacement of the first characteristic kink,
, was then defined as the first zero crossing of
following this curvature minimum. If the zero crossing occurred between two sampled displacement points,
was obtained by linear interpolation according to
with
and
.
To quantify the change in stiffness before and after the detected kink, two fit-based stiffness metrics were determined from the force–displacement curve. Let
denote the displacement corresponding to the global force maximum. The pre-kink and post-kink fitting intervals were defined as
The pre-kink stiffness
was obtained from a linear least-squares fit over
, constrained to pass through the origin after contact zeroing:
The post-kink stiffness
was obtained from an unconstrained affine linear least-squares fit over
:
where
and
denote the slopes of the respective linear least-squares fits. The origin constraint for
reflects the contact-zeroed boundary condition
, whereas the post-kink interval was fitted with a free intercept because it occurs after finite deformation has already accumulated. Thus,
and
represent finite-window effective stiffness values obtained from linear fits rather than local tangent stiffness values. An illustrative example of the procedure is provided in
Appendix A. The automated procedure returned a valid
for all nine tests without manual override.
2.6.5. Temperature Metrics
Three K-type thermocouples were attached to the top, middle, and bottom regions of the cell surface using Kapton tape. For each test, a pointwise temperature envelope was constructed to represent the highest surface temperature measured at any instrumented location, as described in Equation (
11). This definition was used to capture the hottest externally measured point on the cell surface, independently of the local direction of heat release during an ISC.
where
is the surface-temperature envelope, and
,
, and
are the temperatures measured by the thermocouples located at the top, middle, and bottom regions of the cell, respectively.
The ambient reference temperature (
) was defined as the mean value of the temperature during a stable baseline period before ISC onset. In the main analysis, the integrated thermal exposure was then quantified over the longest common post-ISC interval that was fully available across all quasi-static tests, as described in Equation (
12).
where
denotes the time integral of the surface-temperature envelope above the pre-ISC ambient baseline during the first 30 s after an ISC. The variable
t denotes the elapsed time after an ISC,
is the maximum measured surface temperature among the three thermocouple locations, and
is the pre-ISC baseline temperature.
This metric combines both the magnitude and the duration of the externally measured post-ISC temperature rise into a single scalar descriptor. Therefore, it captures prolonged external heating that is not represented by the peak surface temperature alone. Under identical instrumentation and boundary conditions, enables a relative comparison of the externally measured thermal exposure relevant to nearby pack-level components, including adjacent cells, busbars, foams, adhesives, and structural elements.
Because
is derived from surface thermocouple measurements, it should not be interpreted as a calorimetric heat-release metric and does not quantify the total internal heat generation of the cell. Instead, it is conceptually related to thermal-exposure or thermal-dose descriptors because it integrates the temperature elevation over time, while remaining distinct from heat-flux-based thermal-dose concepts used in other fields [
56].
To assess the robustness of the conclusions with respect to the selected observation window, the same integrated-exposure metric was additionally evaluated over 20 s and 25 s post-ISC windows, denoted as
and
, respectively. These metrics follow the same definition as
, with the upper integration limit in Equation (
12) replaced by 20 s and 25 s.
In one fresh-cell test, two thermocouple channels failed. Therefore, the temperature envelope for that specific test was constructed from the single remaining valid channel. This may underestimate the true spatial maximum surface temperature if the hottest external location was not captured by the remaining thermocouple. Nevertheless, the group-wise ranking of the integrated thermal exposure remained unchanged across the evaluated post-ISC time windows, supporting the robustness of the comparative trend.
2.6.6. Venting Classification
Venting was labeled manually from video and post-test inspection as bottom-vent (predefined rupture points opened), top-terminal rupture, or sidewall breach.
3. Results
3.1. Electrochemical Aging Behavior
To evaluate the impact of the two aging protocols on electrochemical performance,
Figure 4 shows charge and discharge voltage profiles during cycling. The strong differences between the profiles primarily reflected the distinct test conditions applied.
Reference measurements were performed to identify the point of 20% capacity fade, which is indicated in
Table 2 along with the general aging parameters of both groups.
In the A
20,20 group, both charge and discharge curves exhibit a gradual shift over 1000 cycles,
Figure 4a. The discharge plateau progressively lowers, and the charge profile slightly flattens, reflecting capacity fade and increasing cell impedance. The overall curve morphology remained comparatively stable, which is consistent with gradual aging processes, such as impedance growth and SEI-related loss mechanisms.
In contrast, the A
−10,45 condition resulted in rapid and irregular curve evolution, with 20% capacity fade occurring within the first 50 cycles,
Figure 4b. Charge curves showed premature voltage cutoffs and reduced capacity, while discharge curves exhibited early voltage drops and distorted profiles.
Post-charge relaxation for A
−10,45 (
Figure 4c,d) shows the expected current dependence at low-temperature cycling: after 1.50 C, the near-constant-voltage regime persists markedly longer than after 0.10 C, qualitatively consistent with stronger lithium-plating-related relaxation behavior.
At 20 °C and 100% SoC after a 4 OCV rest, internal resistance ranged 1.30–1.40 in the fresh cells before cyclic aging. After aging it ranged 1.40–1.60 for A20,20 and 2.20–2.50 for A−10,45.
3.2. Internal Structural Changes from CT Imaging
Figure 5 contrasts CT slices of a fresh 4695 tabless cell with cells aged under A
20,20 and A
−10,45. The fresh cell exhibits a regular, concentric jellyroll without obvious tab-induced inhomogeneities. After more than 1000 cycles, a localized distortion of the inner windings is visible in the A
20,20 cell and remains confined to the core region, whereas the outer windings remain largely aligned. The A
−10,45 cell also retains an overall concentric winding architecture without evidence of large-scale delamination or pronounced void formation. Compared with the more severe jellyroll deformations reported for aged cylindrical cells in the literature, the structural deviations observed here appear comparatively small, although direct comparison remains constrained by differences in the cell format, design, aging history, and imaging conditions [
57].
3.3. Geometrical Changes Due to Aging
Dimensional changes after cycling were evaluated separately for the axial and radial directions (
Figure 6). Measurement repeatability was 2–3
for radial thickness and about 20
for axial length, whereas the A
20,20 group showed somewhat larger axial repeatability of approximately 44
. These uncertainties remained small relative to the axial changes observed after aging.
Overall, axial expansion was the dominant geometrical effect in both aged groups. In terms of mean values, the A20,20 cells increased in axial length by , while the A−10,45 cells showed an even larger mean increase of . Thus, both aging routes led primarily to elongation of the cell, with the low-temperature/high-current condition producing the stronger effect.
By contrast, radial changes remained comparatively small and position-dependent. For A20,20, the mean radial deltas were small and mixed in sign (top , mid , bottom ), i.e., largely within measurement repeatability. For A−10,45, a clearer radial increase was observed at mid-height (), whereas the top and bottom positions remained close to zero (top , bottom ). This indicates that aging-induced dimensional change was governed mainly by axial growth, while measurable radial expansion was limited and, in the case of A−10,45, spatially localized.
3.4. Mechanical Response Under Indentation
Three repeated quasi-static abuse tests were conducted for each group. The replicates showed overall consistent force–displacement behavior within each group, while the group means and individual values indicated consistent shifts in stiffness and failure-related metrics between aging conditions (see
Figure 7a). To avoid overinterpreting the limited sample size, the following analysis emphasizes descriptive group trends, individual test values, and effect magnitudes rather than formal statistical hypothesis testing. To complement the group-level comparison, the complete per test mechanical metrics are provided in
Appendix B.
All curves followed a similar sequence of events. After initial contact, the force increased steadily with displacement as the outer casing and jellyroll layers were compacted. At approximately 2
, a first characteristic kink appeared in the force–displacement curve, as shown in the zoomed view in
Figure 7c. Based on the curvature procedure defined in
Section 2.6, this point was used as a reproducible descriptor of the early force–displacement transition. In view of the known central hollow core of the 4695 cell, the feature is plausibly associated with deformation of this region, although the assignment is not directly resolved in situ. Thereafter, the force increased almost linearly until a distinct maximum was reached. Instead of an abrupt force drop, as often observed in pouch cells [
38], the present cylindrical cells showed a more gradual force decrease, indicating progressive internal structural failure rather than sudden global fracture.
Aging was associated with systematic changes in the measured mechanical response. Relative to fresh cells, the mean effective stiffness before the first kink in the curve increased from
to
for A
20,20 and to
for A
−10,45, corresponding to increases of 15.3% and 12.7%, respectively. After that kink, the mean effective stiffness increased from
for fresh cells to
for A
20,20 and
for A
−10,45. Referencing the onset of failure via the detected internal short circuit, the displacement
shifted left from
for fresh cells to
for A
20,20 and
for A
−10,45, while the corresponding force
decreased from
to
and
, respectively. The absorbed mechanical work to ISC onset,
, dropped from
for fresh cells to
for A
20,20 and
for A
−10,45. As shown in other studies [
39],
remained within about 1–2 of
across all groups, indicating that electrical failure initiated essentially at the global load maximum. A summary of the group-wise mechanical metrics is provided in
Table 3.
3.5. Voltage Response Under Indentation
Figure 7b presents the voltage evolution of cells under indentation across different aging states. During initial compression, the voltage remained largely stable for all tested conditions, indicating intact electrochemical pathways even amid substantial mechanical deformation.
A significant voltage drop was observed only upon initiation of an internal short circuit, coinciding closely with the peak-force region in the force–displacement response. For fresh cells, this voltage decrease was relatively gradual, characterized by a steady decline rather than an abrupt collapse, approaching near-zero values while the indentation continued.
In contrast, aged cells exhibited a markedly different voltage behavior. Cells from the A20,20 group experienced an immediate voltage drop to zero shortly after achieving peak force. Cells from the A−10,45 group showed greater variability: while one cell exhibited an immediate voltage collapse similar to the A20,20 cells, the other two displayed voltage declines comparable to fresh cells.
3.6. Temperature Response Under Indentation
Figure 8 summarizes the post-ISC thermal response in two complementary ways. Panel (a) shows the external surface-temperature envelope for each test, defined as the maximum of the available thermocouple signals and aligned to
at ISC onset. Panel (b) shows the corresponding cumulative integrated thermal exposure over time, which illustrates how thermal severity accumulates during the common post-ISC observation window.
Fresh cells showed the largest scatter in post-ISC thermal evolution. Their peak temperatures ranged from about 308 °C to 866 °C, and the subsequent cooling behavior varied markedly between tests. In contrast, the A20,20 cells exhibited a comparatively steep temperature rise and early peaks between about 599 °C and 885 °C. The A−10,45 cells showed a delayed temperature development, with peak temperatures between 619 °C and 861 °C and broad high-temperature plateaus extending well beyond 15 s after an ISC.
Peak temperature alone therefore did not fully capture the differences in thermal severity between groups. This becomes evident in
Figure 8b, where the cumulative integrated thermal exposure increasingly separates the groups with progressing time after an ISC. Using the common 30 s post-ISC window, the mean values were 6894
for fresh, 9872
for A
20,20, and 13,777
for A
−10,45. The group ranking therefore followed fresh < A
20,20 < A
−10,45.
This ordering was also robust with respect to the chosen evaluation window. For , the corresponding values were 4793 (fresh), 7689 (A20,20), and 7818 (A−10,45); for , they were 5872 , 8823 , and 10,850 K s, respectively. Thus, although the absolute values depended on the selected post-ISC duration, the relative ranking of thermal exposure remained unchanged over the range of 20–30 s.
One fresh test was affected by the failure of two thermocouple channels, such that only a single valid channel contributed to the envelope evaluation in that case. This limits the spatial completeness of the measured surface-temperature maximum for that individual test, but the group-wise ordering of the integrated thermal exposure remained unchanged across the evaluated 20–30 s windows.
Venting location was classified by the first sustained flame ejection after
as bottom-vent (B), top-terminal rupture (T), or sidewall breach (S), and subsequent failures were recorded as sequences (e.g., B→S). More details are provided in
Appendix C. Initial venting differed by aging state (see
Video S1–S3, Supplementary Materials, and representative still frames in
Figure 9): fresh cells vented via B in 2/3 tests and via S in 1/3; A
20,20 cells vented via T in 3/3; and A
−10,45 cells vented via B in 2/3 and via T in 1/3. Thus, the A
20,20 cells showed a consistent tendency toward top-initiated venting, whereas fresh cells and A
−10,45 cells more often vented first at the bottom rupture disk. Moreover, the tests with top-initiated venting also exhibit the visually steeper post-ISC voltage collapses shown in
Figure 7b. While this correlation between abrupt voltage drop and top-initiated venting was consistent across the aged groups, it did not strictly apply to the fresh cells, where one test exhibited a rapid initial voltage drop but ultimately vented through the bottom.
4. Discussion
4.1. Influence of Aging Protocol and Cell Format on Mechanical Integrity
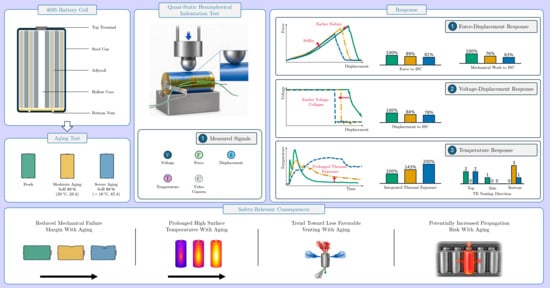
The principal finding of this study is that electrochemical aging was associated with reduced deformation, force, and energy margins to an ISC in large-format tabless 4695 cylindrical cells, even when compared at the same nominal end-of-life capacity. This behavior contrasts with several pouch-cell studies and highlights the format-dependent nature of aging effects under mechanical abuse.
The present dataset indicates that both aging routes reduced the mechanical margins of the investigated large-format 4695 cylindrical cells. Even the room-temperature, moderate-current protocol, which is expected to promote gradual SEI evolution, LLI, and comparatively uniform IR growth, shifted the mean force, displacement, and absorbed energy at ISC onset to lower values while increasing the effective stiffness before and after the first characteristic force–displacement kink. Under low-temperature/high-current cycling, which is more consistent with plating-prone and spatially heterogeneous degradation, the reduction in failure-related mechanical metrics was even more pronounced. These observations differ from several studies on aged pouch cells subjected to quasi-static loading [
33,
34,
36,
38,
39], where aging often delayed structural collapse, produced right-shifted force–displacement curves, and increased or maintained peak force. At the same time, the left-shifted behavior frequently observed here is qualitatively consistent with recent results for aged 18650 cylindrical cells reported by Spettmann et al. [
40].
The present study therefore extends the evidence base to large-format tabless 4695 cells tested at 100% SoC and adds a direct comparison of two distinct aging routes brought to the same end-of-life criterion. Given the limited sample size, these differences are discussed as consistent and safety-relevant trends. Within the limits of the present sample size, these observations should be interpreted as descriptive, pathway-dependent trends at a matched end-of-life capacity. They do not establish a quantitative SoH-dependency and do not identify the true variation trend of the abuse response over the full lifetime of the cell. The comparison is therefore restricted to the tested boundary conditions: large-format tabless 4695 cylindrical cells, two aging pathways ending at 80% SoH, quasi-static hemispherical indentation, and 100% SoC. This distinction is particularly important for ISC-related voltage-collapse patterns, venting observations, and post-ISC thermal metrics, which may exhibit substantial cell-to-cell scatter in destructive abuse tests.
A key difference between this study and many former pouch cell studies is a boundary condition mismatch: across the cited studies, pouch cells were cycled under mechanical preload (module or restricting rigid plates), whereas the subsequent mechanical abuse tests were performed after removing that preload, i.e., effectively unconstrained at the cell level. This discontinuity is unlikely to represent many pack-level situations in which cells remain mechanically supported by surrounding hardware during service and crash loading. Constrained aging followed by unconstrained indentation can therefore influence the measured mechanical–electrical–thermal response.
Because the present study aged and tested the 4695 cells without changing the external confinement state, the observed reduction in mechanical margins is unlikely to originate from a change in external confinement between aging and abuse testing alone. It is therefore consistent with aging-induced changes in the internal material, geometric, and structural state of the cells. Taken together, the present data suggest that aging did not simply reduce the mechanical strength of the cells in a uniform manner, but changed the internal cell state in a way that affected global load transfer during indentation. The measured axial growth demonstrates that aging caused a permanent geometric change in the cell, the CT scans revealed localized distortion in the inner winding region, and the increased internal resistance indicates a modified electrochemical state. In a rigid steel-cased cylindrical cell, such aging-induced changes cannot relax as freely as in unconstrained pouch cells. A plausible consequence is therefore a steeper global force–displacement response at early stages, while the remaining deformation margin to electrically critical failure is reduced. In this respect, the present findings are consistent with the confinement-related interpretation proposed by Spettmann et al. for aged 18650 cells [
40]. However, the present dataset does not distinguish whether this behavior is dominated primarily by electrode thickening, altered local contact conditions within the winding, plating-related inhomogeneity, separator degradation, or a combination thereof. The interpretation is therefore restricted to a cell-level structural reading of the observed trends.
4.2. Voltage Collapse and ISC Behavior
The voltage traces indicate that aging also modified the electrical failure response. For A
20,20, internal short circuits triggered an abrupt voltage drop immediately after reaching peak force, whereas cells cycled under plating-prone low-temperature/high-current conditions showed more heterogeneous responses, including both abrupt and more gradual voltage decay. In contrast, aged pouch cells often transition toward softer ISC behavior with smaller, recoverable voltage drops [
34], or at least maintain similar ISC initiation thresholds despite capacity fade [
33].
One plausible contribution to this difference is the casing-constrained deformation state of cylindrical cells, which may promote more localized stress concentrations and earlier electrical failure than in unconstrained pouch cells. In rigidly cased cylindrical cells, ISC initiation may occur earlier and be accompanied by a more abrupt electrical response, while pouch cells tend to distribute internal strain more broadly and thereby delay electrical breakdown [
35,
42]. The comparatively uniform voltage response of A
20,20 is consistent with a more homogeneous aged state under room-temperature cycling. By contrast, the stronger resistance increase, the low-temperature relaxation signature, and the broader spread in voltage-drop behavior of A
−10,45 are consistent with a more heterogeneous internal state after low-temperature/high-current aging. This interpretation is consistent with the literature linking such aging conditions to plating-prone degradation and locally non-uniform internal states, even though plating itself was not directly resolved here [
33,
40]. The present study also does not include in situ imaging of separator failure or first internal contact formation during indentation, nor interrupted tests with local post mortem analysis at the onset of voltage collapse. Therefore, the data do not permit a direct identification of the local shorting path or contact geometry. The interpretation is instead based on the measured cell-level signatures, namely the shape of the voltage response, the resistance increase, and the differing scatter between both aging routes.
4.3. Thermal Behavior and Venting Pathways
Thermal responses show similar peak temperatures across states, consistent with earlier pouch cell studies that linked TR onset primarily to SoC rather than SoH [
34,
36]. However, the aged cylindrical cells exhibited a more prolonged externally measurable thermal response. This becomes evident in
, which integrates the measured surface temperature over the first 30
after ISC onset. Thus,
does not represent internal heat generation or total heat release, but describes the time-integrated surface-temperature exposure experienced outside the failing cell.
This distinction is important for pack-level safety assessment. Peak surface temperature captures the maximum measured value at one point in time, whereas
also reflects how long elevated temperatures persist after an ISC. It therefore provides a useful comparative descriptor for the externally measured thermal exposure relevant to adjacent cells, busbars, foams, adhesives, and structural components under identical test conditions. The observation that peak temperatures remained broadly similar while
increased indicates that the observed aging effect was reflected primarily in the temporal persistence of the externally measured post-failure thermal exposure rather than only its maximum surface temperature. This contrasts with some pouch cell results where aging reduced heating rates or limited TR severity due to soft ISC modes [
33,
34].
The venting observations suggest that aging may alter the preferred release pathway, but the pattern depended on the aging route and should be regarded as preliminary. Fresh cells showed only bottom and/or side venting sequences (B, S, and B→S), whereas all cells aged at 20 °C and 20 exhibited initial top-terminal venting (T→B→S, T→S, and T→S). In contrast, the cells aged at −10 °C and 45 showed mixed behavior, with two tests venting first through the bottom rupture disk and one through the top terminal (B, B, and T). The present data therefore indicate a trend that the initial venting pathway may shift with aging history, with the clearest tendency observed for the room-temperature-aged group.
A plausible hypothesis is that the initial venting direction was influenced by the local severity and progression rate of the ISC event rather than by the aging state alone. In the present tests, top-initiated venting coincided mainly with visually steeper post-ISC voltage collapse, most consistently in the A
20,20 group and in the single top-venting A
−10,45 test. Previous mechanical abuse studies have shown that an ISC can evolve from soft to hard short-circuit behavior during continued deformation [
4]. In addition, local short-circuit resistance, contact conditions, and damaged area are known to control localized Joule heating and the subsequent electrochemical–thermal response during penetration-type ISC events [
58]. A faster voltage collapse could be consistent with a lower resistance or a more rapidly developing local shorting path, which may promote localized heating and gas generation. In a cylindrical cell with a designed bottom-vent path, the initial release direction may then depend on where local damage, gas generation, and the first available mechanical release path coincide. This interpretation remains hypothetical because the present study did not measure internal pressure, gas composition, or the local shorting path in situ. If confirmed in larger datasets, such changes in the initial venting pathway would be relevant for pack-level safety. Fractional calorimetry on 18650 cells indicates that only about 20–30% of TR energy is conducted through the can, while the majority is carried by hot gas, particulates, and flame ejecta [
45]. Consequently, the initial vent pathway is expected to affect the direction and location of heat and mass release. In the present 4695 tests, top-terminal initiation directed ejecta upward toward busbars and electronics, whereas bottom-directed venting is more compatible with routing into designated exhaust volumes.
4.4. Implications for Safety Assessment and Modeling
These findings suggest that aging effects on mechanical abuse tolerance are format-dependent. In flexible pouch cells, electrochemical aging often increases deformation tolerance and shifts ISC behavior toward softer, less catastrophic responses [
33,
35,
36,
38,
39]. In the investigated rigid steel-cased 4695 cells, the aged groups instead showed increased stiffness, earlier ISC onset, more abrupt voltage collapse in several tests, and prolonged post-ISC surface-temperature exposure.
This format dependence should therefore be considered in safety assessment and model validation. Relying solely on fresh-cell data or on aging trends derived from pouch cells may overlook relevant reductions in deformation and energy-absorption margins, as well as possible changes in post-failure thermal exposure and venting direction in large-format cylindrical cells.
To reduce boundary-condition artifacts, future pouch-cell studies could maintain the same compression fixture from aging through mechanical abuse testing and report preload magnitude and fixture stiffness explicitly.
4.5. Limitations and Future Work
Scope, SoH resolution, and boundary conditions: The present study tested only one capacity-degradation level, namely 80% SoH, under quasi-static loading at 100% SoC. This design is suitable for a controlled comparison of two aging pathways at a matched end-of-life capacity, but it is insufficient to identify the true trend in variation across multiple abuse-response metrics over the cell’s full lifetime. In particular, the present dataset does not allow a quantitative characterization of the continuous SoH dependency of mechanical margins, ISC-related voltage-collapse behavior, venting pathways, or post-ISC thermal exposure. Future work should therefore include multiple intermediate capacity-fading levels, larger sample sizes, dynamic crash loading, partial SoC states, and high-temperature aging conditions.
Measurement geometry: Radial dimensions were taken at one circumferential location per height. Undetected ovalization could bias point measurements. Future work should adopt full circumferential measurements to quantify ovality and decouple true radial growth from shape change.
Mechanistic resolution: Higher-resolution post mortem analysis (e.g., Scanning Electron Microscope (SEM)) is needed to link microscopic aging mechanisms more directly to macroscopic failure onset and ISC pathways. In particular, interrupted abuse tests with targeted sectioning near the first shorted region, high-resolution post-failure CT or metallography, component-level mechanical testing of aged electrodes and separators, and finite-element simulation supported structural interpretation would help resolve how aging-induced internal changes, geometric constraint, and local failure initiation interact under indentation.
Generalizability and statistical power: Sample sizes were limited to
per group. This repetition level is comparable to several destructive cell-level abuse studies on aged LIBs, which commonly report approximately three repeated tests per condition, including
in Spettmann et al. [
40],
in Liu et al. [
38], Gstrein et al. [
32], and Abbas et al. [
59], and
–3 depending on the loading condition in Liu et al [
37]. Nevertheless, this sample size limits the statistical power of formal hypothesis testing and is particularly constraining for ISC-related and thermal metrics, which can exhibit substantial cell-to-cell scatter in destructive abuse tests. Consequently, the differences reported in this work should be interpreted as descriptive trends under controlled test conditions, not as statistically powered estimates of a quantitative SoH-dependent abuse-response map. Future studies should increase the number of tested cells per group, repeat the experiments across several aging routes and SoC conditions, and combine finer SoH intervals with statistically powered analysis. Such datasets would be required to resolve intermediate degradation stages, separate pathway effects from capacity-fade effects, and quantitatively characterize SoH-dependent mechanical–electrical–thermal safety behavior.
Nevertheless, the controlled comparison of the cell format, SoC, abuse test configuration, and end-of-life capacity provides a useful baseline dataset for a large-format tabless cylindrical architecture for which destructive aging-aware abuse data remain scarce.
5. Conclusions
This work compared two deliberately different cycling routes, namely room-temperature moderate-current aging and low-temperature/high-current aging, and showed that both were associated with reduced safety-relevant mechanical margins in tabless 4695 cylindrical cells under the tested conditions. Relative to fresh cells, A20,20 reduced the mean displacement, force, and absorbed work to an ISC from 13.74 to 11.55 mm, from 106.16 to 94.70 kN, and from 591.4 to 449.3 J, respectively, and showed a shift toward top-terminal venting in this test series. A−10,45 showed a further reduction of these mean values to 10.71 mm, 85.52 kN, and 370.8 J and produced the highest integrated thermal exposure, while its ISC and venting behavior remained more heterogeneous.
These findings demonstrate that electrochemical aging can affect not only the onset of mechanical–electrical failure, but also the subsequent thermal and venting response of large-format cylindrical cells. For structural battery integration concepts, the observed reduction in deformation and energy-absorption margins is particularly relevant because it may alter both the effective structural response and the residual safety reserve under intrusion loading. The venting-related observations remain preliminary because of the limited sample size, but they indicate that aging may also influence the directionality of heat, gas, and ejecta release.
The conclusions are restricted to the tested end-of-life condition of 80% SoH and should not be interpreted as a quantitative SoH-dependent trend over the full degradation trajectory. Moreover, the results complement previous intrusion studies on aged 18650 cylindrical and pouch cells, while showing that aging trends should not be transferred automatically across cell formats and inner architecture, SoC conditions, and venting designs. Consequently, representative aging histories should be incorporated into abuse assessment, cell qualification, and predictive safety engineering whenever aged-cell behavior is relevant for the intended application.


 ,
, 


