Article

Experimental Testing and Modeling of Li-Ion Battery Performance Based on IEC 62660-1 Standard

Department of Environmental Engineering, Democritus University of Thrace, 67132 Xanthi, Greece
*
Author to whom correspondence should be addressed.
Batteries 2025, 11(8), 314; https://doi.org/10.3390/batteries11080314
Submission received: 10 July 2025 / Revised: 7 August 2025 / Accepted: 14 August 2025 / Published: 17 August 2025

Abstract

The adoption of sustainable and environmentally friendly solutions is becoming crucial across several sectors, particularly in transportation. As part of this transition, the transport industry has turned its attention to electric vehicle (EV) development and the deployment of electric batteries. This study provides a comprehensive analysis of the performance of EV batteries, integrating both experimental measurements and simulations. The experimental section involved a series of tests conducted on real batteries under various operating conditions, focusing on different charging and discharging rates. Additionally, the IEC 62660-1 standard was applied, to evaluate their performance under realistic usage scenarios. Moreover, a theoretical model was developed in order to simulate the batteries’ behavior and replicate the observed experimental data. A comparison between the simulation outputs and experimental data was conducted, demonstrating the accuracy of the model. This work provides valuable insights into the performance of EV batteries and lays the foundation for optimization in future applications.

1. Introduction

The increase in greenhouse gas emissions has had significant consequences on modern life, causing serious environmental issues such as extreme weather conditions. Specifically, the transport sector is responsible for approximately 16% of global greenhouse gas emissions, since 97% of land vehicles are still fueled by oil according to [1]. Therefore, the transition to electric vehicles (EVs) constitutes a key step toward the decarbonization of transportation to meet the climate change targets.
The expansion of battery electric vehicles (BEVs) highlights the critical role of energy storage, with lithium-ion batteries drawing considerable attention. Due to the advantages they hold such as higher density and voltage capacity, low weight, small size, long lifespan, high charging rates and low self-discharge rate, this type of battery has become popular in EV applications [2,3,4,5,6].
Given the critical role of lithium-ion batteries in electric vehicle (EV) performance, understanding and predicting their behavior under various operating conditions is essential. This need led to the development of several models that aim to simulate the battery operation to optimize battery selection for EV applications to maximize performance, ensure safety and extend EV battery life. Battery models typically fall into four main categories: electrochemical, mathematical, electrical and combination models, according to their physical, mathematical or electrical approach, respectively [2,7,8,9].
More specifically, electrochemical models are based on physical principles and are used to simulate the battery’s thermal behavior by considering the current and cell voltage during both charging and discharging. Nevertheless, they can be complex and demanding due to the differential equation of one or more dimensions involved [10,11,12,13]. On the other hand, mathematical models tend to be abstract, yet useful when applied in specific scenarios and system design. Their use provides a fast and safe way to study battery behavior under different operating conditions, but they are regarded to produce results with a 5–20% error margin [2,7,10,14]. Additionally, they can become a key factor in the improvement of charging or discharging techniques, the enhancement of battery capacity and the prevention of serious damage to batteries from overcharging or over-discharging. Finally, electrical models can reproduce the cell voltage profile during charging and discharging by monitoring only the battery’s temperature, but they do not provide a detailed thermal profile throughout these processes [2,7].
A key component of many battery models is the open-circuit voltage (OCV), which represents the battery’s equilibrium potential and is closely related to its State of Charge (SoC). Since accurate OCV estimation is essential for reliable SoC determination and the overall model performance, various approaches exist for OCV modeling, ranging from simple linear approximations to more complex equations. Simpler models do not take into account non-linearity, while other methods strive to closely replicate the real behavior [5].
Beyond the modeling approaches, the Battery Management System (BMS) plays a crucial role in real-time estimation and control of battery parameters, especially the SoC. The reason why BMS is so important is that SoC forms the foundation to ensure the safety, reliability and longevity of lithium-ion batteries in EVs. The BMS’s algorithms are based on mathematical and circuit models to capture battery dynamics in order to predict conditions, helping both cell balancing and preventing overcharging, deep discharging, safety risks and thermal issues. [3,8,15] There are several methods used for the estimation of SoC such as the ampere-hour integration method, the OCV method, methods based on modern control theory and neural network methods. Concerning the first, it calculates the change in SoC value by interpolating the OCV on the OCV-SoC curve. [15] This method can be either numerical, as a look-up table, or analytical, as a mathematical expression, with the latter being more effective.
In this study, the developed model describes the electrochemical behavior of a battery with exceptional precision in terms of terminal voltage, open-circuit voltage, internal resistance, discharge current and capacity. Building upon this modeling approach, standardized experimental validation is crucial to ensure the accuracy of the simulation results. For this purpose, the IEC 62660-1 testing protocol was adopted by applying dynamic charging and discharging profiles under controlled conditions. In the field of EVs, standardized battery testing is essential to ensure safety and good performance. The IEC 62660-1 standard, issued by the International Electrotechnical Commission, defines a series of steps to evaluate the electrical characteristics of lithium-ion battery cells used in EV applications [16,17].
This paper presents a combined experimental and modeling approach to evaluate the performance of lithium-ion batteries used in electric vehicles, comparing real-life measurements with simulated data based on the IEC 62660-1 standard. The novelty of the work lies in its ability to reproduce battery behavior through a mathematical approach that combines simplicity and effectiveness, offering reliable predictions of voltage dynamics across various operating scenarios.
This paper is organized as follows. Section 2 presents the materials used and describes the experimental setup, including the characterization tests performed at different current rates. Section 3 compares simulated results with experimental data to validate the accuracy of the proposed equations under realistic test conditions. Section 4 discusses the implications of the findings and suggests future research directions, followed by concluding remarks in Section 5.

2. Materials and Methods

2.1. Materials and Experimental Equipment

The experimental study was conducted using five Sony/Murata VTC6 lithium-ion cylindrical cells (Tohoku Murata Manufacturing Co., Ltd., Fukushima, Japan), connected in series, as presented in Figure 1. These cells are suitable for electric vehicle research applications [18,19,20,21] due to their reliability and stable performance (Table 1).
The tests were performed using ITECH IT-M3900C bi-directional programmable DC power supply (ITECH ELECTRONIC Co., Ltd., New Taipei City, Taiwan), which offers precise current and voltage control during both charging and discharging procedures (Figure 2).
A series of charge and discharge experiments were conducted to characterize the voltage behavior of the lithium-ion cell under various current rates. The experiments were performed under constant current/constant voltage (CC/CV) conditions, at current values of 1A, 3A and 5A at room temperature thermal conditions. For each current level, full charge and discharge cycles were executed, with sampling interval set at 10 s in the charge and discharge experiments of 1 and 3A, and with a 1 s interval in the 5A charge/discharge experiment, but also in the experiment concerning the IEC standard as described in Section 2.4.
During discharge, the batteries were discharged from their maximum voltage of 21 V down to a minimum cutoff voltage of 12.5 V, as specified by the manufacturer. For the charging experiments, the cells were charged from the cutoff voltage up to 21 V using the same set of current values.
Furthermore, open-circuit voltage (OCV) and closed-circuit voltage (CCV) measurements were collected for each charge and discharge current level, providing additional insight into the behavior of the battery pack. This step was crucial to evaluate the model’s voltage prediction accuracy and its ability to adapt under different current profiles. The insights drawn from these measurements laid the foundation for the subsequent analysis and parameter optimization discussed in Section 3.

2.2. Determination of OCV

To determine the OCV, two experiments were conducted, during both charging and discharging phases. The goal was to establish a precise relationship between battery capacity and OCV, which is essential for improving the model’s accuracy.
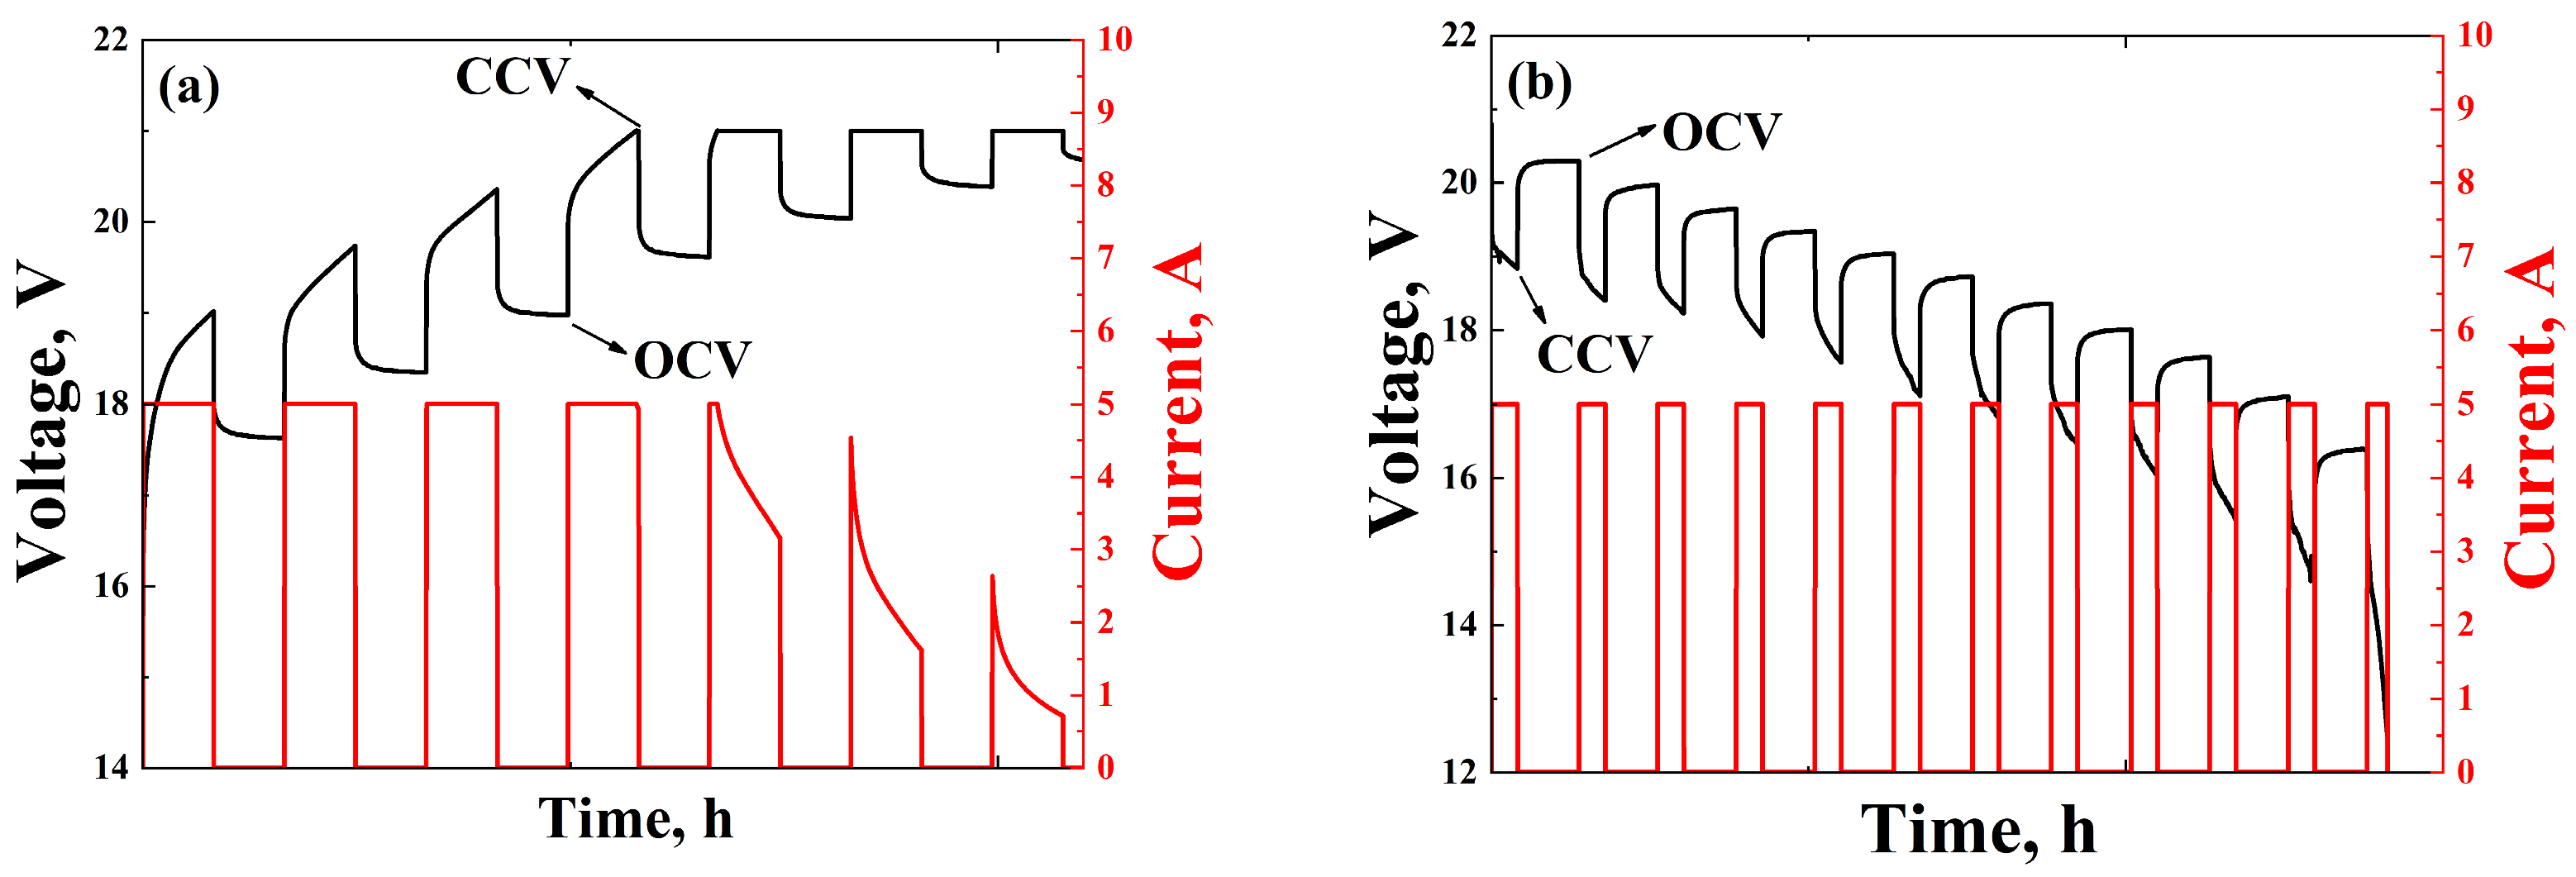
For the OCV experiments, the battery was first fully discharged and left to rest for 20 min to reach electrochemical balance. Then, a charging current of 1A, 3A and 5A was applied for 10 min, followed by a 5-min rest period, during which the OCV was measured. This sequence was repeated until the battery reached its full charge level. The entire procedure was performed for multiple combinations of charging and discharging currents (1A, 3A and 5A) to improve model accuracy.
The voltage and current behavior during these tests are shown in Figure 3a,b. Figure 3b illustrates the discharge phase at 5A, where periodic current pulses are applied. During each discharge step, the battery voltage (black line) drops under load (red line). When the current is interrupted, the system begins to return to its previous equilibrium, and the voltage gradually increases toward open-circuit voltage. Figure 3a represents the corresponding process during charging at 5A. As the current (red line) is applied, the battery voltage (black line) increases. Compared to discharge, the voltage gap is narrower, due to the lower current value.
For each rest period, both the closed-circuit voltage (CCV) and the OCV were recorded, and the battery capacity was updated. This process allowed the construction of detailed OCV-battery capacity curves, which were later used for parameter extraction in the model. It is important to note that the collected OCV-battery capacity data were fitted using polynomial regression.

2.3. Experimental Model

Building upon the extracted OCV data, voltage simulation equations were formulated to predict the behavior of the lithium-ion cell during both charging and discharging processes under various operating conditions. The simulation model assumes that the cell voltage can be expressed as a combination of the open-circuit voltage and a current dependent term representing internal resistance or voltage drop, depending on whether the battery is charging or discharging:
V b a t , s i m =   C C V c h   o r   d i s =   O C V c h   o r   d i s   ±   I R
where
V b a t , s i m is the simulated battery voltage;
C C V c h   o r   d i s is the battery’s closed-circuit voltage during charging (ch) or discharging (dis);
O C V c h   o r   d i s is the battery’s open-circuit voltage during charging (ch) or discharging (dis);
IR is voltage drop.
The positive sign applies to charge and the negative sign to discharge.

2.4. IEC 62660-1 Standard

IEC 62660-1 is a standard [16,17] which specifies the test method for not only the performance but also the life of secondary lithium-ion cells used exclusively for automobile traction applications, including both battery electric vehicles (BEVs) and hybrid electric vehicles (HEVs).
In accordance with IEC 62660-1, the cycle life testing procedure involves a sequence of standardized temperature and current conditions [17]:
  • The ambient temperature shall be 25 °C or 45 °C.
  • The cell should be fully discharged by the method specified by the manufacturer.
  • The cells should be fully charged by the method specified by the manufacturer.
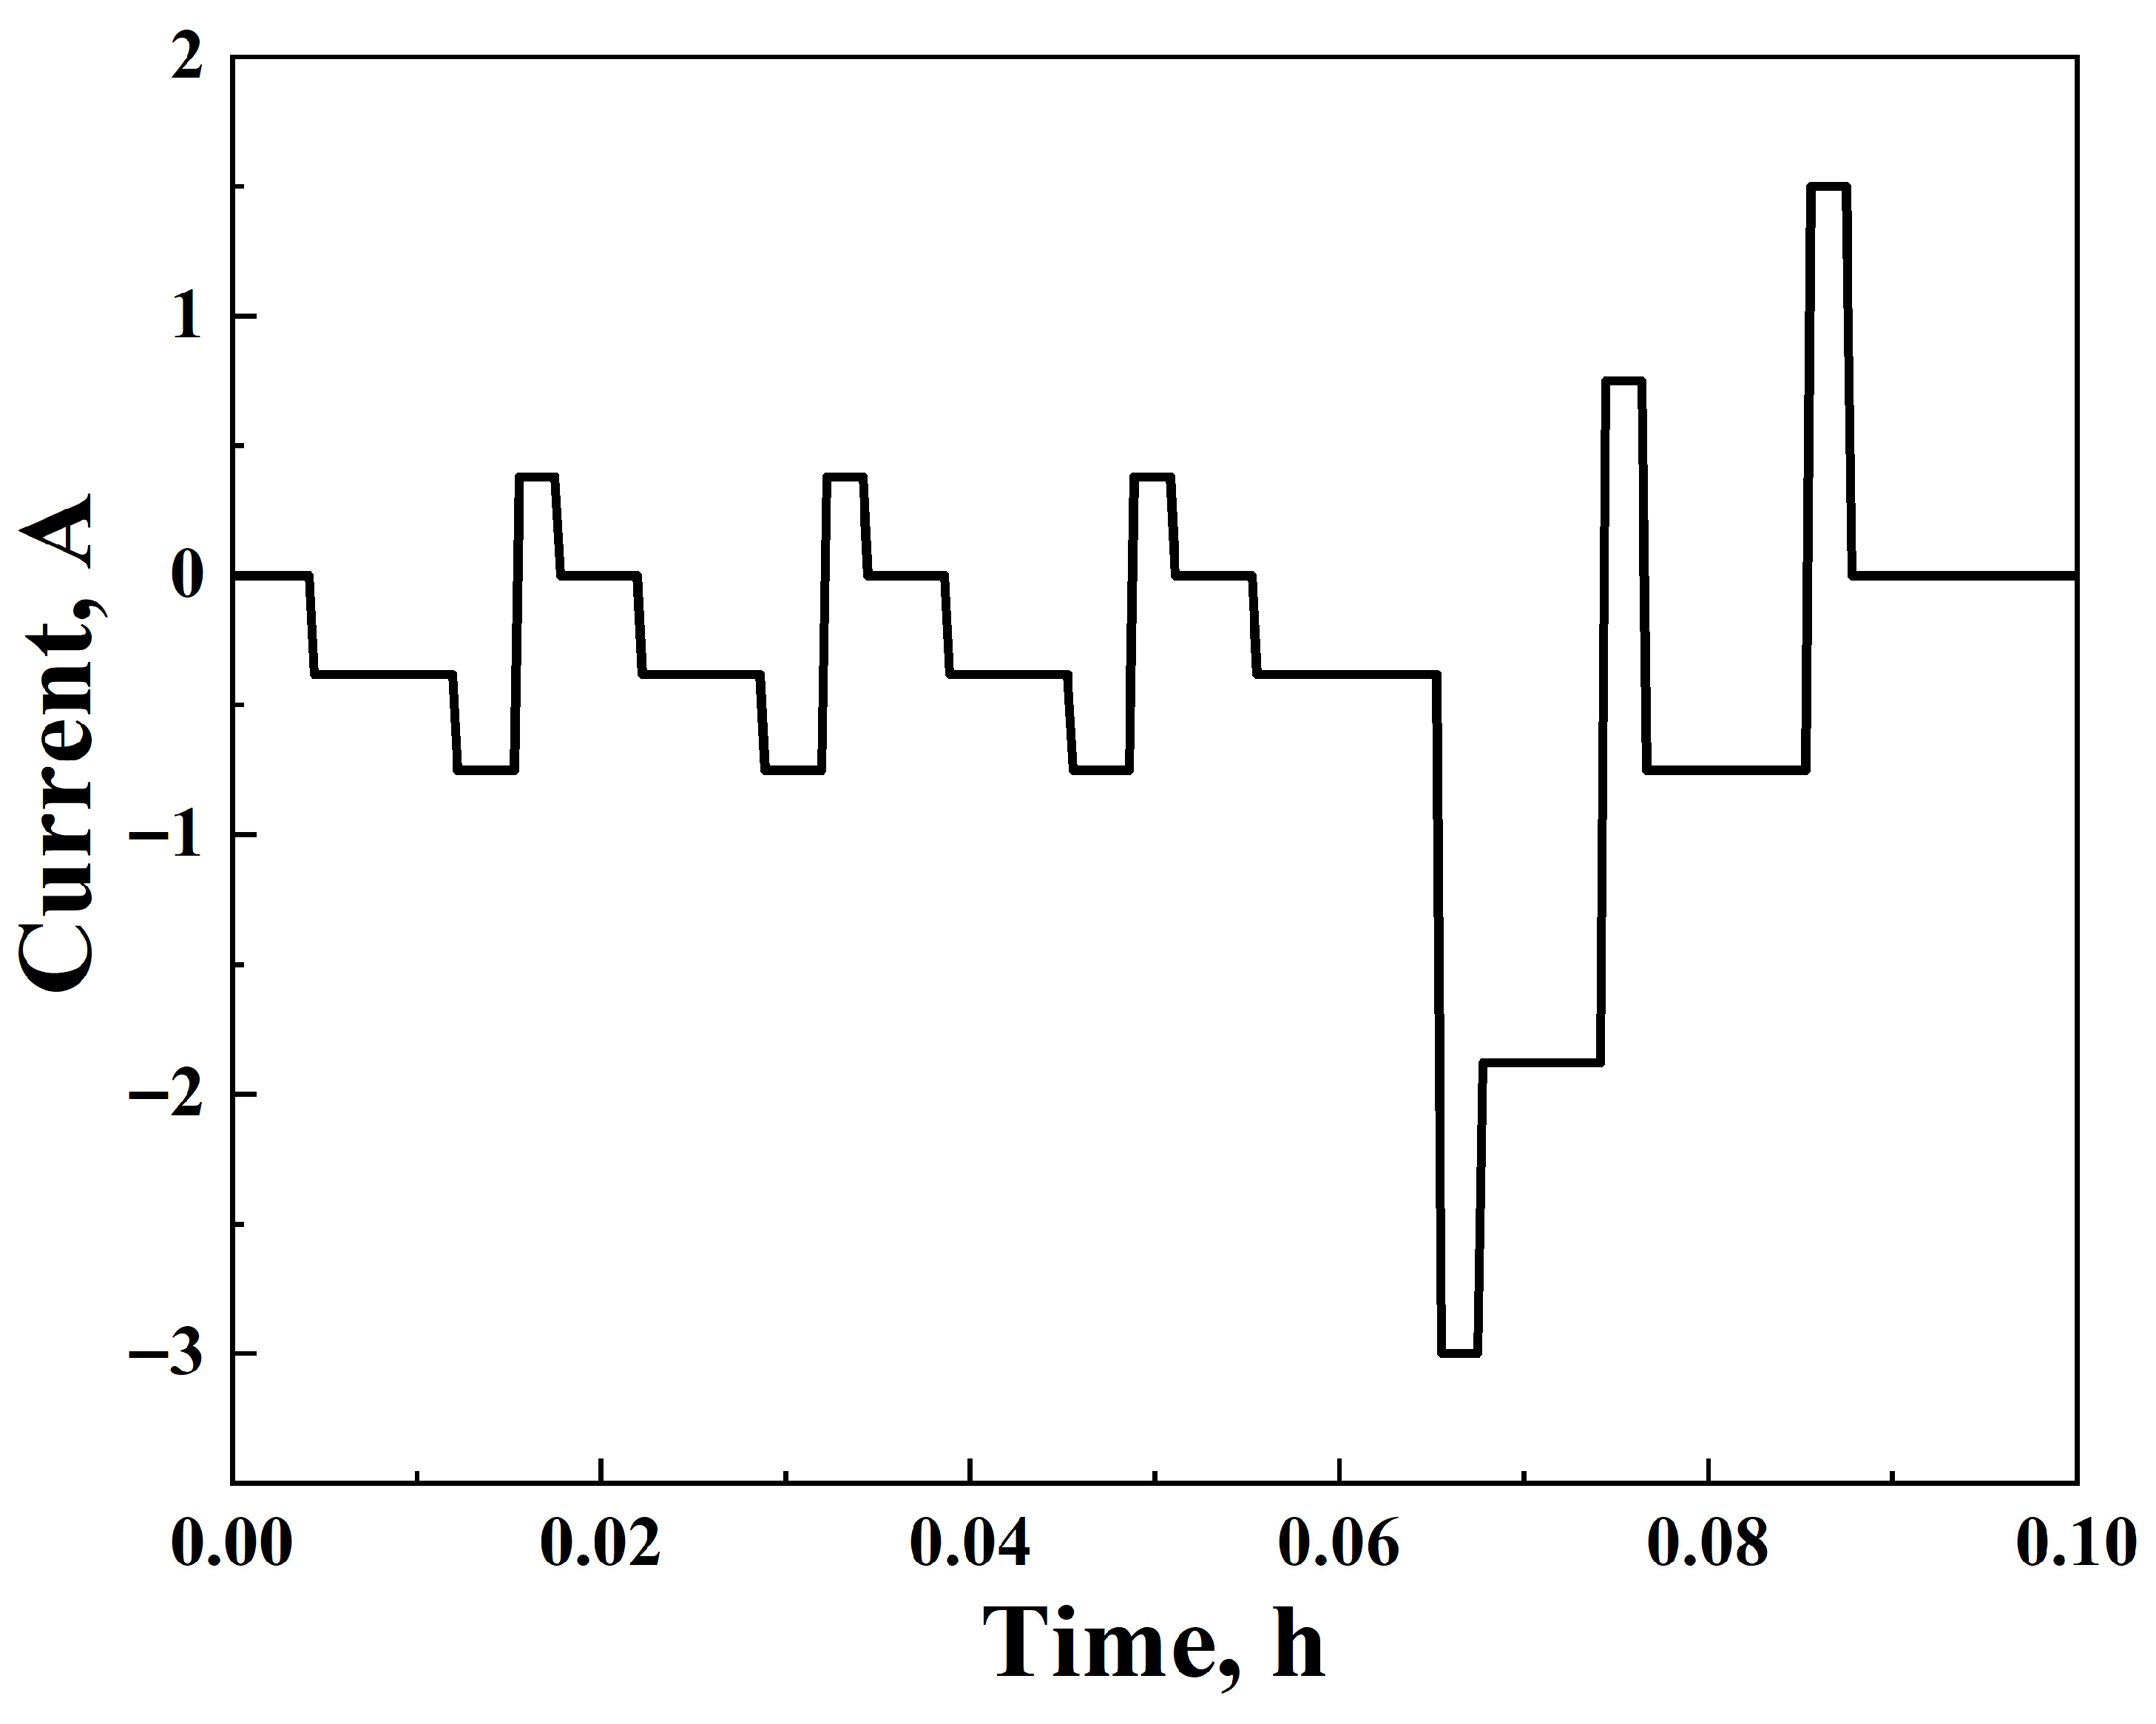
  • The cells should be discharged following the Dynamic Discharge Profile A (Figure 4), given in [17], until the discharged capacity reaches the equivalent of 50% of the initial dynamic discharged capacity.
  • Discharge the cells following the Dynamic Discharged Profile B, given in [17], one time.
  • Discharge the cells following the Dynamic Discharge Profile A, given in [17], until the overall discharge capacity reaches the equivalent of 80% of the initial capacity.
  • After the repetition of the steps above for 28 test days, the cells’ performance should be evaluated.
Based on the framework defined by IEC 62660-1, a dynamic discharge experiment was designed and executed in this study in order to evaluate the behavior of the selected lithium-ion cells under realistic conditions. The cells were first fully charged using a constant current/constant voltage method and subsequently discharged according to the steps above. The test temperature was 25 °C, with SoC initialized at 100%, and the data were recorded every second.

3. Results

3.1. Determination of OCV and IR During Discharging

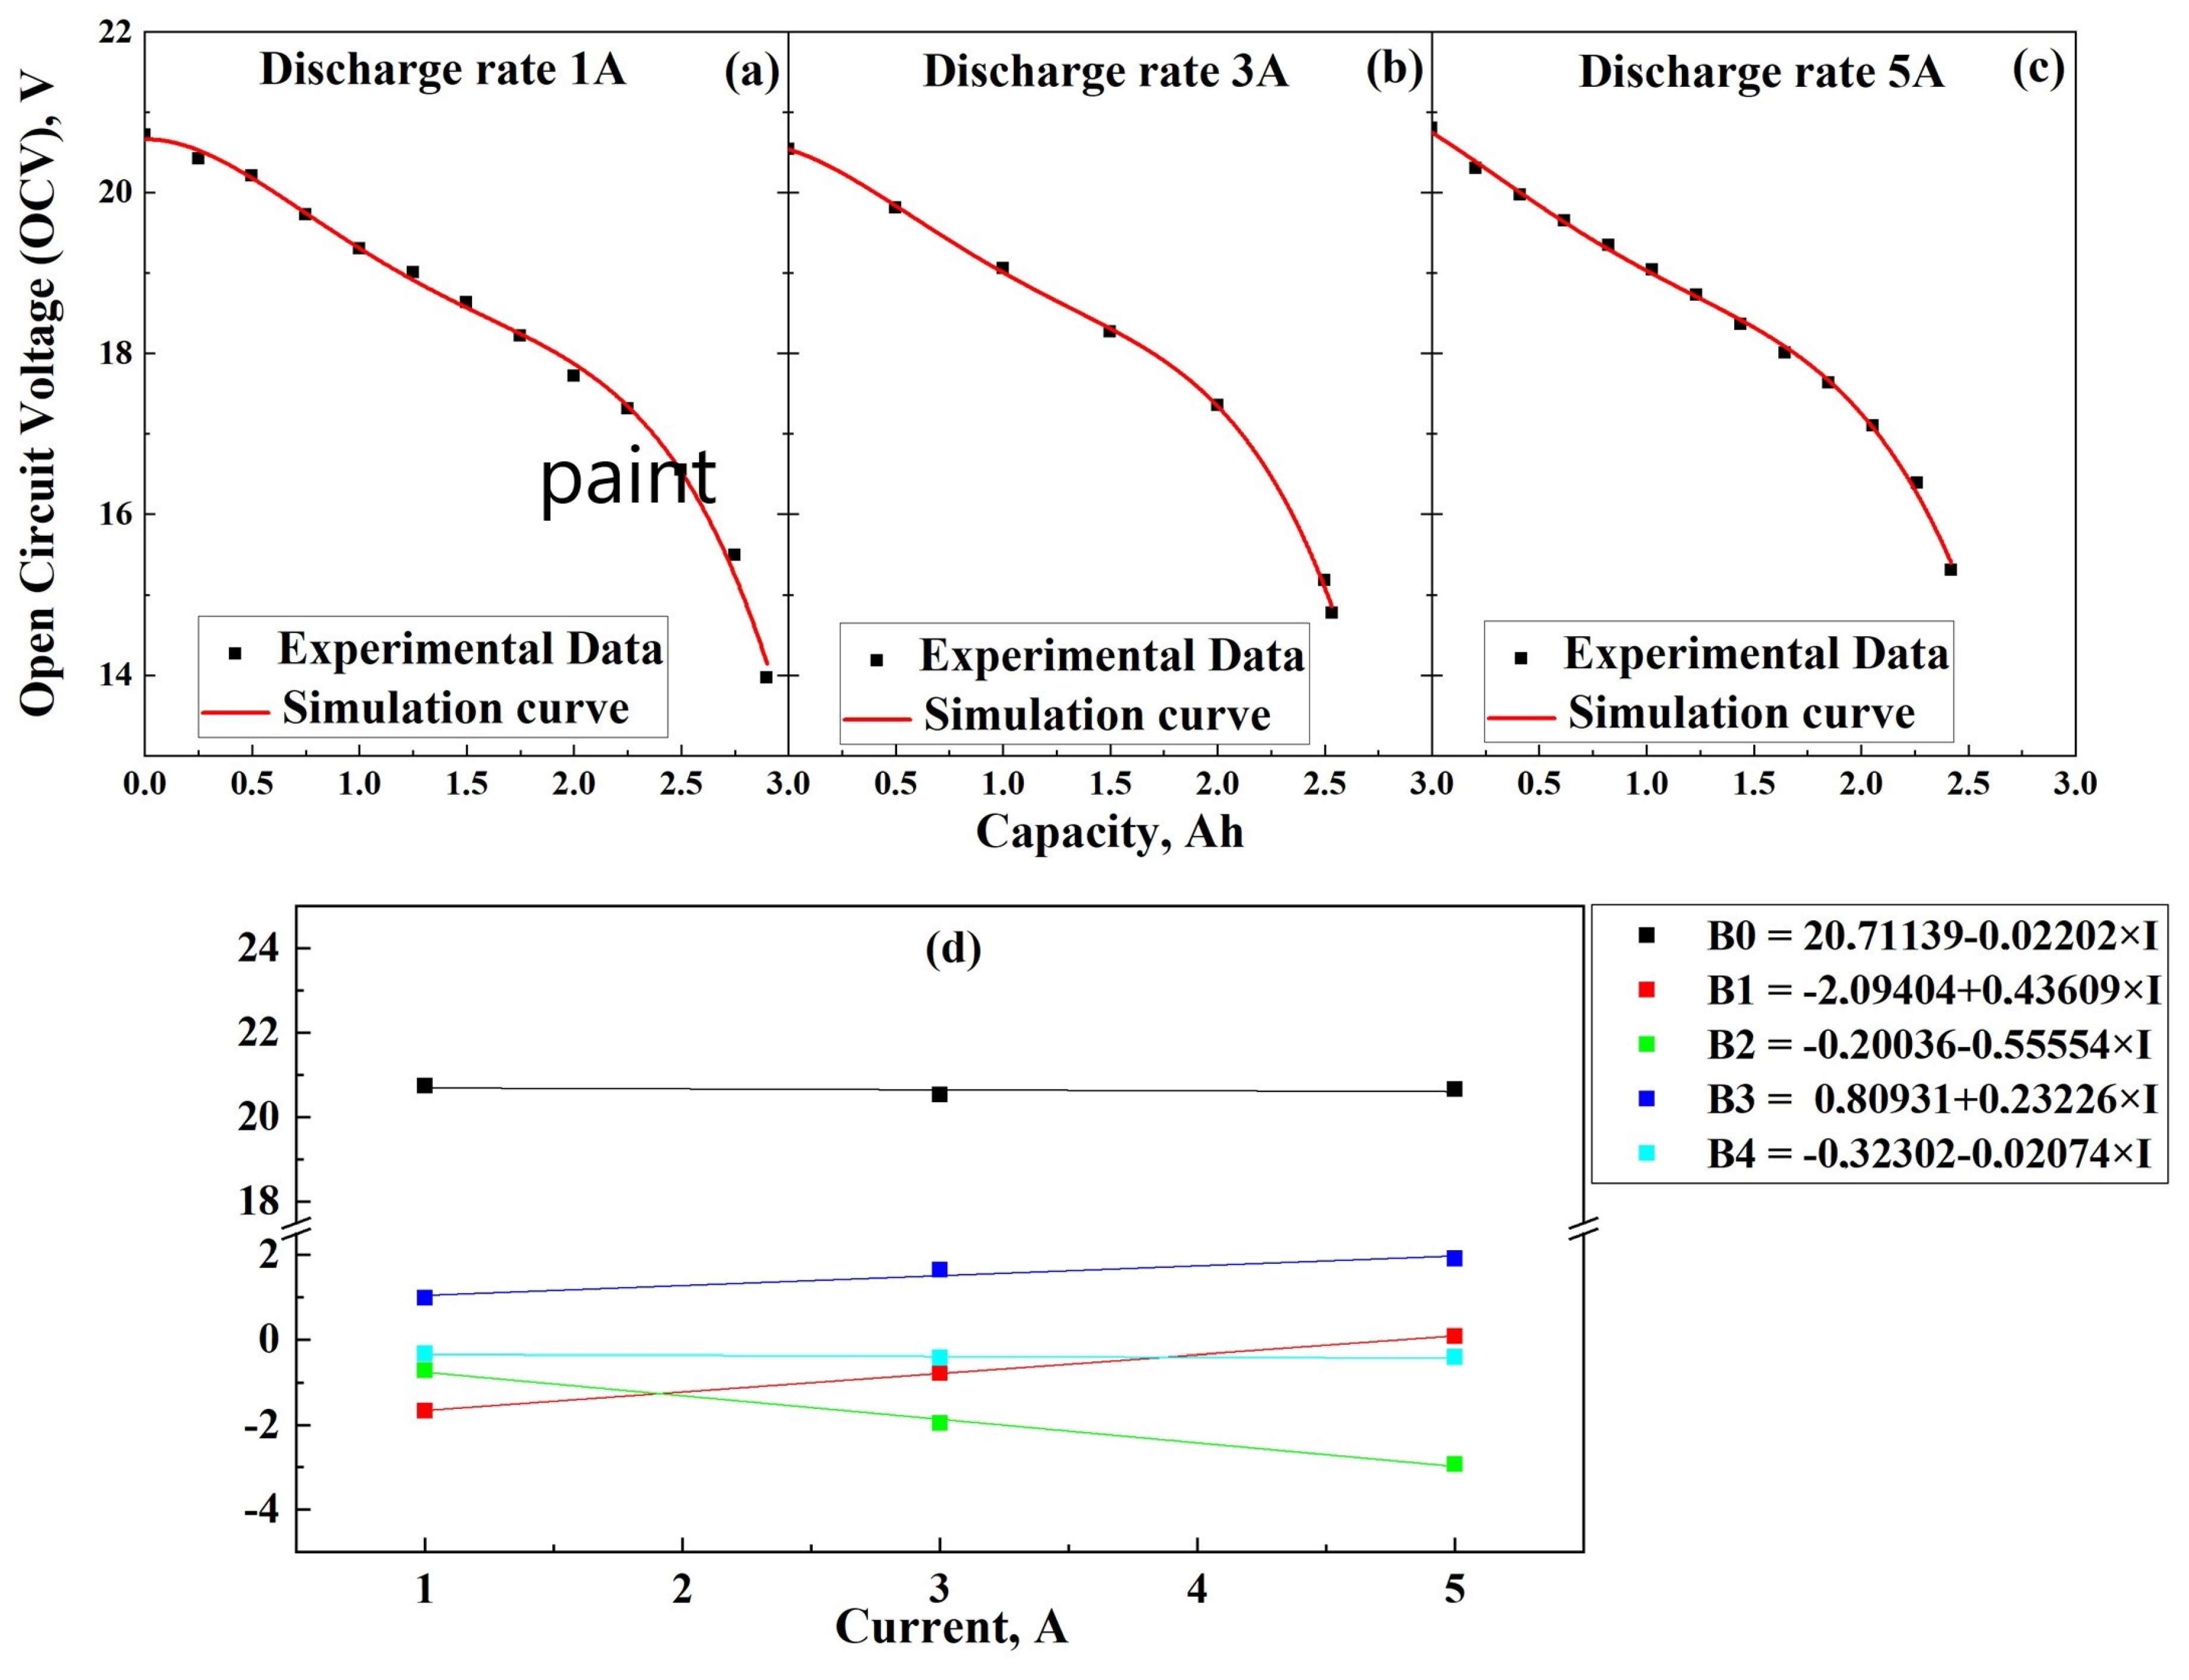
To determine the OCVdis behavior of the cells, a series of controlled charge and discharge cycles were conducted as mentioned above. Figure 5a–c display the open-circuit voltage as a function of capacity for three different discharge rates (1A, 3A and 5A). Each plot overlays experimental data with a simulation curve. The simulation curve in each case represents the fitted polynomial curve, providing a detailed representation of the potential O C V d i s . The relationship between OCVdis and capacity (C) was fitted using the following polynomial equation:
O C V d i s   = B 0   + B 1 × C   + B 2 × C 2   + B 3 × C 3   + B 4 × ( C ) 4
Figure 5d presents the evolution of model parameters ( B 0 ,   B 1 ,   B 2 ,   B 3 and B 4 ) of Equation (2) as a function of discharge current as shown in Table 2. By extracting and plotting these parameters, the model can be continuously adjusted, ensuring that the simulated voltage response remains accurate for any given current.
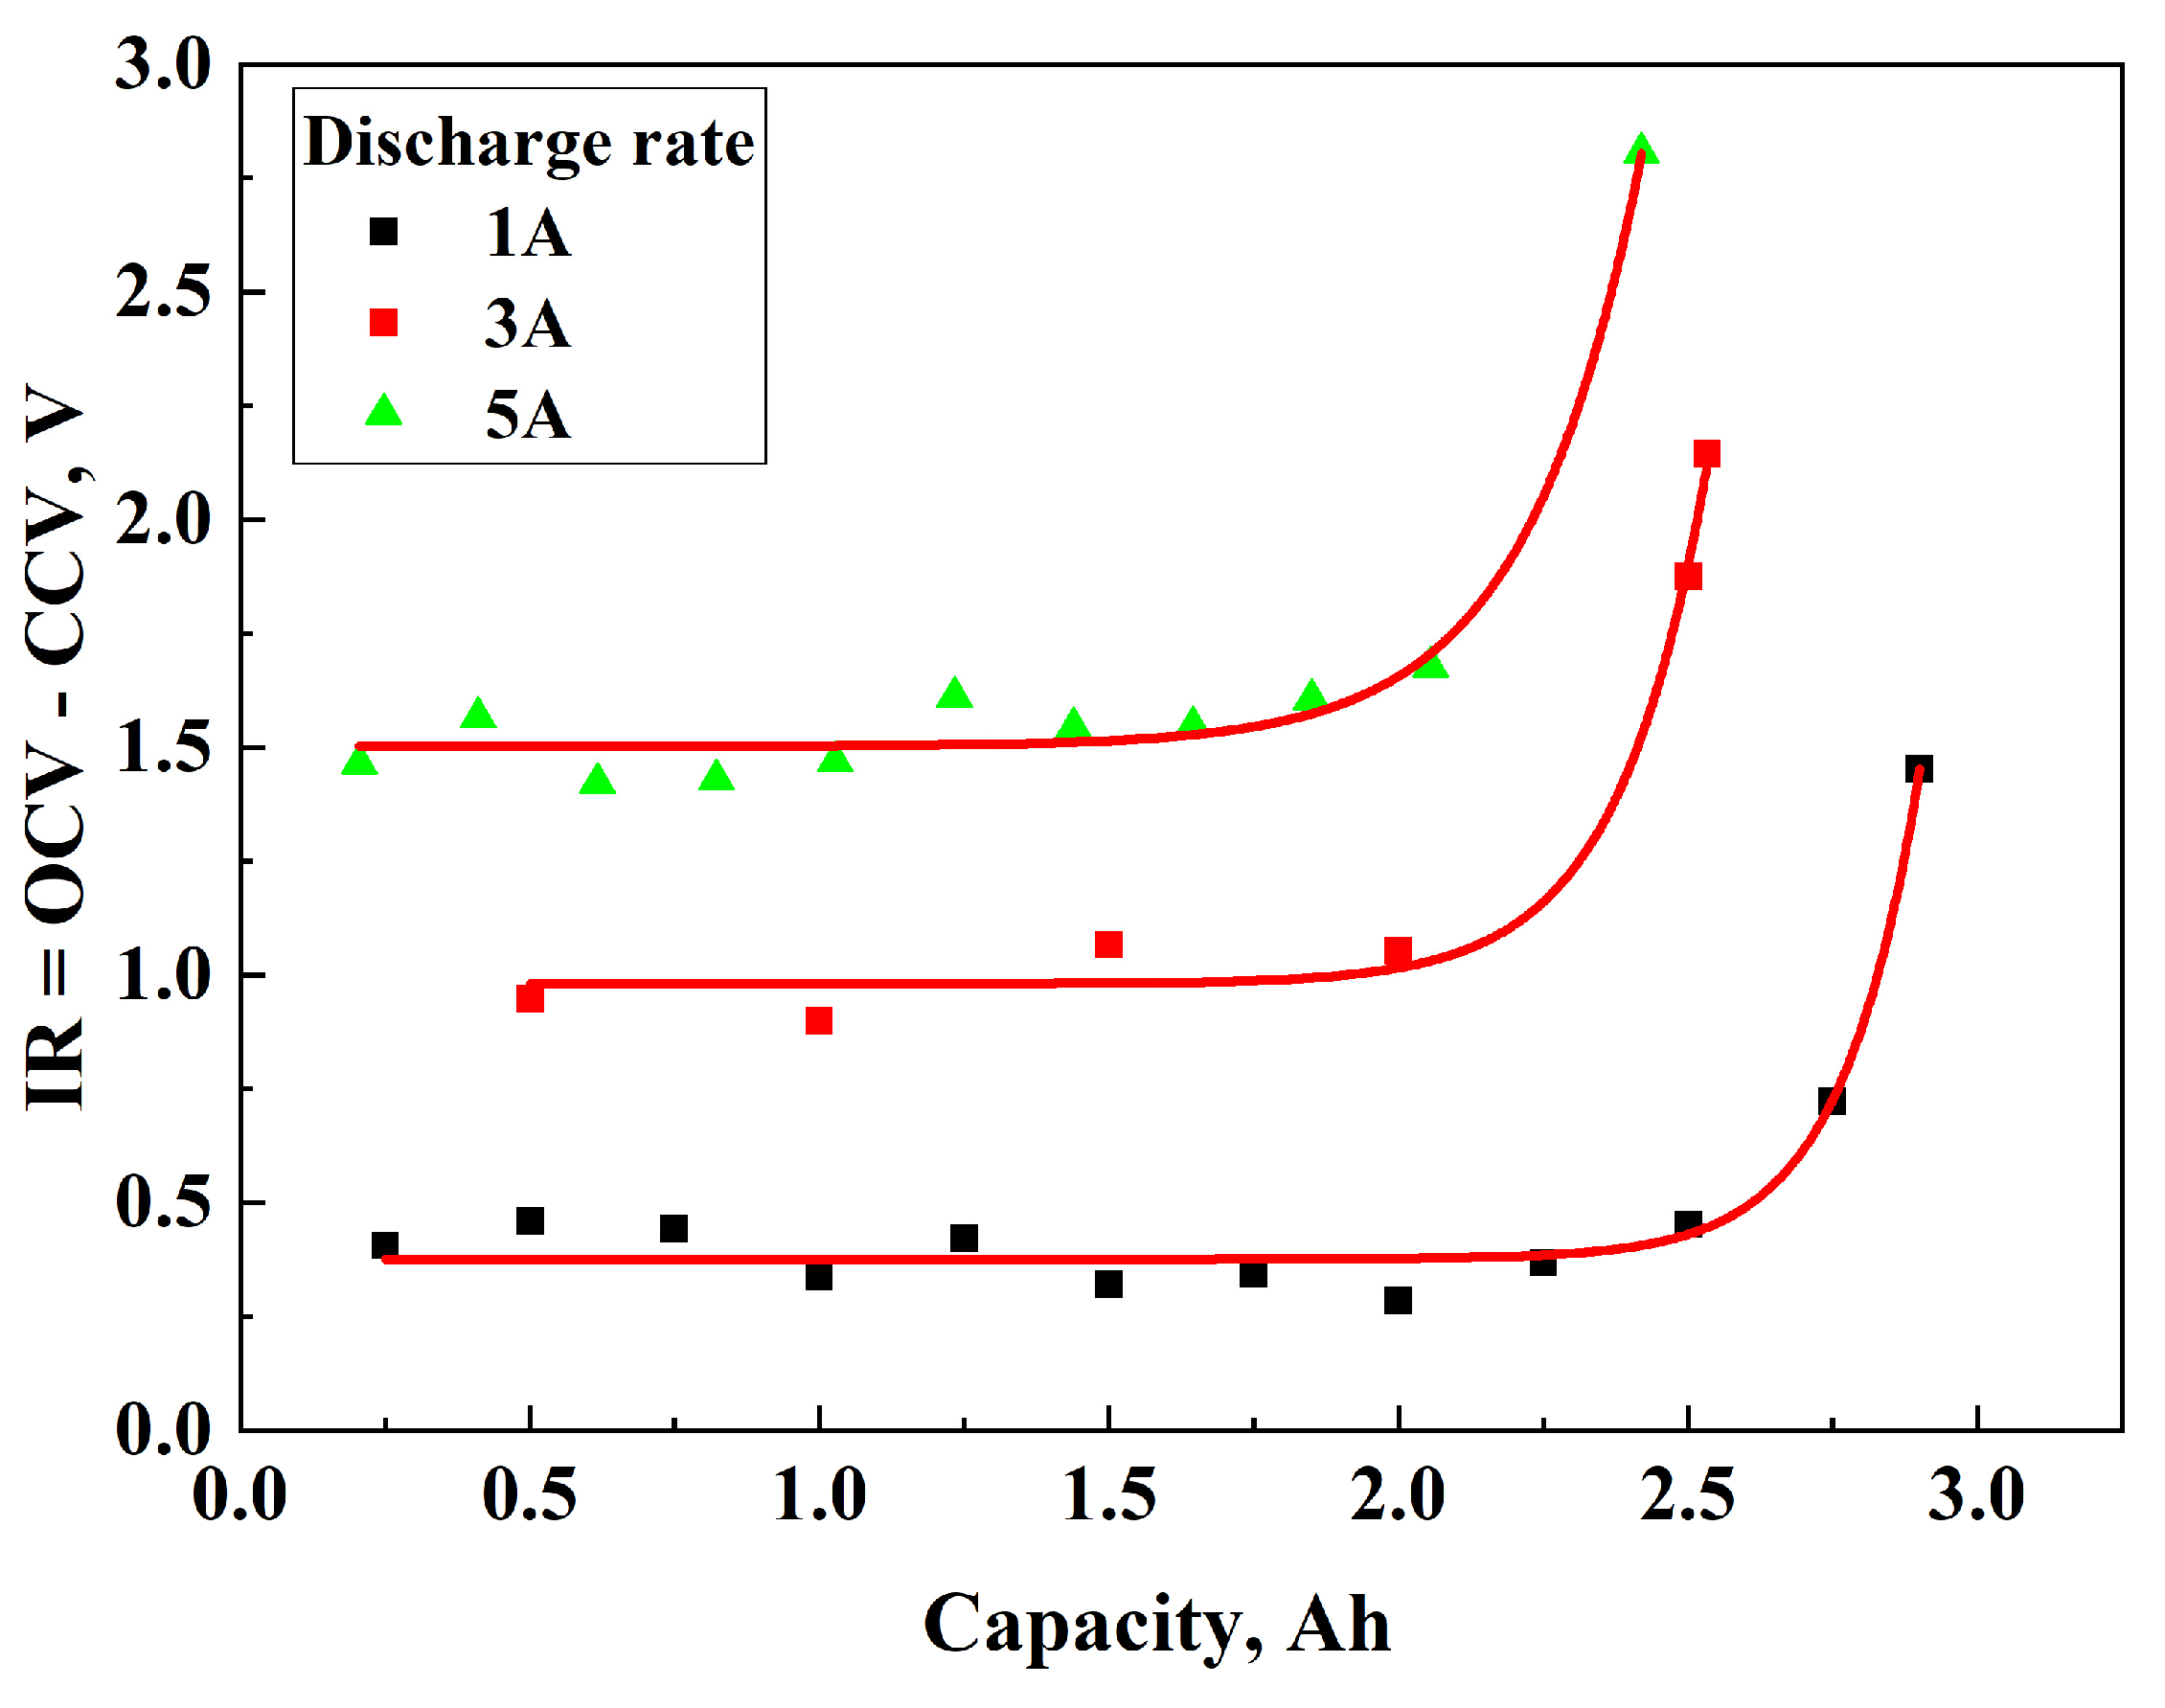
Figure 6 represents the IR ( = O C V d i s     C C V d i s ) evolution as a function of capacity for different discharge rates, demonstrating the current-dependent nature of voltage drop under load. Three discharge rates were examined—1A (black), 3A (red) and 5A (green)—each exhibiting a distinct voltage drop profile. In particular, at all discharge rates, IR remains low and stable during the initial and middle stages. However, as cells approach their full capacity, a pronounced increase in IR is observed.
In the discharging phase, the simulated voltage was defined as the sum of the open-circuit voltage and the voltage drop across the internal resistance, expressed as
V b a t , s i m = O C V d i s I R
In Equation (3), IR drop must be defined. To extract this parameter, the approach proposed in [22] was adopted, where the IR drop is computed as the difference between the C C V d i s and the O C V d i s :
I R = O C V d i s C C V d i s
This voltage difference was analyzed for various discharge currents. For each current, experimental values were fitted, revealing that the IR drop can be modeled by three parameters: y 0 ,   A   and   w , so (3) should be
V b a t , s i m , d i s = O C V d i s y 0 + A × e C w
The fitted coefficients for each current level used in Equation (5) are summarized in Table 3.
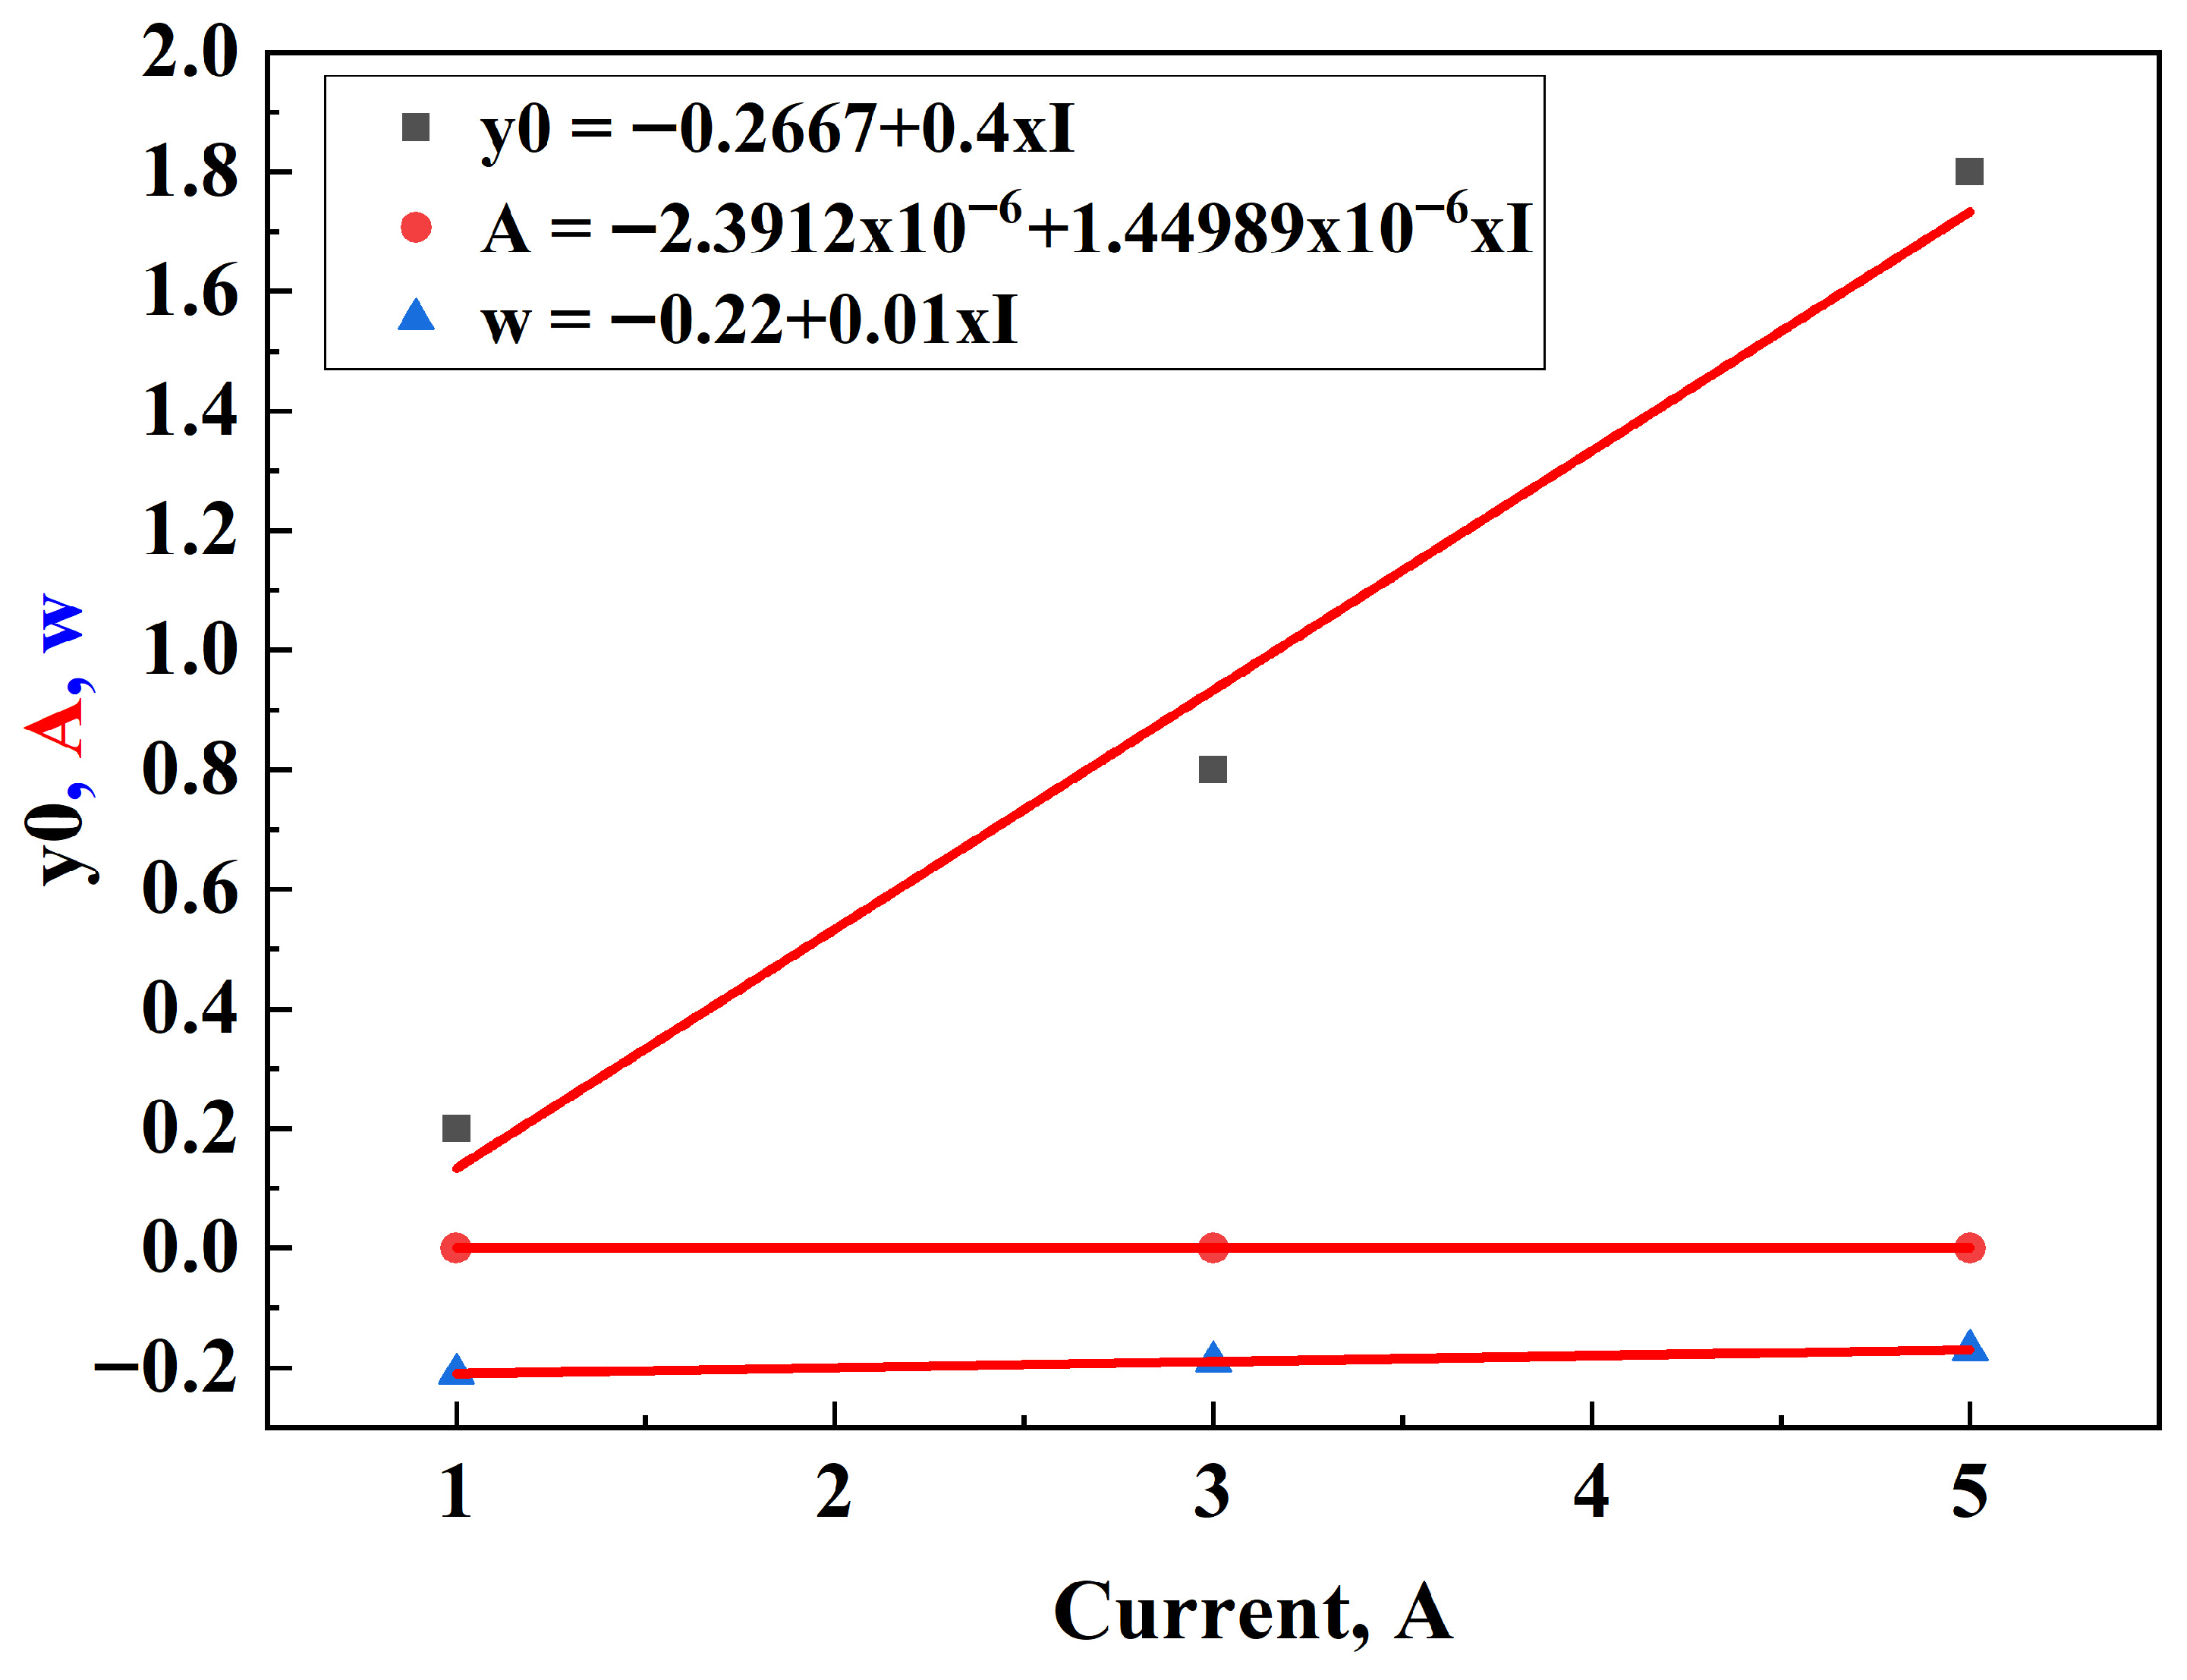
Figure 7 illustrates the linear relationship between the coefficients mentioned above, y 0 ,   A ,   w , and the discharge current (I) as extracted from (5). It becomes clear from the diagram that there is a strong linear increase with current during discharging, following the equation
y o = 0.2667 + 0.4 × I
At low current levels, such as 1A, y 0 remains close to zero. However, as the current increases, y 0 rises substantially, reaching values around 1.8 V at 5A. In contrast, the parameter A exhibits a near constant behavior, described by the following equation:
A   =   2.3912 × 10 6   +   1.44989   ×   10 6 × I
Similarly, the parameter w shows a relatively weak linear dependence on current defined by the following equation:
w = 0.22 + 0.01 × I

3.2. Determination of OCVch and IR During Charging

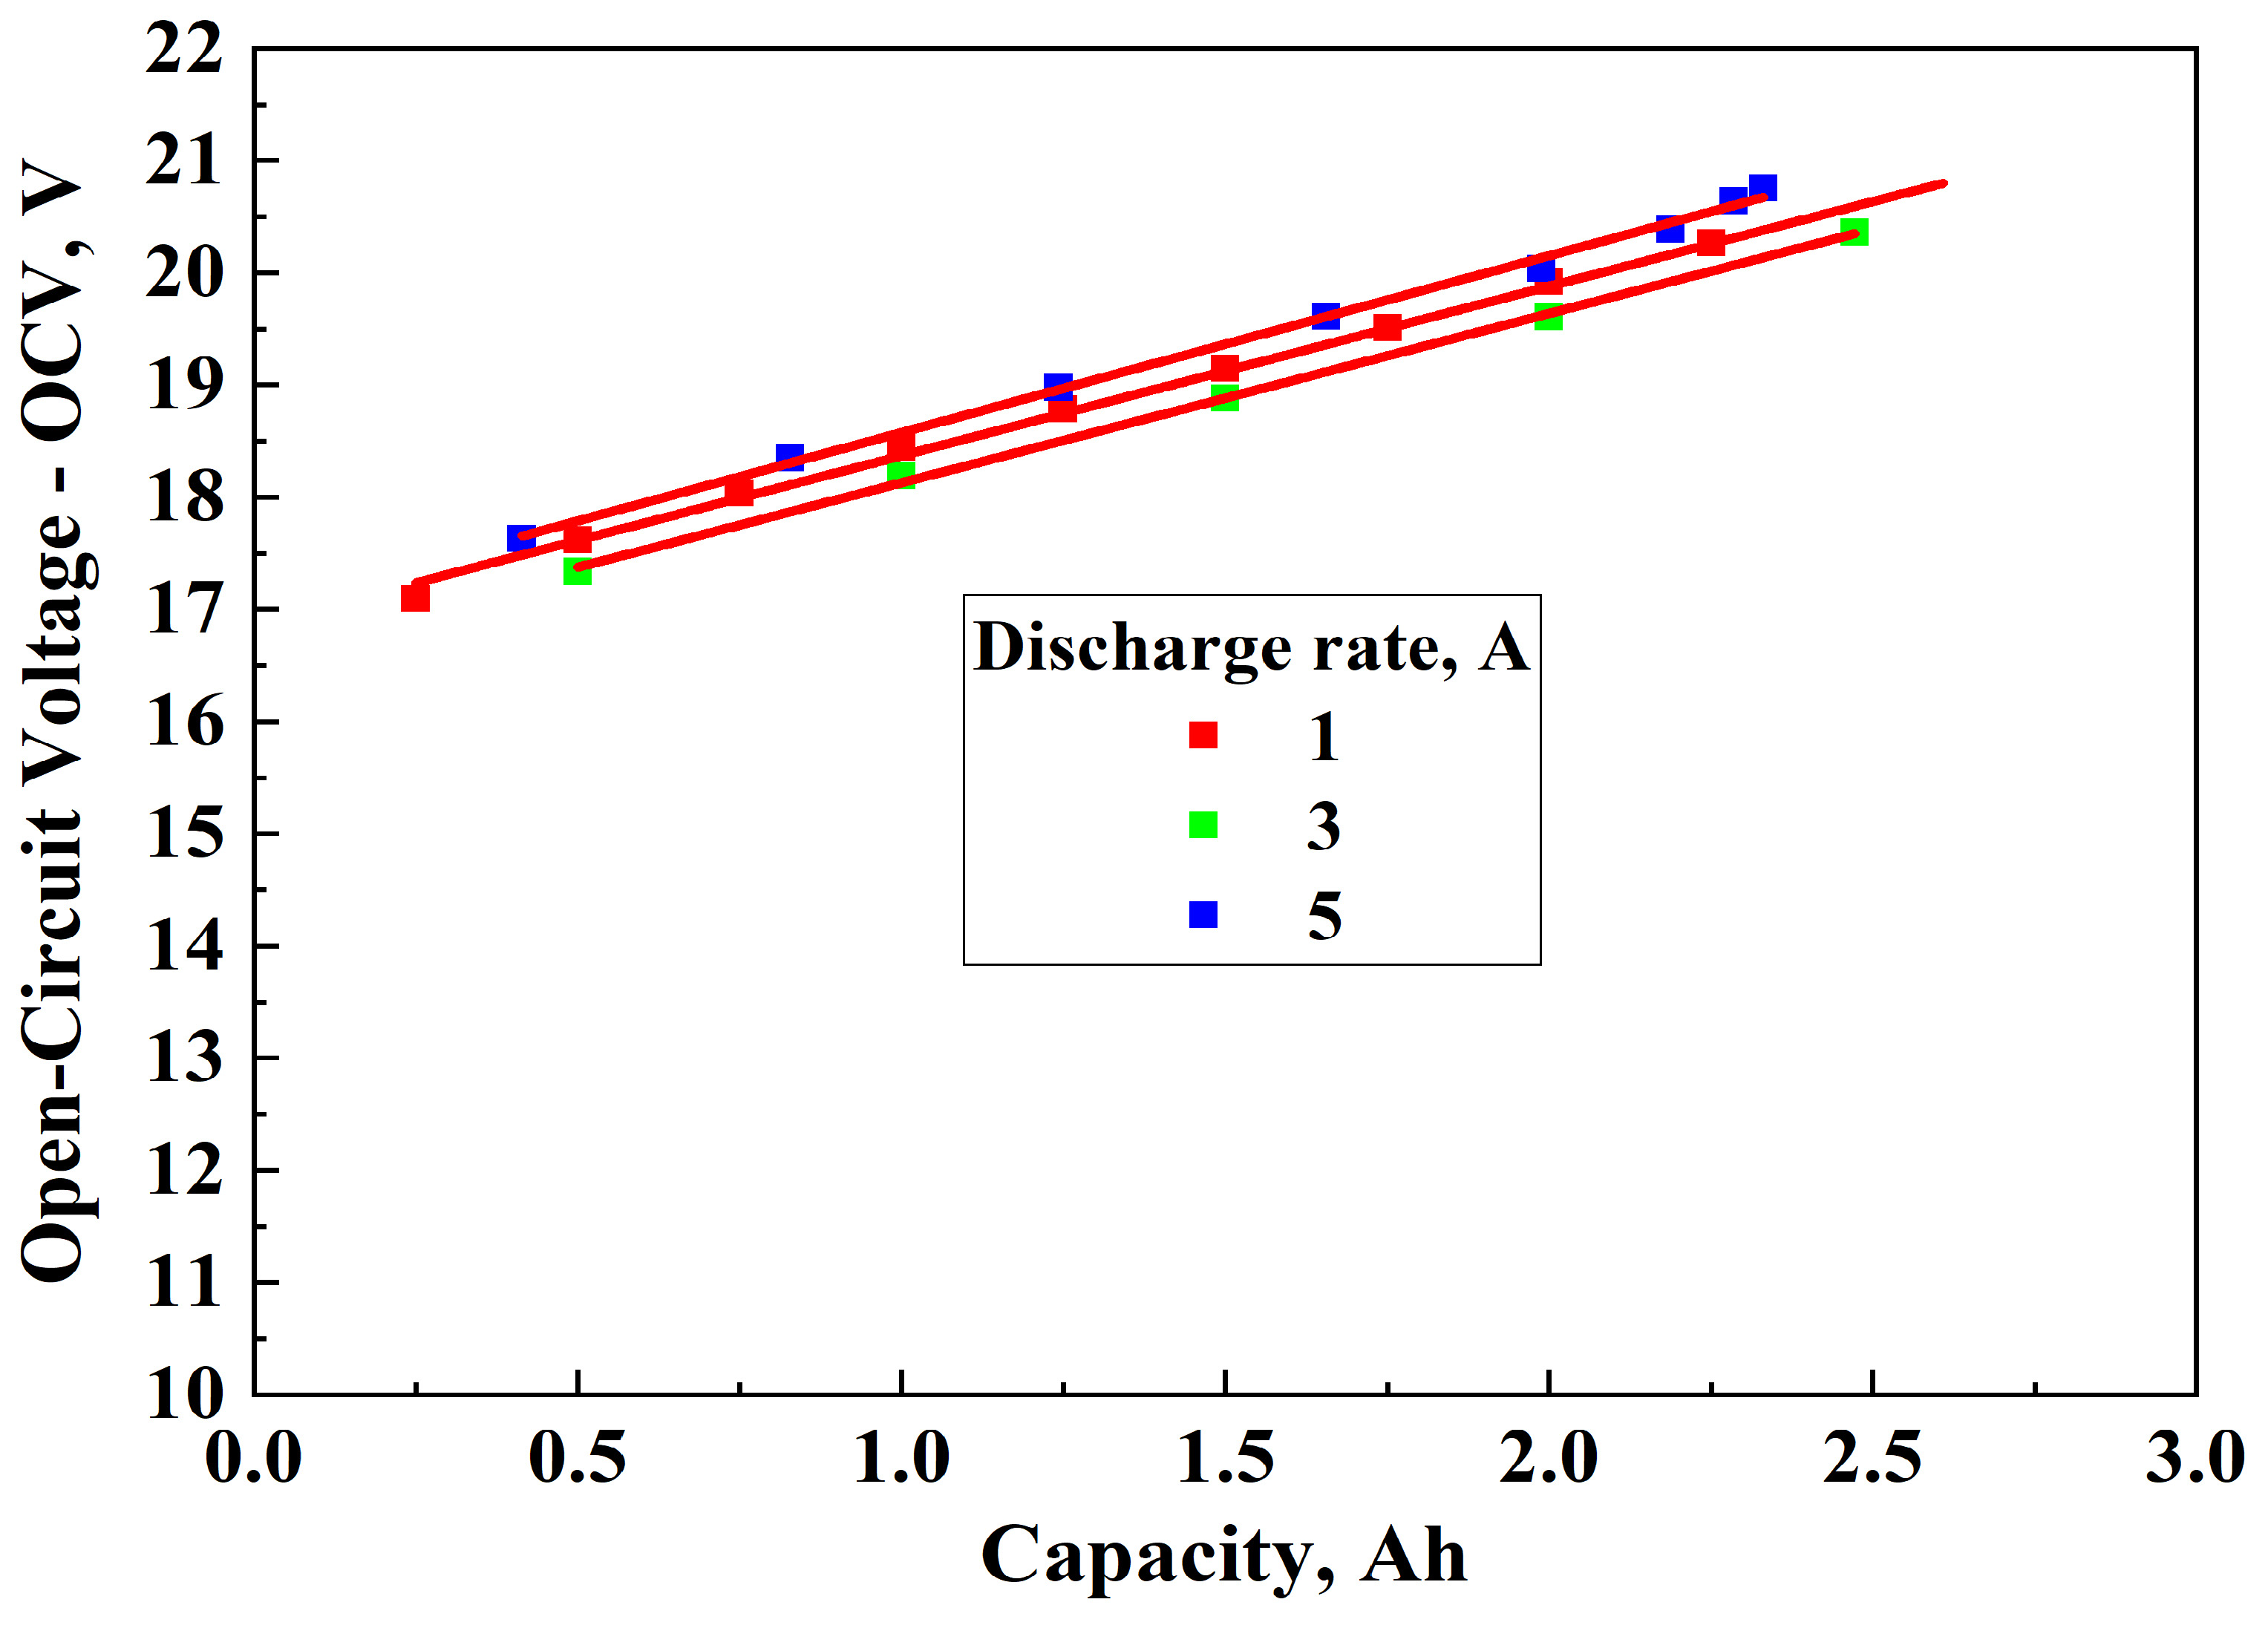
A similar methodology was applied to characterize the charging phase. The OCVch behavior during charging was experimentally determined for three charging currents, 1A, 3A and 5A. As shown in Figure 8, the relationship between O C V c h and charged capacity is effectively linear across all current levels. Each dataset was modeled to a linear equation of the form
O C V c h = a + b   ×   C
where C is the charged capacity (Ah). The coefficients a and b are remarkably consistent across different currents, as shown in Table 4. Given the negligible variation, an average equation was derived for use in the simulation, ensuring both accuracy and computational efficiency.
Equation (9) was incorporated directly into the charging model to dynamically compute the voltage rise based on the applied charging current. Combining O C V c h and IR components, the final equation for the simulated voltage is
V c h a r g e = a + b × C + ( 0.22985 + 0.19837 × I )
where I represents the applied charging current (A).
Given the minimal variation, an average equation was derived for use in the simulation, ensuring both accuracy and computational efficiency.
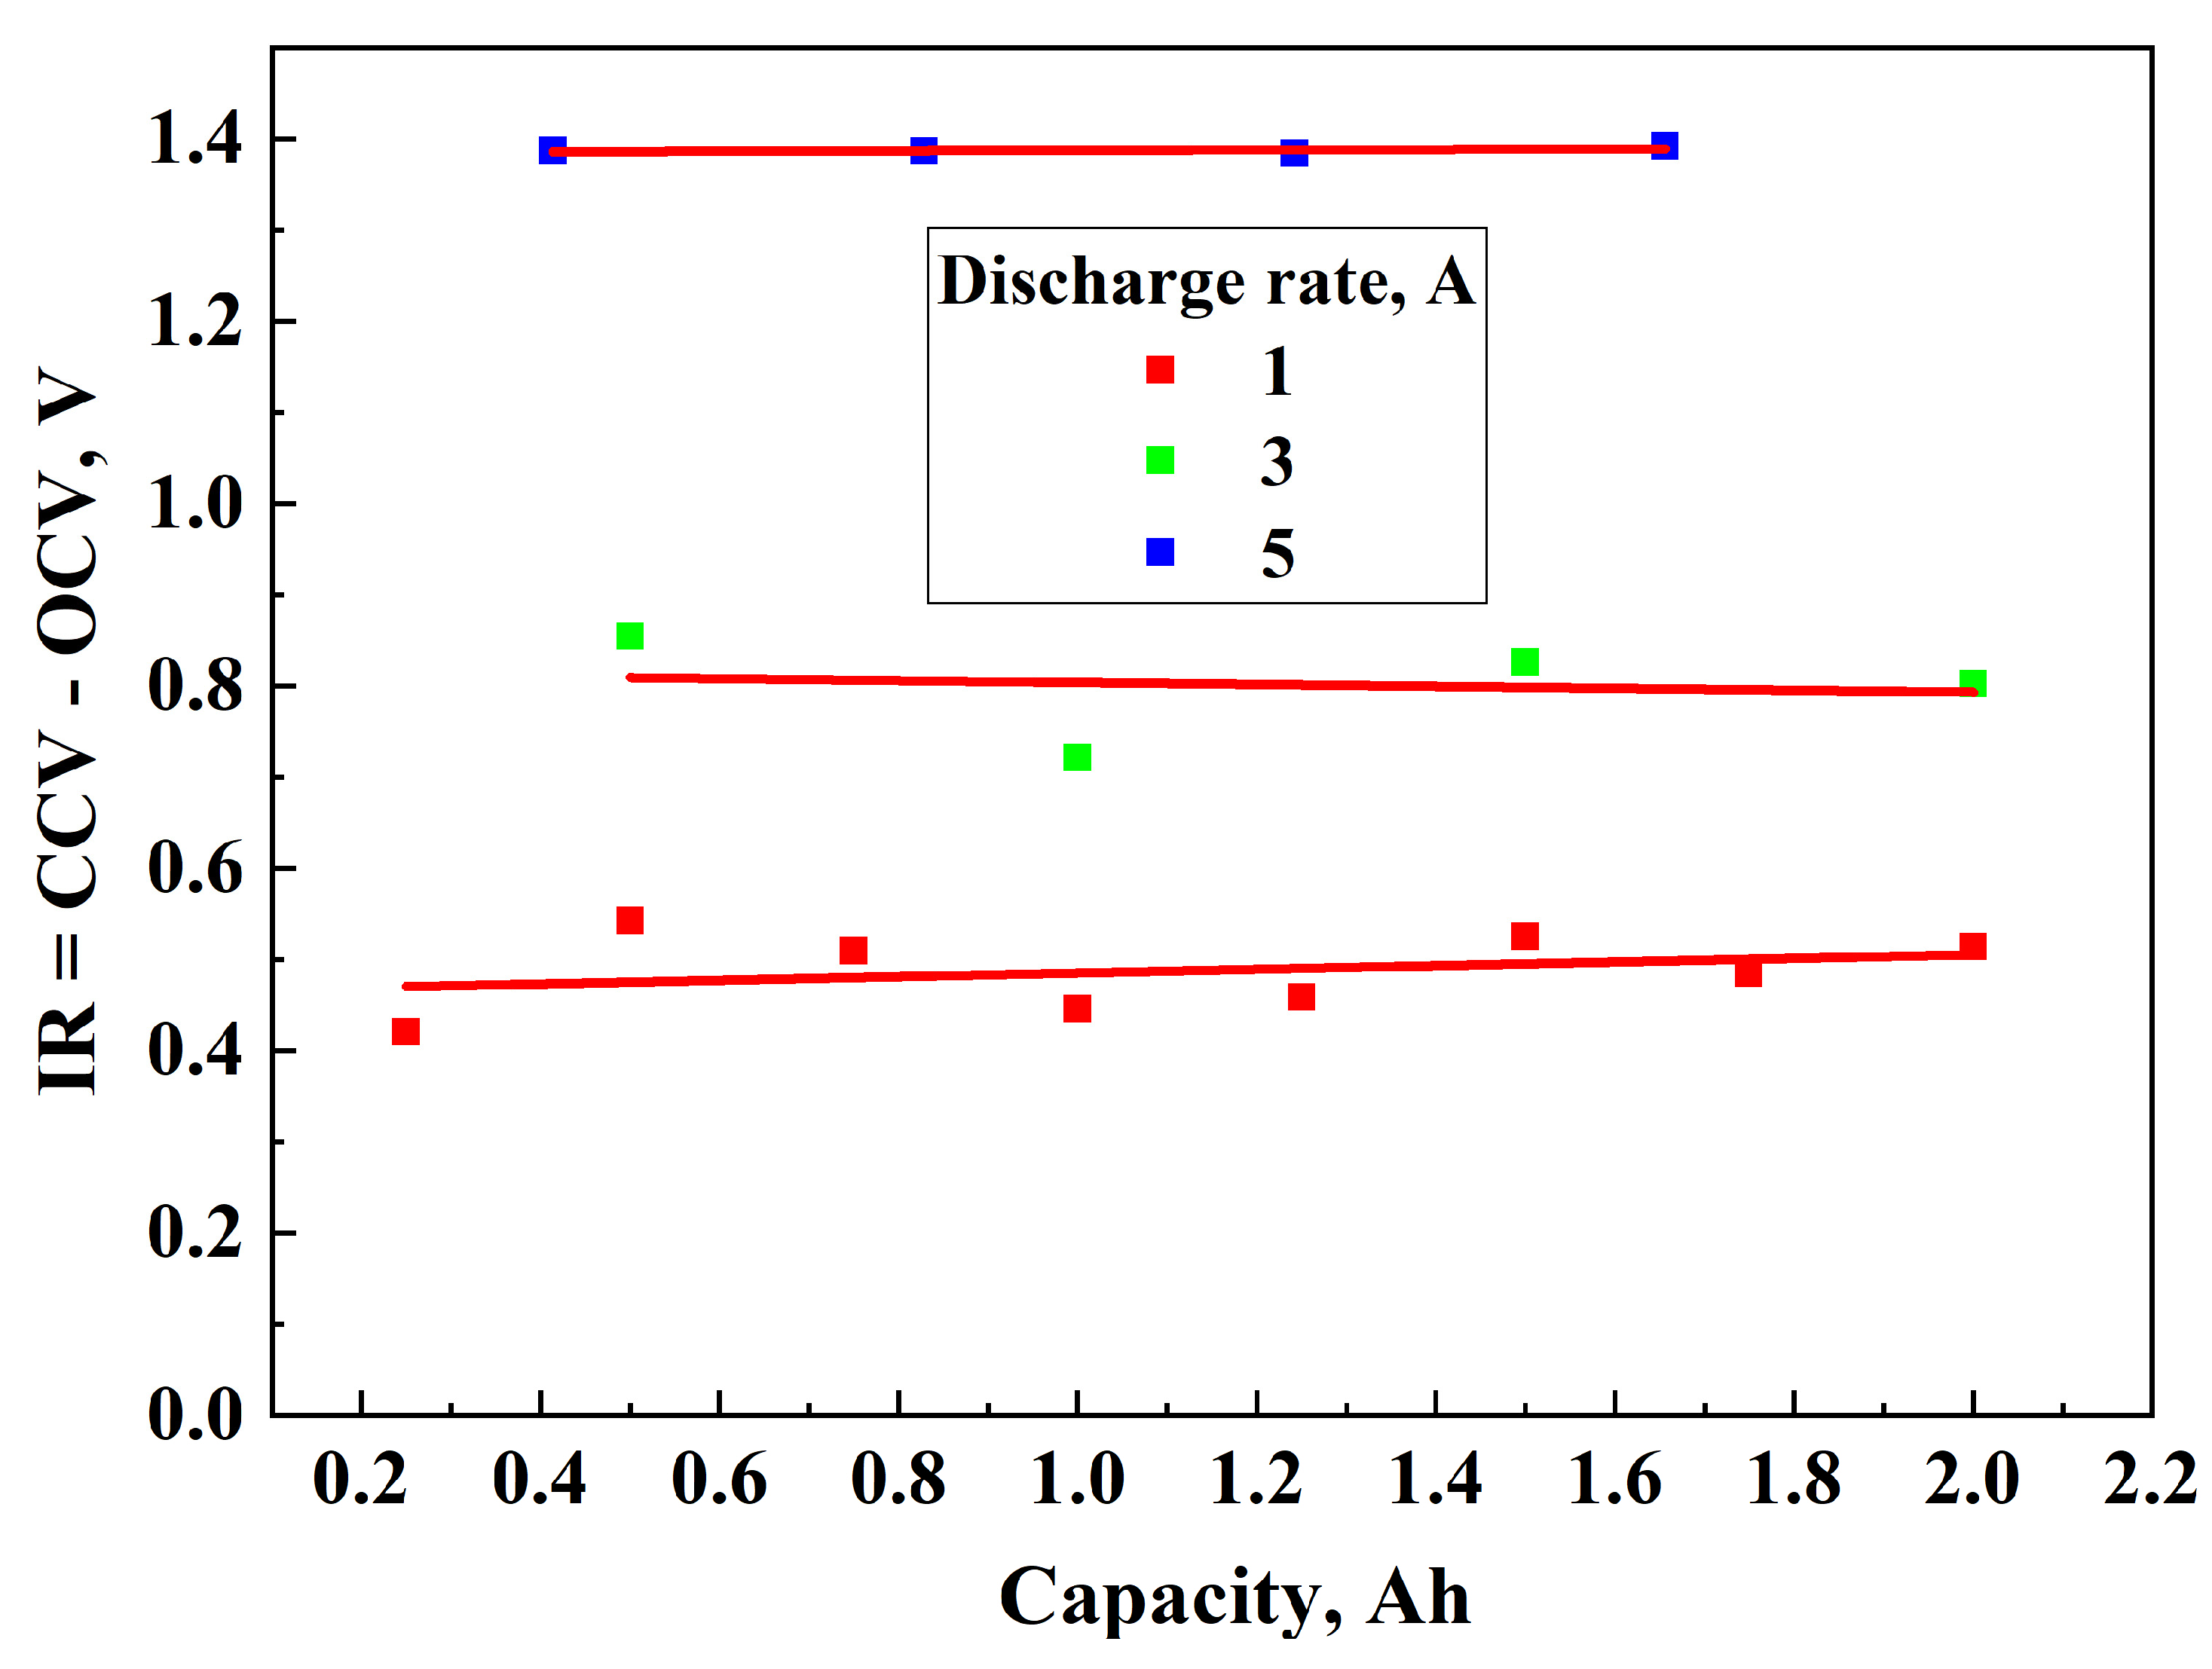
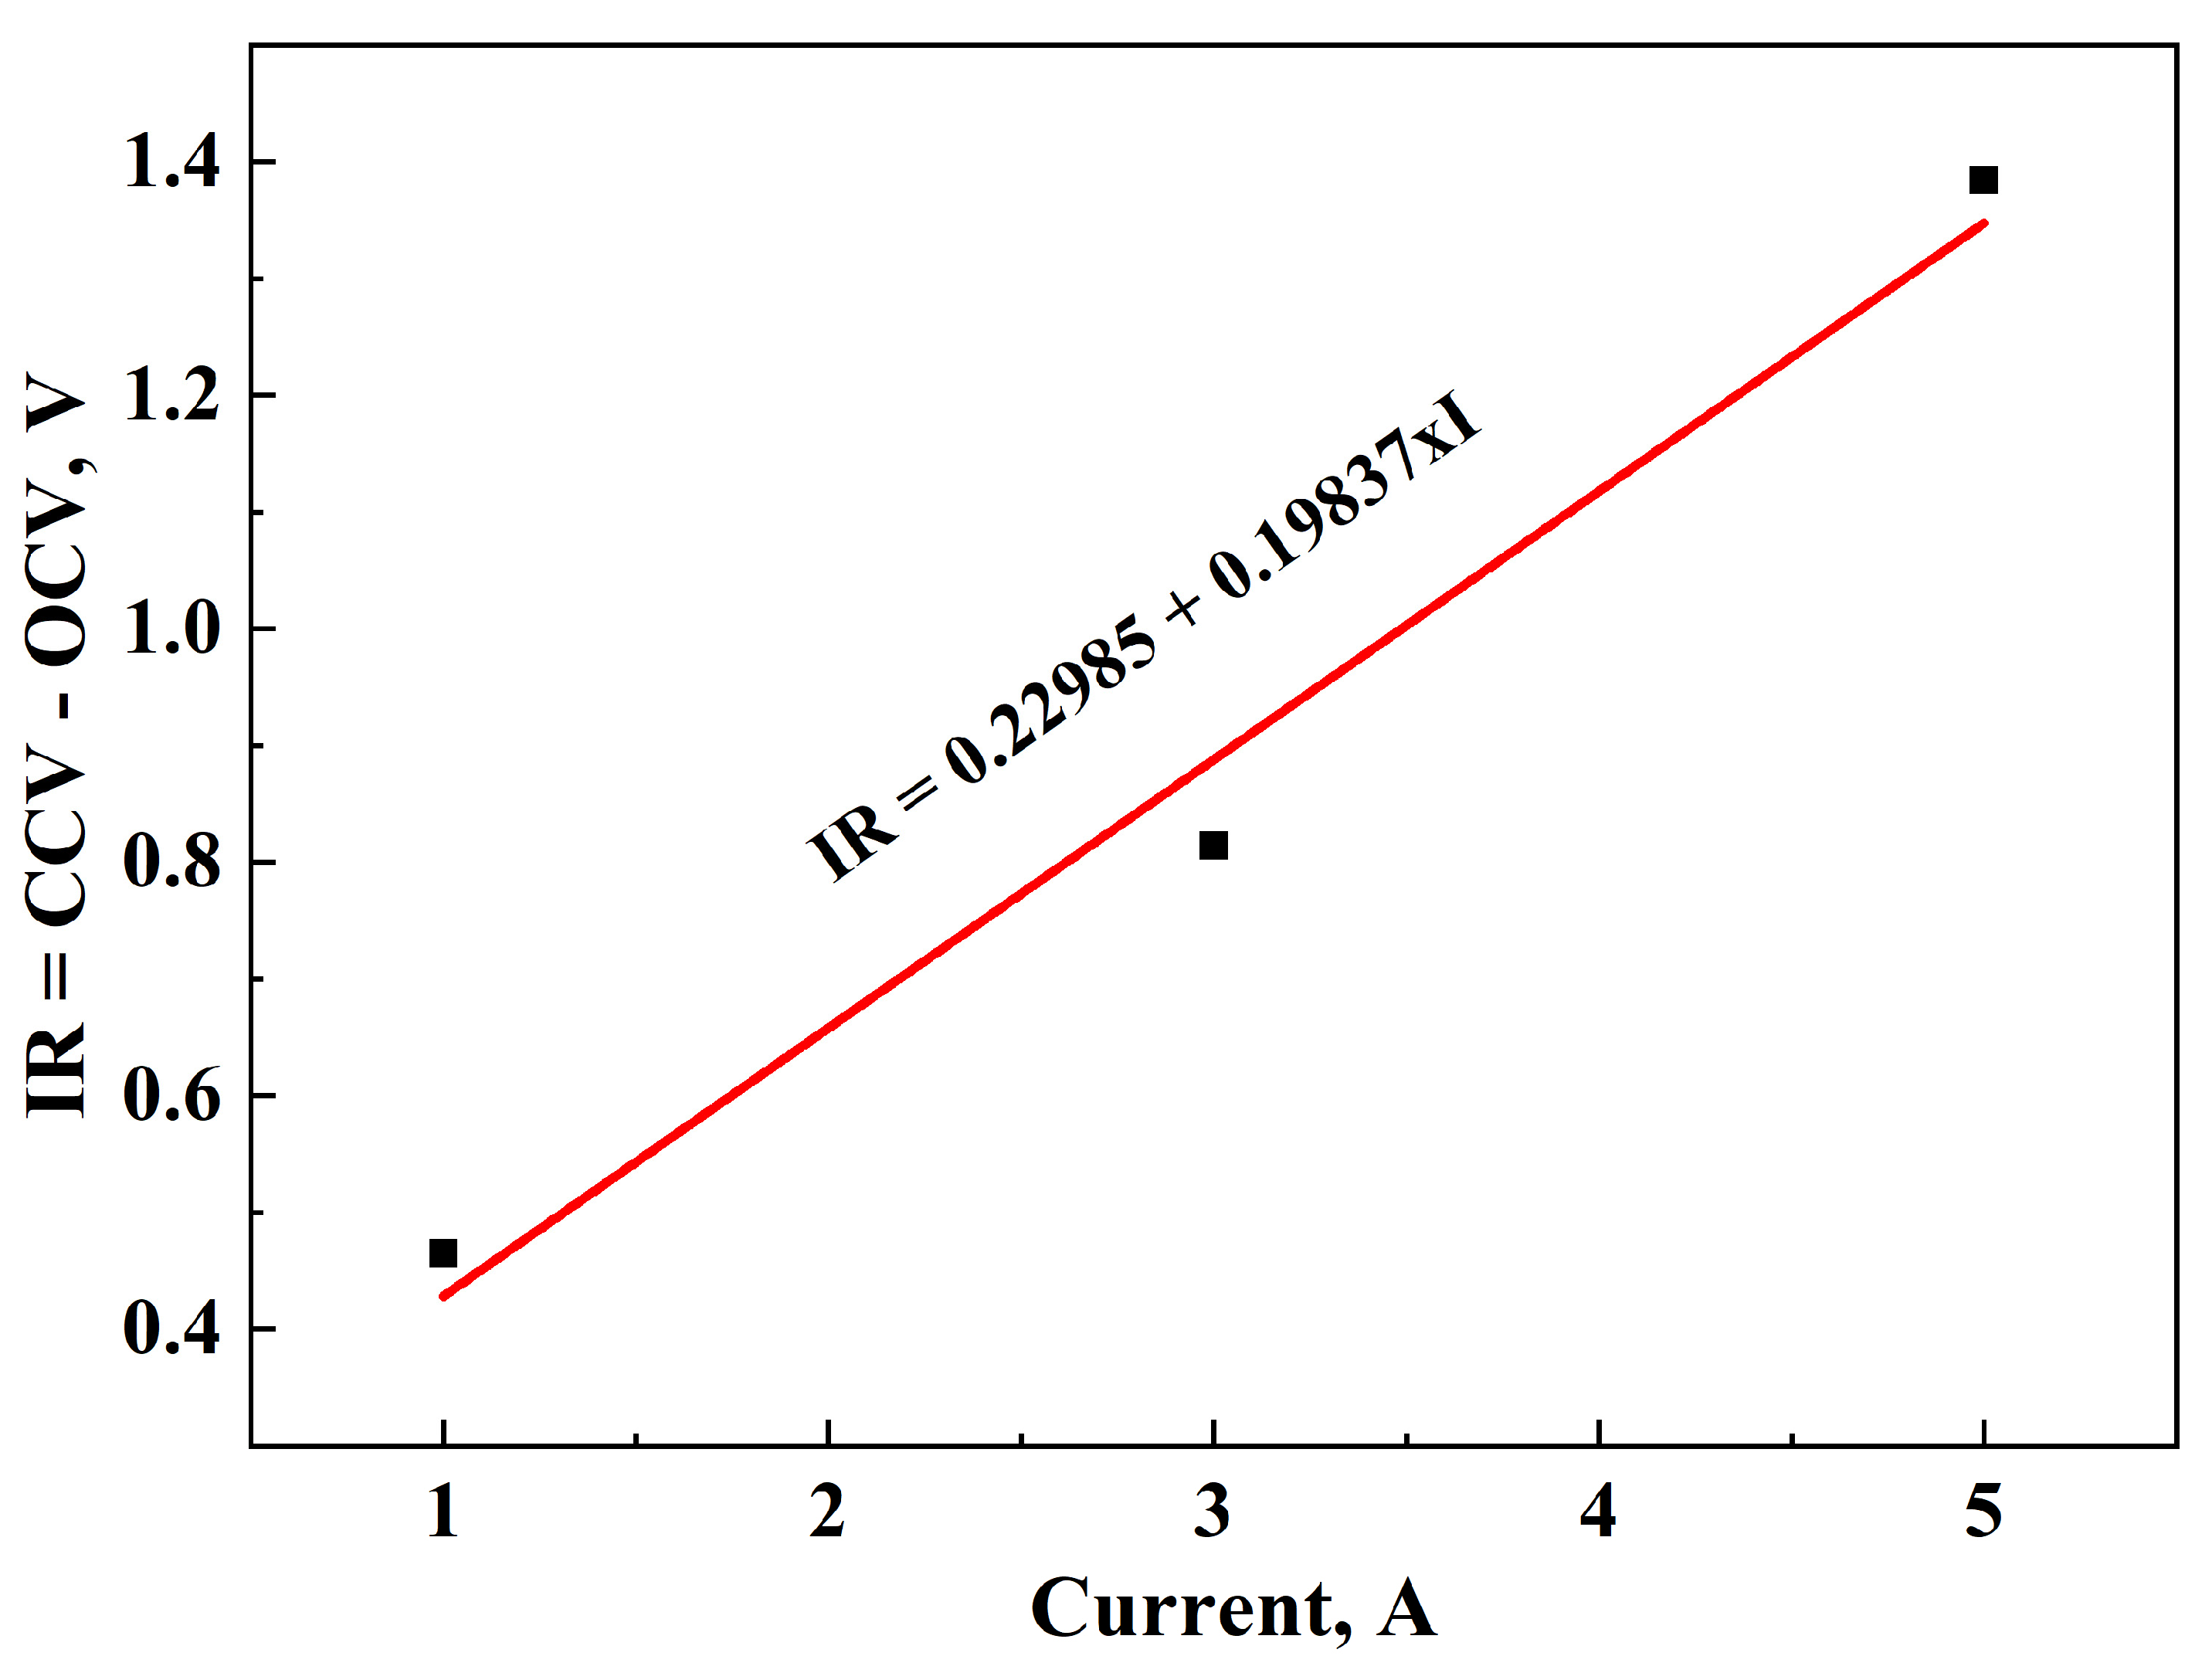
The IR (Figure 9), for the charging experiments, was calculated as the difference between the C C V c h and the O C V c h . Analysis of the experimental data showed that IR remains practically constant with respect to charged capacity. The average IR values were as follows:
  • 0.46504 V at 1A;
  • 0.81425 V at 3A;
  • 1.38445 V at 5A.
Figure 9. IR vs. charged capacity.
Batteries 11 00314 g009
Plotting IR (Figure 10) versus current revealed a clear linear relationship, enabling the derivation of the following equation:
I R   =   0.22985   +   0.19837 × I
Given these values, Equation (10) becomes
V b a t , s i m = 16.82646 + 1.5313 × C + ( 0.22985 + 0.19837 × I )
This formulation dynamically adapts the voltage based on both the current state of charge and the applied current.

3.3. Model Validation

3.3.1. Discharging

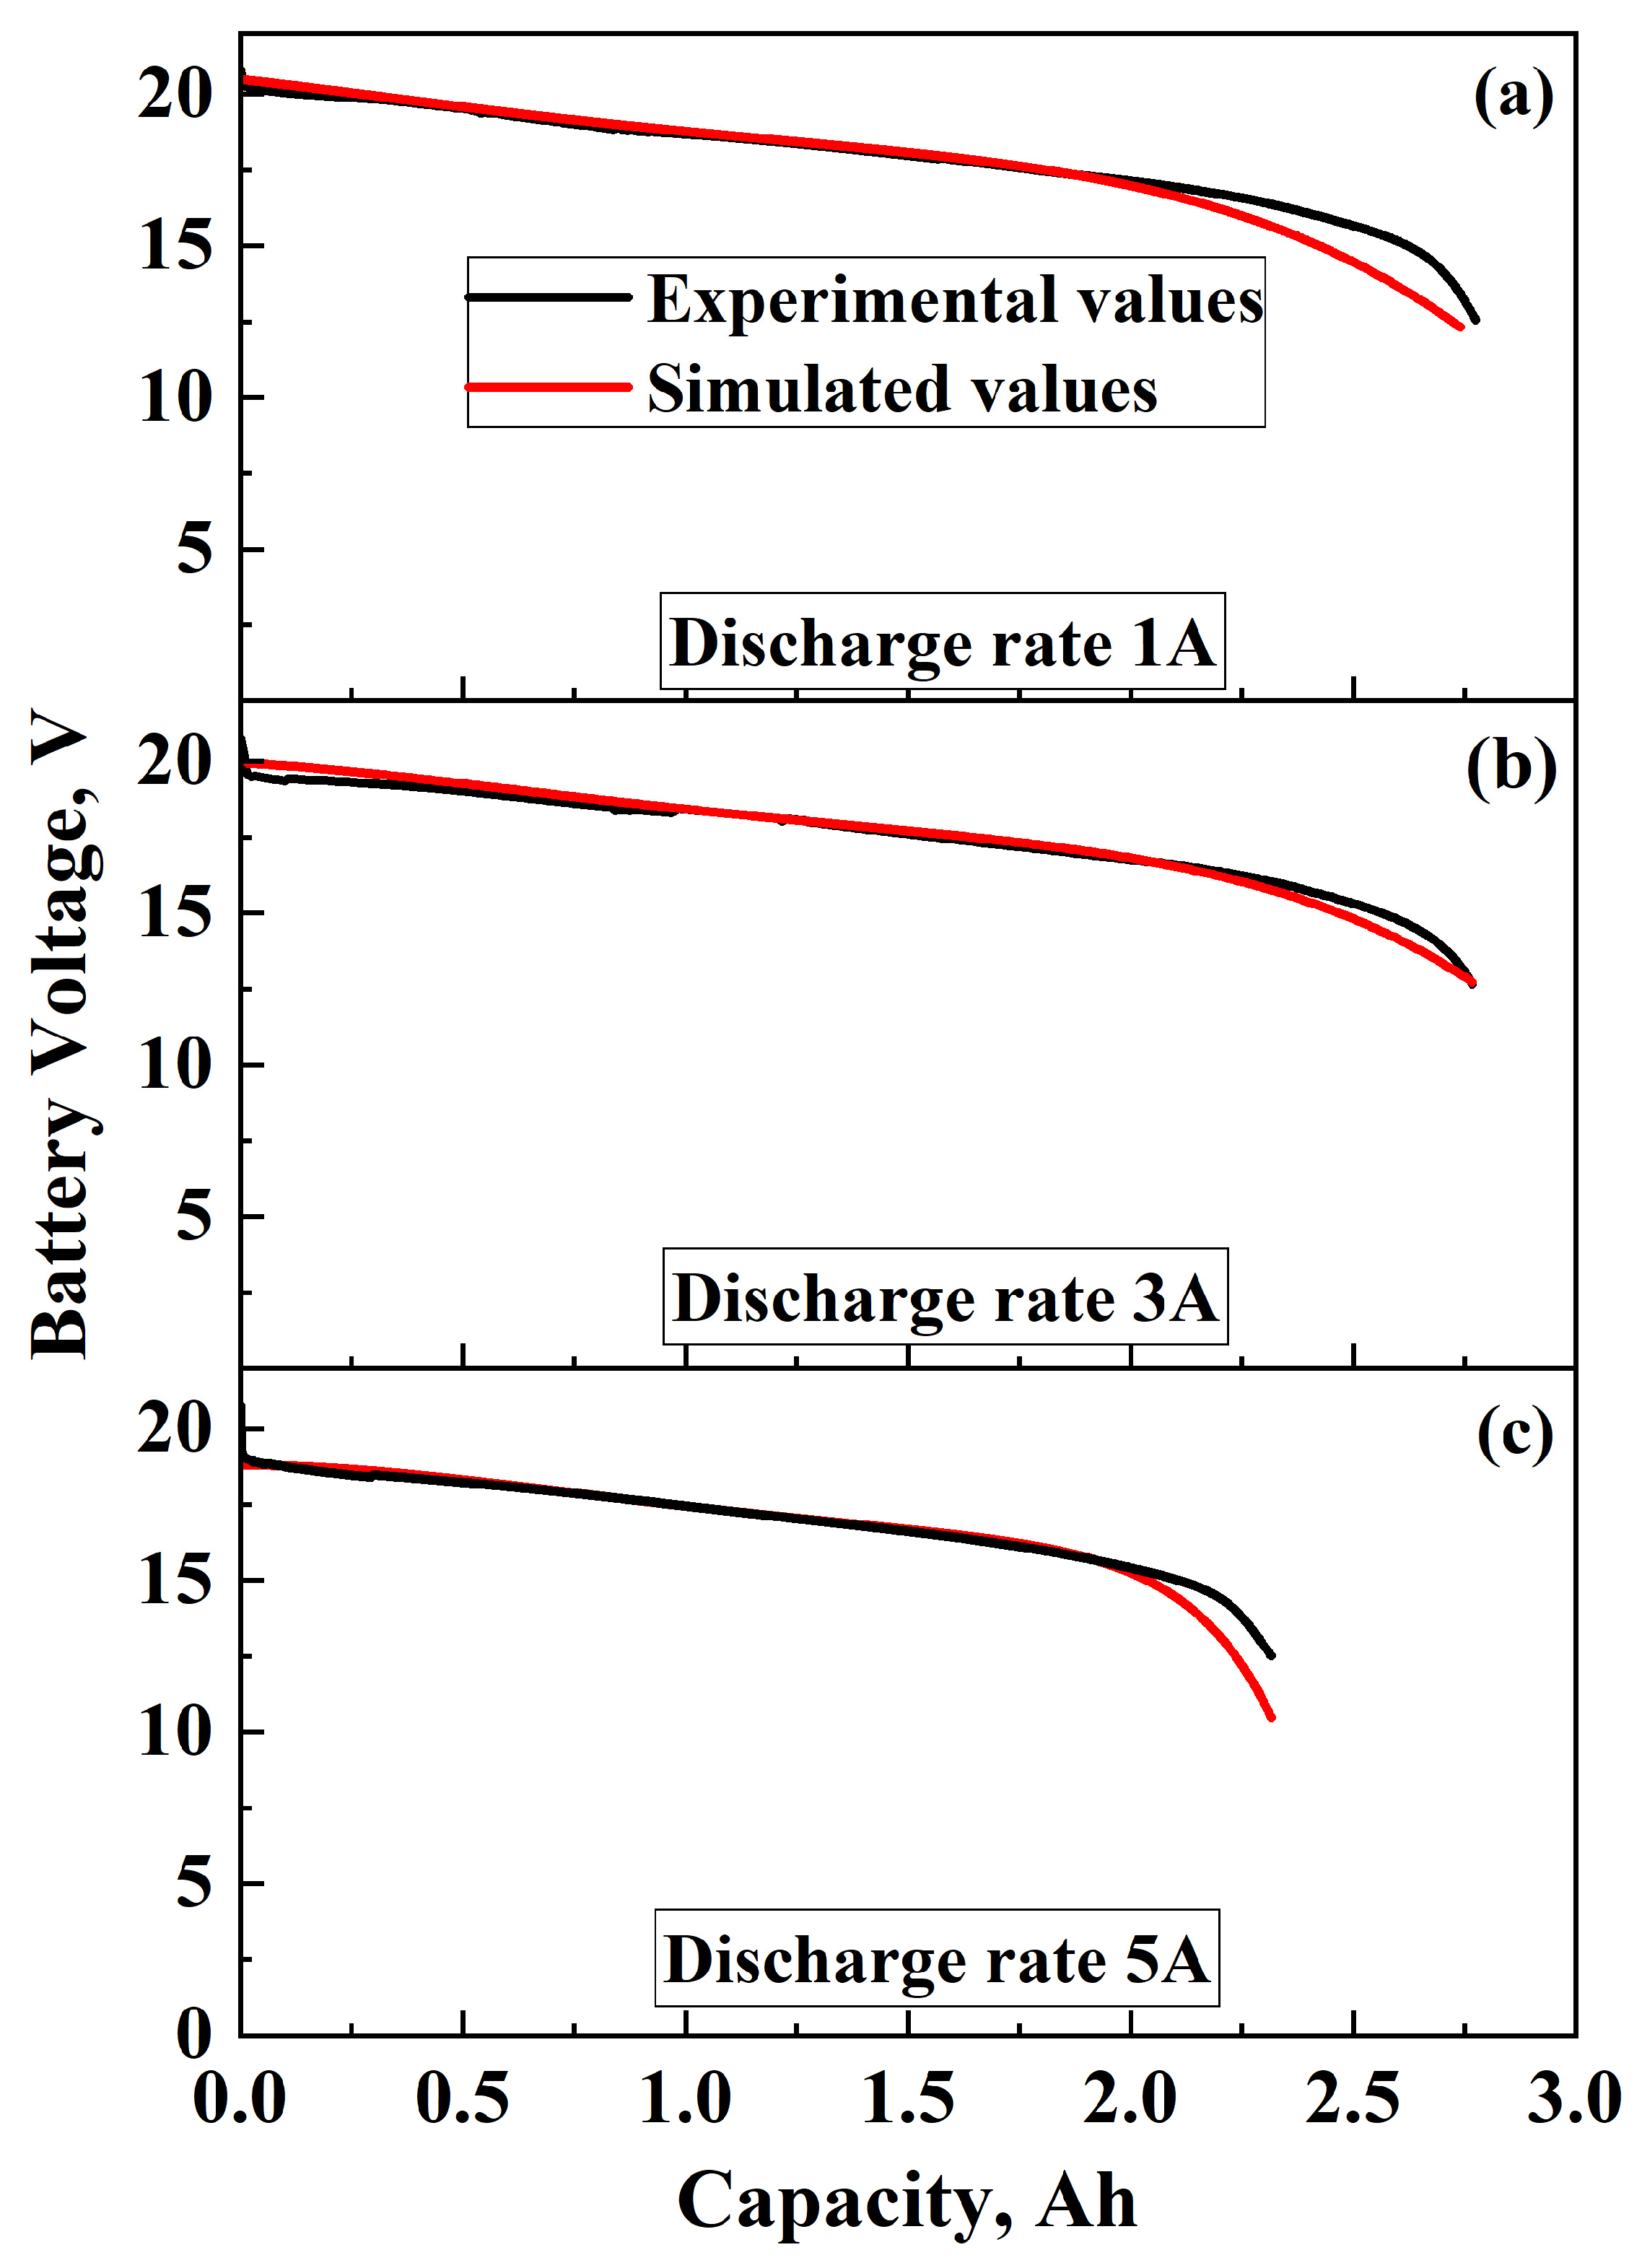
Figure 11 presents a comparative analysis of experimental and simulated discharge curves at three distinct constant current discharge rates: 1A, 3A and 5A. Each plot displays the battery voltage (y-axis) as a function of capacity (x-axis), with experimental data shown in black and the corresponding simulated values (emerged from the Equation (5)) in red.
In Figure 11a, the battery is discharged at a low current of 1A. The voltage profile exhibits a gradual decline as the capacity increases, maintaining a relatively high voltage for the majority of the discharge process. The experimental and simulated curves show excellent agreement throughout most of the capacity range, with only minor deviations observed near the end of discharge. This close correspondence indicates that the simulation model accurately captured the behavior of the cells. Figure 11b illustrates the discharge behavior at 3A. Again, the agreement throughout most of the discharge process suggests that the model parameters have been effectively tuned to capture the dynamic response at different currents. Finally, Figure 11c shows the results of the highest tested discharge rate of 5A. The simulation remains in good agreement with the experimental data, though small differences appear at the very end of discharge. Nevertheless, the overall correspondence validates that the simulation methodology, including the parameterization of the OCV and IR as functions of current, is effective in describing the real-world performance of lithium-ion batteries.

3.3.2. Charging

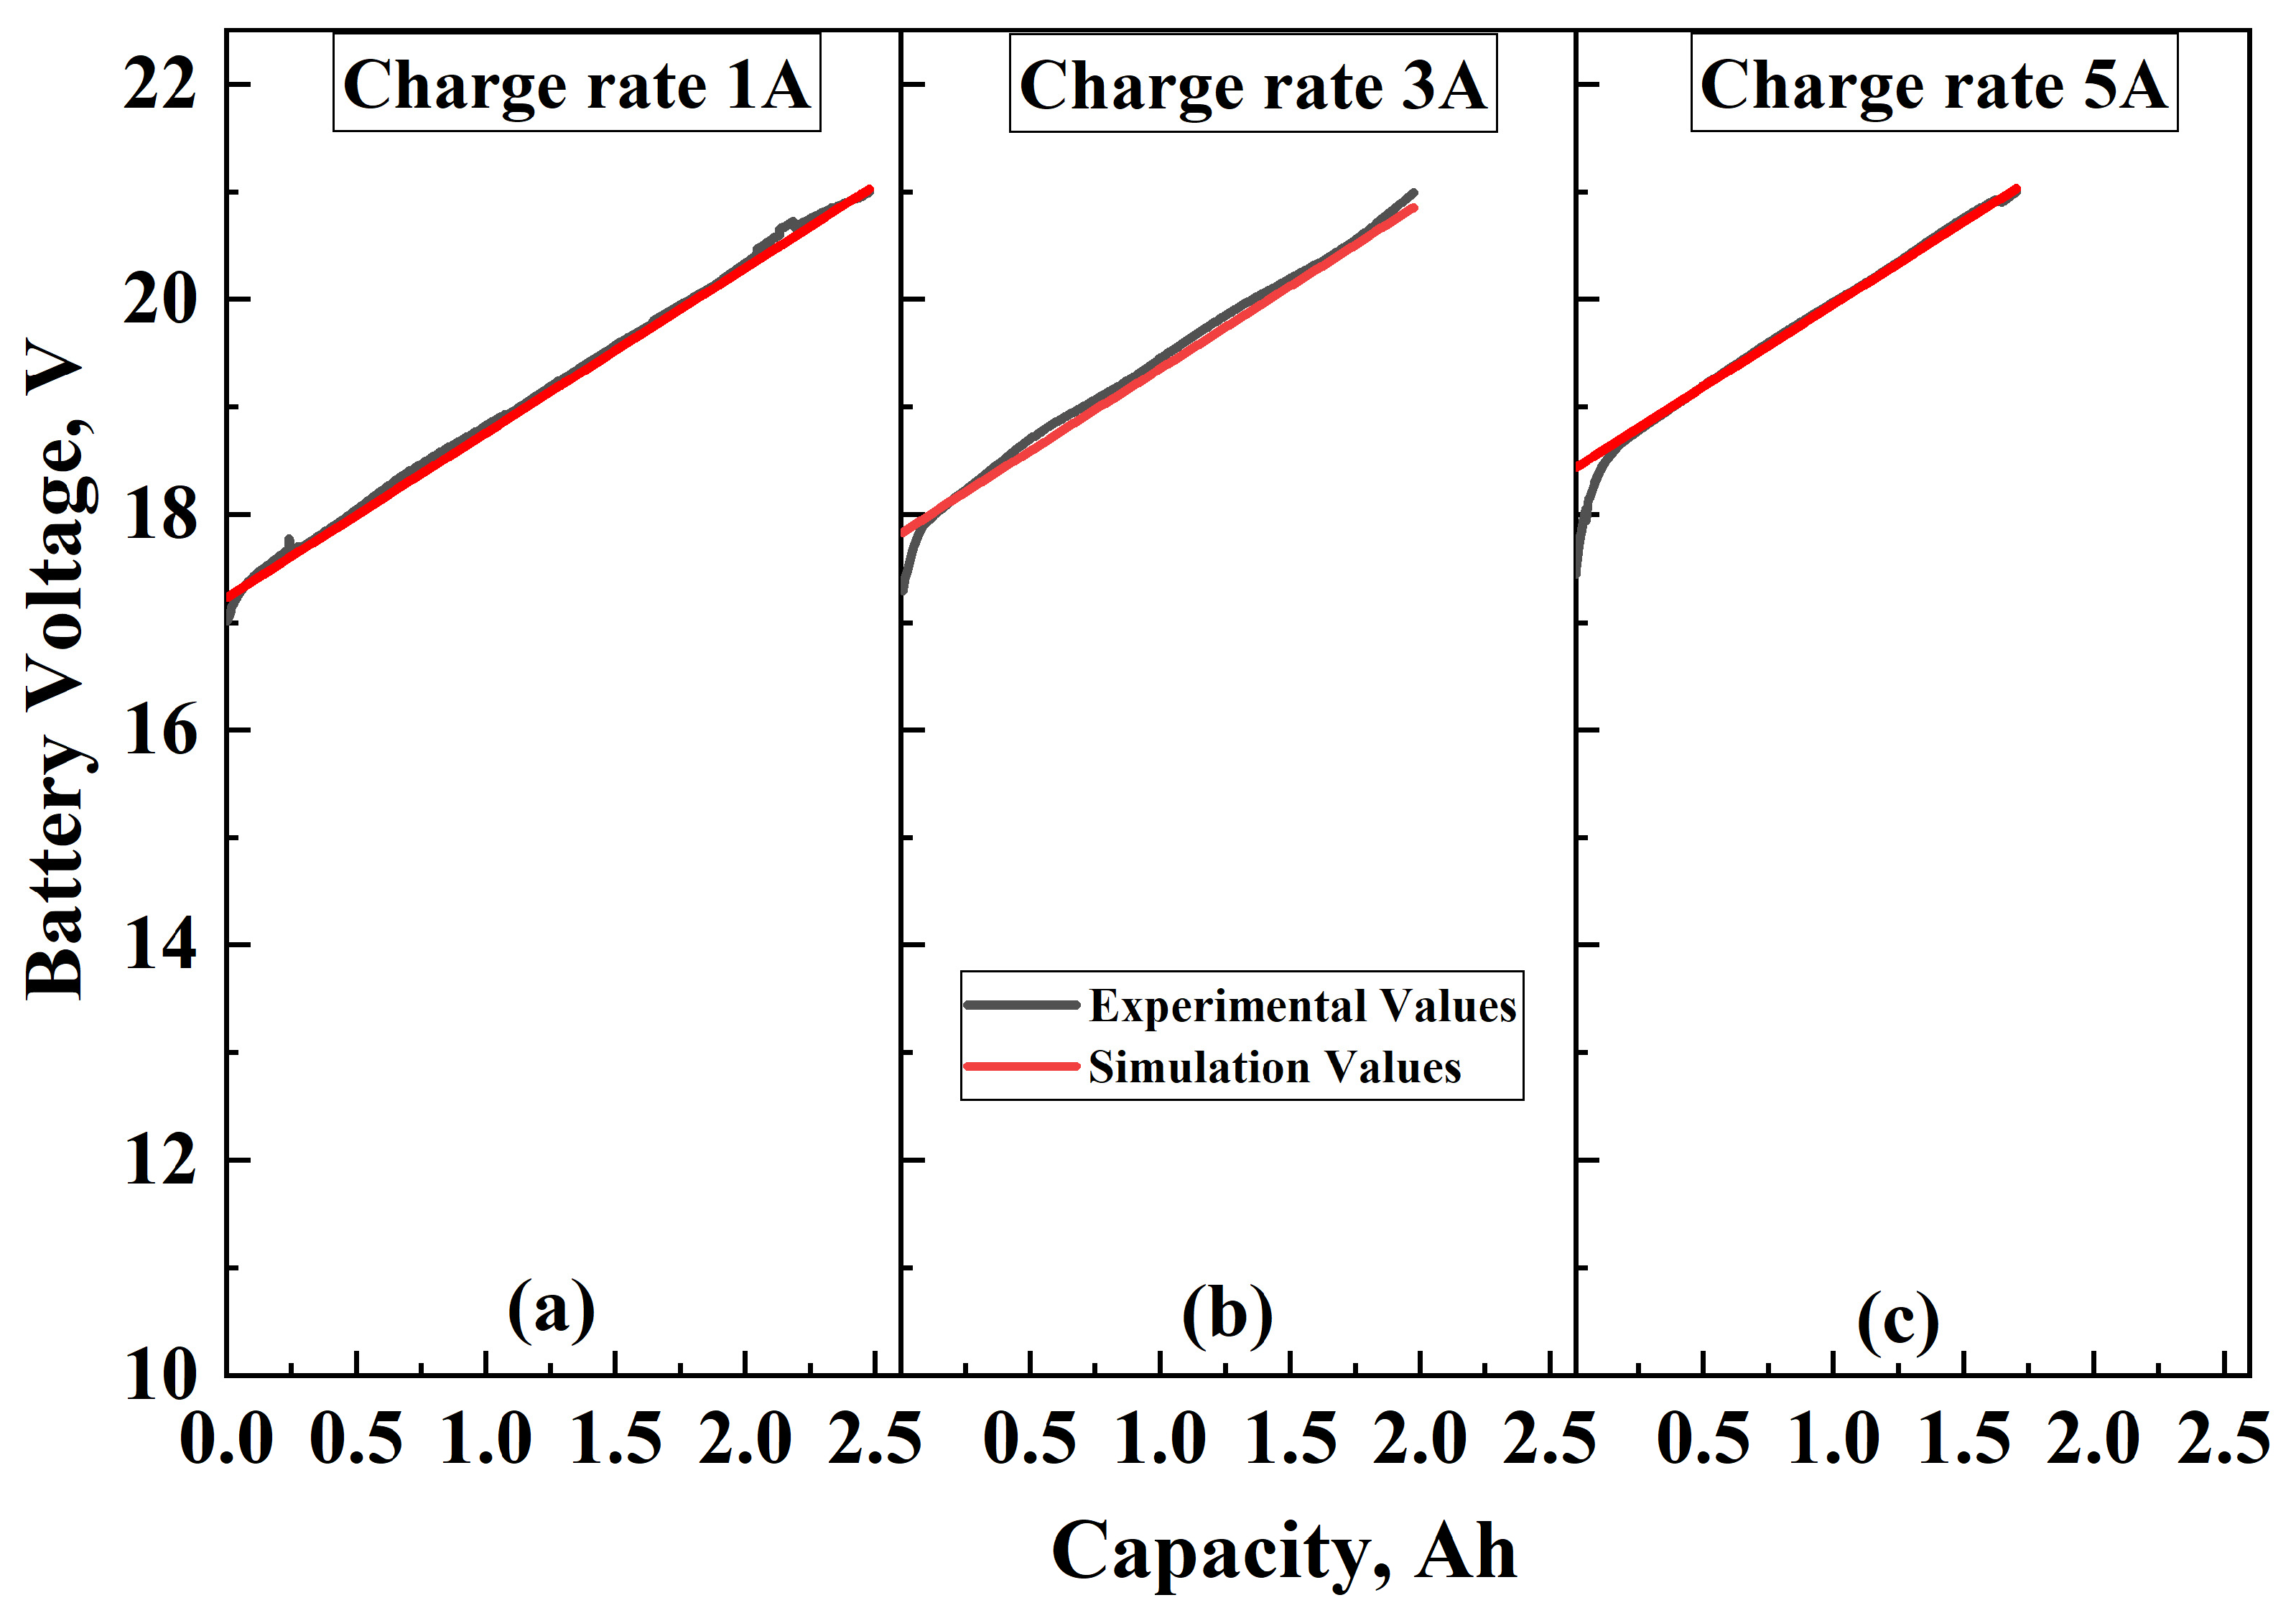
Figure 12 illustrates the evolution of battery voltage as a function of capacity during constant current charging at the same three current rates as during the discharge procedure. In order to evaluate the model’s performance under varying current conditions, experimental measurements (black curves) are juxtaposed with the corresponding simulation outputs (red curves).
A notable characteristic is that the batteries operate within a voltage range approximately between 12.5 V and 21 V. The initial voltage values are relatively higher because the batteries have just undergone a discharge phase and are in the process of reaching an equilibrium state. During this relaxation period, the voltage naturally rises as the electrochemical system stabilizes before the actual charging current is applied.
At the lowest charging rate of 1A (Figure 12a), the voltage rise is smooth and gradual. The simulation closely matches the experimental data throughout the charging process, demonstrating the model’s capability to accurately represent the cells’ behavior under low-rate charging. At higher charging currents (3A and 5A), the voltage increases more sharply at the beginning. Despite this, the simulation reproduces the experimental trends well, with only minor deviations at the initial stages.

3.3.3. IEC 62660-1 Standard Simulation

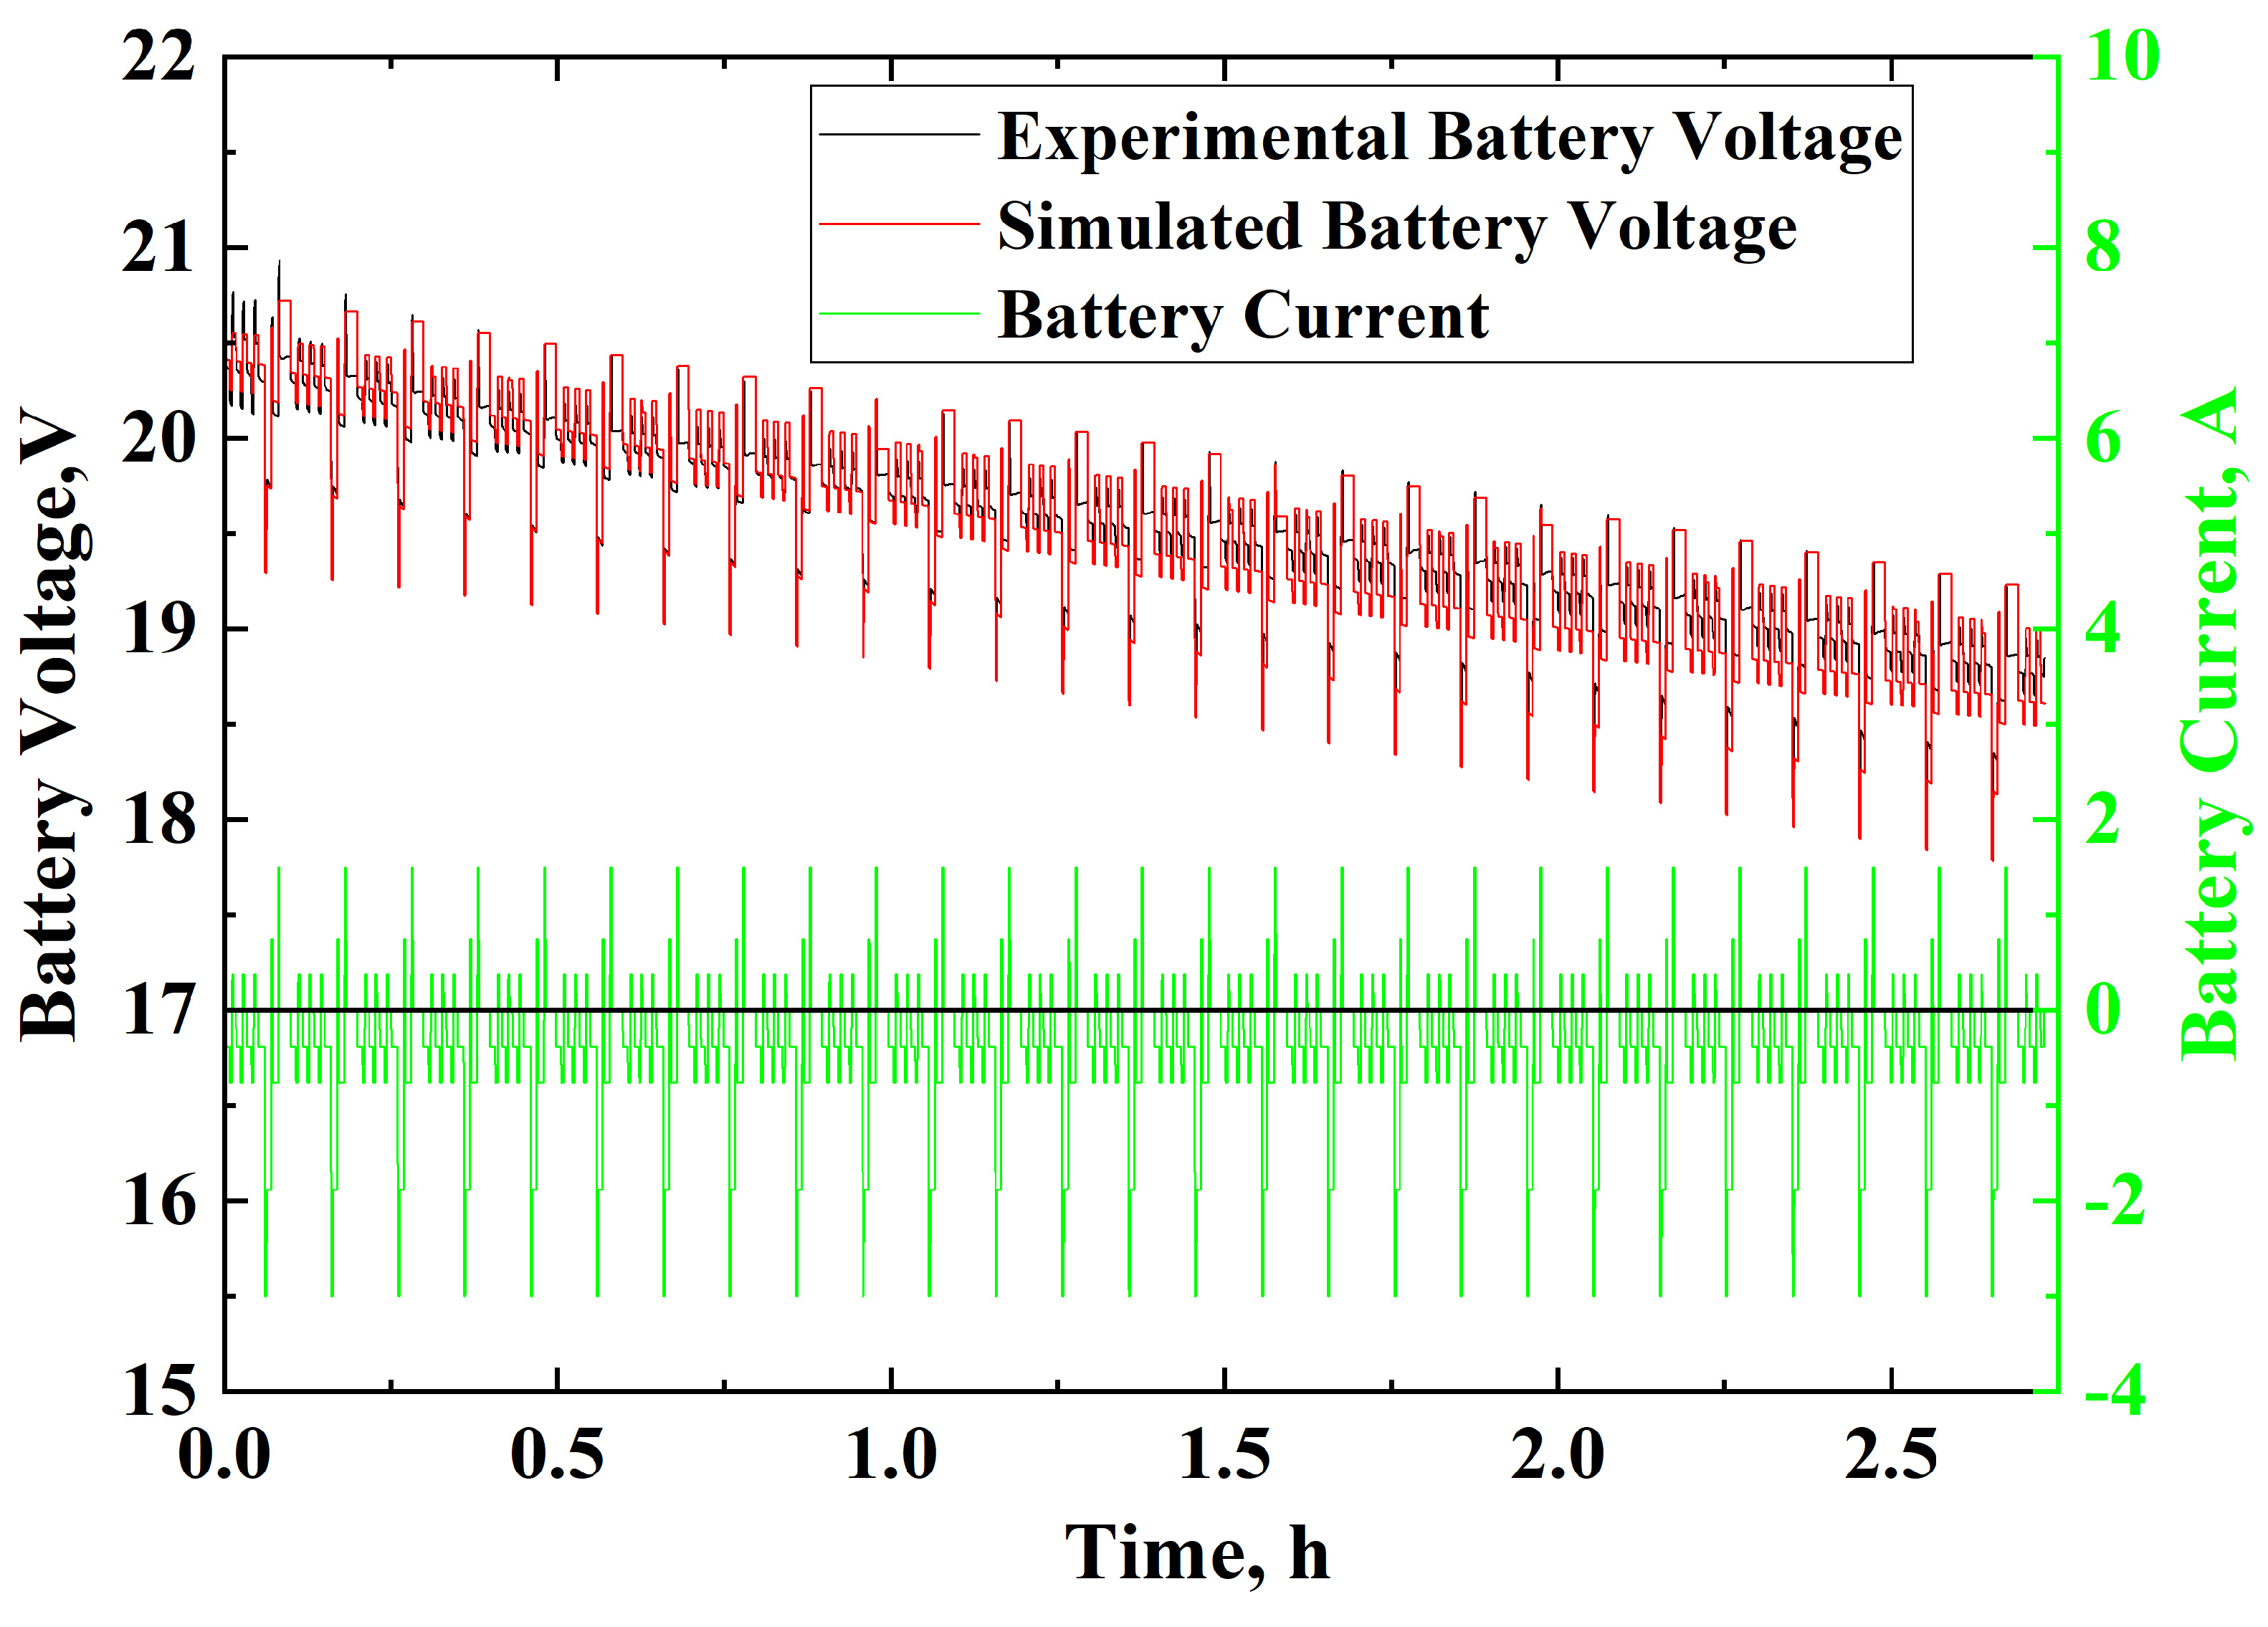
Figure 13 illustrates the evolution of battery voltage as a function of time over a period of approximately 3 h, following the test protocol defined by IEC 62660-1, comparing experimental measurements (red line) with simulated values (black line). In the beginning, both experimental and simulated curves begin at about 20.4 V, representative of a fully charged state. As time progresses, a steady decline in voltage is observed in both curves.
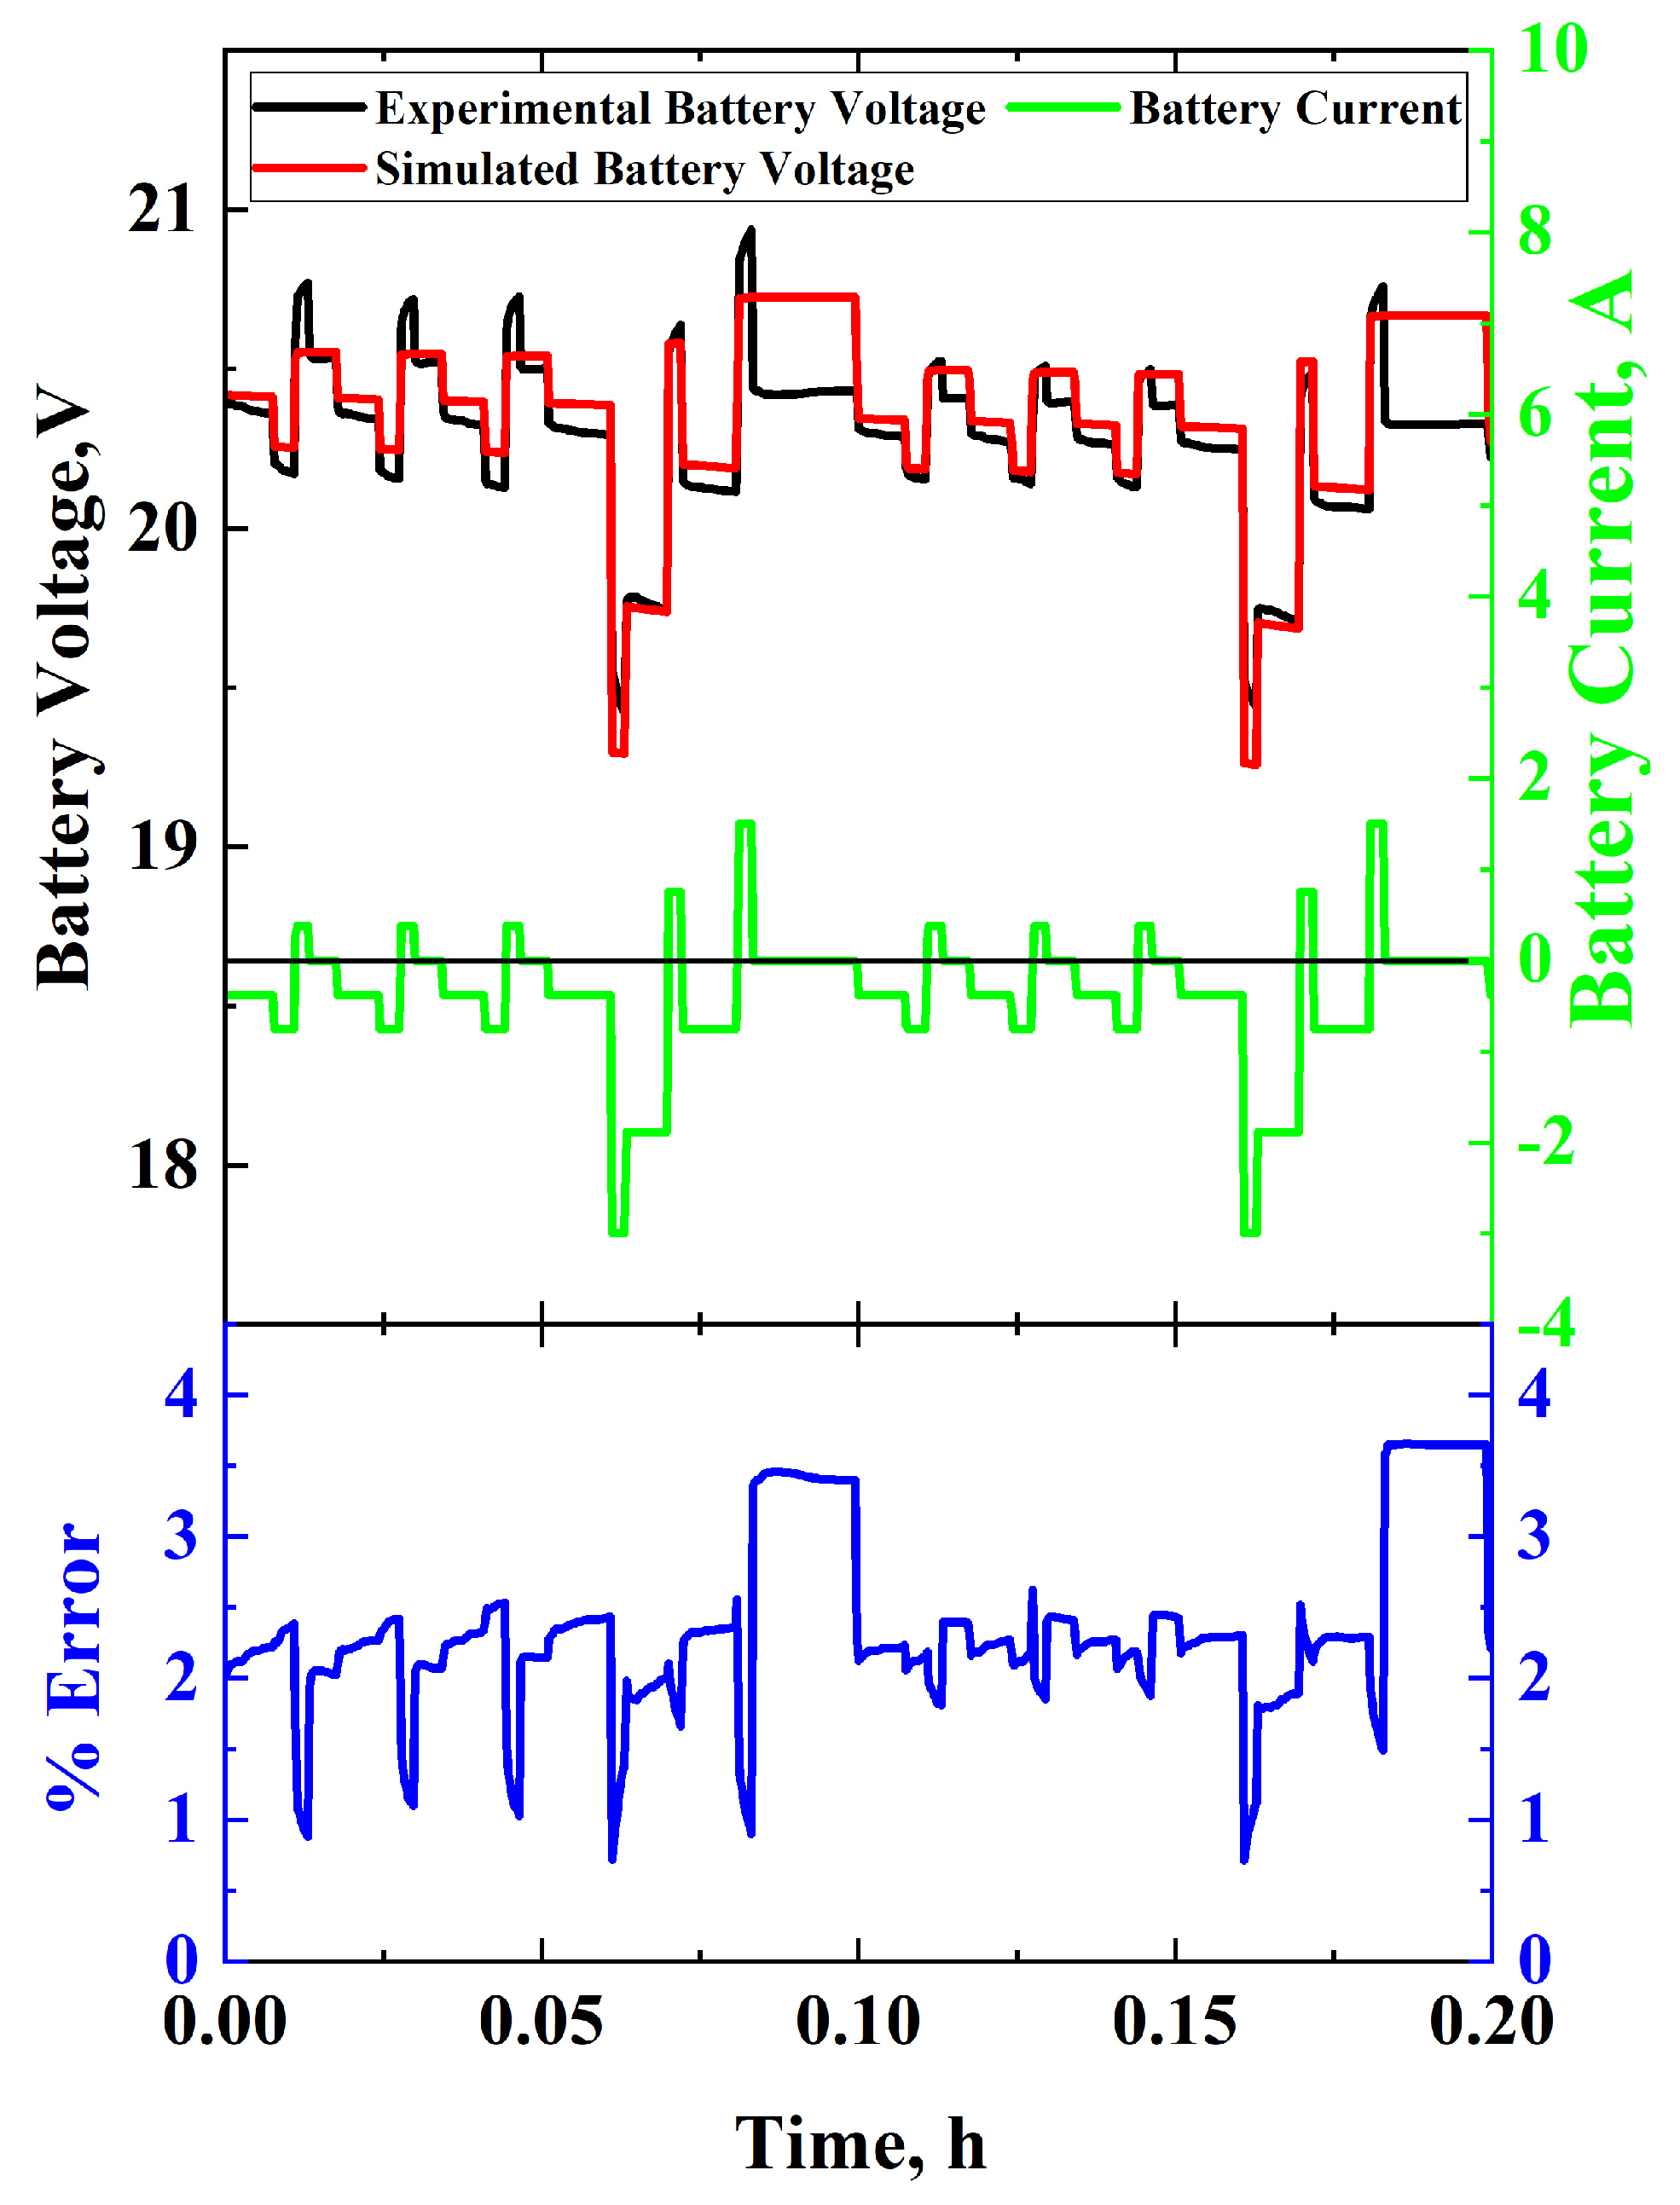
Figure 14 presents a zoomed-in view of the battery behavior during the initial 0.2 h of the IEC 62660-1 dynamic profile (Figure 4), proving a detailed comparison between experimental data (black line) and simulation results (red line). The simulated profile closely follows the experimental curve, capturing the general trend. Minor discrepancies can be observed, particularly at points of rapid current (green line) fluctuation, where the simulated response slightly lags from the experimental behavior. The battery current, alternates between positive and negative values, indicating that there are charging and discharging phases. The lower plot (blue curve) displays the corresponding percentage error, which remains low and relatively stable throughout the duration, with slight peaks in some cases. These local deviations remain within an acceptable range, reinforcing the model’s predictive capability, supporting the conclusion of strong agreement between simulation and experimental results.

4. Discussion

The experimental validation demonstrates the strong agreement between simulated and measured voltage profiles, during charge and discharge at multiple current rates. Classical approaches such as the Shepherd model aim to capture the non-linear relationship between real-time battery operation and discharge rate and exhibit weak correlation between model parameters and current-voltage characteristics [2,7,10,14]. The proposed model exhibits significantly improved accuracy under the IEC 62660-1 protocol, achieving prediction errors below 2.5%. While electrochemical models such as P2D can offer greater resolution, they often require solving coupled differential equations, making them computationally intensive and impractical for such applications [10,11,12,13]. These results confirm that the proposed method can be used to develop accurate predictive models with minimal complexity, making it highly adaptable for real-time applications in electric vehicles.
In the literature there are also various models that have been proposed for characterizing the OCV-SoC relationship of lithium-ion batteries [5,23,24,25,26]. For example, [25] evaluated several fitting techniques including exponential, polynomial, sum of sin functions and Gaussian models under multiple temperature conditions. While their approach provides a broad comparison across models, the use of high-order polynomials increases model complexity and may limit applicability in real-time systems. In contrast, [24] proposed a generalized SoC-OCV model using a hybrid expression combining logarithmic, exponential and linear terms, aiming to maintain high fitting accuracy. However, its implementation requires complex nonlinear optimization and parameter adaptation. More recently, [5] introduced an improved OCV model tailored for online SoC estimation using an Extended Kalman Filter. This model used logarithmic, linear and exponential functions to enhance the accuracy, resulting again in complexity. Compared to these studies, our proposed model offers a balance between accuracy and computational simplicity. By optimizing our equations using experimental data, we achieve high fidelity.
Although the model maintains a high level of precision throughout most operational phases, localized discrepancies are observed during the rest period, where %Error reaches up to 3.5%. These deviations may derive from electrochemical relaxation processes not fully captured by the current model. The model’s ability to respond well to varying current profiles indicates its potential as a foundational tool.
The description of the experimental data from the model, during discharge, is quite satisfactory except for the last stages of discharge (Figure 11). At the last stages of discharge, the battery temperature increases significantly [27,28]. The increase in the temperature favors the diffusion of lithium ions from the SEI–electrolyte interface to the electrode [29]. In experiments that took place with an intermediate pause (Figure 3), from which the model emerged (Equation (5)), the electrodes are cooled as long as the pause lasts. In our view, a possible reason for the model not satisfactorily describing the experimental results at the last stage of discharge is the different battery temperatures in the two kinds of experiments (with pauses and without pauses). Of course, the simulation could be improved by adopting some of the convergence methods, but this would deviate from the goal of our work, which was to use the equations resulting from the pause experiments in the non-pause experiments, without any modification. Furthermore, at this point of discharge, the battery is at a low state of charge, which is of little practical interest.
Building upon these findings, future research should explore battery aging mechanisms and extend the model to include relaxation periods to further optimize prediction accuracy. Targeted improvements in error reduction during charging and rest periods will form the basis for subsequent advancements. Additionally, limitations arising from the use of a single battery type and fixed ambient temperature conditions are recognized. Although the primary objective was to evaluate performance under IEC 62660-1 testing requirements, the broader applicability of the model must also be assessed. In future work, it is planned to investigate battery behavior under elevated current rates beyond 5A, exploring a range of thermal environments. This effort will further strengthen the universality of the proposed modeling approach for real-world EV applications.
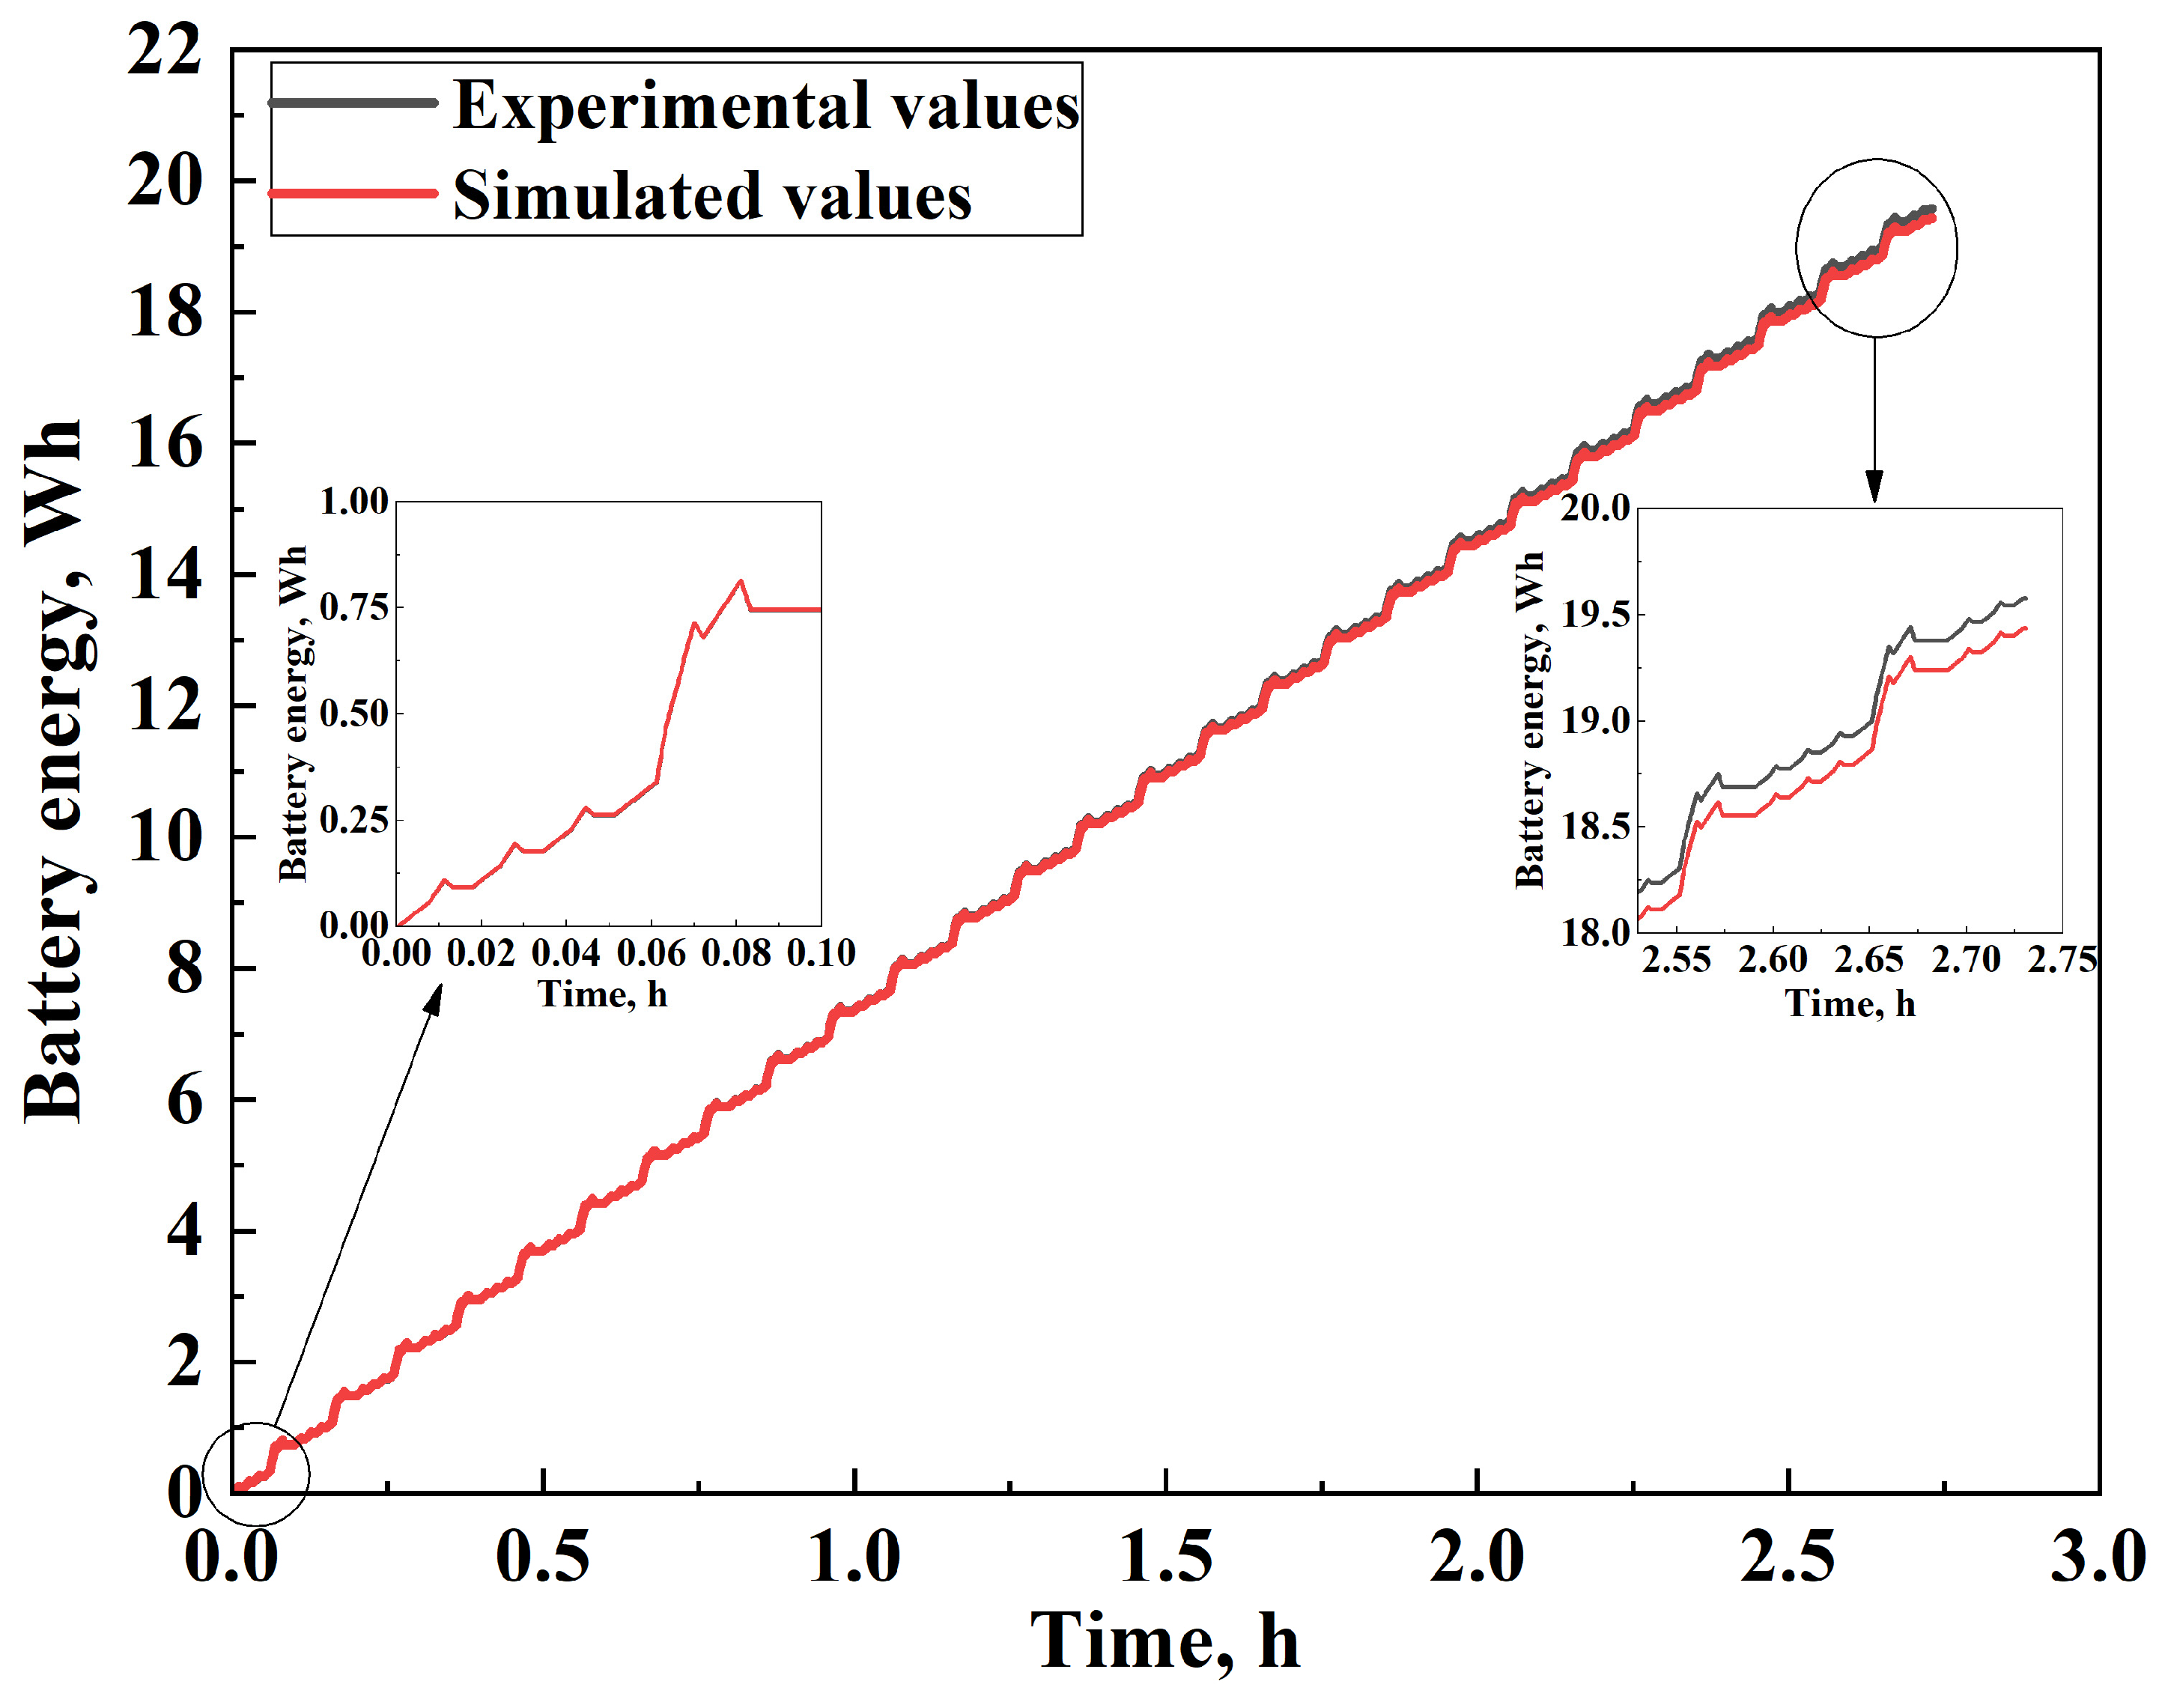
Figure 15 shows the change in the energy yielded by the battery over time, cumulatively for the experiment in Figure 13. With the inserted images, the accuracy of the model in the description of the experimental data, at the beginning and the end of the experiment, becomes more evident. More specifically, at the beginning, the model describes the experimental data excellently. After several cycles, a slight deviation appears, which gradually increases until the last cycle, where the difference between the experimental and the theoretical value is approximately 0.143 Wh.
On a cycle that lasts 0.1 h, as described in Figure 14, the battery is discharged and charged. At the end of this cycle, the battery is discharged, yielding about 0.744 Wh. In total, the battery has performed 27.3 cycles, delivering 19.58 Wh of energy (Figure 15). According to the battery manufacturer, the nominal energy content of the battery will be 54 Wh (=10.8 × 5, Table 1). Therefore, from the experimental values, the calculated percentage of battery discharge, in terms of energy, is 36.3%, while the corresponding estimated by the model is 36%.

5. Conclusions

This study introduced a practical yet accurate voltage simulation model for lithium-ion batteries used in EV applications, validated through a series of controlled experiments aligned with the IEC 62660-1 standard. The formulation of discharge and charge equations based on experimental OCV and internal resistance measurements resulted in high simulation fidelity, with percentage errors mostly below 2.5%. These results underscore the model’s viability in supporting battery performance prediction strategies.

Author Contributions

Conceptualization, Z.V. and C.E.; methodology, C.E. and Z.V.; software, Z.V.; validation, C.E.; formal analysis, Z.V. and C.E.; investigation, Z.V. and C.E.; resources, C.E.; data curation, Z.V. and C.E.; writing—original draft preparation, Z.V.; writing—review and editing, Z.V. and C.E.; visualization, C.E.; supervision, C.E.; project administration, C.E.; funding acquisition, C.E. All authors have read and agreed to the published version of the manuscript.

Funding

This research received no external funding.

Data Availability Statement

The original contributions presented in the study are included in the article, further inquiries can be directed to the corresponding author/s.

Conflicts of Interest

The authors declare no conflicts of interest.

Abbreviations

BEVBattery Electric Vehicle
BMSBattery Management System
CCVClosed-Circuit Voltage
EVElectric Vehicle
OCVOpen-Circuit Voltage
P2DPseudo-Two-Dimensional
SoCState of Charge

References

  1. Diana Gragg Fast Facts About Energy for Transportation 2025. Available online: https://understand-energy.stanford.edu/energy-services/energy-transportation#fast-facts-header (accessed on 6 August 2025).
  2. Al-Refai, A.; Alkhateeb, A.; Dalala, Z.M. Enhancing the LCO 18,650 Battery Charging/Discharging Using Temperature and Electrical Based Model. Batteries 2022, 8, 199. [Google Scholar] [CrossRef]
  3. Tran, M.-K.; DaCosta, A.; Mevawalla, A.; Panchal, S.; Fowler, M. Comparative Study of Equivalent Circuit Models Performance in Four Common Lithium-Ion Batteries: LFP, NMC, LMO, NCA. Batteries 2021, 7, 51. [Google Scholar] [CrossRef]
  4. Rotas, R.; Iliadis, P.; Nikolopoulos, N.; Rakopoulos, D.; Tomboulides, A. Dynamic Battery Modeling for Electric Vehicle Applications. Batteries 2024, 10, 188. [Google Scholar] [CrossRef]
  5. Baccouche, I.; Jemmali, S.; Manai, B.; Omar, N.; Amara, N.E.B. Improved OCV Model of a Li-Ion NMC Battery for Online SOC Estimation Using the Extended Kalman Filter. Energies 2017, 10, 764. [Google Scholar] [CrossRef]
  6. Khan, M.I.; Gilani, R.; Hafeez, J.; Ayoub, R.; Zahoor, I.; Saira, G. Chapter 3—Advantages and Disadvantages of Lithium-Ion Batteries. In Nanostructured Lithium-Ion Battery Materials; Micro and Nano Technologies; Thomas, S., Gueye, A.B., Savadogo, O., Maria, H.J., Eds.; Elsevier: Amsterdam, The Netherlands, 2025; pp. 47–64. ISBN 978-0-443-13338-1. [Google Scholar]
  7. Tamilselvi, S.; Gunasundari, S.; Karuppiah, N.; Razak Rk, A.; Madhusudan, S.; Nagarajan, V.M.; Sathish, T.; Shamim, M.Z.M.; Saleel, C.A.; Afzal, A. A Review on Battery Modelling Techniques. Sustainability 2021, 13, 10042. [Google Scholar] [CrossRef]
  8. B S, S.; Hampannavar, S.; B, D.; Bairwa, B. Applications of Battery Management System (BMS) in Sustainable Transportation: A Comprehensive Approach from Battery Modeling to Battery Integration to the Power Grid. World Electr. Veh. J. 2022, 13, 80. [Google Scholar] [CrossRef]
  9. Tremblay, O.; Dessaint, L.-A.; Dekkiche, A.-I. A Generic Battery Model for the Dynamic Simulation of Hybrid Electric Vehicles. In Proceedings of the 2007 IEEE Vehicle Power and Propulsion Conference, Arlington, TX, USA, 9–12 September 2007; pp. 284–289. [Google Scholar]
  10. Campagna, N.; Castiglia, V.; Miceli, R.; Mastromauro, R.A.; Spataro, C.; Trapanese, M.; Viola, F. Battery Models for Battery Powered Applications: A Comparative Study. Energies 2020, 13, 4085. [Google Scholar] [CrossRef]
  11. Han, S.; Tang, Y.; Khaleghi Rahimian, S. A Numerically Efficient Method of Solving the Full-Order Pseudo-2-Dimensional (P2D) Li-Ion Cell Model. J. Power Sources 2021, 490, 229571. [Google Scholar] [CrossRef]
  12. Jokar, A.; Rajabloo, B.; Désilets, M.; Lacroix, M. Review of Simplified Pseudo-Two-Dimensional Models of Lithium-Ion Batteries. J. Power Sources 2016, 327, 44–55. [Google Scholar] [CrossRef]
  13. Wickramanayake, T.; Javadipour, M.; Mehran, K. A Novel Solver for an Electrochemical–Thermal Ageing Model of a Lithium-Ion Battery. Batteries 2024, 10, 126. [Google Scholar] [CrossRef]
  14. Li, S.; Ke, B. Study of Battery Modeling Using Mathematical and Circuit Oriented Approaches. In Proceedings of the 2011 IEEE Power and Energy Society General Meeting, Detroit, MI, USA, 24–28 July 2011; pp. 1–8. [Google Scholar]
  15. Zhang, Z.; Chen, S.; Lu, L.; Han, X.; Li, Y.; Chen, S.; Wang, H.; Lian, Y.; Ouyang, M. High-Precision and Robust SOC Estimation of LiFePO4 Blade Batteries Based on the BPNN-EKF Algorithm. Batteries 2023, 9, 333. [Google Scholar] [CrossRef]
  16. Pepó, M.; Fullér, S.; Cseke, T.; Weltsch, Z. Advances in Standardised Battery Testing for Enhanced Safety and Innovation in Electric Vehicles: A Comprehensive Review. Batteries 2025, 11, 157. [Google Scholar] [CrossRef]
  17. IEC 62660-1:2018; Secondary Lithium-Ion Cells for the Propulsion of Electric Road Vehicles—Part 1: Performance Testing. The International Electrotechnical Commission (IEC): Geneva, Switzerland, 2018. Available online: https://webstore.iec.ch/en/publication/28965 (accessed on 6 May 2025).
  18. Estaller, J.; Kersten, A.; Kuder, M.; Thiringer, T.; Eckerle, R.; Weyh, T. Overview of Battery Impedance Modeling Including Detailed State-of-the-Art Cylindrical 18650 Lithium-Ion Battery Cell Comparisons. Energies 2022, 15, 3822. [Google Scholar] [CrossRef]
  19. Zatta, N.; De Cesaro, B.; Dal Cin, E.; Carraro, G.; Cristofoli, G.; Trovò, A.; Lazzaretto, A.; Guarnieri, M. Testing and Characterizing Commercial 18650 Lithium-Ion Batteries. Batteries 2024, 10, 248. [Google Scholar]
  20. Marzook, M.W.; Eaton, J.; Samieian, M.A.; Patel, Y.; Offer, G.; Marinescu, M. Performance Benchmarking of Lithium-Ion Batteries: The Effect of Test Conditions on the Down-Selection of Cylindrical Cells. SSRN 2023. [Google Scholar] [CrossRef]
  21. Motorcycle|Other Mobility. Available online: https://www.murata.com/en-eu/apps/mobility/other/motorcycle (accessed on 7 July 2025).
  22. Kawahara, Y.; Sakabe, K.; Nakao, R.; Tsuru, K.; Okawa, K.; Aoshima, Y.; Kudo, A.; Emori, A. Development of Status Detection Method of Lithium-Ion Rechargeable Battery for Hybrid Electric Vehicles. J. Power Sources 2021, 481, 228760. [Google Scholar] [CrossRef]
  23. Yu, Q.-Q.; Xiong, R.; Wang, L.-Y.; Lin, C. A Comparative Study on Open Circuit Voltage Models for Lithium-Ion Batteries. Chin. J. Mech. Eng. 2018, 31, 65. [Google Scholar] [CrossRef]
  24. Zhang, C.; Jiang, J.; Zhang, L.; Liu, S.; Wang, L.; Loh, P.C. A Generalized SOC-OCV Model for Lithium-Ion Batteries and the SOC Estimation for LNMCO Battery. Energies 2016, 9, 900. [Google Scholar] [CrossRef]
  25. Zhang, R.; Xia, B.; Li, B.; Cao, L.; Lai, Y.; Zheng, W.; Wang, H.; Wang, W.; Wang, M. A Study on the Open Circuit Voltage and State of Charge Characterization of High Capacity Lithium-Ion Battery Under Different Temperature. Energies 2018, 11, 2408. [Google Scholar] [CrossRef]
  26. Somakettarin, N.; Funaki, T. Study on Factors for Accurate Open Circuit Voltage Characterizations in Mn-Type Li-Ion Batteries. Batteries 2017, 3, 8. [Google Scholar] [CrossRef]
  27. Liu, S.; Chen, J.; Zhang, C.; Jin, L.; Yang, Q. Experimental Study on Lithium-Ion Cell Characteristics at Different Discharge Rates. J. Energy Storage 2022, 45, 103418. [Google Scholar] [CrossRef]
  28. Wang, X.; Zhu, J.; Liu, D.; Liu, Q.; Jiang, Y.; Wang, X.; Liu, H.; Tao, S.; Wei, X.; Schade, W.; et al. Internal Temperature Evolution of Lithium-Ion Battery over Long-Term Cycling via Advanced Fiber Sensing. J. Power Sources 2025, 652, 237604. [Google Scholar] [CrossRef]
  29. Jow, T.R.; Delp, S.A.; Allen, J.L.; Jones, J.-P.; Smart, M.C. Factors Limiting Li+ Charge Transfer Kinetics in Li-Ion Batteries. J. Electrochem. Soc. 2018, 165, A361. [Google Scholar] [CrossRef]
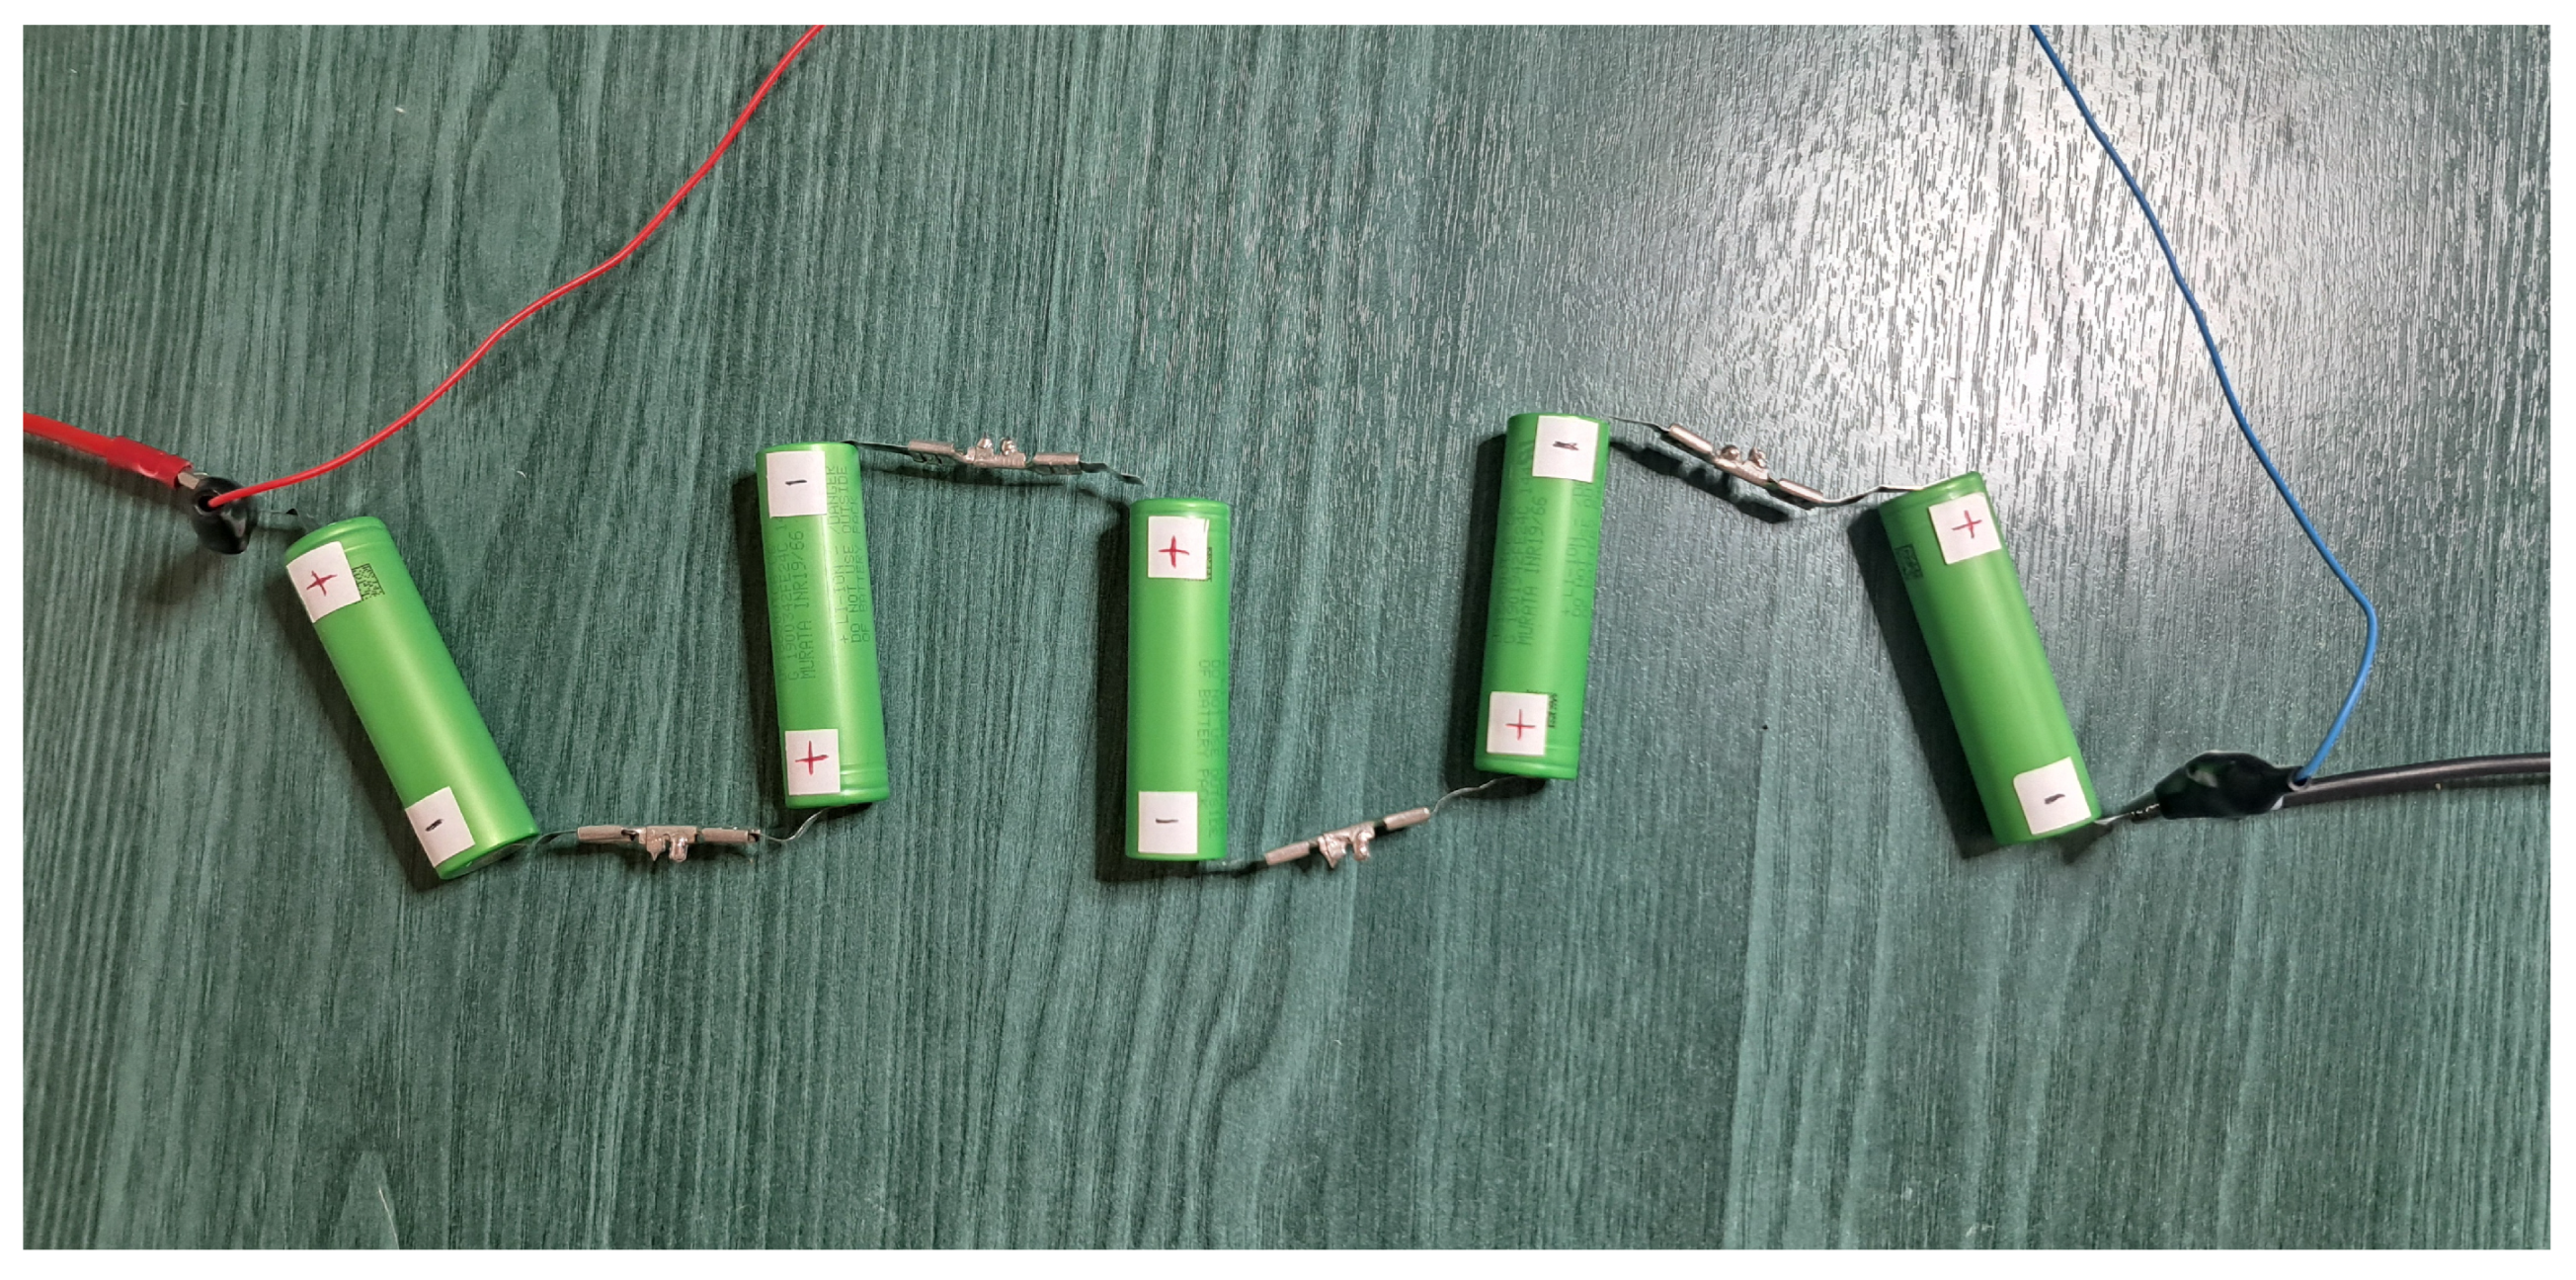
Figure 1. Lithium-ion cells connected in series.
Batteries 11 00314 g001
Figure 2. IT-M3900C power supply.
Batteries 11 00314 g002
Figure 3. Battery voltage and current for OCV extraction during (a) charge at 5A and (b) discharge at 5A.
Batteries 11 00314 g003
Figure 4. Dynamic discharge profile of battery electric vehicle (BEV) according to IEC62660-1 standard.
Batteries 11 00314 g004
Figure 5. OCVdis at (a) 1A, (b) 3A and (c) 5A discharge rates and model fitting parameters (d).
Batteries 11 00314 g005
Figure 6. Voltage drop as a function of discharged capacity for 1A, 3A and 5A.
Batteries 11 00314 g006
Figure 7. Dependence of fitting parameters ( y 0 , A, w) on discharge current.
Batteries 11 00314 g007
Figure 8. OCVch at different charge rates.
Batteries 11 00314 g008
Figure 10. Linear dependence of IR on charging current.
Batteries 11 00314 g010
Figure 11. Comparison of experimental and simulated voltage profiles at (a) 1A, (b) 3A and (c) 5A discharge currents.
Batteries 11 00314 g011
Figure 12. Comparison of experimental and simulated voltage profiles at (a) 1A, (b) 3A and (c) 5A. charging currents.
Batteries 11 00314 g012
Figure 13. Experimental and simulated voltage drop based on IEC 62660-1.
Batteries 11 00314 g013
Figure 14. Close-up of experimental and simulated voltage drop based on IEC 62660-1 with error.
Batteries 11 00314 g014
Figure 15. Cumulative energy delivered by the battery during the experiment in Figure 13.
Batteries 11 00314 g015
Table 1. Cell specifications.
Battery Voltage (V)Battery CapacityFast Charge Current (A)Discharge Current (A)
Min.Typ.Max.AhWhMax.Max.
2.53.64.2310.8530
Table 2. Model fitting parameters for discharging.
1A3A5A
B 0 20.7453120.5334320.65722
B 1 −1.66244−0.776810.08191
B 2 −0.71062−1.95754−2.93278
B 3 0.975541.638151.90457
B 4 −0.3205−0.43178−0.40347
Table 3. Fitted coefficients for discharge equation.
1A3A5A
y 0 0.376470.980621.50247
A4.204757.49975.76682
w−0.13387−0.15315−0.19628
Table 4. Model fitting parameters for charging.
1A3A5AAverage
a16.8592616.620121716.82646
b1.510141.508331.57531.5313
Disclaimer/Publisher’s Note: The statements, opinions and data contained in all publications are solely those of the individual author(s) and contributor(s) and not of MDPI and/or the editor(s). MDPI and/or the editor(s) disclaim responsibility for any injury to people or property resulting from any ideas, methods, instructions or products referred to in the content.