Article

Accurate Prediction of Voltage and Temperature for a Sodium-Ion Pouch Cell Using an Electro-Thermal Coupling Model

1
School of Mechanical Engineering, University of Shanghai for Science and Technology, Shanghai 200093, China
2
School of Rail Transportation, Soochow University, Suzhou 215000, China
*
Authors to whom correspondence should be addressed.
Batteries 2025, 11(8), 312; https://doi.org/10.3390/batteries11080312 (registering DOI)
Submission received: 8 July 2025 / Revised: 12 August 2025 / Accepted: 14 August 2025 / Published: 16 August 2025
(This article belongs to the Special Issue Batteries: 10th Anniversary)

Abstract

Due to their advantages, such as abundant raw material reserves, excellent thermal stability, and superior low-temperature performance, sodium-ion batteries (SIBs) exhibit significant potential for future applications in energy storage and electric vehicles. Therefore, in this study, a commercial pouch-type SIB with sodium iron sulfate cathode material was investigated. Firstly, a second-order RC equivalent circuit model was established through parameter identification using multi-rate hybrid pulse power characterization (M-HPPC) tests at various temperatures. Then, both the specific heat capacity and entropy coefficient of the sodium-ion battery were measured through experiments. Building upon this, an electro-thermal coupling model was developed by incorporating a lumped-parameter thermal model that accounts for the heat generation of the tabs. Finally, the prediction performance of this model was validated through discharge tests under different temperature conditions. The results demonstrate that the proposed electro-thermal coupling model can achieve the simultaneous prediction of both temperature and voltage, providing valuable references for the future development of thermal management systems for SIBs.

1. Introduction

With the escalating energy shortage and worsening environmental pollution, lithium-ion batteries (LIBs) have been extensively utilized in various aspects of human production and daily life, including new energy vehicles, large-scale energy storage systems, power tools, and consumer electronics [1,2,3]. Although LIBs have achieved commercial success, they still suffer from several limitations, such as poor low-temperature performance, insufficient thermal stability, and the scarcity and uneven global distribution of lithium resources [4,5]. Consequently, alternative battery systems have emerged to address these challenges. Among them, sodium-ion batteries (SIBs) have garnered increasing attention from researchers due to their superior low-temperature performance, enhanced safety, lower manufacturing costs, and the abundance and widespread availability of sodium resources [6,7,8,9]. These advantages position SIBs as a promising candidate for large-scale applications.
Current research on SIBs primarily focuses on the development and optimization of material systems [10]. The reported cathode materials for SIBs mainly include transition metal oxides (e.g., layered oxides and tunnel-type oxides) [11,12], Prussian blue analogs [13], and polyanionic compounds such as sodium iron phosphate (NaFePO4) and sodium iron sulfate (Na2(FeSO4)3) [14]. As for anode materials, carbon-based materials (e.g., soft carbon and hard carbon) and titanium-based intercalation compounds are among the most widely studied [15]. Furthermore, an increasing number of researchers have initiated investigations into the practical applications of commercial sodium-ion batteries. For instance, Mathias Rehm et al. conducted a comparative study of the electrical performance between commercial 18650 lithium-ion batteries with LiFePO4 cathodes and sodium-ion batteries with layered oxide cathodes. Their results demonstrated that (1) sodium-ion batteries exhibit similar open-circuit voltage hysteresis characteristics, and (2) their DC internal resistance (DCIR) displays a more pronounced dependence on both temperature and state-of-charge (SOC) variations [16]. Minglong He et al. systematically evaluated commercial pouch-type sodium-ion batteries with Prussian blue cathodes through comprehensive experiments, including open-circuit voltage measurements, rate capability tests, DCIR assessments, and safety performance evaluations. Their findings revealed that SIBs present a relatively lower risk of thermal runaway compared to LIBs [17]. Lihil Uthpala Subasinghe et al. investigated the heat generation behavior of 18650-type sodium-ion batteries with sodium vanadium phosphate (Na3V2(PO4)3) cathodes. Through systematic measurements of DCIR and entropy heat coefficients, the researchers performed quantitative analysis of both reversible and irreversible heat generation in the sodium-ion battery [18]. The aforementioned studies primarily employ experimental methods to conduct preliminary investigations into the electrical, electrochemical, and thermal characteristics of sodium-ion batteries, which are of great significance for a new battery system.
In fact, similar to LIBs, SIBs also face various challenges during operation, including aging and thermal runaway. Consequently, SIBs equally require battery management systems (BMSs) to maintain optimal operating conditions, and their performance fundamentally depends on accurate battery modeling. Currently, there exists extensive research on LIB modeling approaches, primarily encompassing the following: (1) equivalent circuit models (ECMs) such as Thevenin, dual polarization (DP), and fractional-order models [19,20,21]; (2) electrochemical models including the pseudo-two-dimensional (P2D) model and its various reduced-order formulations [22,23,24]; and (3) multi-physics coupled models integrating electrical-thermal or electrochemical-thermal interactions [25,26]. Given the analogous working mechanisms between SIBs and LIBs [27], the established modeling approaches for LIBs can serve as valuable references for constructing SIB models. For example, Kudakwashe Chayambuka et al. established a P2D model for sodium-ion batteries with sodium vanadium phosphate as the cathode material [28]. Based on this, Vamsi Krishna Garapati et al. compared the performance differences between the single-particle model (SPM) and the P2D model for sodium-ion batteries with the same material system [29]. Yonggao Fu et al. developed a simplified electrochemical model based on the single-particle model for a commercial 18650-type sodium-ion battery with layered oxides, achieving terminal voltage prediction over a wide temperature range [30]. In addition to electrochemical models, equivalent circuit models have also attracted significant attention due to their low computational cost and ease of implementation. For instance, Bei Jin et al. investigated a commercial cylindrical sodium-ion battery with layered oxides. They found that sodium dendrite growth under low-temperature fast charging could induce internal short circuits. Based on this, they developed an internal short-circuit resistance calculation method using an equivalent circuit model, enabling the fault diagnosis of ISC [31]. Yi-Feng Feng systematically compared the performance of ECMs with different resistance capacitance (RC) numbers for the sodium-ion battery with layered oxides. The study demonstrated that the equivalent circuit model remains applicable to sodium-ion battery systems [32]. Cong Jiang et al. established a fractional-order equivalent circuit model for a commercial cylindrical sodium-ion battery by measuring electrochemical impedance spectroscopy (EIS) and implementing a fractional-order extended Kalman filter algorithm for state-of-charge (SOC) estimation [33]. Houssam Rabab et al., taking sodium-ion batteries with sodium vanadium fluorophosphate (NVPF) cathodes as the research object, proposed a physics-based equivalent circuit model capable of capturing electrochemical phenomena, including solid-phase diffusion, liquid-phase diffusion, and charge transfer at the solid–liquid interface [34]. Although the aforementioned studies have established different models for sodium-ion batteries with diverse material systems, these models neglected multi-physics coupling effects. Temperature is a key factor influencing battery performance. Specifically, it critically affects the viscosity of electrolytes and ionic conductivity. In addition, the Arrhenius equation theoretically reveals the temperature dependence of the diffusion coefficient of Na+ in the electrode materials and the electrolyte [35,36]. Consequently, establishing an electro-thermal coupling model to achieve simultaneous voltage and temperature prediction is crucial for developing a reliable BMS for SIBs. Importantly, to the best of our knowledge, research on electro-thermal coupling models for SIBs remains scarce. Among the existing studies, temperature estimation methods primarily fall into the following two categories: data-driven approaches (e.g., employing measured electrochemical impedance spectroscopy (EIS) combined with machine learning algorithms for battery temperature estimation [33,37], which can avoid complex mechanistic modeling but face impractical EIS measurement requirements in real applications) and mechanism-based models (e.g., constructing numerical simulation-based 3D thermal models for temperature prediction [38], which capture spatial temperature distribution but incur high computational costs).
Therefore, this study selected a commercial pouch-type sodium-ion battery as the research object and developed its electro-thermal coupling model based on an equivalent circuit model and a lumped-parameter thermal model. To obtain model parameters, comprehensive experiments were conducted to perform offline parameter identification for both the equivalent circuit sub-model and thermal sub-model. Based on the established electro-thermal coupling model and the identified model parameters, the simultaneous prediction of voltage and temperature in sodium-ion batteries was realized. The remainder of this paper is organized as follows: Section 2 presents the modeling framework, including equivalent circuit and thermal sub-models. Section 3 and Section 4 present the experimental procedures and identification methodologies for the equivalent circuit model and thermal model parameters, respectively. Section 5 analyzes the identified parameters of the electro–thermal coupling model and validates its voltage/temperature prediction performance. Section 6 provides a conclusion.

2. Electro–Thermal Modeling

To balance computational efficiency and model accuracy, this study established a 2-RC equivalent circuit model of the sodium ion cell for voltage prediction [31,38,39,40]. Crucially, temperature change significantly affects the model parameters, including ohmic resistance, polarization resistance, and time constants. Therefore, a temperature prediction sub-model was integrated to dynamically adjust these circuit model parameters based on real-time temperature states. Figure 1 shows a schematic representation of the electro–thermal model and its sub-models. During charge and discharge processes, the battery temperature varies due to self-generated heat, which subsequently modifies the parameters of the equivalent circuit model (e.g., ohmic resistance, polarization resistance, and time constants). These altered electrical parameters, in turn, affect the heat generation rate, thereby establishing bidirectional interactions between the electrical and thermal sub-models.

2.1. Electrical Model

The electrical sub-model of the electro-thermal coupling model is illustrated in Figure 2. The 2-RC ECM includes a voltage source OCV, an ohmic resistor R0, and 2 RC parallel networks. Each RC network consists of a polarization resistor Ri and an equivalent capacitor Ci. The mathematical formulation of the 2-RC ECM, derived according to Kirchhoff’s laws, is presented in Equation (1).
u ˙ 1 = u 1 R 1 C 1 + i C 1 u ˙ 2 = u 2 R 2 C 2 + i C 2 u = OCV + i R 0 + u 1 + u 2
where OCV is the open circuit voltage; ui is the polarization voltage across the ith RC network; u is the terminal voltage of ECM; i is the applied current, which is negative during discharging and positive during charging; R0 is the ohmic resistance; and Ri and Ci are the polarization resistance and the equivalent capacitor of the ith RC network, respectively.
Over a relatively short time interval, the circuit model parameters can be reasonably assumed to be constant. Consequently, the polarization voltage differential equation in Equation (1) reduces to a first-order linear ordinary differential equation with constant coefficients, whose analytical solution during the sampling interval is as follows:
u i = exp [ 1 R i C i ( t t 0 ) ] u i ( t 0 ) + t 0 t i ( τ ) C i exp [ 1 R i C i ( t τ ) ] d τ
where t0 is the initial time, and t is the current time. The current i is assumed to be constant during the time interval. Therefore, Equation (2) can be reformulated as Equation (3) in its discrete-time form.
u i , k = exp ( Δ t τ i ) u i , k 1 + [ 1 exp ( Δ t τ i ) ] i k 1 R i
where ui,k is the polarization voltage across the ith RC network at time tk, ui,k−1 is the polarization voltage across the ith RC network at time tk−1, τi is the time constant of the ith RC network (τi = Ri × Ci), and Δt is the sampling time interval.
Since all parameters in the equivalent circuit model are functions of SOC, the SOC value must be computed at each time step. Based on Coulomb counting, SOC at time tk can be calculated as follows:
SOC k = SOC k 1 + i k 1 Δ t Q n
where SOCk is the SOC value at time tk, SOCk−1 is the SOC value at time tk−1, and Qn is the nominal capacity of the battery at 25 °C.

2.2. Thermal Model

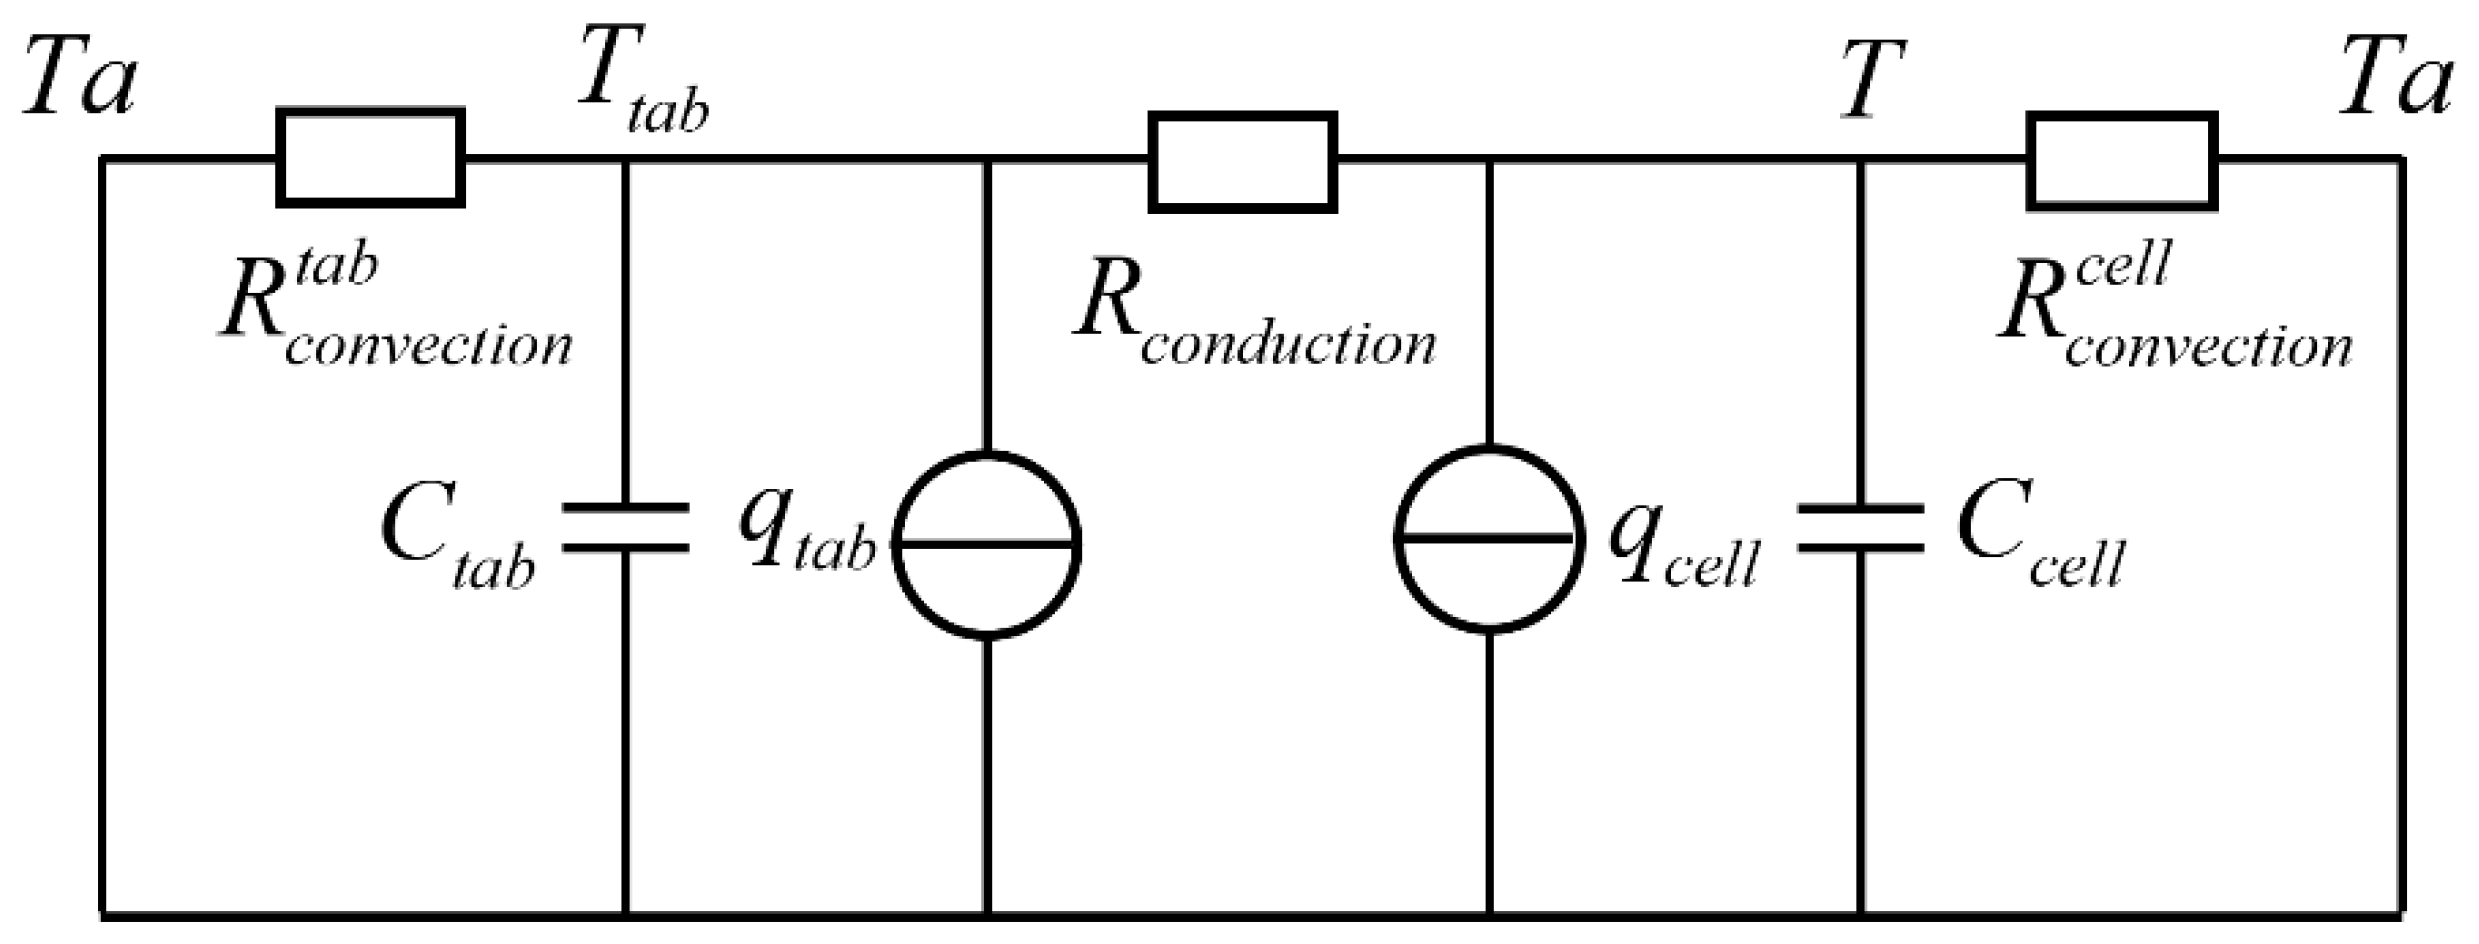
Due to the geometric characteristics of pouch cells, the temperature gradient along the thickness direction can be neglected. The thermal model for pouch cells includes a lumped-parameter thermal model and a distributed-parameter thermal model [41,42]. Although distributed thermal models can resolve the temperature gradients across the battery surface, the computational cost is high. Therefore, a lumped-parameter thermal model was established in this study. The electrical resistance of the tab, combined with the contact resistance between the tab and the test clamp, results in a significant temperature rise during the high-current charging and discharging processes. Consequently, non-negligible heat flow occurs between the battery tabs and the cell body. The equivalent thermal resistance network of the established thermal model is shown in Figure 3. The joule heating at the tabs is partially transferred to the cell body via conduction, which can be quantified by measuring the temperature difference between the tabs and the cell body.
The mathematical formulation for the thermal model, derived according to Fourier’s laws, is presented as the following equation:
C c e l l d T d t = q T T a R c o n v e c t i o n c e l l q = q c e l l + T t a b T R c o n d u c t i o n q c e l l = ( u OCV ) i + i T OCV T
where Ccell is the heat capacity of the cell, qcell is the heat generation rate of the cell, T is the temperature of the cell, ∂OCV/∂T is the entropy coefficient, Ta is the ambient temperature, q is the equivalent generation rate considering thermal conduction between the tabs and cell body, R c o n v e c t i o n c e l l is the thermal resistance between the cell and ambient environment, Rconduction is the thermal resistance between the tab and cell body, and Ttab is the temperature of the tab.
Similarly to the discretization process of the polarization voltage differential equation described previously, the thermal model parameters (including heat generation rate and ambient temperature) can be reasonably assumed to be constant within a relatively small time interval. Thus, Equation (5) can be reformulated as Equation (6) in its discrete-time form.
T k = exp ( Δ t R c o n v e c t i o n c e l l C c e l l ) T k 1 + [ 1 exp ( Δ t R c o n v e c t i o n c e l l C c e l l ) ] ( q k 1 R c o n v e c t i o n c e l l + T a k 1 )
where Tk is the average surface temperature of the cell at tk.

3. Parameter Identification for the Equivalent Circuit Model

3.1. Experimental Setup and Test Procedure

In this work, a commercial pouch-type sodium-ion battery with sodium iron sulfate cathode and hard carbon anode supplied by Jiangsu Zhongna Energy Co. Ltd., Suzhou, China, was selected as the test battery. The detailed specifications of this battery are presented in Table 1. The main aim of the experiment is to identify the model parameters of the 2-RC ECM, including the open voltage source OCV, the ohmic resistance R0, the polarization resistances R1 and R2, and the time constants τ1 and τ2. All the circuit parameters are dependent on SOC, temperature, and C-rate. Therefore, the M-HPPC test [43] with discharge rates of 0.5C and 1.0C was repeated on the test battery at three temperatures, ranging from 15 to 35 °C, with a 10 °C step. The M-HPPC test was conducted at 12 discrete SOC levels (100%, 95%, 90%, 80%, 70%, 60%, 50%, 40%, 30%, 20%, 10%, and 5%). The experimental rig, as illustrated in Figure 4, consists primarily of a LANHE CT6001A battery test system (Wuhan LAND Electronic Co. Ltd., Wuhan, China), an AT2016B temperature auxiliary system (Wuhan LAND Electronic Co. Ltd., Wuhan, China), an SPX-50 thermostatic chamber (Shaoxing Shangcheng Instrument Manufacturing Co. Ltd., Shaoxing, China), and a host computer. During the experiment, the battery was placed in the thermostatic chamber, with thermocouples attached to the battery surface using electrically insulating tape. The detailed experimental procedures were as follows:
Step 1: The battery was fully charged at 25 °C using the constant current-constant voltage (CC-CV) protocol (0.2C to 4.2 V, then CV until 0.02C) and set aside for 2 h.
Step 2: The ambient temperature was set to the given temperature. Then, the test cell was maintained at the specified temperature for at least 3 h to achieve thermal equilibrium.
Step 3: The M-HPPC test was carried out. As shown in Figure 5, the protocol for each M-HPPC test followed a 5-step protocol as follows: (i) the battery was discharged at a rate of 0.5C for 10 s, followed by a 15 min rest; (ii) the battery was charged at a rate of 0.2C for 25 s, followed by a 15 min rest; (iii) the battery was discharged at a rate of 1C for 10 s, followed by a 15 min rest; (iv) the battery was charged at a rate of 0.2C for 50 s, followed by a 15 -minute rest; and (v) the battery was discharged at a rate of 1C until reaching the next SOC point, followed by 60 min rest;
Step 4: Step 3 was repeated 12 times across all SOC setpoints (100% to 5%).

3.2. Calculation of ECM Parameters

Figure 6 shows an example of the voltage response to a constant-current discharge pulse during the M-HPPC test. The AC segment reflects the instantaneous voltage response to the applied pulse current, and the segment CE corresponds to the relaxation phase that occurs after the current pulse is removed. The ECM parameters can be computed by the following method:
(1) The calculation of the ohmic resistance R0. R0 can be calculated by the instantaneous voltage drop (or rise) when the discharge pulse current (or charging current) is applied or removed. It is calculated as follows:
R 0 = U A U B + U C U D 2 I
where I is the magnitude of the applied pulse current.
(2) The calculation of the OCV and time constants τ1 and τ2. Since the current excitation during the relaxation phase is zero, the voltage response in this stage is a zero-input response, whose mathematical expression is given by Equation (8), as follows:
u = a 0 a 1 e t / τ 1 a 2 e t / τ 2
where a0 is the open circuit voltage, and a1 and a2 are the polarization voltages at the termination of the current pulse excitation. The parameters can be obtained by performing nonlinear least-squares fitting of Equation (8) using MATLAB R2024b’s Curve Fitting Toolbox.
(3) The calculation of polarization resistances R1 and R2. After calculating time constants τ1 and τ2, R1 and R2 can be calculated using the following equation:
R i = a i I ( 1 e T l o a d / τ i ) i = 1 , 2
where Tload is the time taken for the constant discharge current pulse.
Following the above identification method, the equivalent circuit model parameters can be extracted for various temperatures, SOC levels, and discharge rates using data segments 1–4 shown in Figure 5. Furthermore, parameter identification can be extended to data segment 5 to analyze the influence of the pulse width on the model parameters.

4. Parameter Identification for the Thermal Model

4.1. Experimental Setup and Test Procedure for Parameter Identification

As previously mentioned, the parameters to be identified in the thermal model include the heat capacity of the battery (Ccell), the equivalent thermal resistance between the battery and ambient environment ( R c o n v e c t i o n c e l l ), and the equivalent thermal resistance between the tabs and battery (Rconvection). To identify these parameters, the constant-current discharge test was conducted on the test battery at a 1C rate. The experimental setup was identical to that described in the previous section. Under the natural convection heat dissipation condition and 1C-rate discharge, the temperature rise in the battery is minimal. To improve the thermal signal-to-noise ratio, the battery body was wrapped in glass wool to enhance the temperature rise during the experiment. Due to the geometric characteristics of the pouch cells, which exhibit in-plane thermal gradients, several thermocouples were distributed on the battery surface, as shown in Figure 7. The temperature values measured at locations T1–T5 were averaged to represent the cell’s bulk temperature. As previously mentioned in Section 2.2, non-negligible heat flow exists between the battery tabs and the cell body. To quantify the heat flow, T6 and T7 were located on the cell’s positive and negative tabs, respectively. The detailed steps for the thermal parameter characterization experiment at the given temperature were as follows:
Step 1: The test battery was fully charged at 25 °C using the constant current-constant voltage (CC-CV) protocol (0.2C to 4.2 V, then CV until 0.02C) and set aside for 2 h.
Step 2: The ambient temperature was set to 15 °C. Then, the test cell was maintained at the specified temperature for at least 3 h to achieve thermal equilibrium.
Step 3: The test battery was discharged to 3 V at 1C and then rested for 3 h. All thermocouple temperature measurements and battery terminal voltages were recorded throughout the experiment process.

4.2. Calculation of Thermal Model Parameters

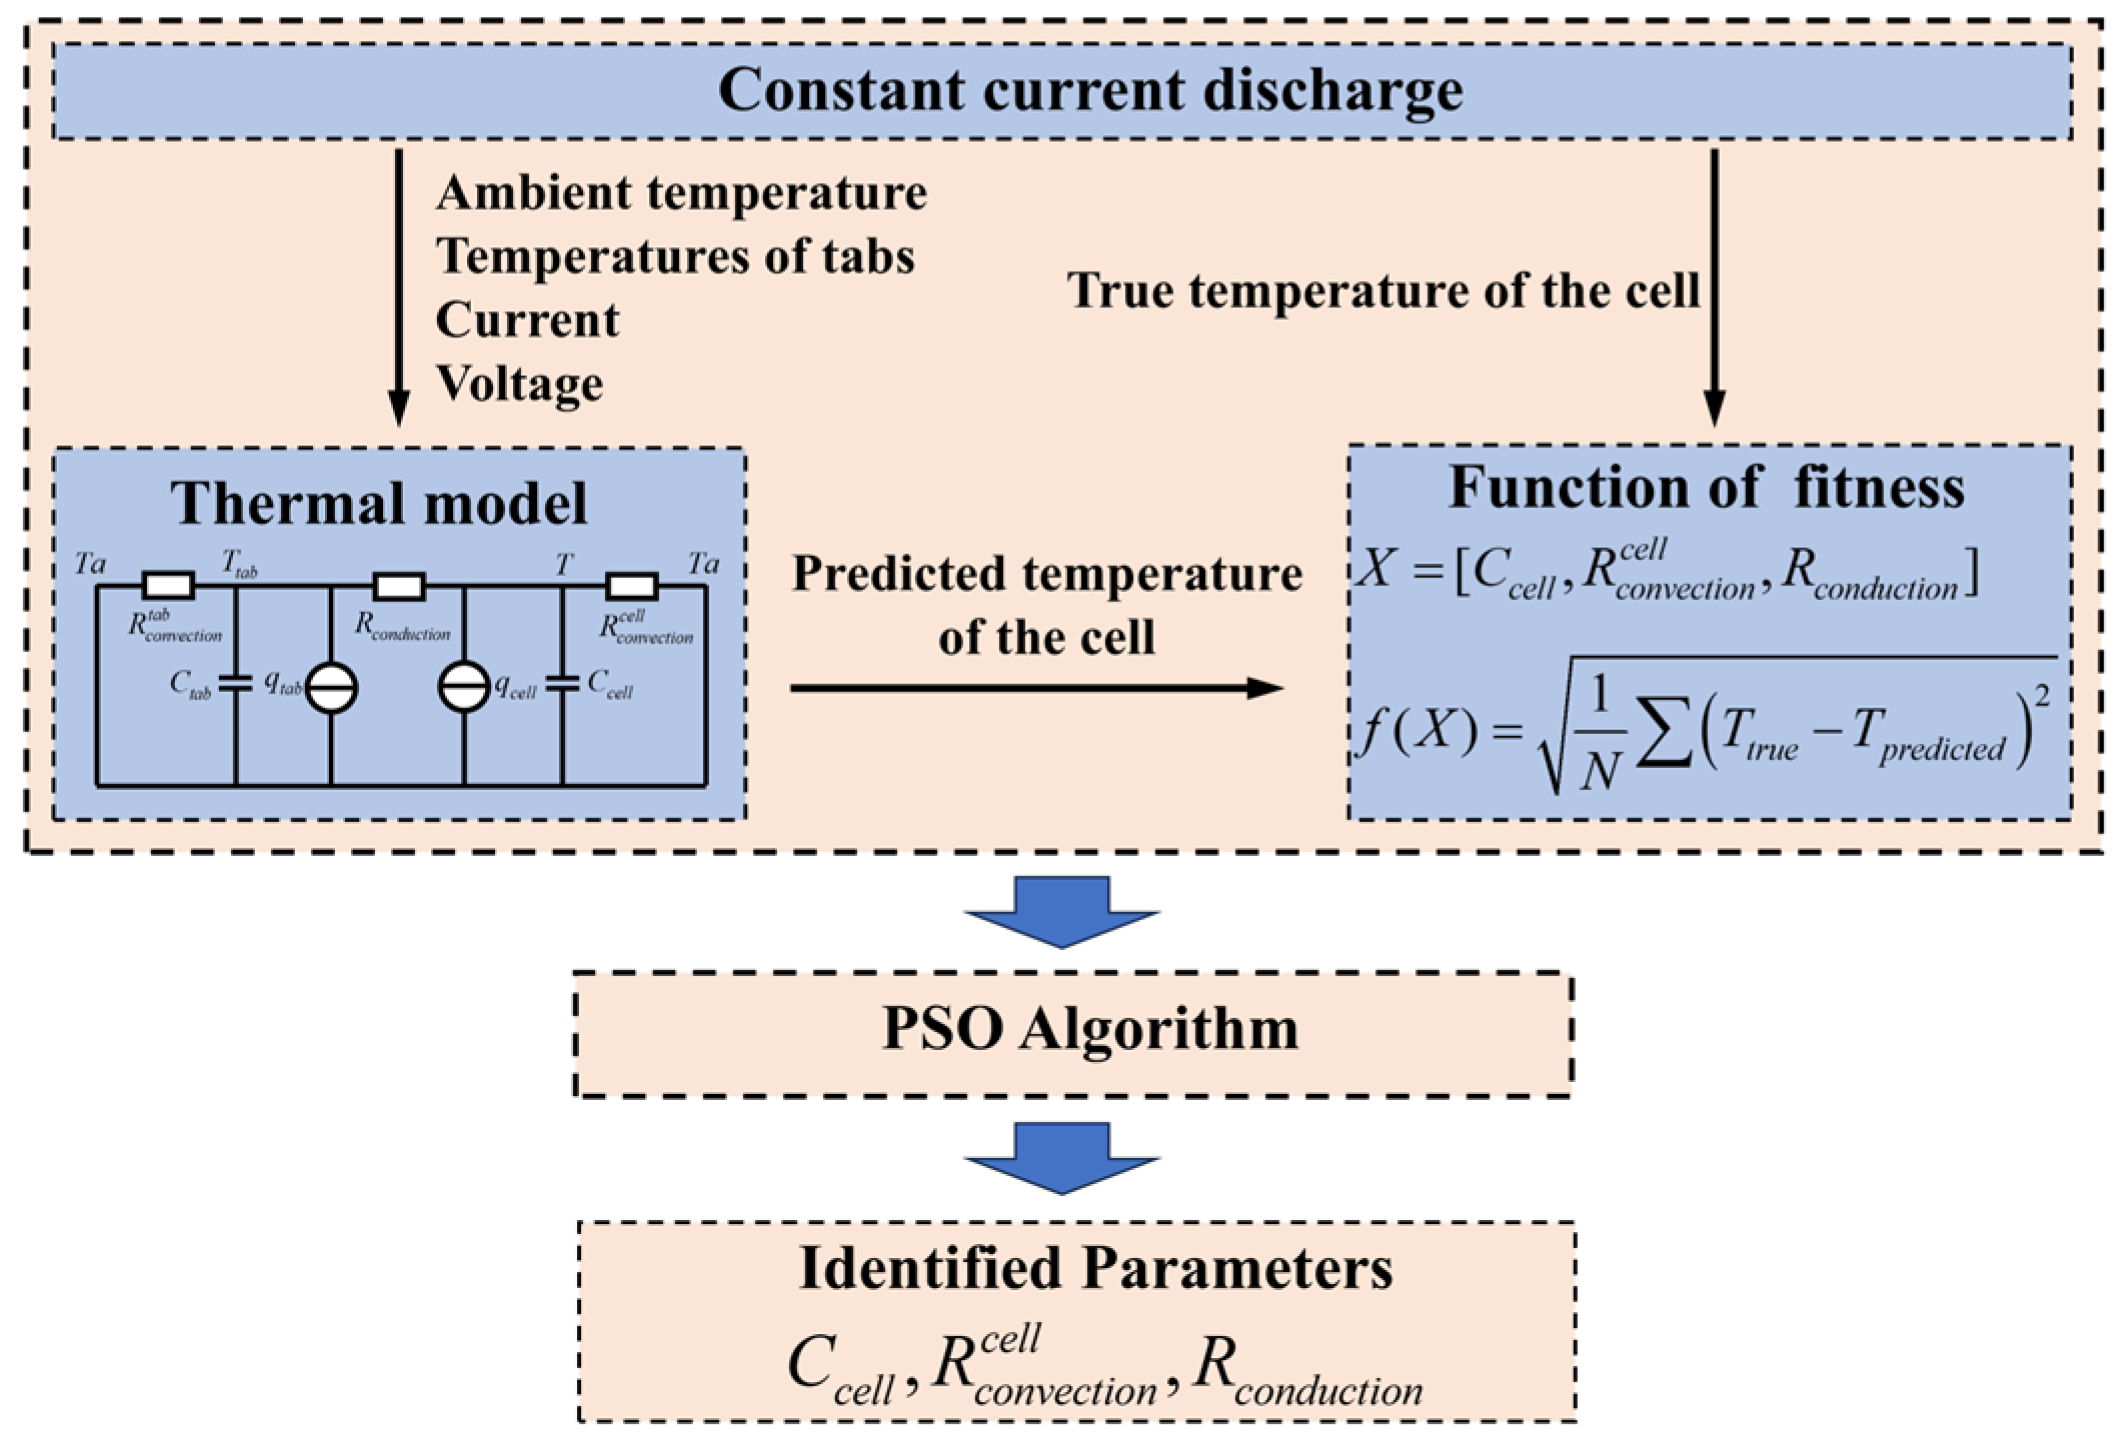
The parameter identification workflow for the thermal model is illustrated in Figure 8. First, the ambient temperature, tab temperature, voltage, and current data from the constant-current discharge test were input into the thermal model to predict the average battery temperature. Then, the fitness function was defined as the root mean square error (RMSE) between predicted and actual mean temperatures. Finally, the particle swarm optimization (PSO) algorithm was employed to identify the model parameters [44]. The number of particles is set to be 200, and the maximum number of iterations is 150 in this study.

4.3. Specific Heat Capacity Measurement Experiment for the Sodium-Ion Battery

This study employs an adiabatic calorimetry method with heat loss compensation to measure the specific heat capacity of sodium-ion batteries. As illustrated in Figure 9, the experimental setup for measuring the specific heat capacity consists of an acrylic vacuum chamber (Suzhou Braun Intelligent Equipment Technology Co. Ltd., Suzhou, China), a temperature data logger, a DC power supply, and a polyimide electric heating film (220 mm × 140 mm) (Zhenglong Electric Heating Technology Co. Ltd., Yancheng, China). During the experiment, the polyimide heating film was sandwiched between two identical test battery cells to provide uniform Joule heating. The entire assembly was then thermally insulated with fiberglass wrapping and housed within the acrylic vacuum chamber to establish near-adiabatic conditions. Furthermore, to minimize radiative heat transfer during testing, several pieces of aluminum foil were posted on the inner walls of the vacuum box. Four T-type thermocouples were positioned on the test battery surfaces as illustrated in Figure 9. Two were mounted at the heating surface, and the other two were placed on the opposing side. The detailed steps for measuring the specific heat capacity of the test cell are as follows:
Step 1: The SOC of the test cells was preconditioned to 50% (the influence of SOC on battery specific heat capacity is negligible), with a vacuum chamber air pressure of 90 kPa below atmospheric pressure and an ambient temperature of 25 °C.
Step 2: The heating power of 15 W was selected to heat the test cells. During the heating process, temperature measurements from all thermocouples were recorded at a 1 Hz sampling frequency and averaged to approximate the battery’s bulk temperature.
Step 3: When the temperature of the battery’s external surface reached about 40 °C, the heating was terminated. Then, the cells were naturally cooled down.
Figure 10 shows the battery’s average temperature trajectory during periods of heating and cooling down. When t < t1, the cell was heated and then cooled down naturally. Based on the conservation of energy, the temperature change during the period of heating follows Equation (10), expressed as follows:
c m d T d t = q q l o s s
where c is the specific heat capacity of the cell, T is the average temperature during the heating period, q is the heating power, and qloss is heat loss due to a non-ideal adiabatic environment. To improve the calculation accuracy of the specific heat capacity, the heat loss needs to be calibrated. The heat loss power during the cooling stage is calculated as follows:
q l o s s = c m d T d t
where T′ is the average temperature during the cooling down period. At t0 and t2, the temperature difference between the battery and ambient environment is identical, resulting in approximately equal heat loss power (qloss,t0 = qloss,t2). The specific heat capacity can be calculated by Equation (12), which is derived by combining Equation (10) and Equation (11).
c = q m / ( d T d t d T d t )
where the temperature change rate dT/dt during the heating stage and the temperature change rate dT′/dt during the cooling stage can be determined through the experiment mentioned above.

5. Parameter Identification Results and Model Performance Validation

5.1. Parameter Identification Results of ECM

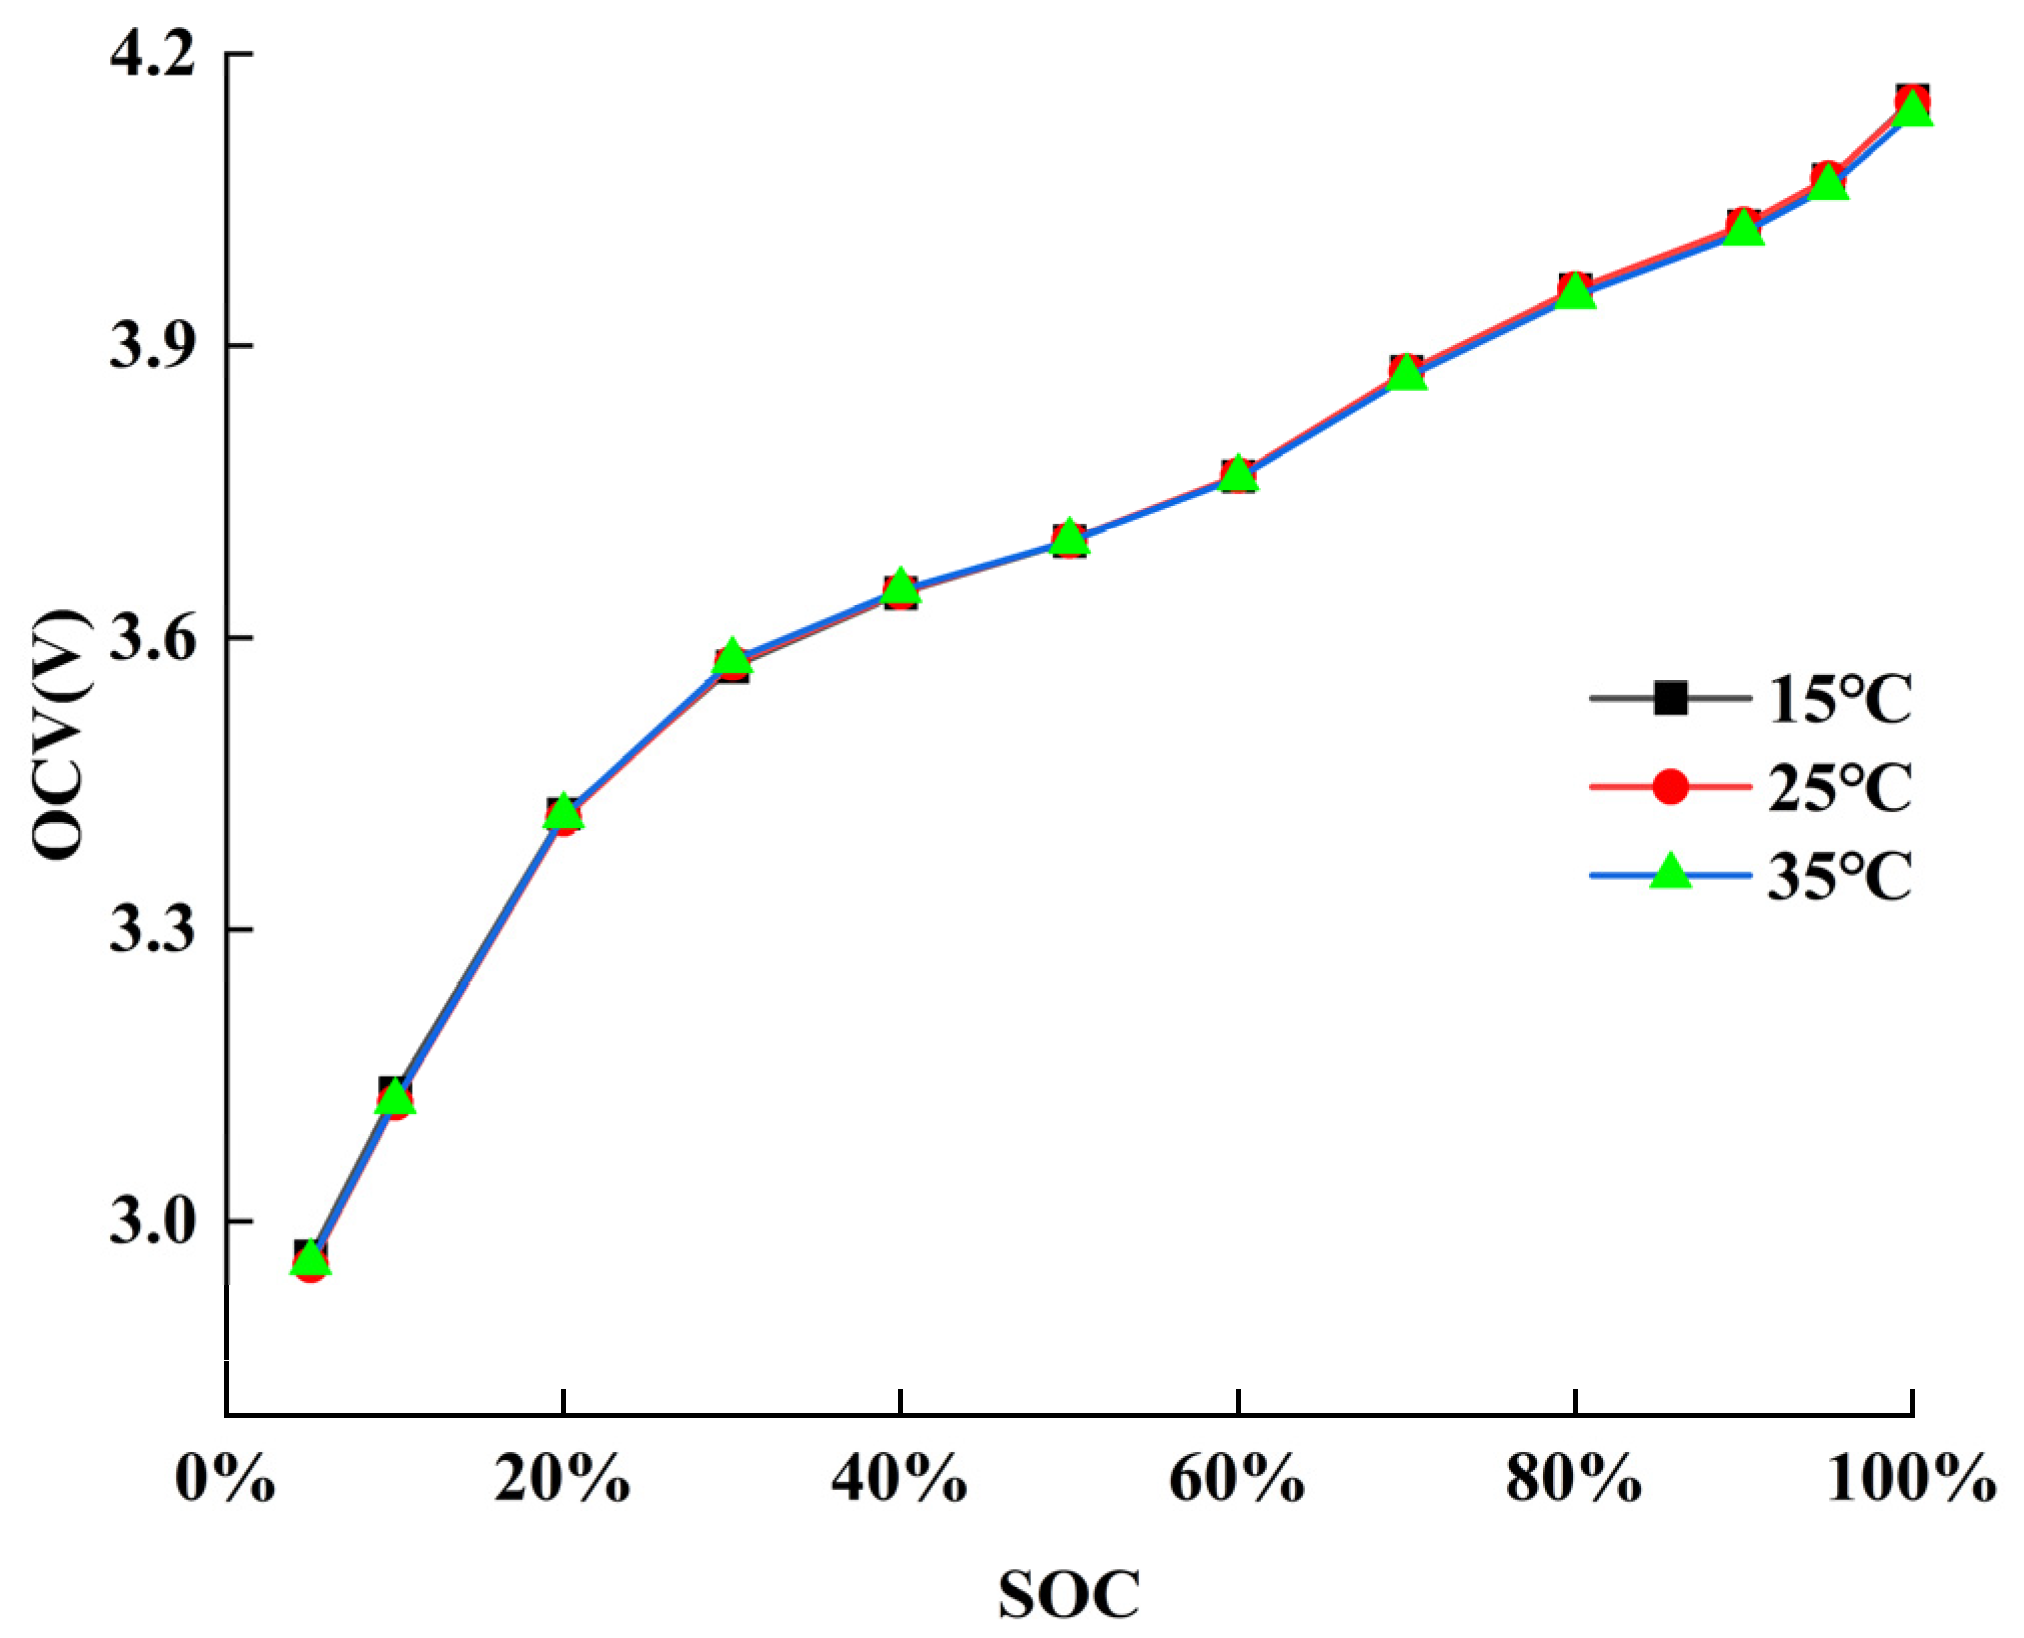
As shown in Figure 11, the identified open-circuit voltage (OCV) demonstrates minimal temperature dependence. Consequently, temperature effects on OCV can be neglected in the equivalent circuit model.
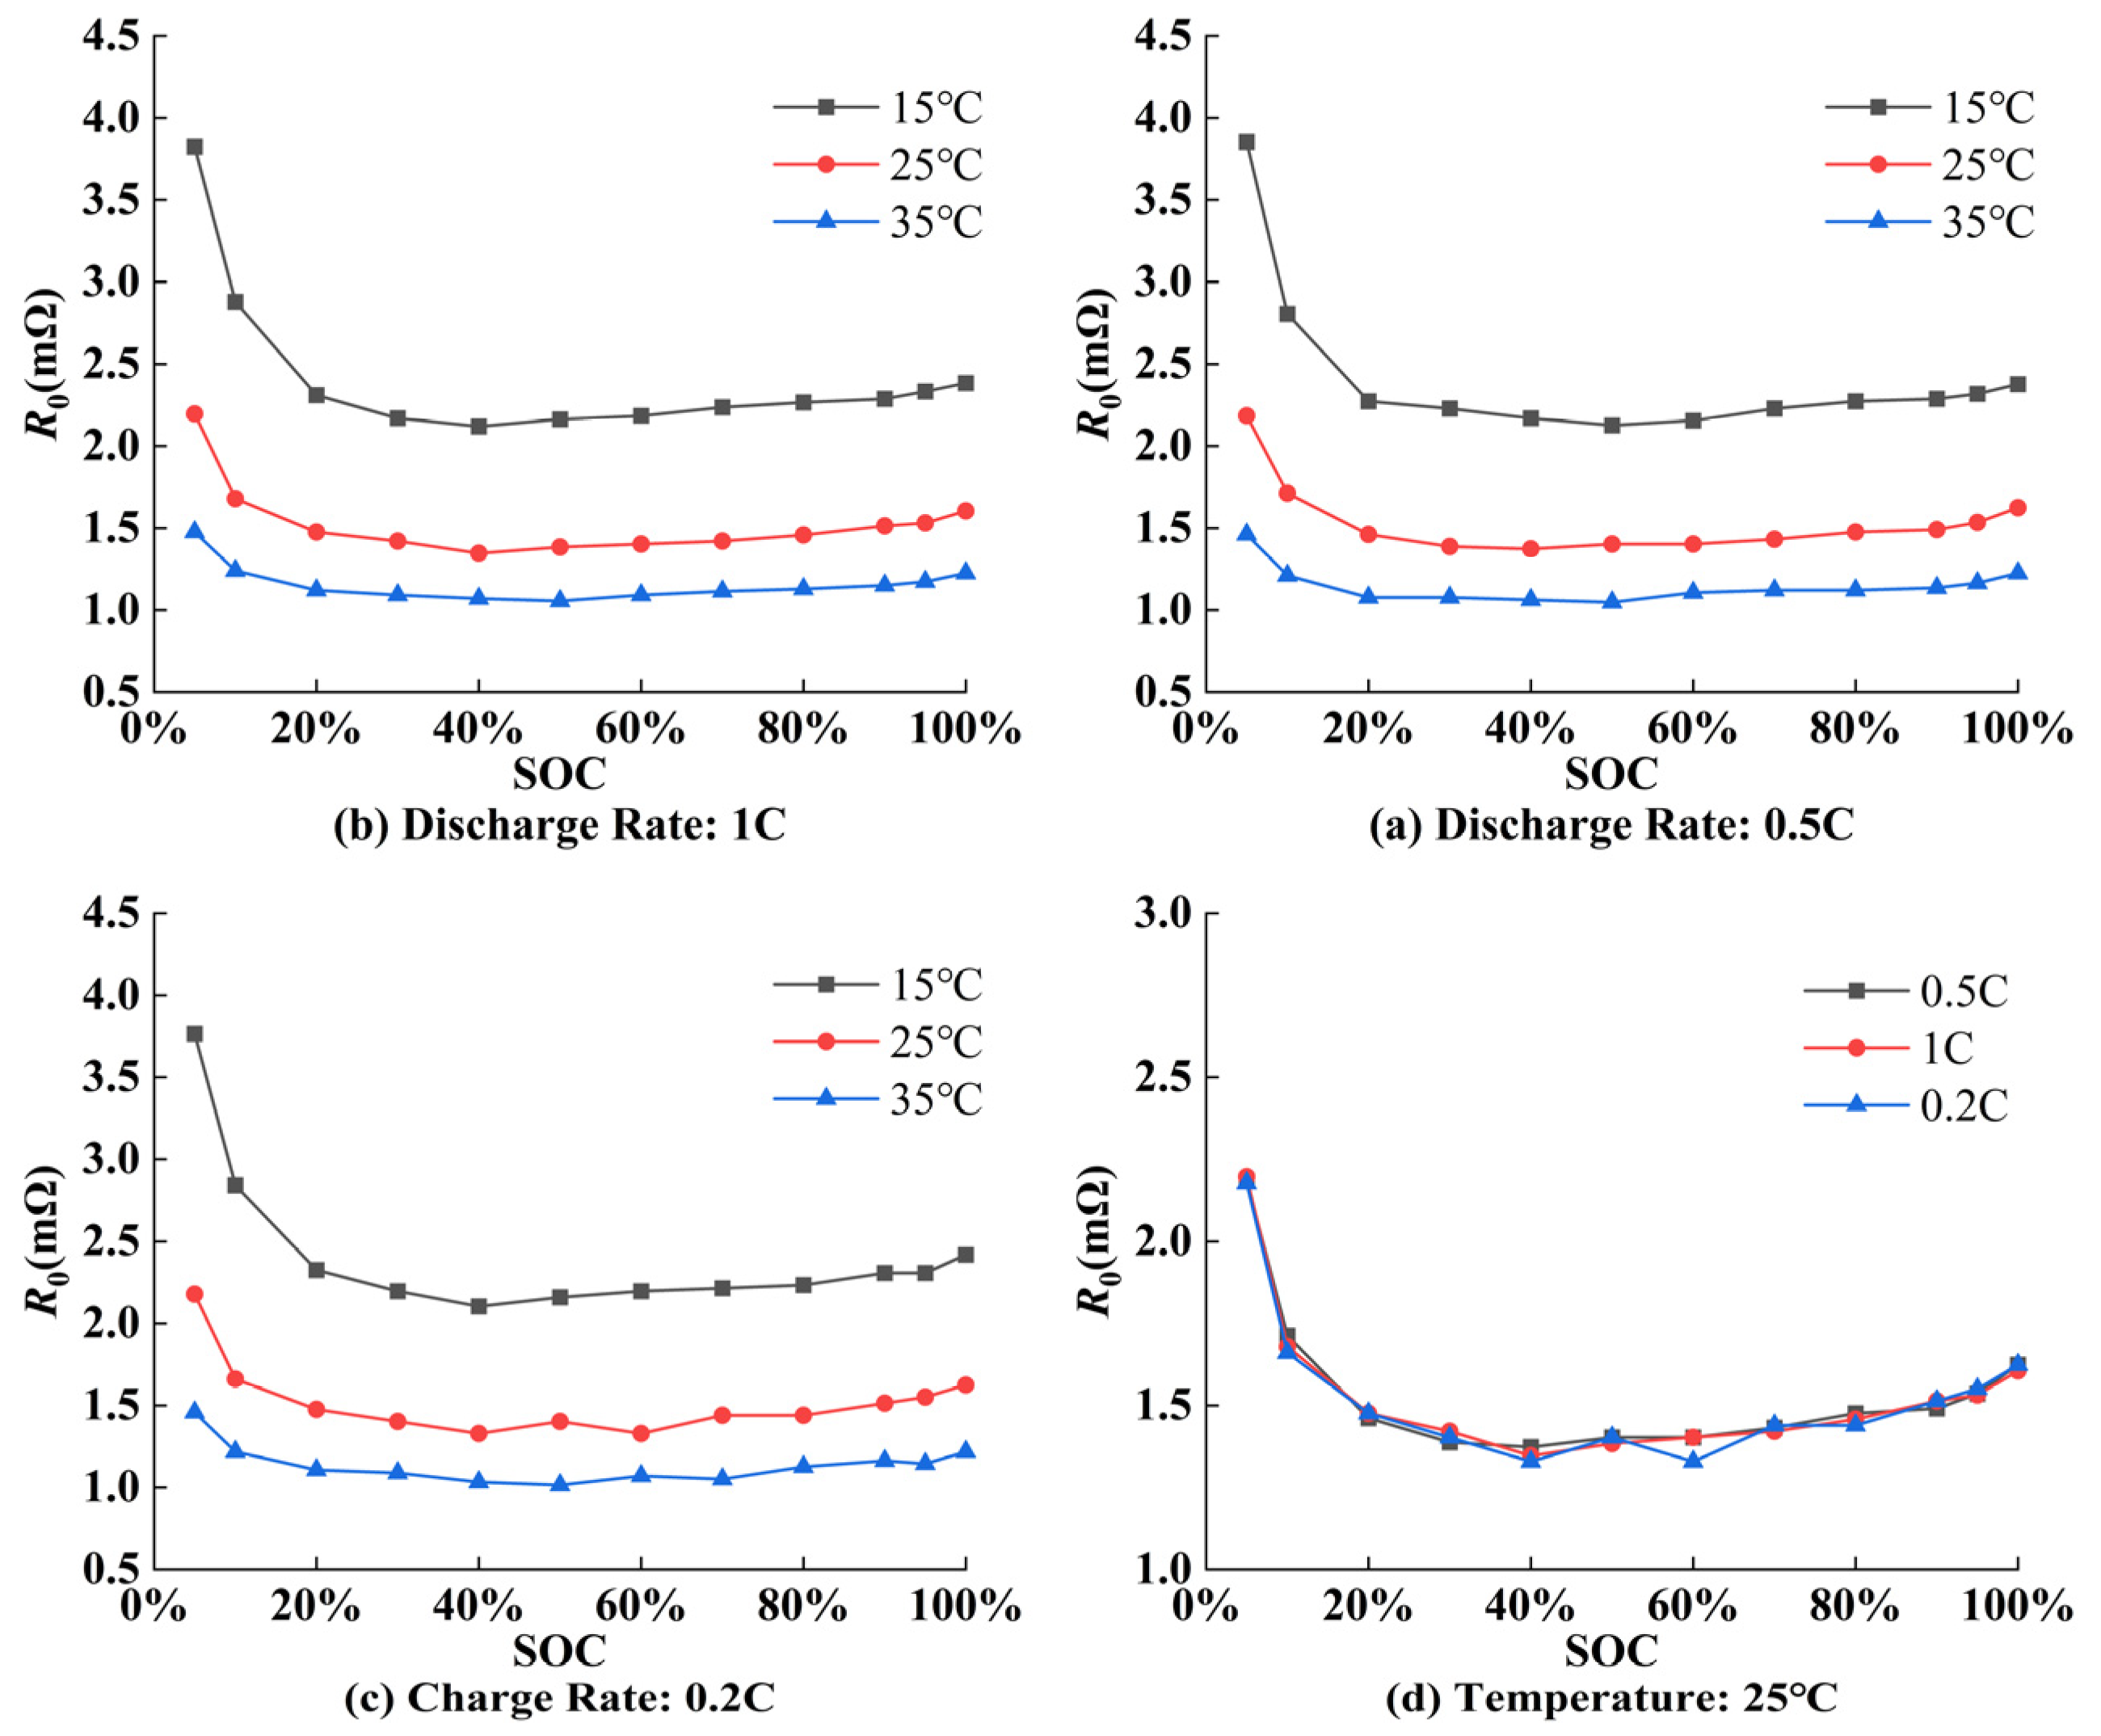
As shown in Figure 12, the identified ohmic resistance (R0) exhibits strong dependence on both SOC and temperature. R0 increases significantly at low temperatures and when SOC drops below 20%, showing similar trends to lithium-ion batteries. However, discharge rates and current direction show negligible effects on R0.
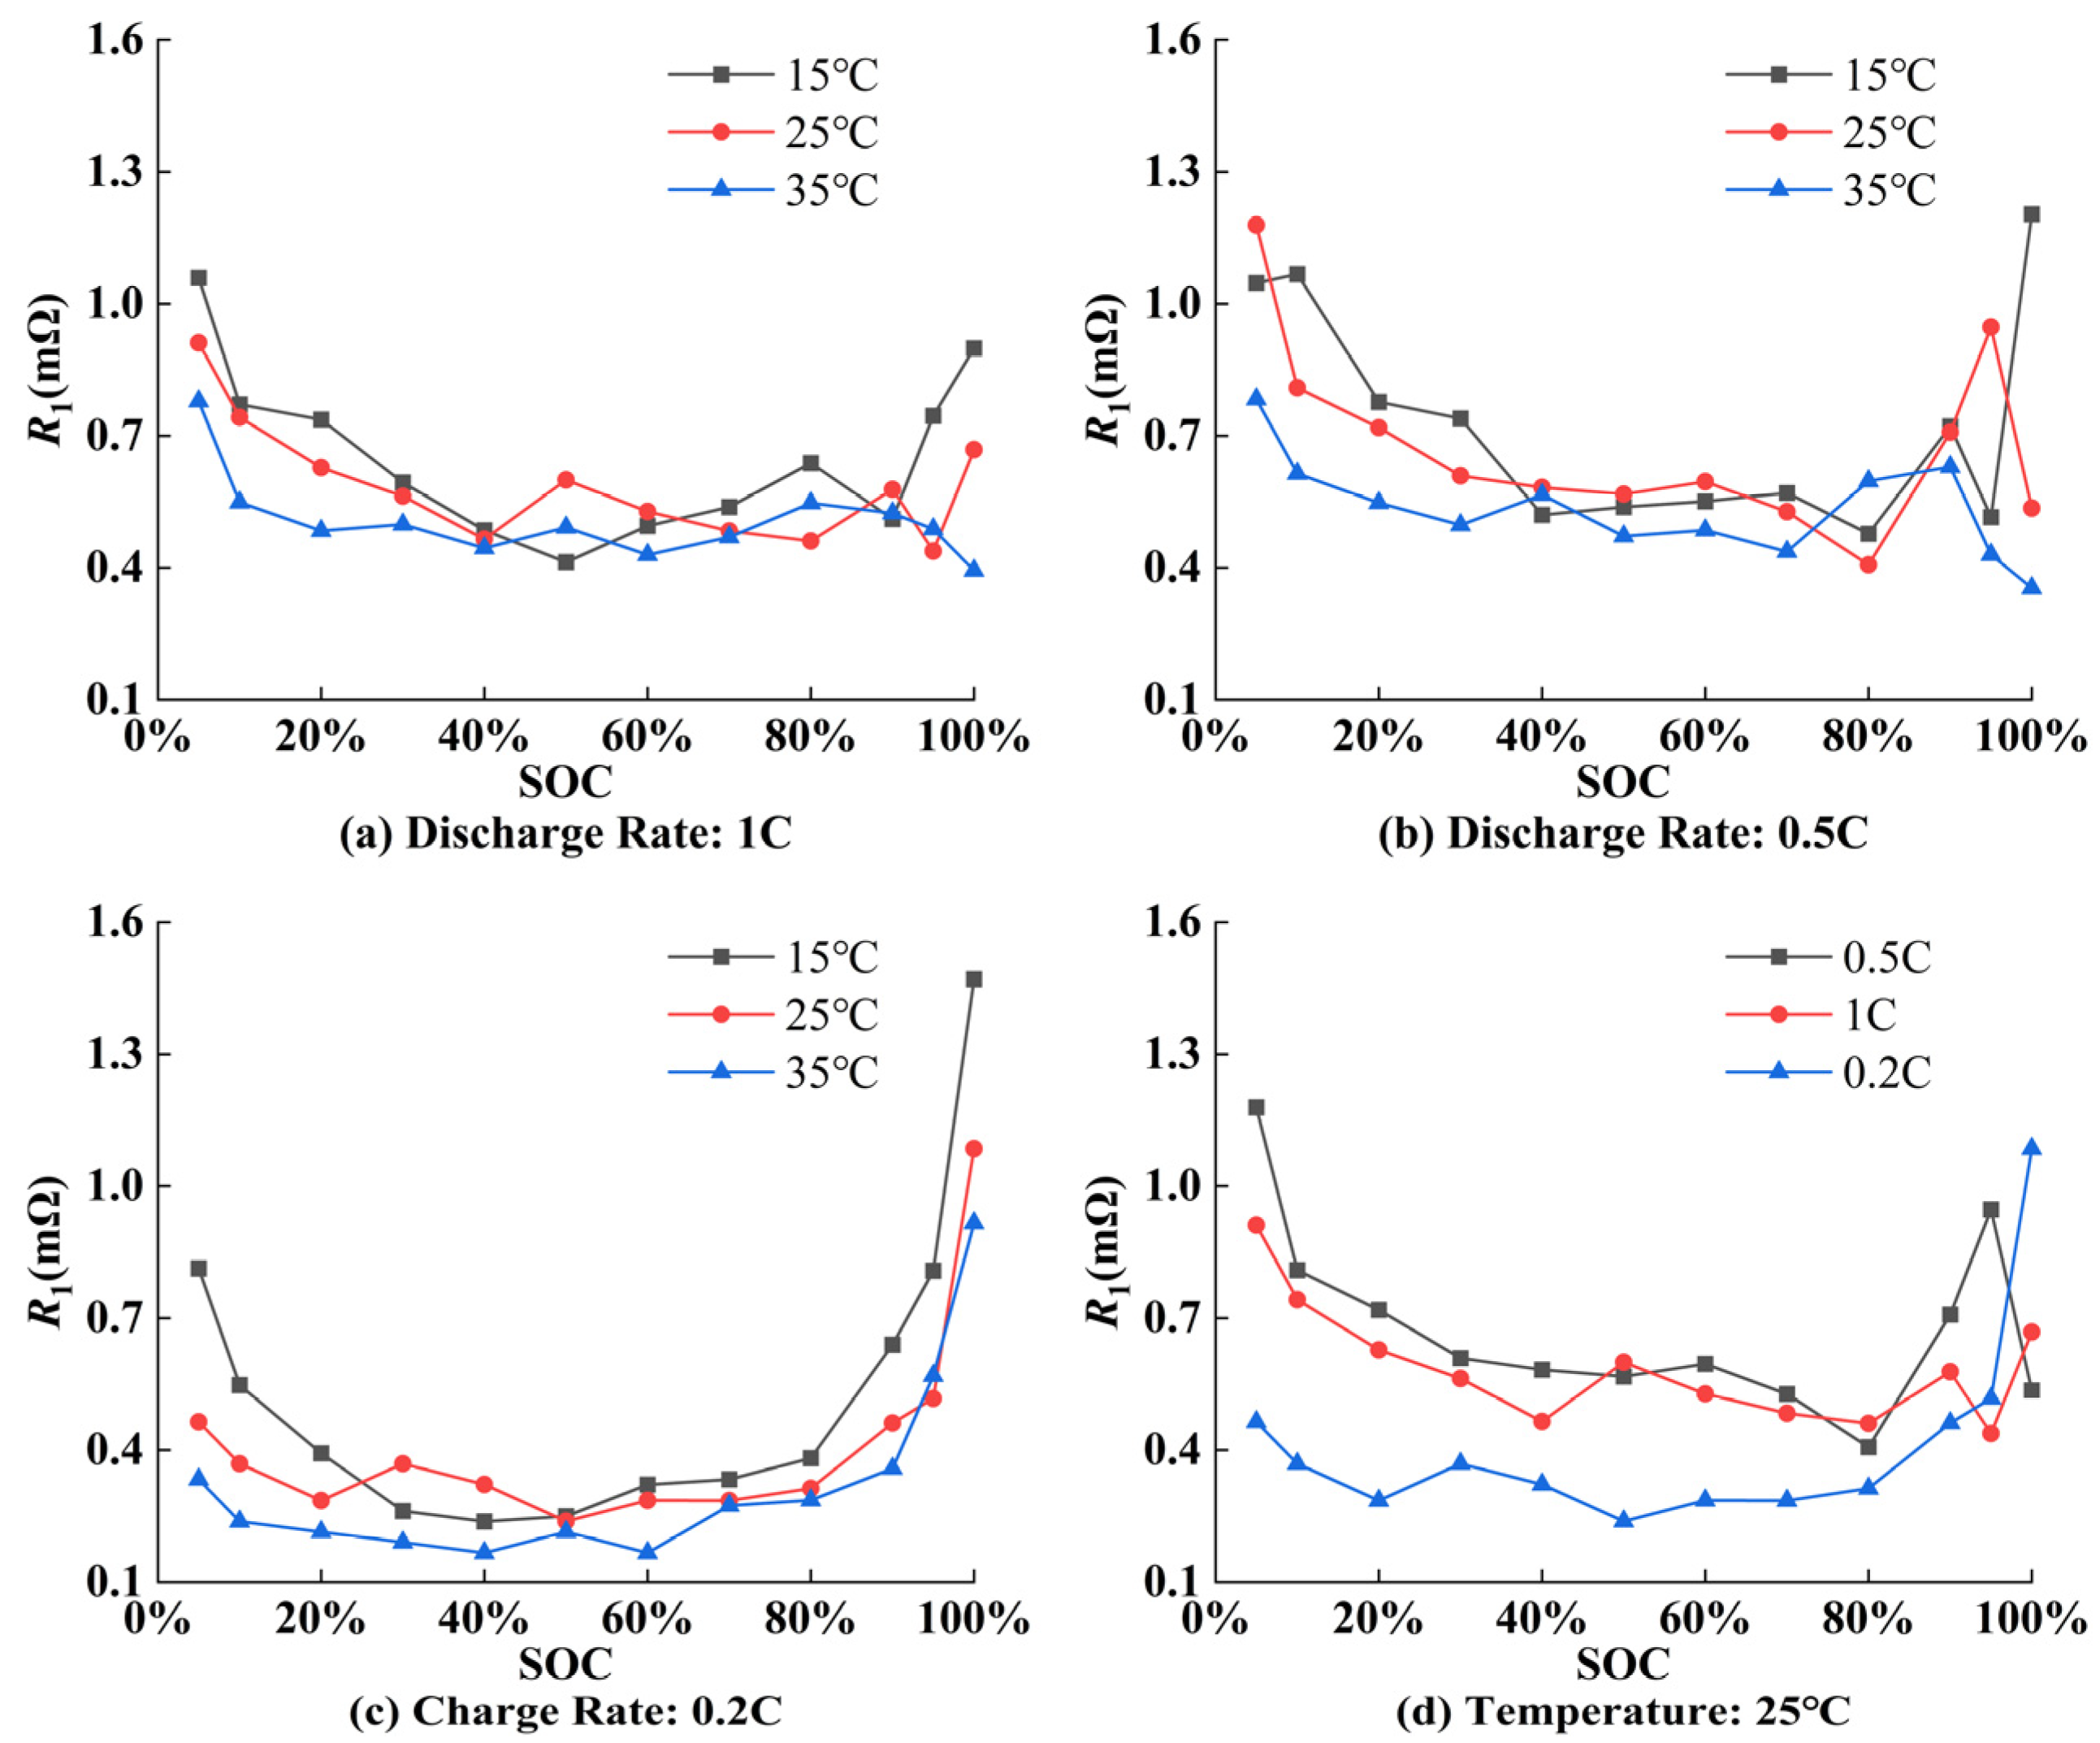
The identification results for polarization resistance R1 are depicted in Figure 13. It is evident that the influence of temperature on polarization resistance R1 is relatively minor. Furthermore, there is a notable increase in polarization resistance R1 at both low and high SOC ranges. Additionally, the current direction exerts a significant influence on polarization resistance R1, with the resistance during discharge being higher than during charging. The identification results for polarization resistance R2 are illustrated in Figure 14. It is apparent that temperature has minimal impact on polarization resistance R2. Similarly, the current direction has a considerable effect on polarization resistance R2. When constructing an equivalent circuit model, it is essential to consider whether the battery is in a charging or discharging state at that time.
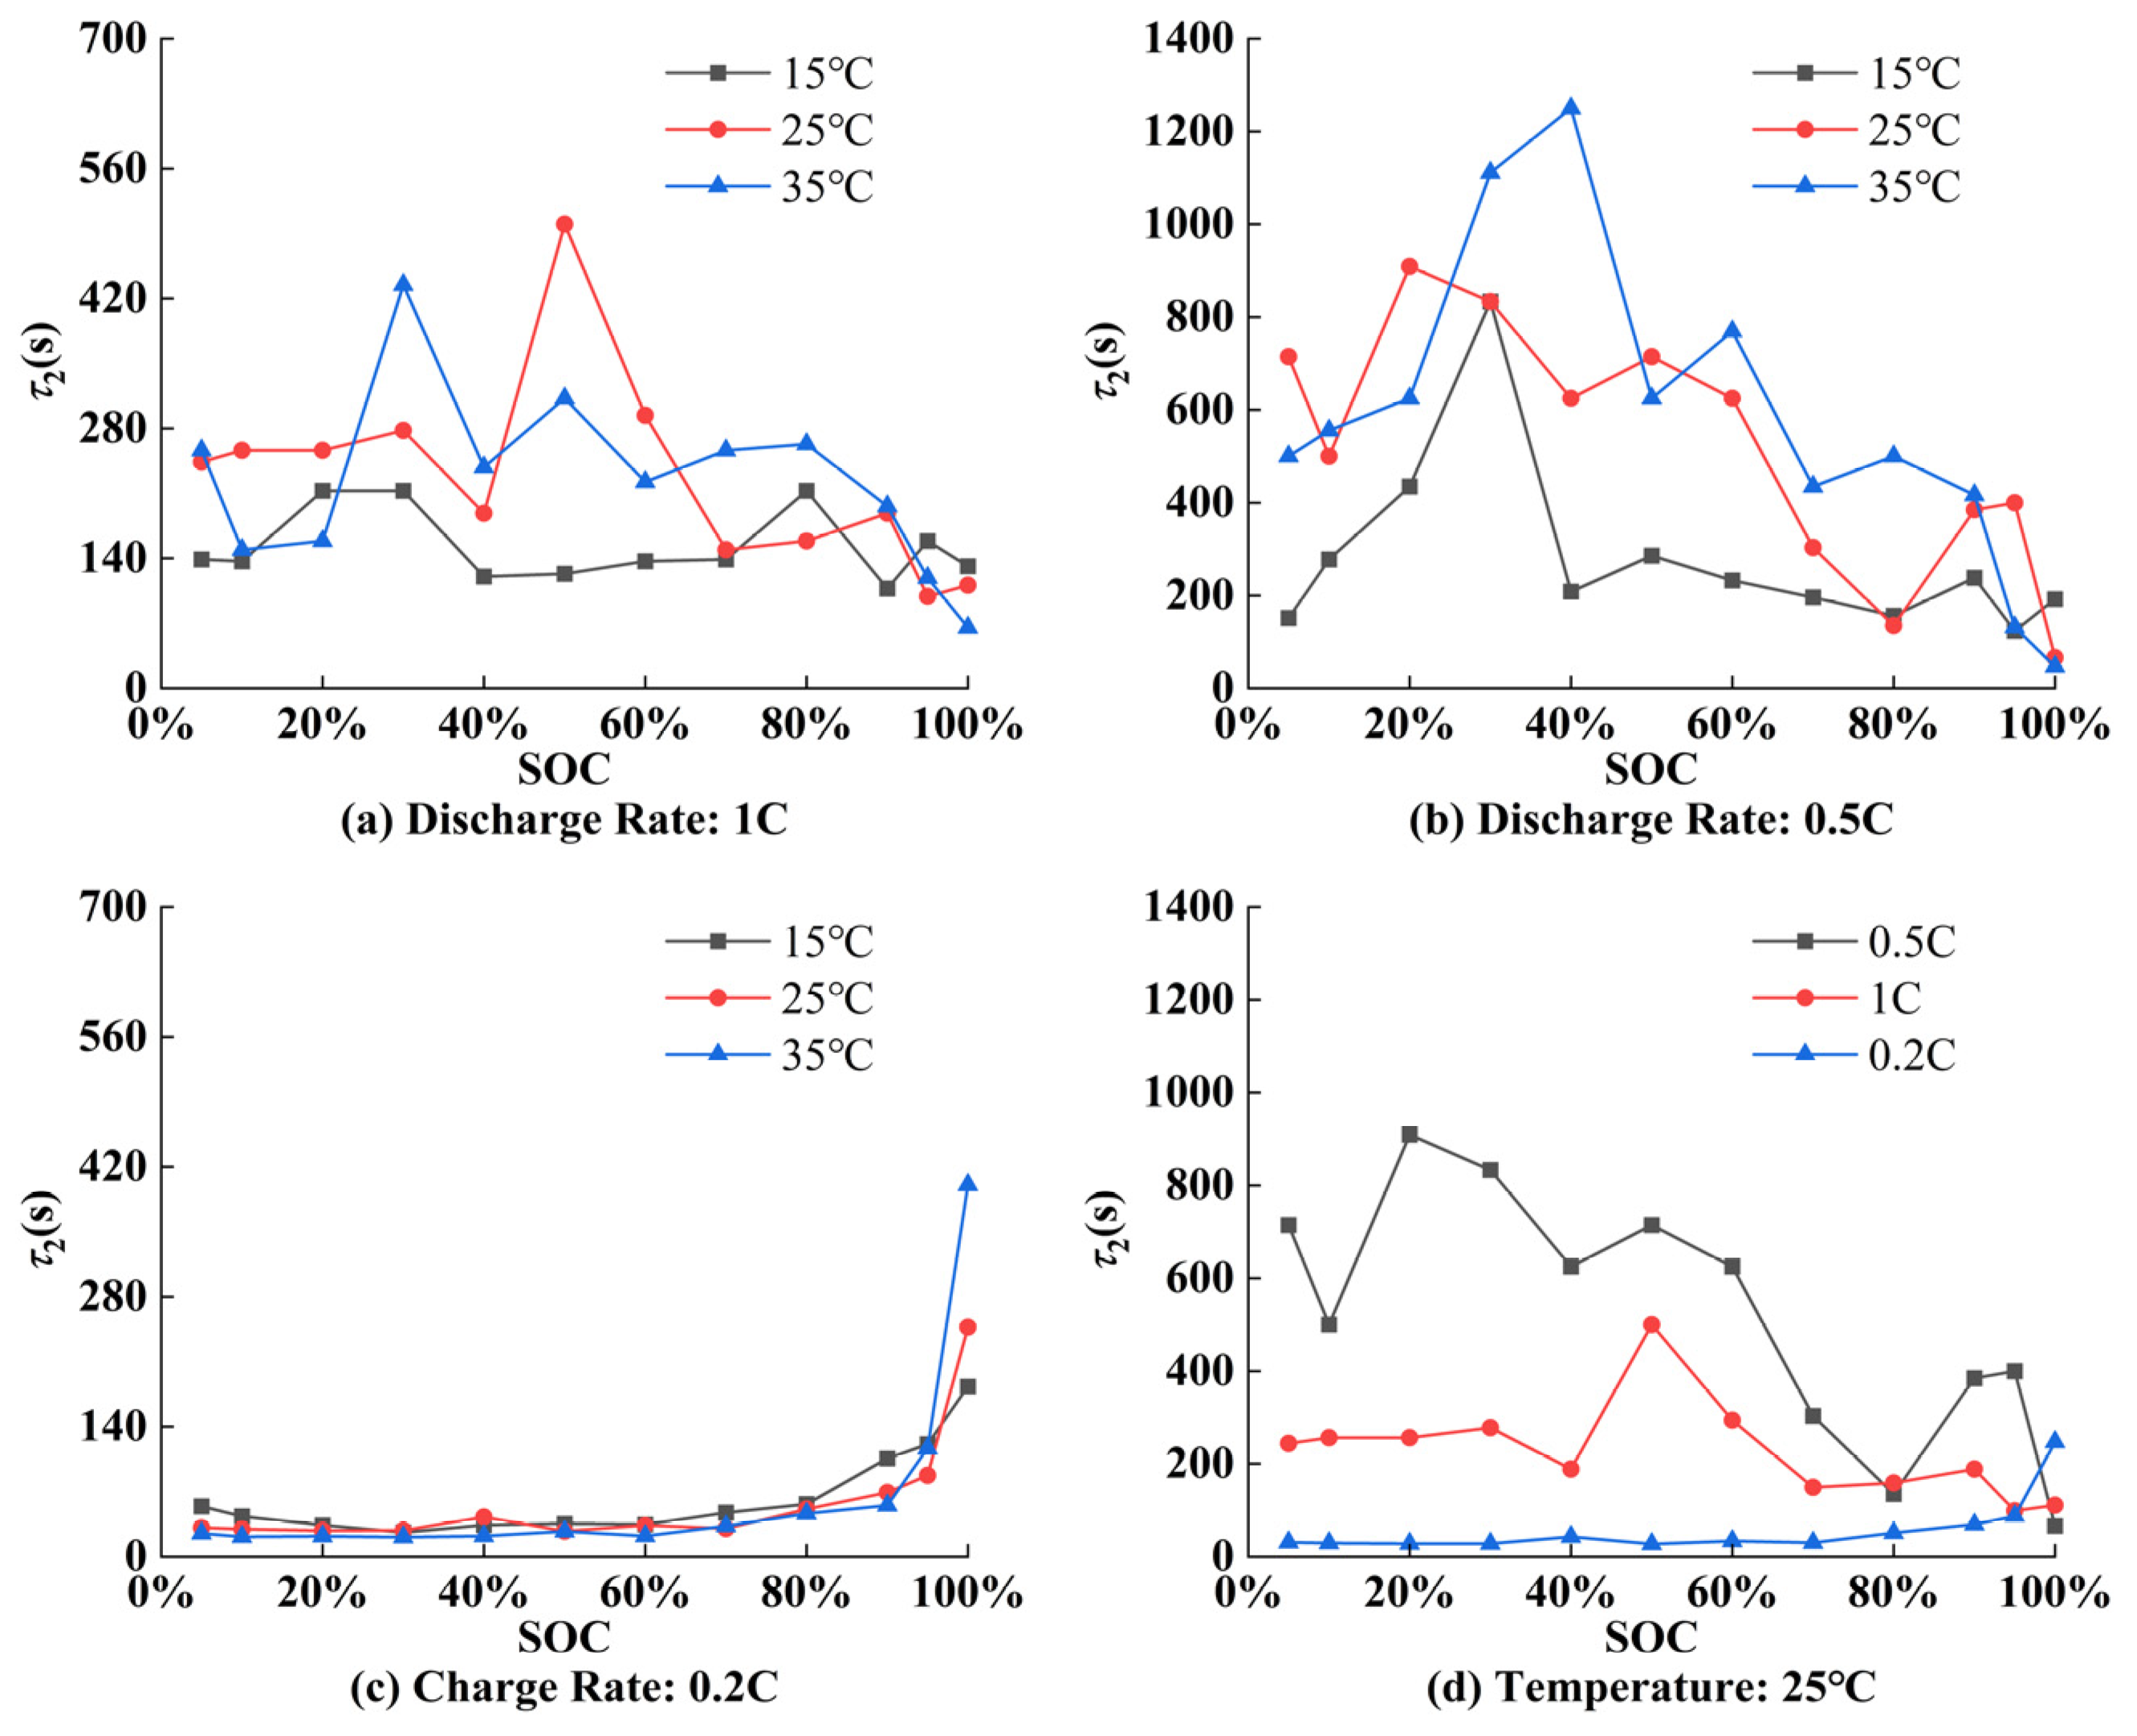
The identification results for time constant τ1 are shown in Figure 15. It is evident that the temperature has a minimal impact on time constant τ1. In contrast, the current direction exerts a significant influence. Specifically, time constant τ1 during the discharging process is greater than that during the charging process. Similarly, Figure 16 reveals that time constant τ2 shows weak temperature sensitivity but strong current-direction dependence.
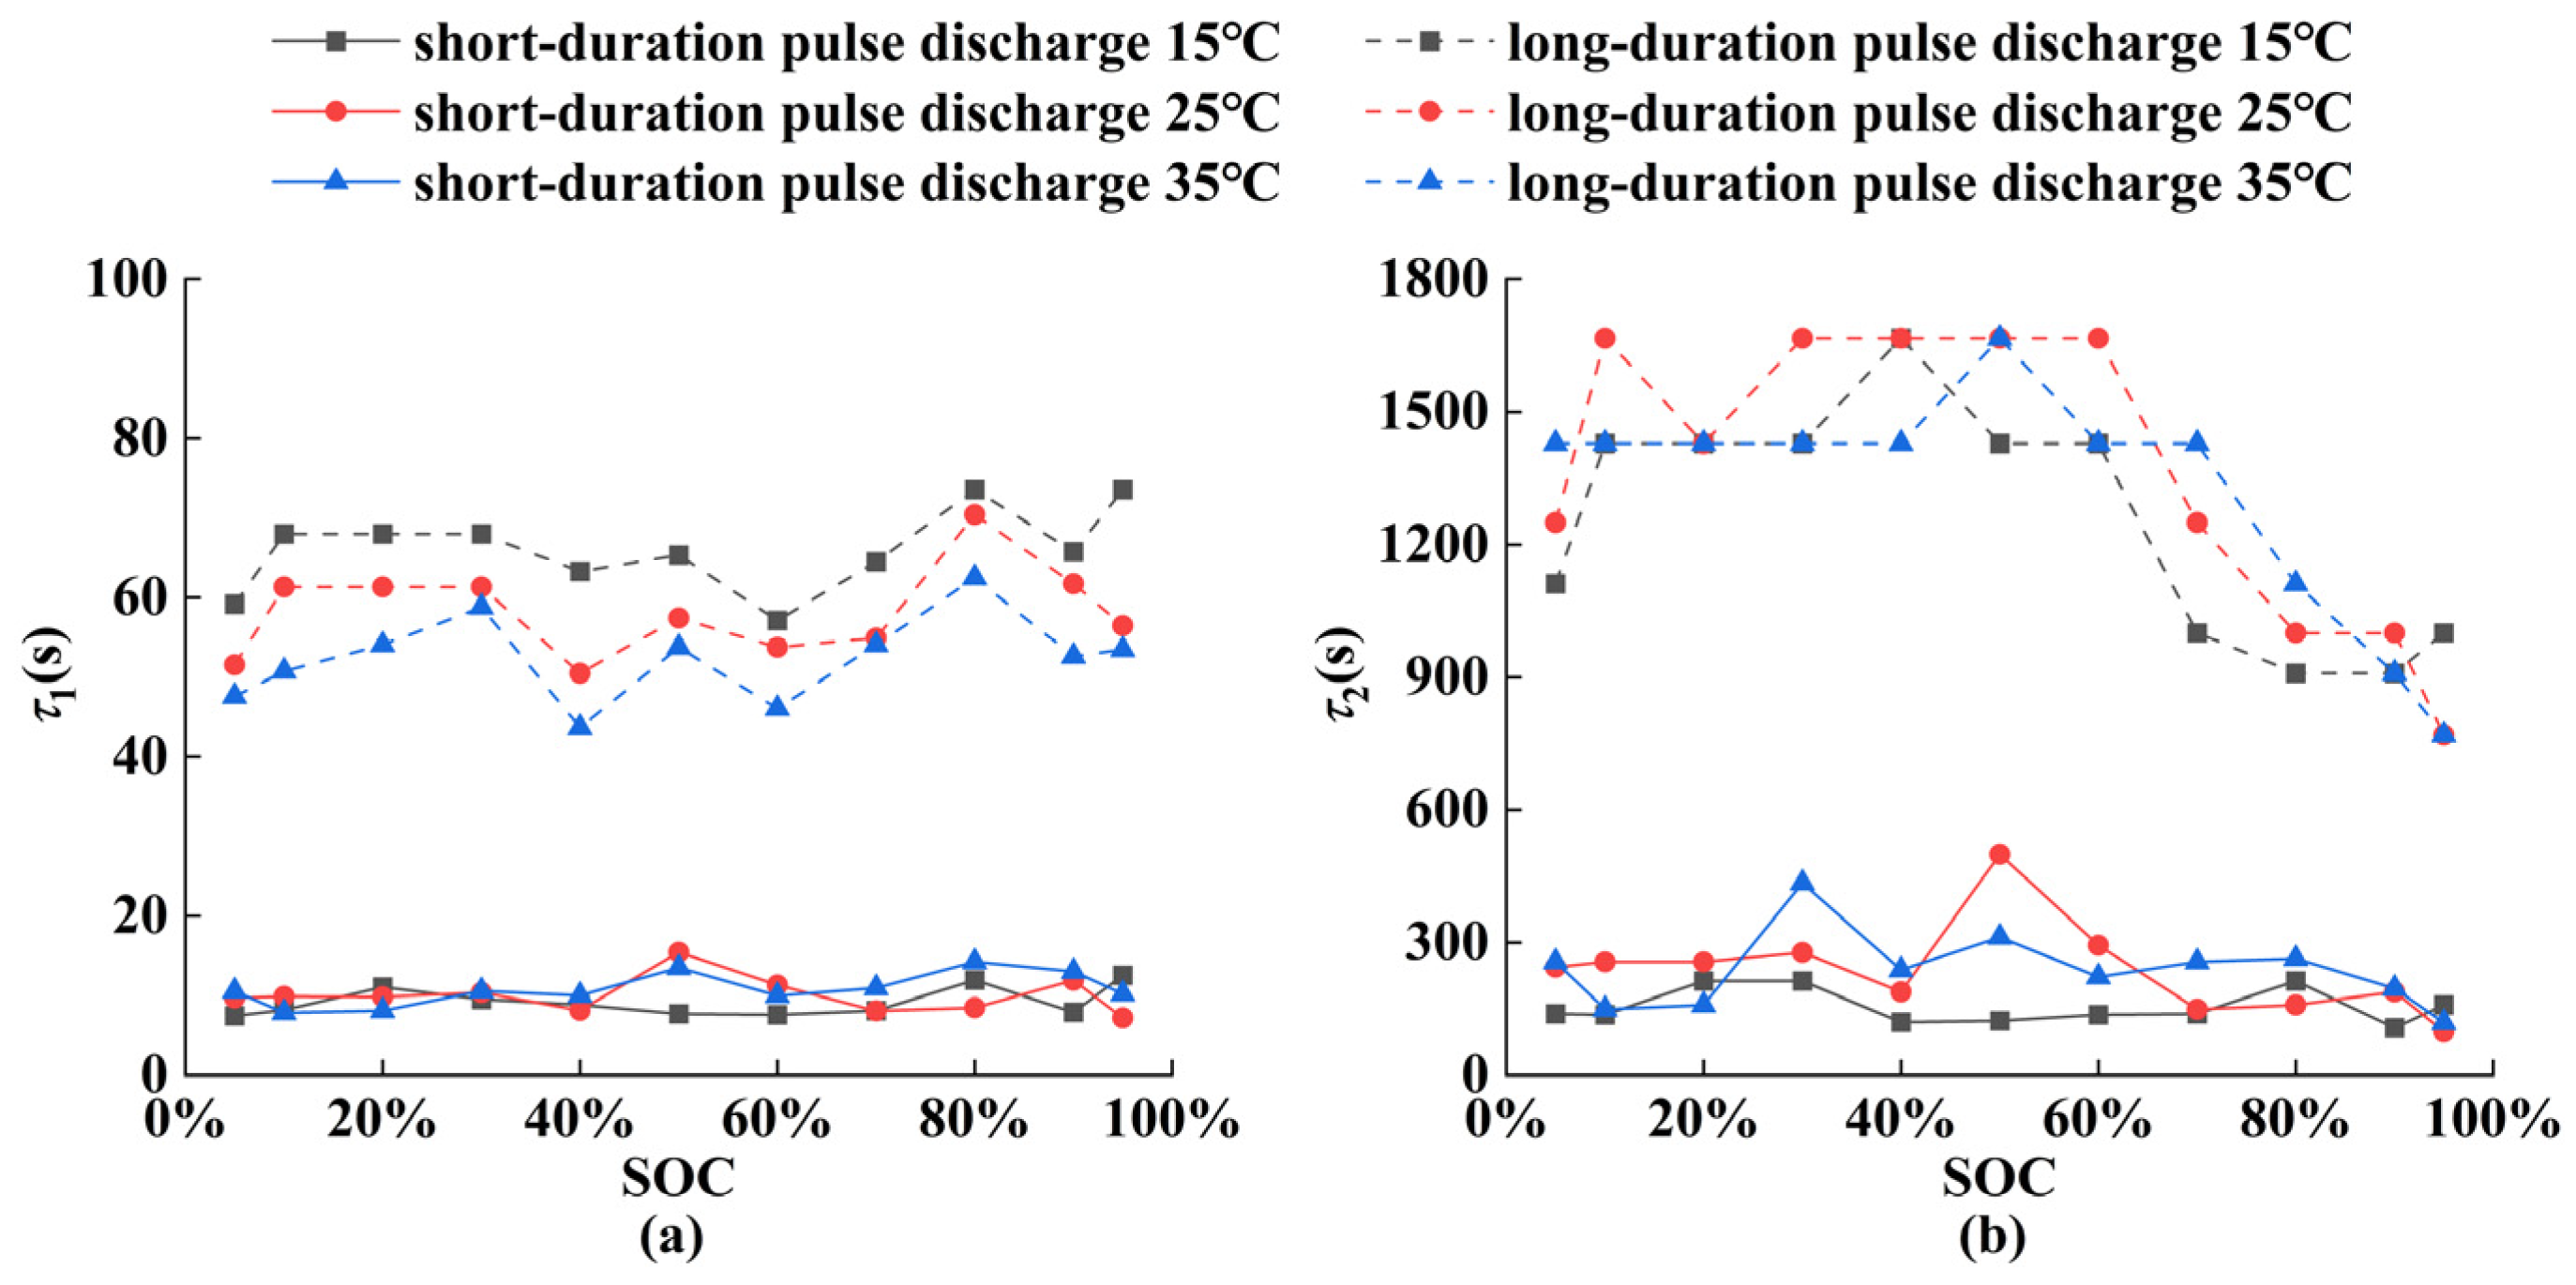
The effect of current pulse duration on time constants is shown in Figure 17. Compared to short-duration discharge, the time constants increase significantly after long-duration discharge. Therefore, this study proposed a modified ECM with a parameter-switching scheme based on the conventional 2-RC ECM. The model can dynamically select appropriate time constants according to discharge duration. The parameter switching scheme is as follows:
τ i = τ i , s t T t h τ i , l t > T t h   i = 1 , 2
where τi,s is the time constant after short-duration pulse discharge, τi,l is the time constant after long-duration pulse discharge, and Tth is the discharge duration threshold.
As described in Section 3.1, the shortest discharge pulse duration in the M-HPPC test is 10 s, while the longest discharge pulse duration is 360 s (the time required to discharge 10% SOC at a 1C rate). Therefore, the range of the discharge duration threshold in this study was set from 11 s to 360 s. When the Tth exceeds 360 s, parameter switching no longer takes effect. Based on this, a reasonable discharge duration threshold can be further determined by comparing the impact of different discharge duration thresholds on model accuracy.

5.2. Voltage Prediction Results Under M-HPPC Conditions at Various Temperatures

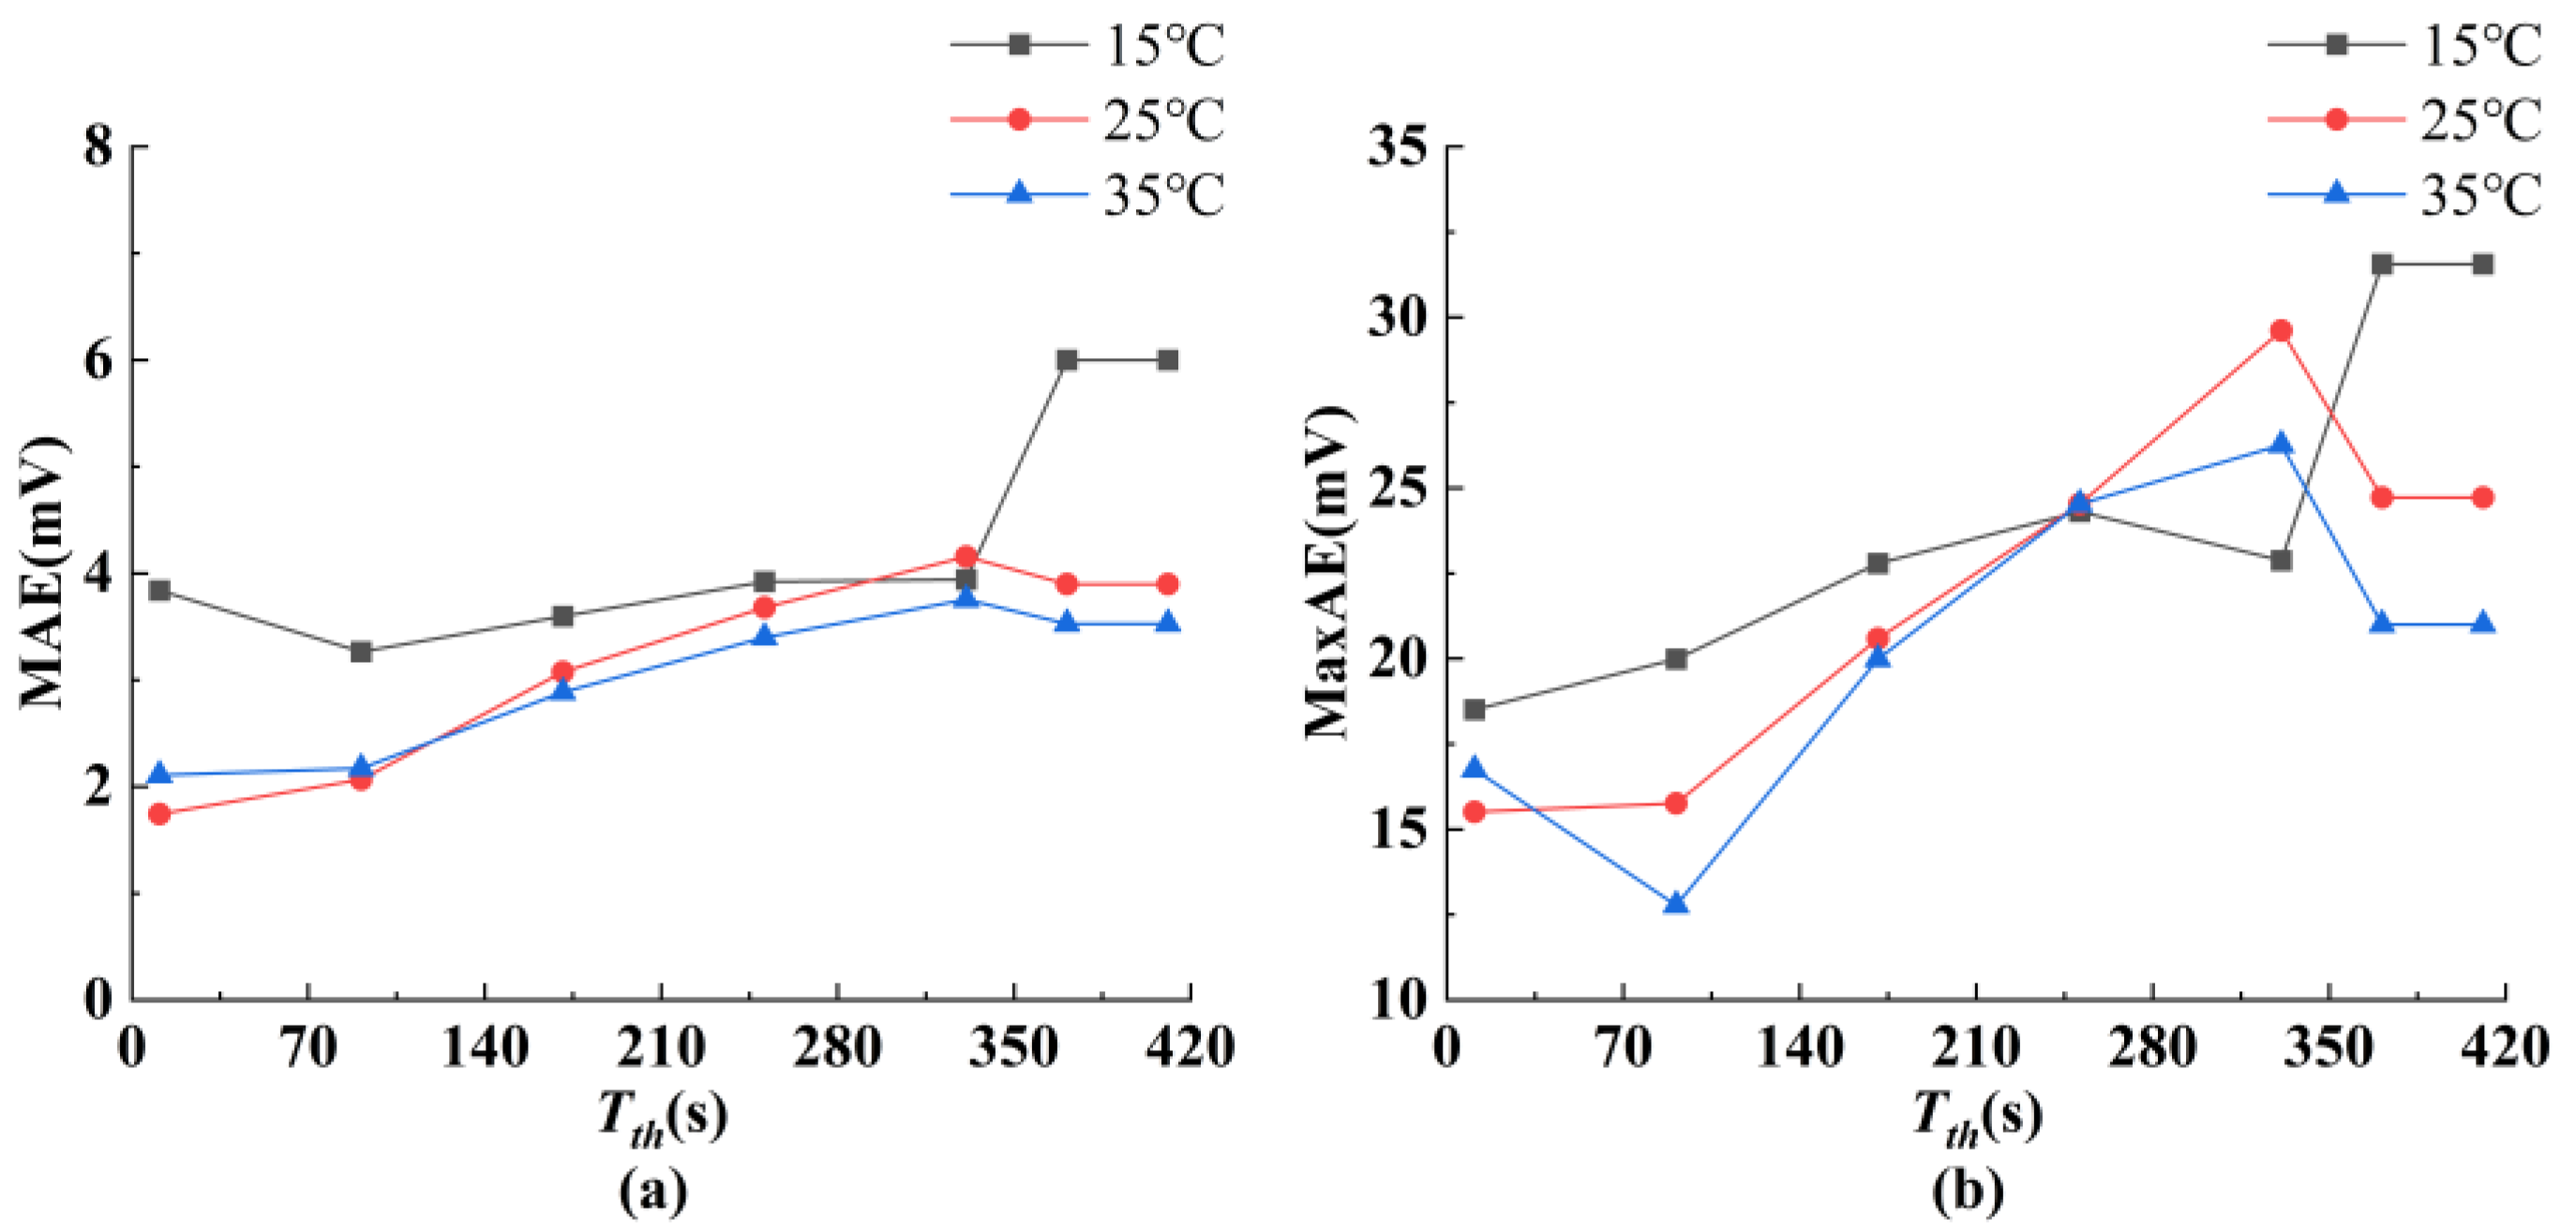
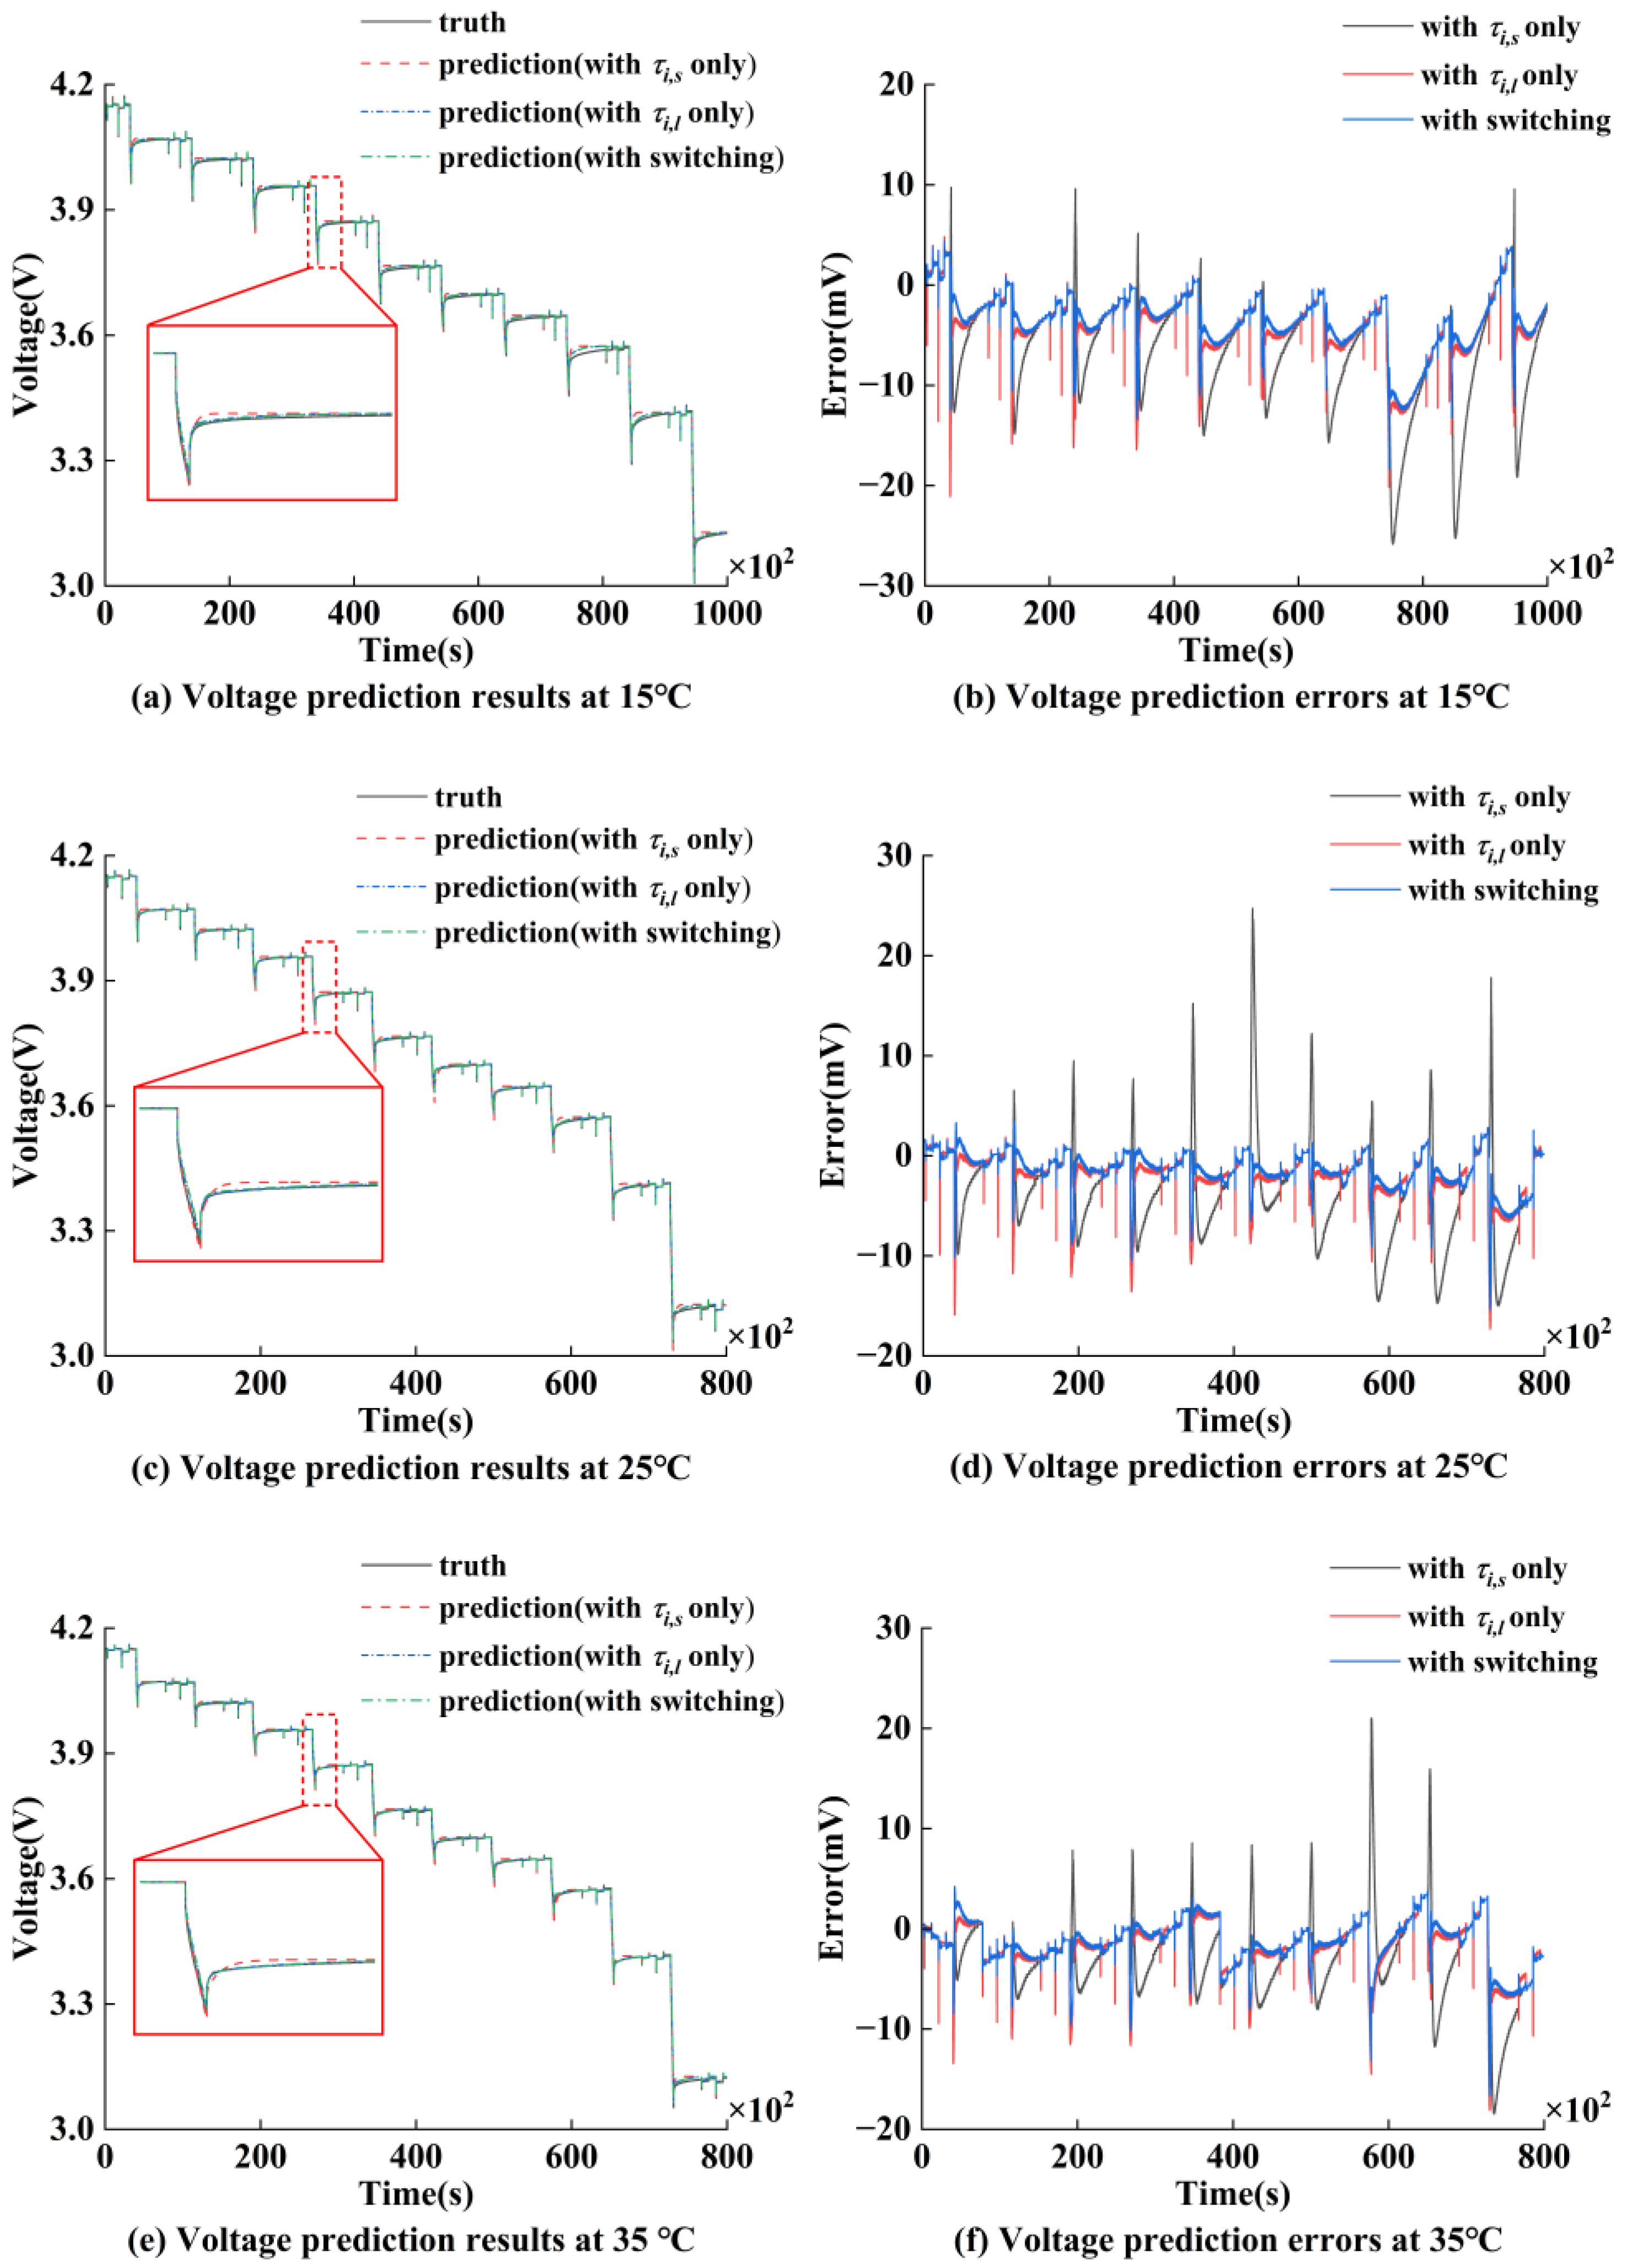
Based on the parameter identification results, a 2-RC ECM was established. In addition to considering the effects of SOC, temperature, and C-rate on model parameters, this study also accounted for the influence of discharge duration on time constants. Figure 18 illustrates the impact of different discharge duration thresholds on voltage prediction accuracy under M-HPPC test conditions. It can be seen that both the mean absolute error (MAE) and maximum absolute error (MaxAE) of voltage prediction exhibited an increasing trend with longer discharge durations. Therefore, this study set the Tth to 11 s.
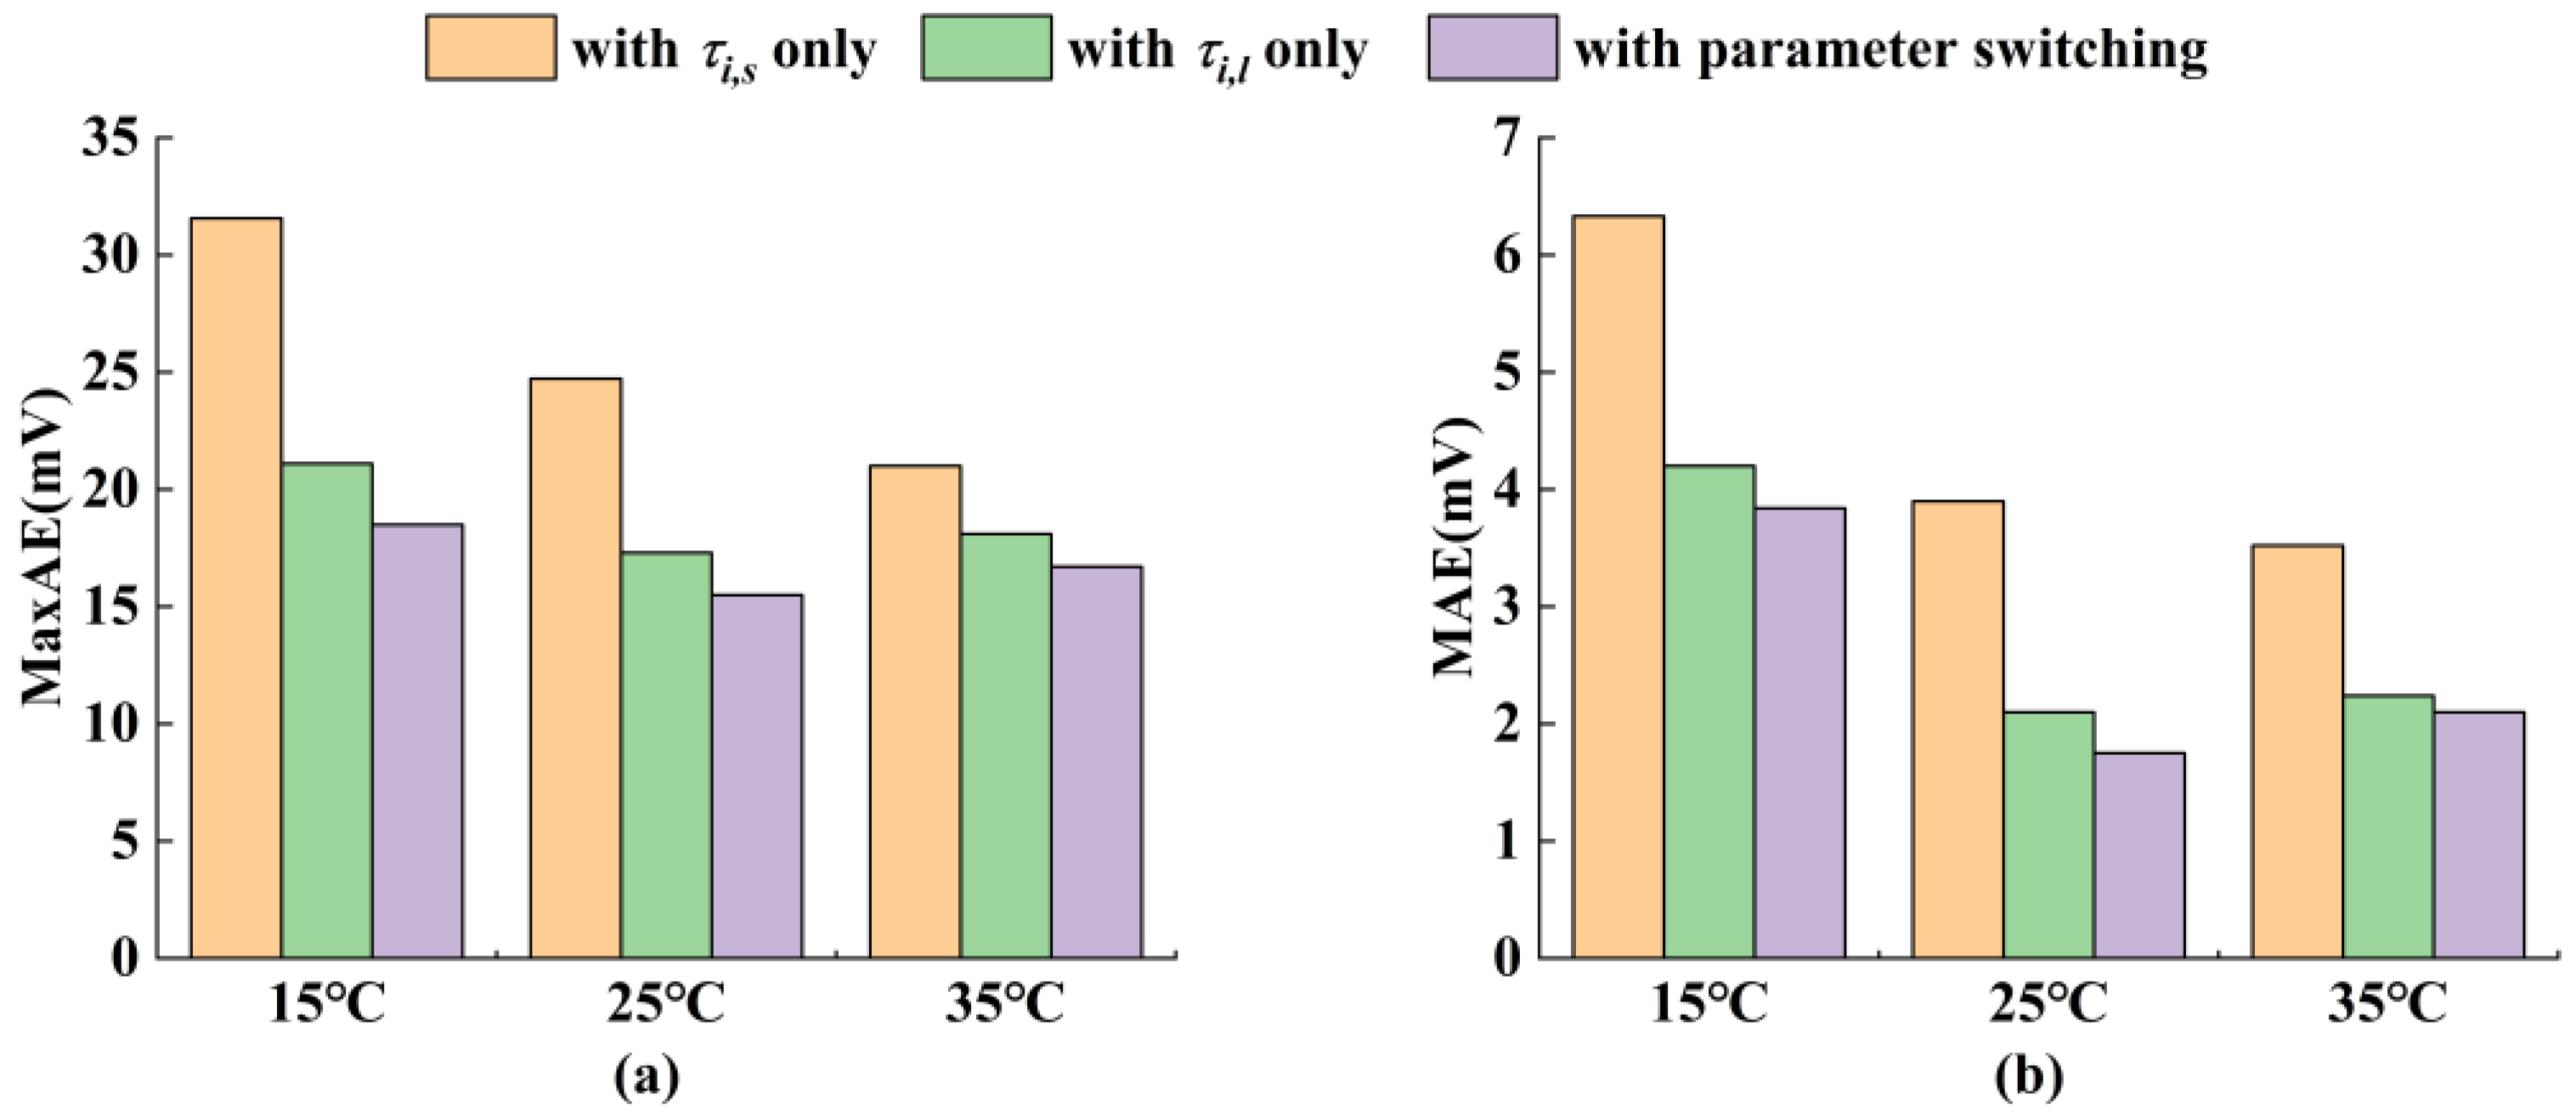
The voltage prediction results under M-HPPC conditions at various temperatures are shown in Figure 19. The ECM with τi,l only exhibited the most significant voltage prediction error. The reason is that τi,l is relatively small, resulting in a faster zero-input response speed for the terminal voltage. After implementing the parameter switching strategy or using only τi,l, the voltage prediction errors decrease. Nevertheless, compared to using the parameter switching strategy, using only τi,l resulted in relatively poorer prediction accuracy, as τi,l is too large to adapt to the short-duration discharge scenario. Figure 20 further illustrates that at 15 °C, when only τi,s or only τi,l was used, the maximum absolute errors were 31.56 mV and 21.1 mV, respectively, and the mean absolute errors were 6.33 mV and 4.2 mV, respectively. In contrast, after implementing the parameter switching scheme, the maximum absolute error and mean absolute error reduced to 18.5 mV and 3.84 mV, respectively. Similarly, at 25 °C, the maximum absolute error decreased from 24.7 mV and 17.3 mV to 15.5 mV, and the mean absolute error dropped from 3.9 mV and 2.1 mV to 1.75 mV after adopting the parameter switching scheme. At 35 °C, the maximum absolute error decreased from 21 mV and 18.1 mV to 16.7 mV, while the mean absolute error reduced from 3.52 mV and 2.4 mV to 2.1 mV with the parameter switching scheme.

5.3. The Specific Heat Capacity Measurement Experiment and Results of Thermal Model Parameter Identification

Figure 21a shows the temperature variation curves for different measuring points during the specific heat capacity measurement experiment. The cell temperature increased during the heating process and reached a given temperature at 2700 s. Then, the cell temperature decreased gradually. From Figure 21b, the temperature difference between the inner and outer surfaces increased rapidly at the initial stage of heating. At about 250 s, the cell temperature had reached a quasi-steady state, and the temperature difference remained at almost the same level but increased slowly. The key reason for this can be attributed to the heat loss. As shown in Figure 21c, the temperature change rate dT/dt during the heating period and the corresponding temperature change rate dT′/dt during the cooling down period are plotted, indicating that heat loss increases with growing temperature difference. Based on this, the specific heat capacity can be determined using Equation (12). The calculation result of the specific heat capacity is shown in Figure 21d. The average specific heat capacity of the cell is 1142 J/(kg·°C). The result is of the same order of magnitude as the reported specific heat capacities of other sodium-ion batteries. For instance, the Na3V2(PO4)2F3/hard carbon cell demonstrates a specific heat capacity of 1470 J/(kg·°C), while the NaNi1/3Fe1/3Mn1/3O2/hard carbon cell shows a value of 1260 J/(kg·°C) [38,45].
Based on this, the thermal model parameters were identified using the PSO algorithm and constant-current discharge testing at a 1C rate under an ambient temperature of 15 °C. The identification results are presented in Table 2.

5.4. Validation of Electro–Thermal Coupling Model Prediction Performance

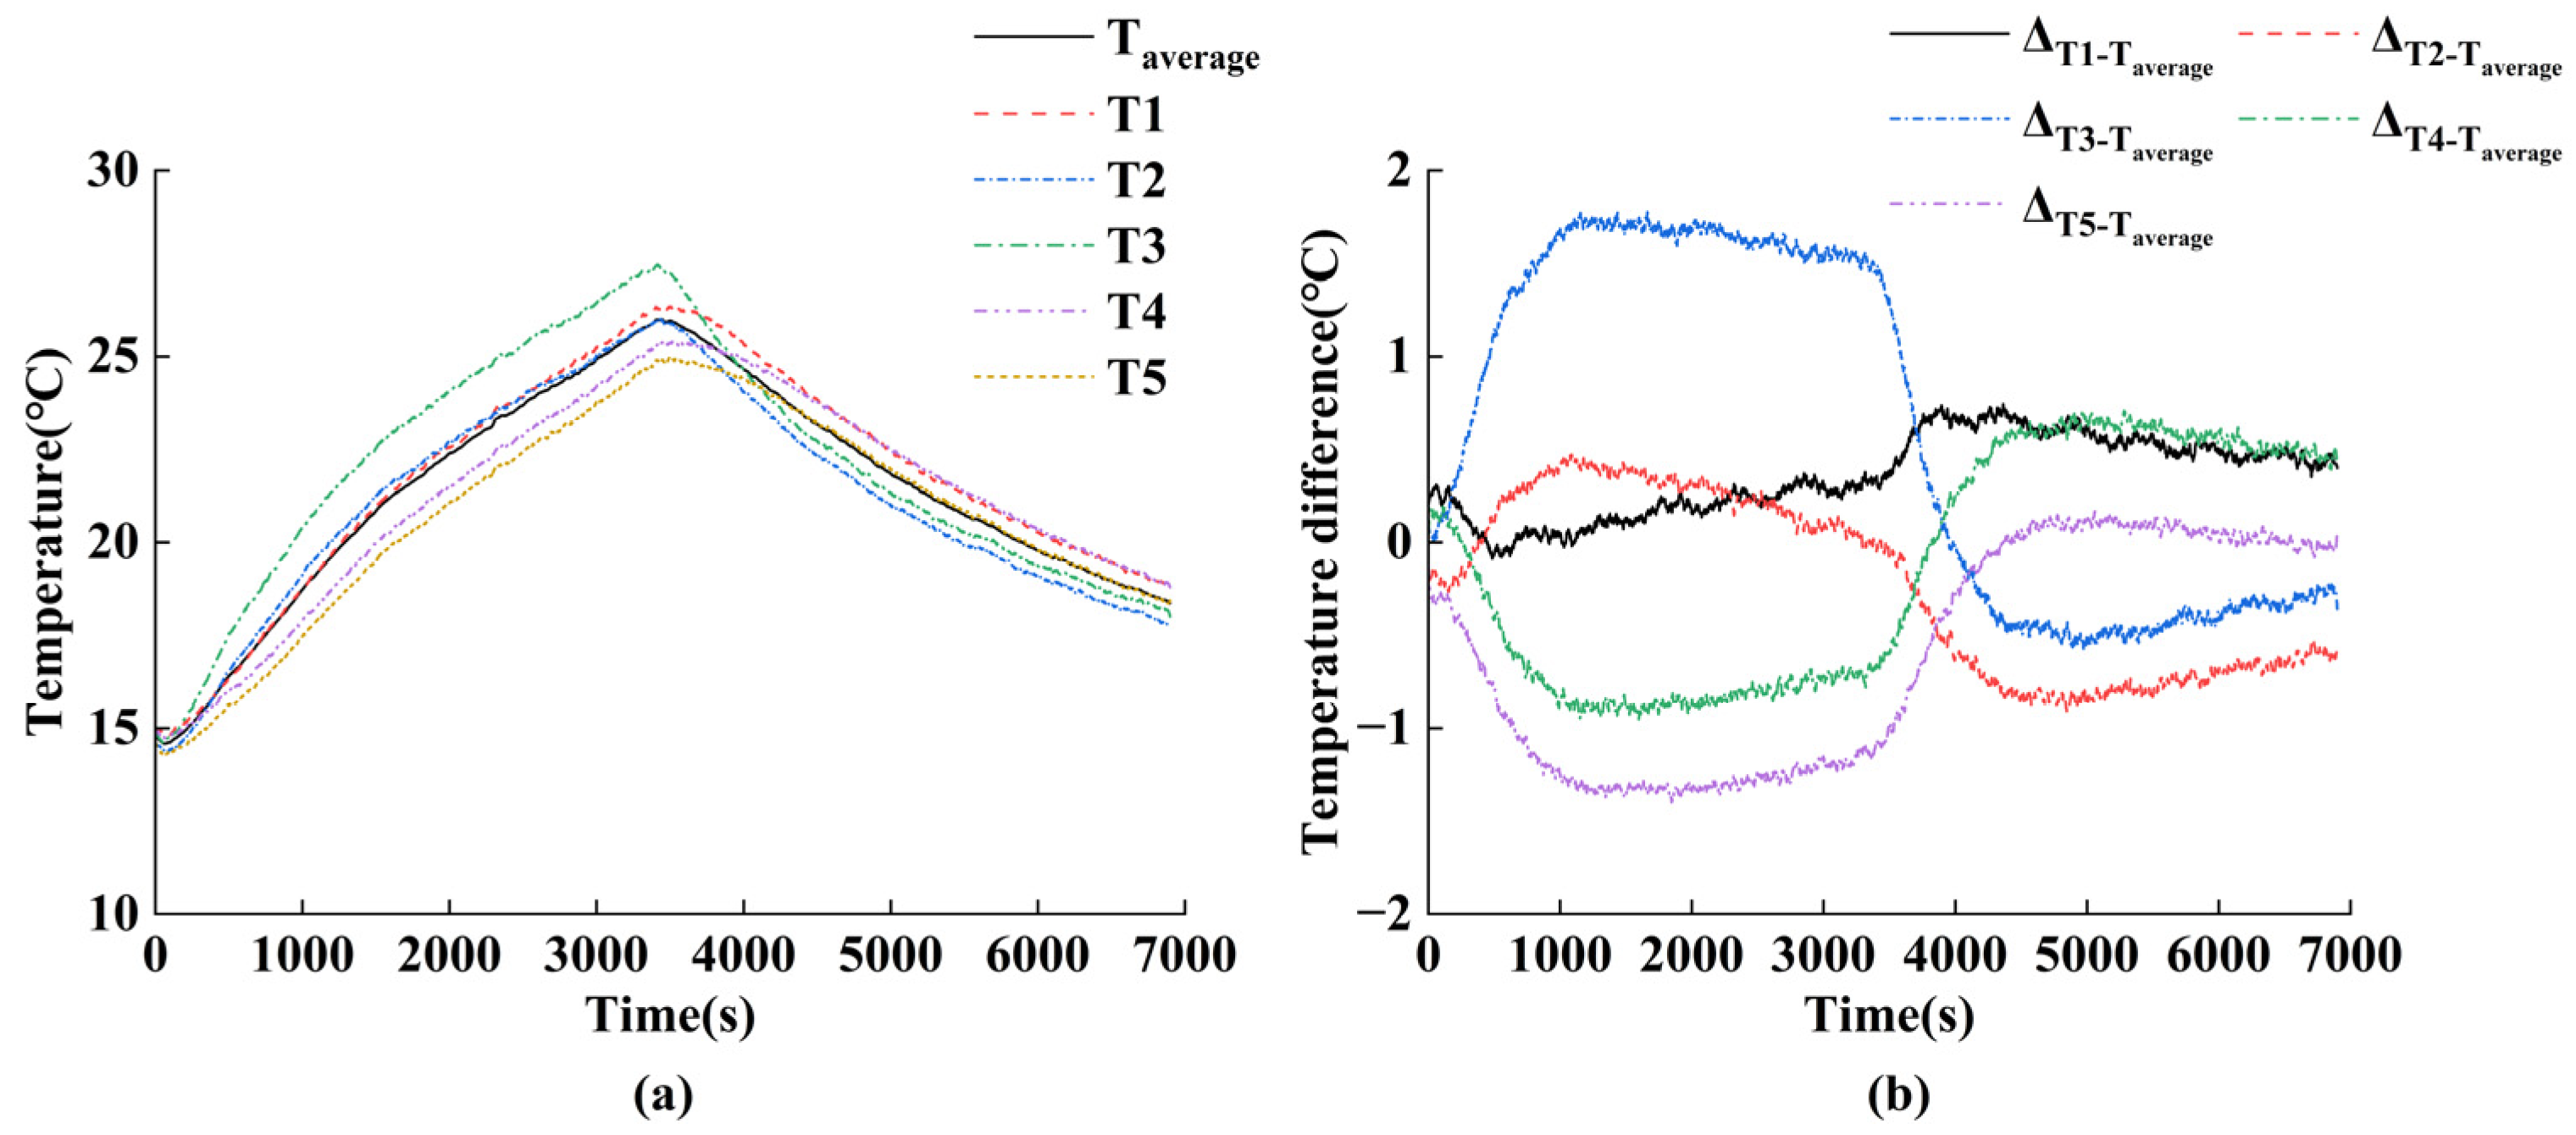
As illustrated in Figure 22a, the temperature profiles from T1–T5 during 1C constant-current discharge at 15 °C are presented. In pouch-type batteries, heterogeneous heat dissipation conditions across different locations resulted in local temperature variations. For instance, during the discharge process, the area near the tabs exhibited the highest temperature due to heat generation at the tabs. After the discharge stopped, this same area cooled faster because of better heat dissipation. The spatial temperature difference may induce variations in local ohmic resistance, current density distribution, SOC, and heat generation rates. However, as shown in Figure 22b, the maximum temperature differences between T1–T5 and their average remained below 2 °C. Therefore, averaging the temperatures from T1–T5 to represent the cell’s temperature has an insignificant impact on circuit model parameters.
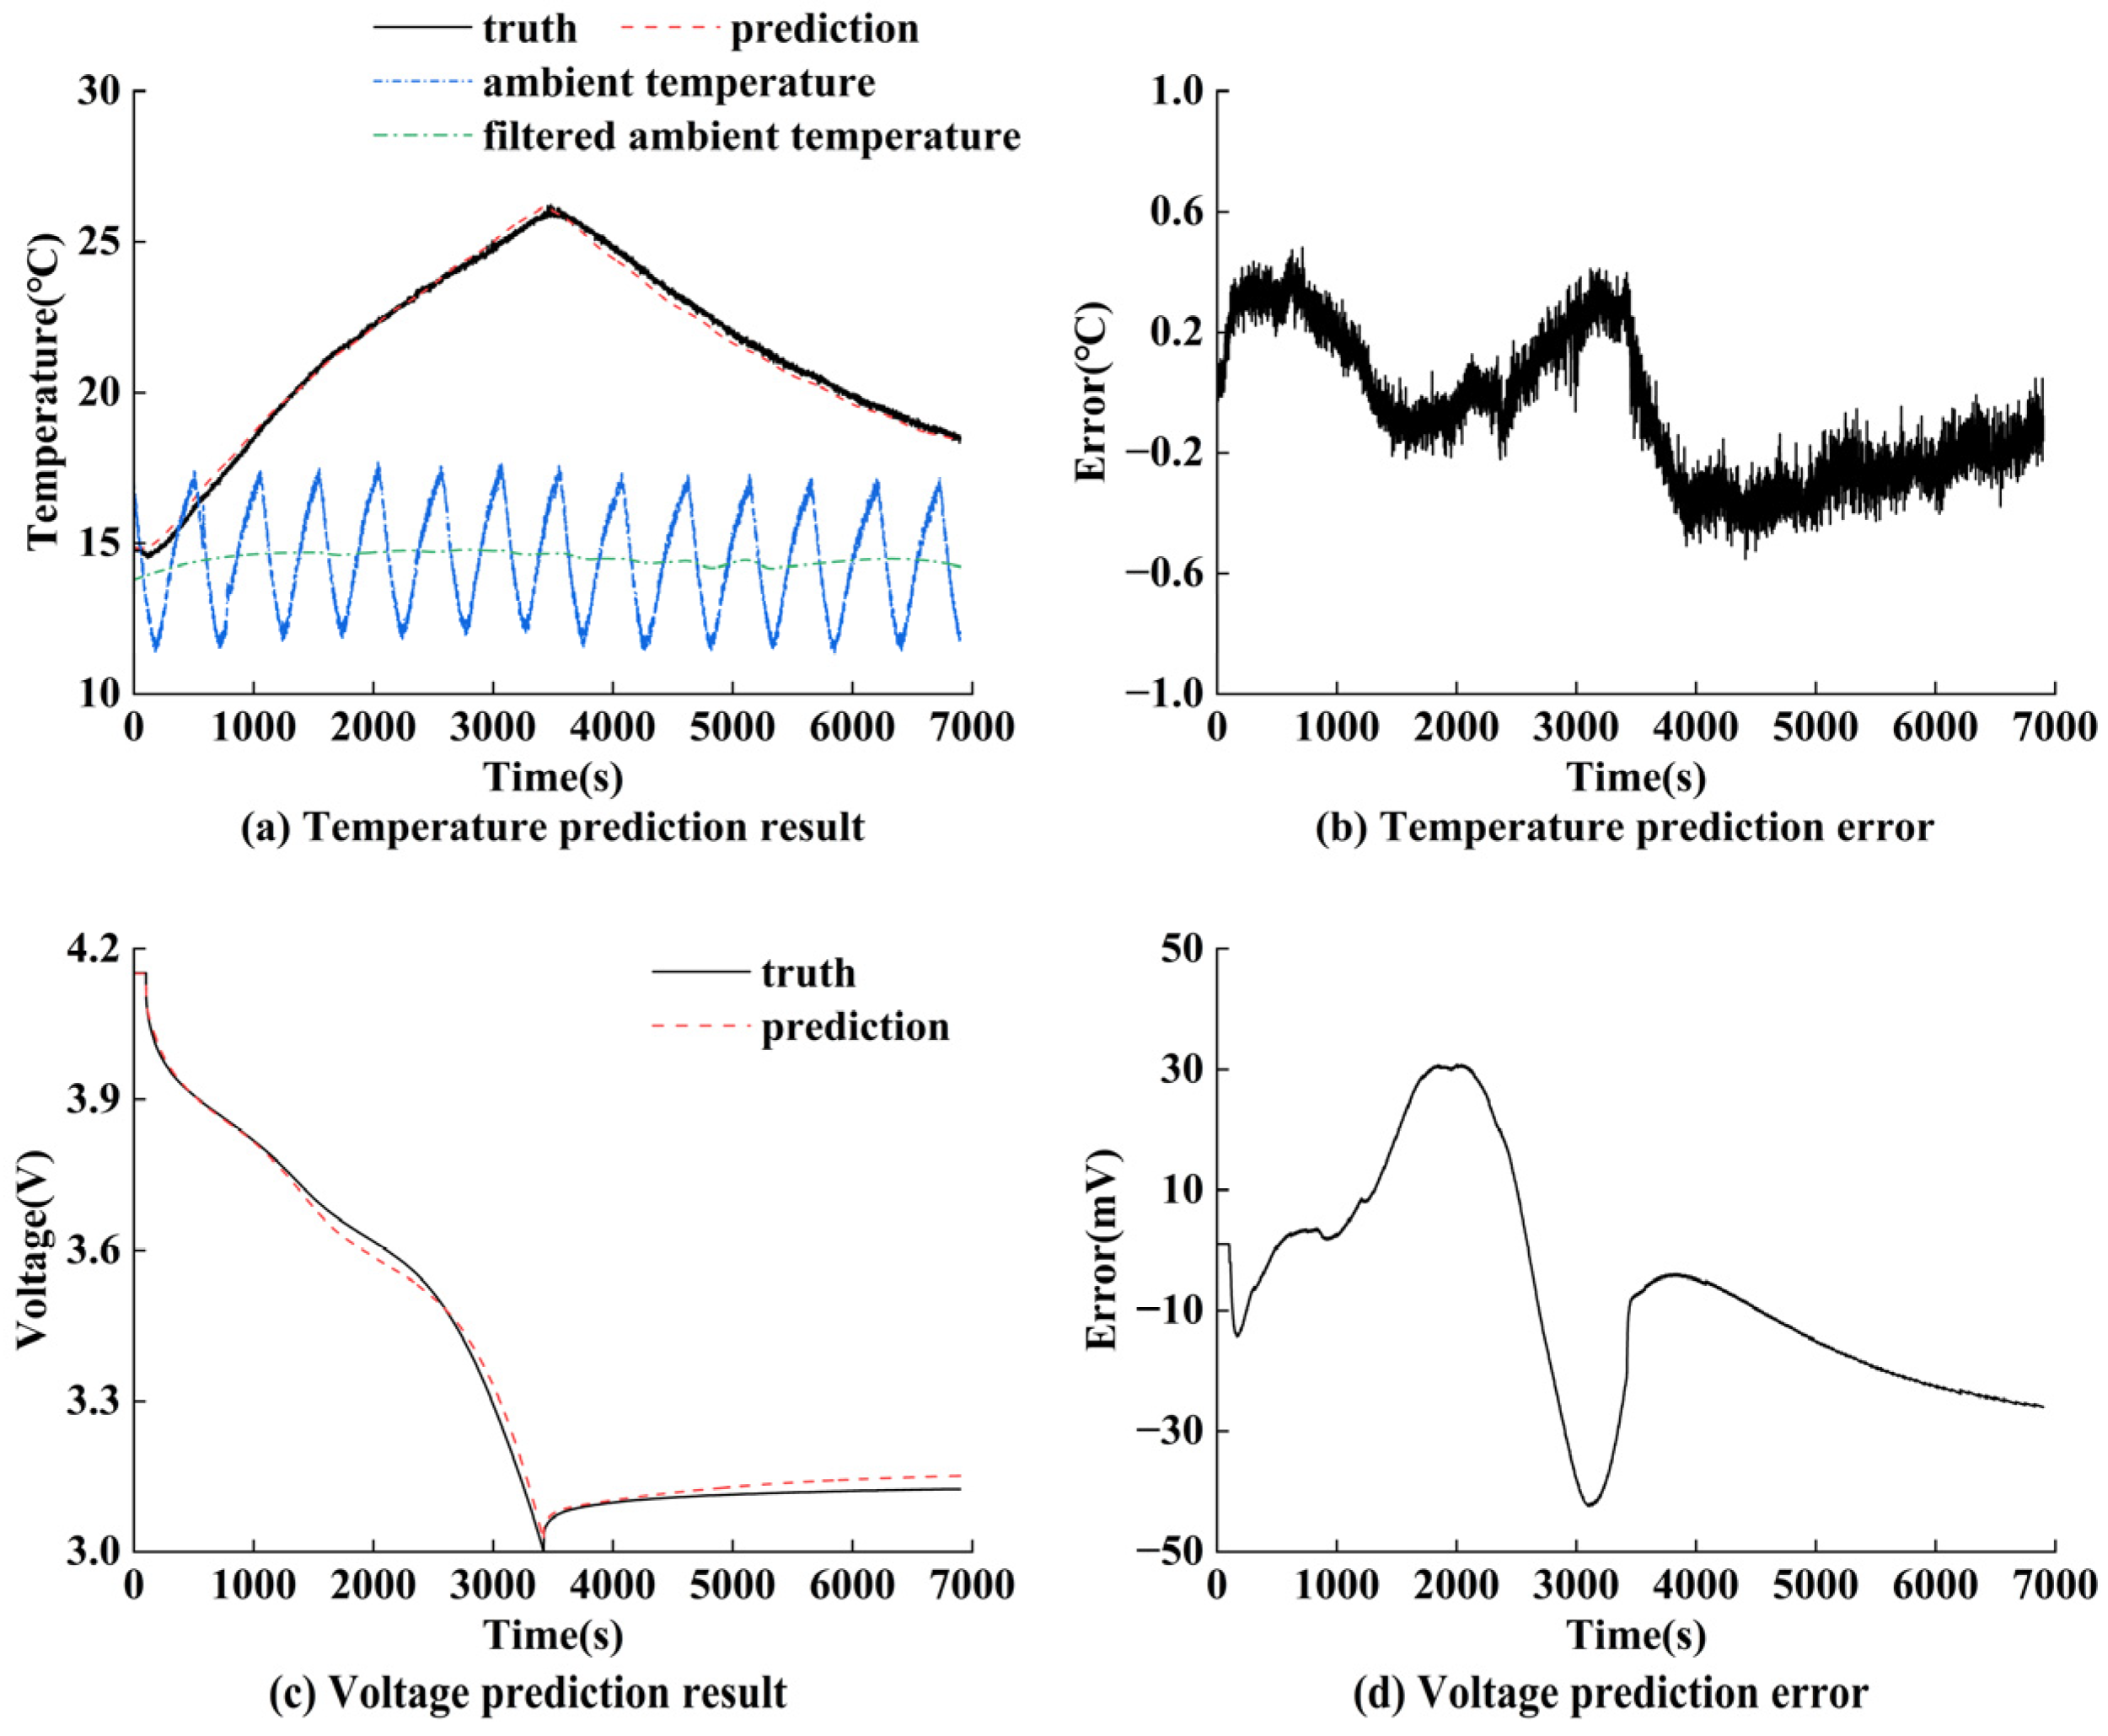
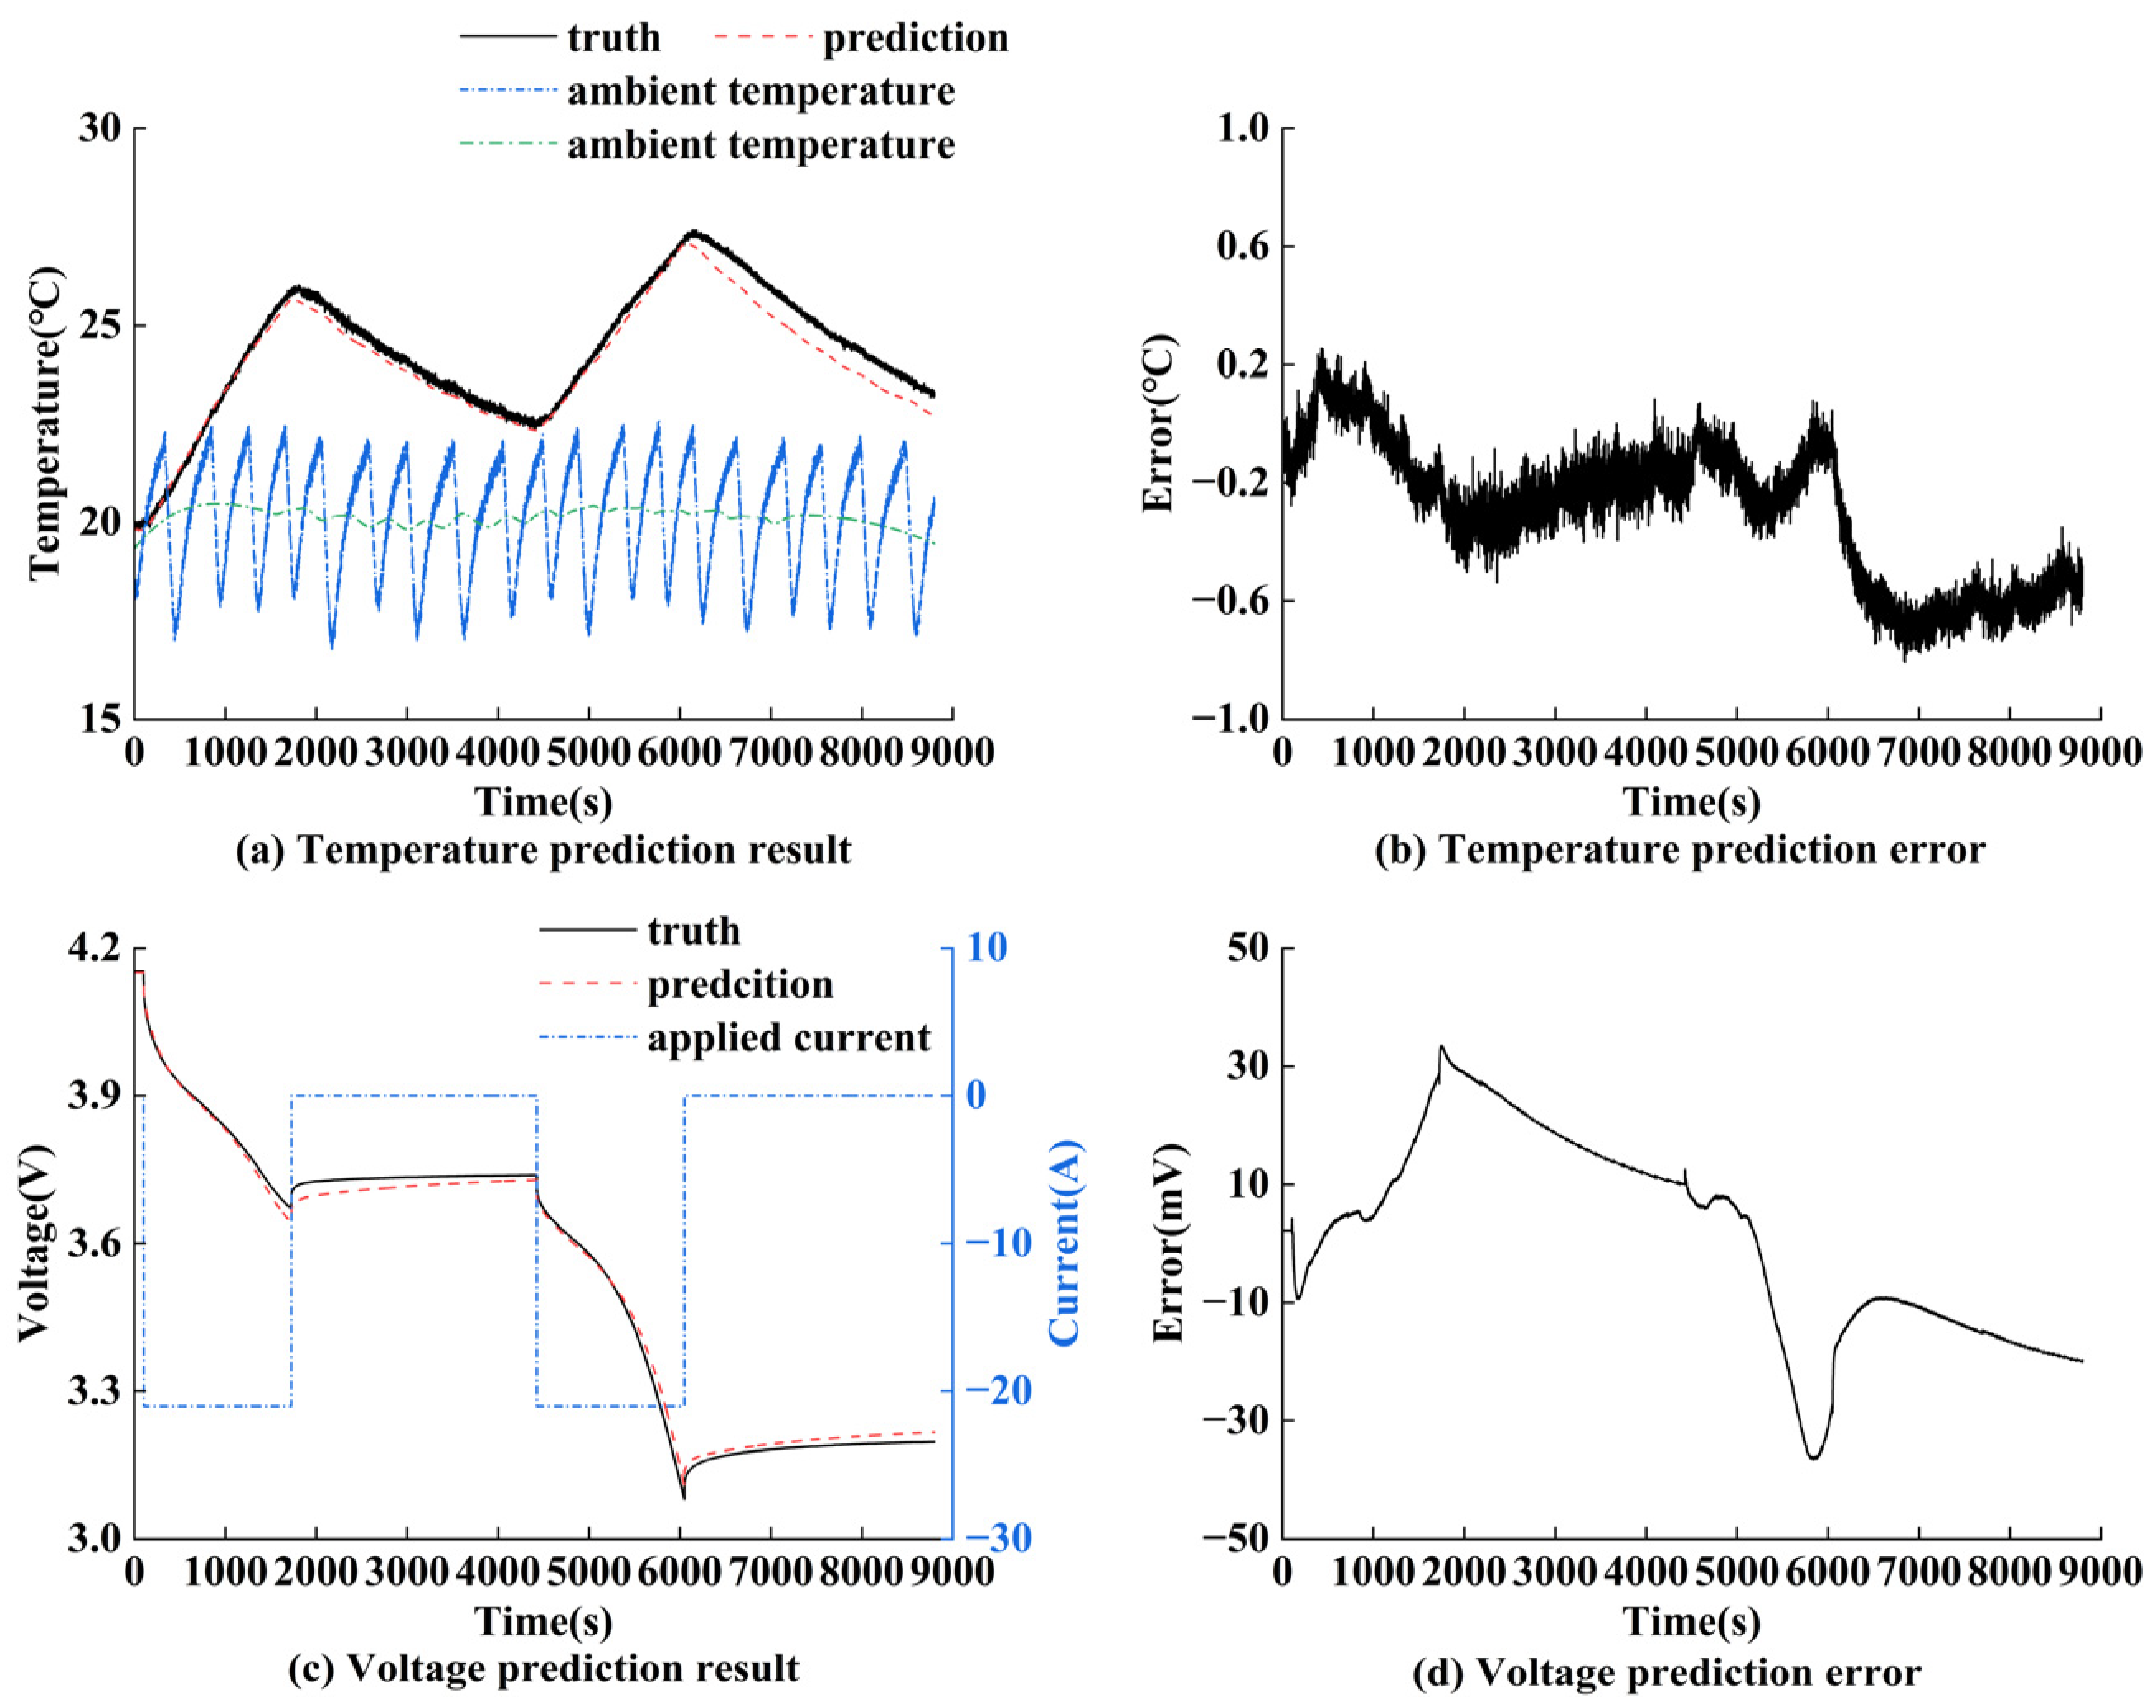
Figure 23 illustrates the electro–thermal model’s temperature and voltage prediction results under a 1C constant-current discharge condition at an ambient temperature of 15 °C. From Figure 23, a maximum temperature rise of approximately 11 °C was observed. For battery temperature prediction, the maximum absolute error was 0.55 °C, and the MAE was 0.22 °C. For battery voltage prediction, the maximum absolute error was 42.5 mV, and the MAE was 16.3 mV.
To verify the prediction performance of the electro-thermal coupling model, a 1C constant-current discharge test was conducted at an ambient temperature of 20 °C. The established electro-thermal coupling model was then employed to predict both temperature and voltage during the discharge process. The corresponding prediction results are presented in Figure 24. A maximum temperature rise of approximately 13 °C was observed. For battery temperature prediction, the maximum absolute error was 0.78 °C, and the MAE was 0.31 °C. For battery voltage prediction, the maximum absolute error was 32 mV, and the MAE was 13.4 mV. The results demonstrate that the developed electro–thermal coupling model for sodium-ion batteries achieves accurate simultaneous predictions of both cell voltage and temperature.
In addition, we conducted a multi-stage discharge test on the battery under an ambient temperature of 20 °C to further validate the voltage and temperature prediction performance of the coupling electro-thermal model. The discharge rate was set at 1C during the test. The prediction results are shown in Figure 25. It can be observed that the maximum temperature rise during this process was 7.5 °C, with a maximum absolute error of 0.8 °C and a MAE of 0.3 °C for temperature prediction. For voltage, the maximum absolute error was 36.6 mV, with a MAE of 14.8 mV.

5.5. Comparative Analysis of Sodium-Ion Batteries and Lithium-Ion Batteries

The influence of temperature on the ohmic resistance and charge transfer resistance at the electrode-electrolyte interface in SIBs follows mechanisms similar to those in LIBs. However, due to differences in the physicochemical properties between sodium and lithium ions (such as ionic radius and solvation energy), distinct characteristics are observed between the two systems. Firstly, due to the larger ionic radius of sodium ions and the lower electronic conductivity of hard carbon anodes, the ohmic resistance of SIBs is generally higher than that of LIBs. Additionally, in both SIBs and LIBs, lower temperatures increase electrolyte viscosity and reduce ion migration rates, leading to elevated ohmic resistance [36]. As demonstrated in this work and References [16,46], the identified ohmic resistance parameters in SIBs, nickel-cobalt-manganese (NCM) lithium-ion batteries, and lithium iron phosphate (LFP) batteries all exhibit similar evolutionary trends. Notably, SIBs show a more significant increase in ohmic resistance than lithium-ion batteries with decreasing temperature. However, compared to lithium ions, sodium ions possess a smaller Stokes radius, which typically results in higher ionic mobility within the electrolyte. This suggests that sodium-ion batteries exhibit a smaller increase in ohmic resistance under extremely low-temperature conditions. Consequently, it is necessary to investigate the low-temperature performance characteristics of the sodium-ion battery. Furthermore, as shown in Figure 13, temperature has a relatively minor influence on polarization resistance, which is attributed to the lower desolvation energy barrier of Na+ ions, resulting in a more minor temperature-dependent increase in charge transfer resistance at the electrode-electrolyte interface [36].
In this study, the potentiometric method [47] was utilized to determine the entropy coefficient of sodium iron sulfate/hard carbon sodium-ion batteries at low, medium, and high SOC (15%, 45% and 80%). As presented in Table 3, the entropy coefficients are negative across most SOC ranges, indicating exothermic reversible heat generation during the discharge process and endothermic reversible heat absorption during the charge process. Reference [45] measured the entropy coefficient of Na3V2(PO4)2F3/HC sodium-ion batteries, demonstrating negative values across most SOC ranges. Furthermore, Reference [48] reported negative entropy coefficients for the Na3V2(PO4)3/HC cell throughout the entire SOC range. This thermodynamic characteristic may facilitate a fast-charging capability in sodium-ion batteries. In contrast, the reported LiFePO4/graphite cell exhibits positive entropy coefficients within the 40–100% SOC range [49]. Similarly, NCA/graphite and NMC/graphite cells demonstrate mixed entropy variation behavior, with negative values in certain SOC ranges and positive values in others. Fundamentally, the full-cell entropy coefficient is governed by the combined thermodynamic contributions of both cathode and anode materials [47].

6. Conclusions

As a promising next-generation battery system, sodium-ion batteries (SIBs) demonstrate tremendous application potential for future energy storage applications. To ensure their safe and stable operation, a reliable battery management system (BMS) is essential, with a high-fidelity battery model serving as its fundamental component. Therefore, an electro-thermal coupling model for a commercial pouch-type SIB with sodium iron sulfate cathode material was developed, based on a second-order RC equivalent circuit model and a lumped-parameter thermal model. Offline parameter identification of the equivalent circuit model was performed through multi-rate hybrid pulse power characterization (M-HPPC) tests under three different ambient temperatures. The identification results reveal that the sodium-ion battery’s electrical parameters exhibit dependencies on temperature, SOC, current direction, and discharge rate. However, the sensitivity of each parameter to these factors varies significantly, with ohmic resistance demonstrating the most pronounced temperature dependence. In addition, the discharge duration also significantly affects the time constants of the equivalent circuit model. Based on this, we proposed a modified equivalent circuit model with a parameter-switching scheme, which exhibits improved voltage prediction accuracy. Meanwhile, in this study, both the specific heat capacity and entropy coefficient of the sodium-ion battery were measured through experiments, and parameter identification of the lumped-parameter thermal model was conducted through 1C constant-current discharge testing. The prediction performance of the developed electro-thermal coupling model was subsequently validated by the constant-current discharge test at different temperatures and multi-stage discharge. The results demonstrate that the developed model can accurately predict the terminal voltage and temperature of the sodium-ion battery, laying a foundation for the future development of sodium-ion battery management systems and thermal management systems.

Author Contributions

Conceptualization, H.Z.; methodology, H.Z.; software, H.Z.; validation, H.Z. and J.Y.; investigation, H.Z. and J.Y.; resources, Y.D. and H.Z.; data curation, H.Z.; writing—original draft preparation, H.Z.; writing—review and editing, Y.D. and Z.Z.; visualization, H.Z.; supervision, Y.D. and Z.Z.; funding acquisition, Y.D. and Z.Z. All authors have read and agreed to the published version of the manuscript.

Funding

This research was supported by the National Natural Science Foundation of China under Grant No. 52477218 and No. 52472381.

Data Availability Statement

The original contributions presented in the study are included in the article, further inquiries can be directed to the corresponding authors.

Conflicts of Interest

The authors declare no conflicts of interest.

References

  1. Ma, R.; He, J.; Fan, X.; Qian, Y.; Deng, Y. The Distributed Temperature Abatement by the Phase Changing Materials for Battery in Electric Tools and Its Influence on Aging. Sustain. Energy Technol. Assess. 2022, 52, 102199. [Google Scholar] [CrossRef]
  2. Wang, Y.; Yu, M.; Fan, H.; Chung, J.D. Multi-Objective Topology Optimization of Cold Plates for Enhanced Battery Thermal Management in Electric Vehicles. Case Stud. Therm. Eng. 2025, 66, 105794. [Google Scholar] [CrossRef]
  3. Lin, X.-W.; Shi, M.-Y.; Zhou, Z.-F.; Chen, B.; Lu, Y.-J.; Jing, D.-W. Multi-Objective Topology Optimization Design of Liquid-Based Cooling Plate for 280 Ah Prismatic Energy Storage Battery Thermal Management. Energy Convers. Manag. 2025, 325, 119440. [Google Scholar] [CrossRef]
  4. Hounjet, L.J. Comparing Lithium- and Sodium-ion Batteries for Their Applicability Within Energy Storage Systems. Energy Storage 2022, 4, e309. [Google Scholar] [CrossRef]
  5. Luo, H.; Wang, Y.; Feng, Y.-H.; Fan, X.-Y.; Han, X.; Wang, P.-F. Lithium-Ion Batteries under Low-Temperature Environment: Challenges and Prospects. Materials 2022, 15, 8166. [Google Scholar] [CrossRef]
  6. Quartarone, E.; Eisenmann, T.; Kuenzel, M.; Tealdi, C.; Marrani, A.G.; Brutti, S.; Callegari, D.; Passerini, S. Towards Advanced Sodium-Ion Batteries: Green, Low-Cost and High-Capacity Anode Compartment Encompassing Phosphorus/Carbon Nanocomposite as the Active Material and Aluminum as the Current Collector. J. Electrochem. Soc. 2020, 167, 080509. [Google Scholar] [CrossRef]
  7. Rudola, A.; Wright, C.J.; Barker, J. Reviewing the Safe Shipping of Lithium-Ion and Sodium-Ion Cells: A Materials Chemistry Perspective. Energy Mater. Adv. 2021, 2021, 9798460. [Google Scholar] [CrossRef]
  8. Abraham, K.M. How Comparable Are Sodium-Ion Batteries to Lithium-Ion Counterparts? ACS Energy Lett. 2020, 5, 3544–3547. [Google Scholar] [CrossRef]
  9. Zakharchenko, T.K.; Nikiforov, D.I.; Serdyukov, G.D.; Komissarov, P.V.; Shkuratov, M.O.; Dzuban, A.V.; Lakienko, G.P.; Gordienko, Y.A.; Yashina, L.V.; Itkis, D.M. Thermal Runaway of Na-Ion Batteries with Na3V2O2(PO4)2F Cathodes. Batter. Supercaps 2025, 8, e202400386. [Google Scholar] [CrossRef]
  10. Yu, T.; Li, G.; Duan, Y.; Wu, Y.; Zhang, T.; Zhao, X.; Luo, M.; Liu, Y. The Research and Industrialization Progress and Prospects of Sodium Ion Battery. J. Alloys Compd. 2023, 958, 170486. [Google Scholar] [CrossRef]
  11. Zhang, C.; Gao, R.; Zheng, L.; Hao, Y.; Liu, X. New Insights into the Roles of Mg in Improving the Rate Capability and Cycling Stability of O3-NaMn0.48Ni0.2Fe0.3Mg0.02O2 for Sodium-Ion Batteries. ACS Appl. Mater. Interfaces 2018, 10, 10819–10827. [Google Scholar] [CrossRef]
  12. Xu, S.; Wang, Y.; Ben, L.; Lyu, Y.; Song, N.; Yang, Z.; Li, Y.; Mu, L.; Yang, H.; Gu, L.; et al. Fe-Based Tunnel-Type Na0.61[Mn0.27Fe0.34Ti0.39]O2 Designed by a New Strategy as a Cathode Material for Sodium-Ion Batteries. Adv. Energy Mater. 2015, 5, 1501156. [Google Scholar] [CrossRef]
  13. Qian, J.; Wu, C.; Cao, Y.; Ma, Z.; Huang, Y.; Ai, X.; Yang, H. Prussian Blue Cathode Materials for Sodium-Ion Batteries and Other Ion Batteries. Adv. Energy Mater. 2018, 8, 1702619. [Google Scholar] [CrossRef]
  14. He, M.; Liu, S.; Wu, J.; Zhu, J. Review of Cathode Materials for Sodium-Ion Batteries. Prog. Solid State Chem. 2024, 74, 100452. [Google Scholar] [CrossRef]
  15. Balogun, M.-S.; Luo, Y.; Qiu, W.; Liu, P.; Tong, Y. A Review of Carbon Materials and Their Composites with Alloy Metals for Sodium Ion Battery Anodes. Carbon 2016, 98, 162–178. [Google Scholar] [CrossRef]
  16. Rehm, M.; Fischer, M.; Gomez, M.R.; Schütte, M.; Sauer, D.U.; Jossen, A. Comparing the Electrical Performance of Commercial Sodium-Ion and Lithium-Iron-Phosphate Batteries. J. Power Sources 2025, 633, 236290. [Google Scholar] [CrossRef]
  17. He, M.; Davis, R.; Chartouni, D.; Johnson, M.; Abplanalp, M.; Troendle, P.; Suetterlin, R.-P. Assessment of the First Commercial Prussian Blue Based Sodium-Ion Battery. J. Power Sources 2022, 548, 232036. [Google Scholar] [CrossRef]
  18. Subasinghe, L.U.; Wang, C.; Gajjela, S.R.; Law, M.; Manikandan, B.; Balaya, P. A Study on Heat Generation Characteristics of Na3V2(PO4)3 Cathode and Hard Carbon Anode-Based Sodium-Ion Cells. J. Therm. Anal. Calorim. 2022, 147, 8631–8649. [Google Scholar] [CrossRef]
  19. Sophy-Mahfoudi, N.; Sekharam, S.-V.; Boutaous, M.; Xin, S. Model-Based Design of LFP Battery Thermal Management System for EV Application. Batteries 2024, 10, 329. [Google Scholar] [CrossRef]
  20. Ren, Z.; Ducq, C.; Wang, H.; Shao, J. Error Analysis of Model-Based State-of-Charge Estimation for Lithium-Ion Batteries at Different Temperatures. Int. J. Electrochem. Sci. 2020, 15, 9981–10006. [Google Scholar] [CrossRef]
  21. Hu, M.; Li, Y.; Li, S.; Fu, C.; Qin, D.; Li, Z. Lithium-Ion Battery Modeling and Parameter Identification Based on Fractional Theory. Energy 2018, 165, 153–163. [Google Scholar] [CrossRef]
  22. Panchal, S.; Mathew, M.; Fraser, R.; Fowler, M. Electrochemical Thermal Modeling and Experimental Measurements of 18650 Cylindrical Lithium-Ion Battery during Discharge Cycle for an EV. Appl. Therm. Eng. 2018, 135, 123–132. [Google Scholar] [CrossRef]
  23. Xu, S.; Wang, Y.; Shao, J.; Li, J.; Yu, Q. An Electrochemical-Thermal Coupling Model for Prismatic Lithium-Ion Batteries over Wide Temperature Range. Appl. Therm. Eng. 2022, 217, 119282. [Google Scholar] [CrossRef]
  24. Alkhedher, M.; Al Tahhan, A.B.; Yousaf, J.; Ghazal, M.; Shahbazian-Yassar, R.; Ramadan, M. Electrochemical and Thermal Modeling of Lithium-Ion Batteries: A Review of Coupled Approaches for Improved Thermal Performance and Safety Lithium-Ion Batteries. J. Energy Storage 2024, 86, 111172. [Google Scholar] [CrossRef]
  25. Cai, Y.; Che, Y.; Li, H.; Jiang, M.; Qin, P. Electro-Thermal Model for Lithium-Ion Battery Simulations. J. Power Electron. 2021, 21, 1530–1541. [Google Scholar] [CrossRef]
  26. Dai, H.; Zhu, L.; Zhu, J.; Wei, X.; Sun, Z. Adaptive Kalman Filtering Based Internal Temperature Estimation with an Equivalent Electrical Network Thermal Model for Hard-Cased Batteries. J. Power Sources 2015, 293, 351–365. [Google Scholar] [CrossRef]
  27. Sun, Y.; Li, J.-C.; Zhou, H.; Guo, S. Wide-Temperature-Range Sodium-Metal Batteries: From Fundamentals and Obstacles to Optimization. Energy Environ. Sci. 2023, 16, 4759–4811. [Google Scholar] [CrossRef]
  28. Chayambuka, K.; Mulder, G.; Danilov, D.L.; Notten, P.H.L. Physics-Based Modeling of Sodium-Ion Batteries Part II. Model and Validation. Electrochim. Acta 2022, 404, 139764. [Google Scholar] [CrossRef]
  29. Garapati, V.K.; Huld, F.; Lee, H.; Lamb, J.J. Perspective and Comparative Analysis of Physics-Based Models for Sodium-Ion Batteries. Electrochim. Acta 2025, 514, 145573. [Google Scholar] [CrossRef]
  30. Fu, Y.; Wang, J.; Liu, M.; Li, J.; Shao, J. A Simplified Electrochemical Modeling Method for Sodium-Ion Batteries. J. Energy Storage 2025, 112, 115495. [Google Scholar] [CrossRef]
  31. Jin, B.; Qiao, D.; Gao, W.; Yao, S.; Liu, J.; Zhu, Z.; Shao, Y.; Li, D.; Zheng, Y. Low-Temperature Sodium Dendrite-Induced Short Circuit Diagnosis for Sodium Battery. J. Energy Storage 2025, 111, 115359. [Google Scholar] [CrossRef]
  32. Feng, Y.-F.; Shen, J.-N.; Ma, Z.-F.; He, Y.-J. Equivalent Circuit Modeling of Sodium-Ion Batteries. J. Energy Storage 2021, 43, 103233. [Google Scholar] [CrossRef]
  33. Jiang, C.; Wang, Y.; Sun, Z.; Li, M.; Chen, Z. Online Impedance-Based Temperature and States Co-Estimation for Sodium-Ion Batteries Using Fractional-Order Model. Energy 2025, 334, 137427. [Google Scholar] [CrossRef]
  34. Rabab, H.; Damay, N.; Forgez, C.; Mejdoubi, A.E.; Quelin, A. Equivalent Circuit Model For Sodium-Ion Batteries with Physical-Based Representations of Their Non-Linearities. In Proceedings of the 2023 IEEE Vehicle Power and Propulsion Conference (VPPC), Milan, Italy, 24–27 October 2023; IEEE: New York, NY, USA, 2023; pp. 1–6. [Google Scholar]
  35. Che, C.; Wu, F.; Li, Y.; Li, Y.; Li, S.; Wu, C.; Bai, Y. Challenges and Breakthroughs in Enhancing Temperature Tolerance of Sodium-Ion Batteries. Adv. Mater. 2024, 36, 2402291. [Google Scholar] [CrossRef] [PubMed]
  36. Li, M.; Zhuo, H.; Jing, Q.; Gu, Y.; Liao, Z.; Wang, K.; Hu, J.; Geng, D.; Sun, X.; Xiao, B. Low-temperature Performance of Na-ion Batteries. Carbon Energy 2024, 6, e546. [Google Scholar] [CrossRef]
  37. Liu, Y.; Yang, L.; Liao, R.; Hu, C.; Xiao, Y.; Wu, J.; He, C.; Zhang, Y.; Li, S. Data-Driven Internal Temperature Estimation Methods for Sodium-Ion Battery Using Electrochemical Impedance Spectroscopy. J. Energy Storage 2024, 87, 111426. [Google Scholar] [CrossRef]
  38. Zhang, J.; Huang, H.; Xu, C.; Zhang, R.; Wong, S.K.; Hong, Y.; Zhang, G.; Feng, X. Electro-Thermal Coupling Modeling and Thermal Characterization of Sodium-Ion Batteries. Appl. Therm. Eng. 2025, 272, 126439. [Google Scholar] [CrossRef]
  39. Sandri, C.; Di Rienzo, R.; Nicodemo, N.; Baronti, F.; Roncella, R.; Saletti, R. Electrical Circuit Model for Sodium-Ion Batteries. In Proceedings of the IECON 2024—50th Annual Conference of the IEEE Industrial Electronics Society, Chicago, IL, USA, 3–6 November 2024; IEEE: New York, NY, USA, 2024; pp. 1–6. [Google Scholar]
  40. Zuo, X.; Fu, X.; Han, X.; Sun, M.; Fan, Y. State of Charge Estimation for Sodium-Ion Batteries Based on LSTM Network and Unscented Kalman Filter. Batteries 2025, 11, 274. [Google Scholar] [CrossRef]
  41. Mesbahi, T.; Sugrañes, R.B.; Bakri, R.; Bartholomeüs, P. Coupled Electro-Thermal Modeling of Lithium-Ion Batteries for Electric Vehicle Application. J. Energy Storage 2021, 35, 102260. [Google Scholar] [CrossRef]
  42. Zhou, Y.; Deng, H.; Li, H.-X. Control-Oriented Galerkin-Spectral Model for 3-D Thermal Diffusion of Pouch-Type Batteries. IEEE Trans. Ind. Inform. 2023, 19, 7508–7516. [Google Scholar] [CrossRef]
  43. Liu, S.; Zhang, H.; Xu, X. A Study on the Transient Heat Generation Rate of Lithium-Ion Battery Based on Full Matrix Orthogonal Experimental Design with Mixed Levels. J. Energy Storage 2021, 36, 102446. [Google Scholar] [CrossRef]
  44. Del Valle, Y.; Venayagamoorthy, G.K.; Mohagheghi, S.; Hernandez, J.-C.; Harley, R.G. Particle Swarm Optimization: Basic Concepts, Variants and Applications in Power Systems. IEEE Trans. Evol. Comput. 2008, 12, 171–195. [Google Scholar] [CrossRef]
  45. Damay, N.; Recoquillé, R.; Rabab, H.; Kozma, J.; Forgez, C.; El Mejdoubi, A.; El Kadri Benkara, K. Determination of a Sodium-Ion Cell Entropy-Variation. J. Power Sources 2023, 581, 233460. [Google Scholar] [CrossRef]
  46. Chen, L.; Hu, M.; Cao, K.; Li, S.; Su, Z.; Jin, G.; Fu, C. Core Temperature Estimation Based on Electro-thermal Model of Lithium-ion Batteries. Int. J. Energy Res. 2020, 44, 5320–5333. [Google Scholar] [CrossRef]
  47. Manikandan, B.; Yap, C.; Balaya, P. Towards Understanding Heat Generation Characteristics of Li-Ion Batteries by Calorimetry, Impedance, and Potentiometry Studies. J. Electrochem. Soc. 2017, 164, A2794–A2800. [Google Scholar] [CrossRef]
  48. Wei, F.; Li, P.; Zhang, Q.; Shao, G.; Mao, J. Entropy Change Characteristics for Sodium Ion Half/Full Cells Based on Na3V2(PO4)3 and Hard Carbon Materials. J. Electrochem. Soc. 2022, 169, 050503. [Google Scholar] [CrossRef]
  49. Damay, N.; Forgez, C.; Bichat, M.-P.; Friedrich, G. A Method for the Fast Estimation of a Battery Entropy-Variation High-Resolution Curve—Application on a Commercial LiFePO4/Graphite Cell. J. Power Sources 2016, 332, 149–153. [Google Scholar] [CrossRef]
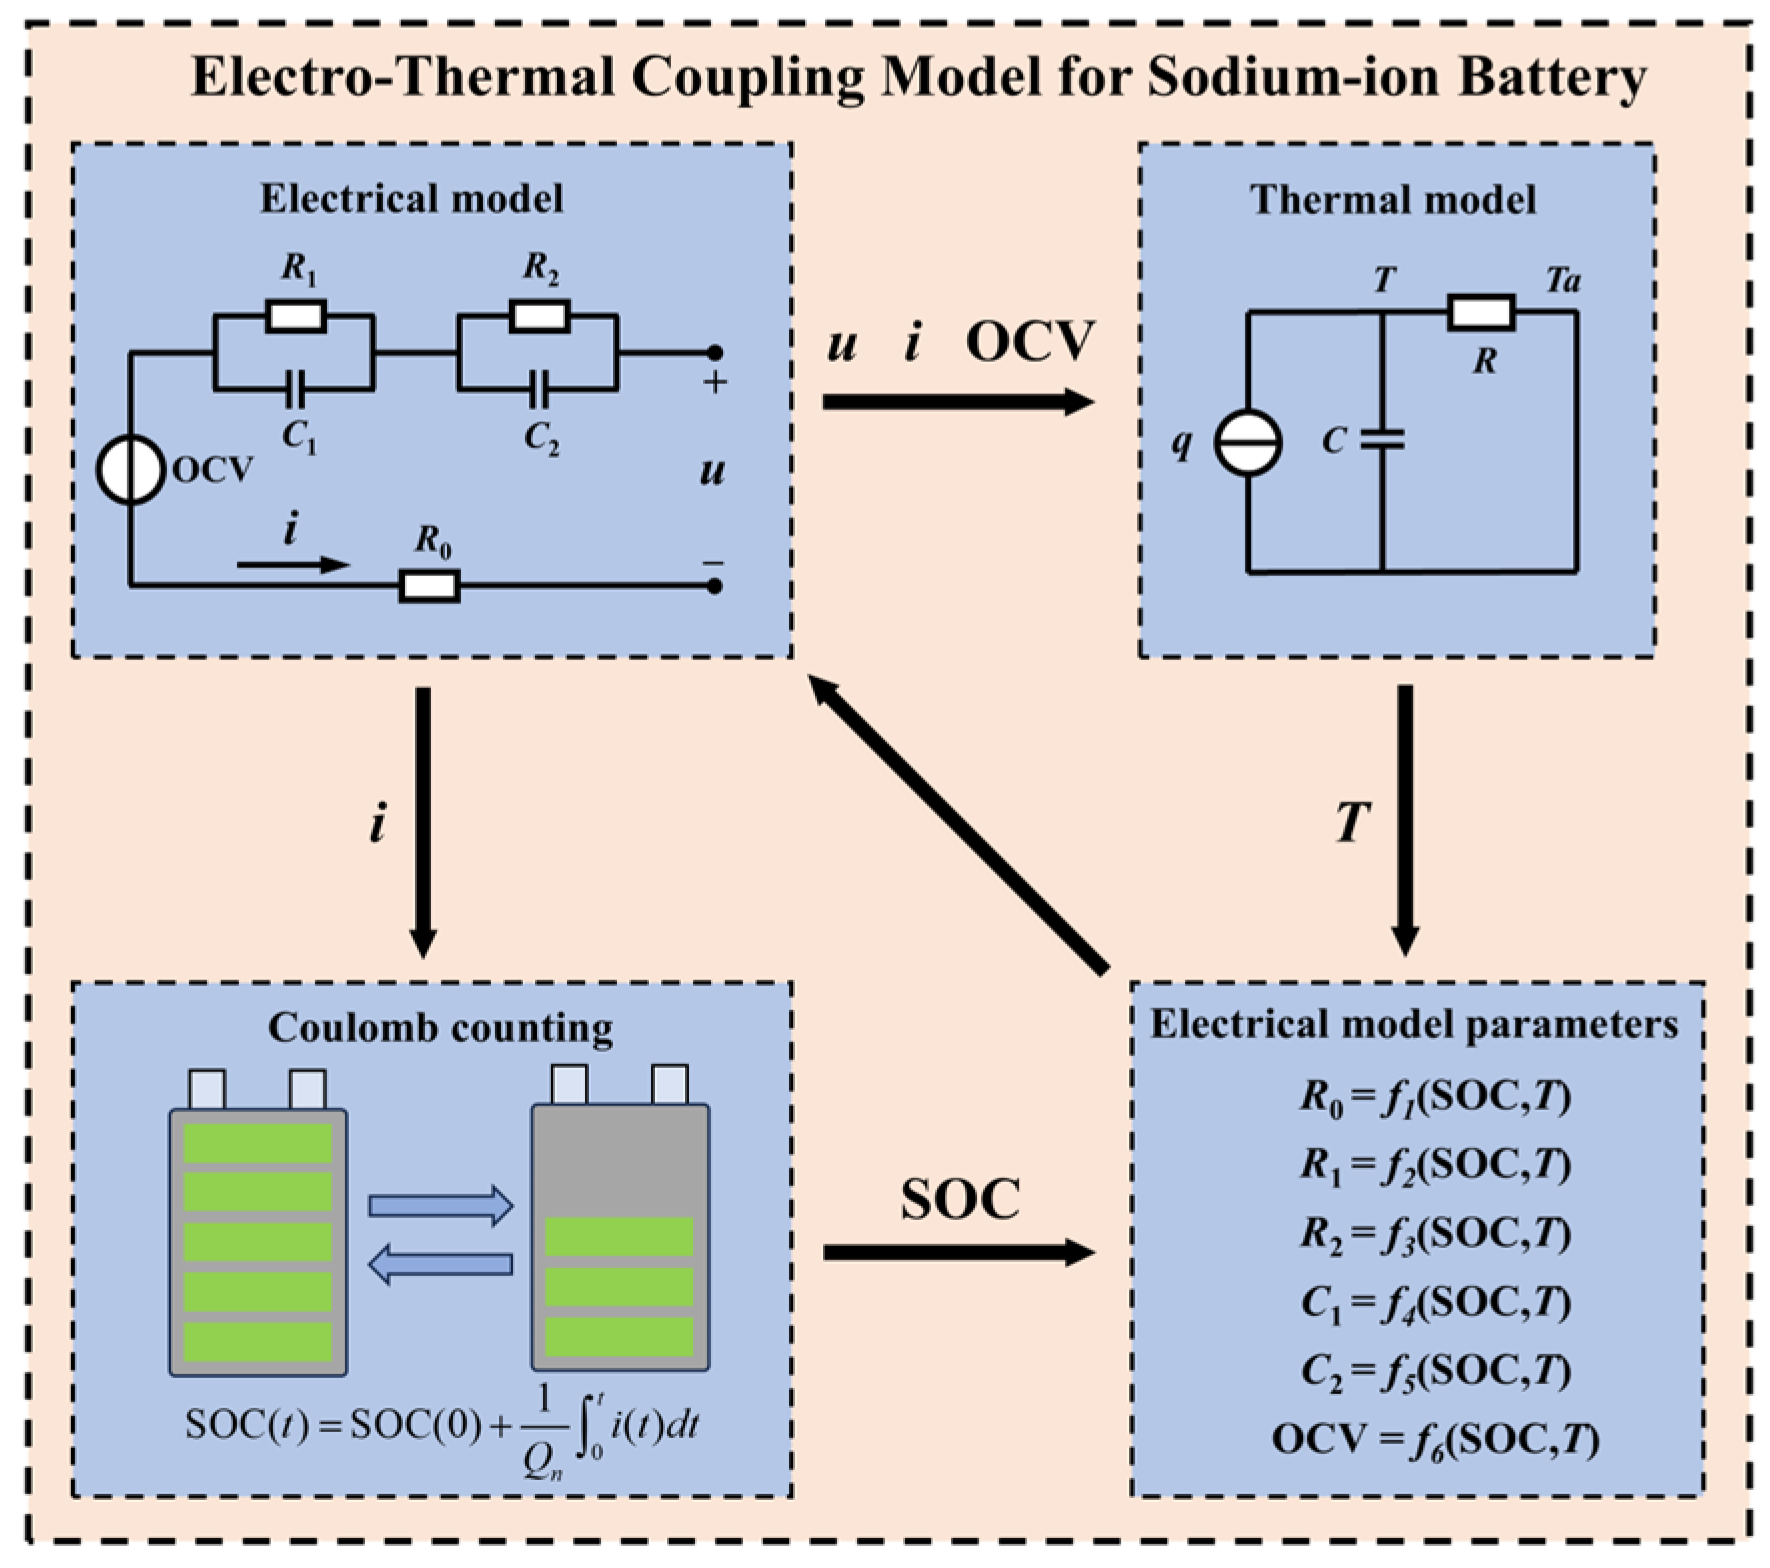
Figure 1. Schematic diagram of the electro-thermal coupling model for a sodium-ion cell.
Batteries 11 00312 g001
Figure 2. Schematic diagram of a 2-RC equivalent electrical circuit model.
Batteries 11 00312 g002
Figure 3. Schematic diagram of a lumped-parameter thermal model.
Batteries 11 00312 g003
Figure 4. The experimental rig for the battery testing.
Batteries 11 00312 g004
Figure 5. Current pulse profile of the M-HPPC test at SOC = 100%.
Batteries 11 00312 g005
Figure 6. Voltage response under discharge current pulse during the M-HPPC process.
Batteries 11 00312 g006
Figure 7. The thermocouple’s position on the battery.
Batteries 11 00312 g007
Figure 8. The parameter identification workflow for the thermal model.
Batteries 11 00312 g008
Figure 9. The experimental rig for measuring the specific heat capacity.
Batteries 11 00312 g009
Figure 10. The temperature change curve for the test cell during periods of heating and cooling.
Batteries 11 00312 g010
Figure 11. OCV-SOC relationship curves at different temperatures.
Batteries 11 00312 g011
Figure 12. Identification results of the ohmic resistance.
Batteries 11 00312 g012
Figure 13. Identification results of polarization resistance R1.
Batteries 11 00312 g013
Figure 14. Identification results of polarization resistance R2.
Batteries 11 00312 g014
Figure 15. Identification results of time constant τ1.
Batteries 11 00312 g015
Figure 16. Identification results of time constant τ2.
Batteries 11 00312 g016
Figure 17. Comparison of time constants after pulse discharges of different durations: (a) τ1, (b) τ2.
Batteries 11 00312 g017
Figure 18. Influence of different discharge duration thresholds on the voltage prediction accuracy under M-HPPC test conditions: (a) MAE, (b) MaxAE.
Batteries 11 00312 g018
Figure 19. The voltage prediction results of M-HPPC tests at different temperatures.
Batteries 11 00312 g019
Figure 20. Comparison of the voltage prediction errors under M-HPPC tests: (a) MaxAE, (b) MAE.
Batteries 11 00312 g020
Figure 21. Results of the specific heat capacity measurement experiment: (a) temperature evolution at different measuring points, (b) temperature difference between the inner and outer surfaces, (c) temperature change rate, and (d) the calculation result of the specific heat capacity.
Batteries 11 00312 g021
Figure 22. Temperature evolution during 1C CC discharge at 15 °C: (a) temperature profiles from T1–T5, and (b) temperature differences between T1–T5 and their average.
Batteries 11 00312 g022
Figure 23. The temperature and voltage prediction results of the electro-thermal coupling model at 15 °C.
Batteries 11 00312 g023
Figure 24. The temperature and voltage prediction results of the electro-thermal coupling model at 20 °C.
Batteries 11 00312 g024
Figure 25. The temperature and voltage prediction results of the electro-thermal coupling model under multi-stage discharge testing at 20 °C.
Batteries 11 00312 g025
Table 1. Specifications of the sodium-ion battery.
ParametersValues
Rated capacity (25 °C) (Ah)21
Voltage range (V)2.6–4.2
Standard charge rate0.2C
Maximum allowable discharge rate0.5C
Weight (g)720
Length/width/thickness (mm)220/140/11
Table 2. The results of parameter identification for the thermal model.
ParametersValues
cp (J/(kg °C))1194
R c o n v e c t i o n c e l l (°C/W)9.1
Rconvection (°C/W)6.5
Table 3. The entropy coefficient for the sodium-ion cell.
SOCEntropy Coefficient
Low SOC (15%)0 m V/K
Medium SOC (45%)−0.13 m V/K
High SOC (80%)−0.14 m V/K
Disclaimer/Publisher’s Note: The statements, opinions and data contained in all publications are solely those of the individual author(s) and contributor(s) and not of MDPI and/or the editor(s). MDPI and/or the editor(s) disclaim responsibility for any injury to people or property resulting from any ideas, methods, instructions or products referred to in the content.