1. Introduction
Despite the critical role of Li–ion batteries in enabling the transition to EVs, their development has been hindered by persistent technical challenges. A key issue is the accurate monitoring and control of battery behavior, particularly in estimating the SoC, which is essential for safe and efficient energy management. Inaccurate SoC estimation may lead to performance degradation, reduced battery lifespan, and compromised operational safety. These challenges highlight the need for advanced modeling and testing methodologies to better understand and manage Li–ion battery systems under varying operating conditions.
SoC estimation techniques are typically classified into three categories: model-based, data-driven, and hybrid methods. Model-based approaches are generally reliable but may suffer from modeling inaccuracies, whereas data-driven methods provide greater flexibility at the cost of requiring large amounts of training data. Hybrid methods seek to integrate the advantages of both strategies [
1].
Model-based approaches frequently employ equivalent circuit models (ECMs) or electrochemical models in conjunction with estimation algorithms such as Kalman filters. Among these, Extended Kalman Filters (EKFs) are particularly popular due to their ability to perform recursive state estimation. However, their performance can deteriorate under dynamic conditions, especially when faced with temperature fluctuations and variable load profiles [
2]. To address this limitation, an adaptive EKF was introduced that dynamically updates its parameters in real time to account for thermal variations, thereby enhancing SoC estimation accuracy [
3]. Building upon this advancement, a temperature-compensated dual EKF was later proposed to concurrently estimate both the SoC and the State of Health (SoH), thus offering a more comprehensive framework for battery diagnostics and management [
4].
Hybrid modeling techniques enhance estimation accuracy by combining the electrical properties of ECMs with the physical understanding provided by electrochemical models. These hybrid models have been shown to more effectively capture the coupled thermal and electrochemical behavior of lithium–ion batteries [
5]. Their performance is particularly notable under fluctuating load and temperature conditions, where they consistently outperform single-domain models [
6]. Additionally, the use of fractional-order Kalman filters—capable of accounting for memory effects and complex internal dynamics—has emerged as a promising direction. These advanced filters have demonstrated substantial gains in estimation accuracy when applied to nonlinear battery behavior scenarios [
7,
8].
Recent advancements in SoC estimation have increasingly relied on data-driven and machine learning-based techniques. Among these, comparative analyses of neural networks, support vector machines (SVMs), and random forest algorithms have shown that deep neural networks (DNNs) yield the highest prediction accuracy for SoC estimation [
9]. Further studies have demonstrated the effectiveness of real-time DNN implementations and neural observers in capturing the nonlinear dynamics of batteries and adapting to varying operational conditions [
10,
11,
12,
13].
Adaptive estimation frameworks have attracted significant interest due to their capability to handle the dynamic behavior of batteries in EV applications. Methods such as the Adaptive Unscented Kalman Filter (AUKF) and Adaptive Particle Filter (APF) have been shown to enhance robustness against non-Gaussian noise and abrupt load variations, outperforming conventional EKF and UKF techniques [
14]. Further refinements have been introduced to improve filter adaptability under battery aging effects, including the use of adaptive forgetting factors that prioritize recent data trends [
15].
In parallel, nonlinear observers like Sliding Mode Observers (SMOs) and High-Gain Observers (HGOs) have been explored for their resilience to measurement noise. SMOs, in particular, demonstrate high fault tolerance, although challenges such as chattering and complex tuning remain [
16].
With the growing availability of battery data, artificial intelligence (AI)-based techniques have gained traction in SoC estimation. Recurrent Neural Networks (RNNs) and Long Short-Term Memory (LSTM) models are particularly effective at capturing time-dependent characteristics of battery systems, with LSTM models demonstrating superior performance over traditional machine learning algorithms in dynamic driving scenarios [
17]. In addition, Convolutional Neural Networks (CNNs), typically applied in image recognition, have been adapted to extract spatial-temporal patterns from voltage and current time series, reducing the need for extensive preprocessing [
18].
To mitigate the interpretability challenges of black-box models, Physics-Informed Machine Learning (PIML) has emerged as a compelling hybrid approach. This strategy embeds domain-specific knowledge into machine learning architectures to reduce generalization errors and enhance model transparency [
19,
20]. Recent work has shown that combining electrochemical models with DNN-based residual correction modules or integrating physical and neural model estimates via Kalman filter-based fusion can deliver both accurate predictions and real-time confidence scores [
21].
Modern EV battery management systems are increasingly leveraging multi-sensor data fusion to improve estimation robustness. Ensemble Kalman Filters, for example, have been employed to integrate diverse sensor measurements—such as voltage, current, temperature, and impedance—thus mitigating the impact of sensor drift [
22]. Furthermore, combining impedance-based features with time-series data through SVMs has been shown to enhance SoC estimation accuracy, especially under cold-start and high-rate discharge conditions [
23].
Quantifying uncertainty in SoC estimation has become increasingly critical to ensure reliability and safety in battery management systems. Techniques such as Bayesian Neural Networks (BNNs) and Monte Carlo Dropout offer the advantage of providing confidence intervals, allowing the model to express its own uncertainty in predictions [
24]. Probabilistic graphical models, including Hidden Markov Models (HMMs), have been applied to capture stochastic SoC transitions, particularly under erratic driving conditions [
25].
Addressing the effects of battery aging presents an additional challenge. Degradation-aware estimators that treat SoH as a dynamic variable have been developed to compensate for capacity fade and performance loss over time [
26]. Hybrid techniques, such as the combination of Recursive Least Squares with Extended Kalman Filters, have enabled joint estimation of SoC and SoH [
27], while reinforcement learning approaches trained on long-term degradation data have demonstrated improved adaptability and prediction accuracy in aged batteries [
28].
Deploying SoC estimation algorithms in real-time embedded systems introduces computational limitations. Lightweight variants of traditional algorithms—such as optimized EKF implementations for embedded microcontrollers—have achieved high-speed convergence suitable for automotive platforms [
29,
30]. Memory-efficient Quantized Neural Networks (QNNs) [
31] and high-parallelism Field Programmable Gate Array (FPGA)-based implementations [
32] have further facilitated the integration of advanced SoC estimation methods in embedded environments.
Considering the diversity in battery chemistries and usage patterns, transfer learning and federated learning have emerged as valuable tools. Transfer learning enables pre-trained SoC models developed for one battery type (e.g., NCA) to be adapted to another chemistry (e.g., LFP) with minimal additional data [
33]. Federated learning frameworks allow multiple EVs to collaboratively improve model performance without sharing raw data, thus preserving data privacy [
34]. Domain adaptation methods—such as adversarial learning techniques—help translate SoC models trained under controlled laboratory conditions to real-world driving environments [
35].
To promote reproducibility and benchmarking, the community increasingly relies on standardized datasets such as NASA’s Prognostics Center of Excellence (PCoE), the Oxford Battery Degradation Dataset, and CALCE. Simulation platforms, including MATLAB Simulink BMS Toolbox (2024b), D2CAN, and BATTnet, provide standardized environments for evaluating SoC estimators under diverse drive cycles like FTP-75 and WLTC. A consolidated comparison of key SoC estimation techniques is presented in
Table 1.
The growing reliance on electric mobility necessitates intelligent battery systems capable of real-time decision-making. Accurate SoC estimation is essential not only for ensuring operational safety but also for enhancing driving range, optimizing charging cycles, and extending battery lifespan. Developing more precise, adaptive, and scalable estimation methods will significantly advance the EV industry while also addressing broader environmental concerns related to transportation emissions.
Recent advancements in SoC estimation and OCV characterization have introduced numerous hybrid approaches combining data-driven and model-based techniques. For example, Kalman filtering methods, adaptive observers, and neural networks are widely used to improve accuracy under varying temperature and current profiles [
35,
36,
37]. Moreover, physics-informed models that incorporate electrochemical impedance and hysteresis effects have shown promise in enhancing SoC tracking fidelity [
38,
39,
40]. Integrating such approaches into practical applications remains a challenge, particularly under dynamic operating conditions. Thus, the present work aims to contribute by offering an experimentally validated estimation framework tailored for structured hybrid operating scenarios.
Despite extensive research, a clear gap remains in the practical integration of robust, real-time SoC estimation methods. Existing approaches often struggle to adapt to dynamic load profiles, temperature variations, and battery aging. Furthermore, only a limited number of studies effectively bridge empirical testing and mathematical modeling in a manner that ensures both computational efficiency and estimation accuracy for embedded system applications.
The major contributions of this article can be summarized as follows:
In-depth experimental analysis of Li–ion batteries was conducted, focusing on their charging and discharging behaviors.
A measurement bench was designed and implemented, programmed with MATLAB (2024b) and dSPACE DS1104 cards for accurate current and voltage acquisition.
The acquired data were processed to develop mathematical models that reflect the functional characteristics of Li–ion batteries.
Suitable SoC estimation techniques were investigated and applied, including model-based and data-driven approaches.
This study contributes to the development of efficient energy management systems that improve range estimation, battery safety, and overall EV performance.
2. Proposed Test Bench
Accurate characterization of battery behavior under varying operating conditions is fundamental to enhancing the performance and reliability of Battery Management Systems (BMS). In this context, the proposed test bench aims to systematically explore the relationship between the SoC and OCV while also validating charging protocols and sensor calibration. The test environment has been designed with precision instrumentation and controlled parameters to ensure repeatability and practical relevance.
2.1. Experimental Methodology for SoC–OCV Relationship Analysis
The relationship between SoC and OCV is critical for evaluating the performance of rechargeable batteries, especially in applications such as electric vehicles and renewable energy systems. Understanding this correlation allows for accurate estimation of SoC using voltage readings, which is essential for BMS to ensure battery longevity, operational safety, and optimal energy use. To explore this relationship, a comprehensive experimental protocol was implemented under various operating conditions, including different charge/discharge rates and cycling behaviors. The primary objective was to generate a reliable SoC–OCV curve suitable for integration into real-world BMS applications. Data acquisition was performed using a dSPACE DS1104 card operating at a sampling frequency of 10 kHz. Voltage and current signals were synchronized and analogically normalized within the range of [−10 V, 10 V] before entering the board’s built-in Analog-to-Digital Converter (ADC). These values were then digitally denormalized within the software to represent actual voltage (V) and current (A) levels. To maintain a manageable data size and reflect the battery’s response time realistically, measurements were recorded at one-minute intervals. Analog signal conditioning was achieved using voltage dividers, and preliminary calibration tests were conducted by comparing digitally acquired values with reference readings from a voltmeter and ammeter. This ensured the integrity and reliability of the measured data for further analysis.
2.2. Battery Charge Procedure
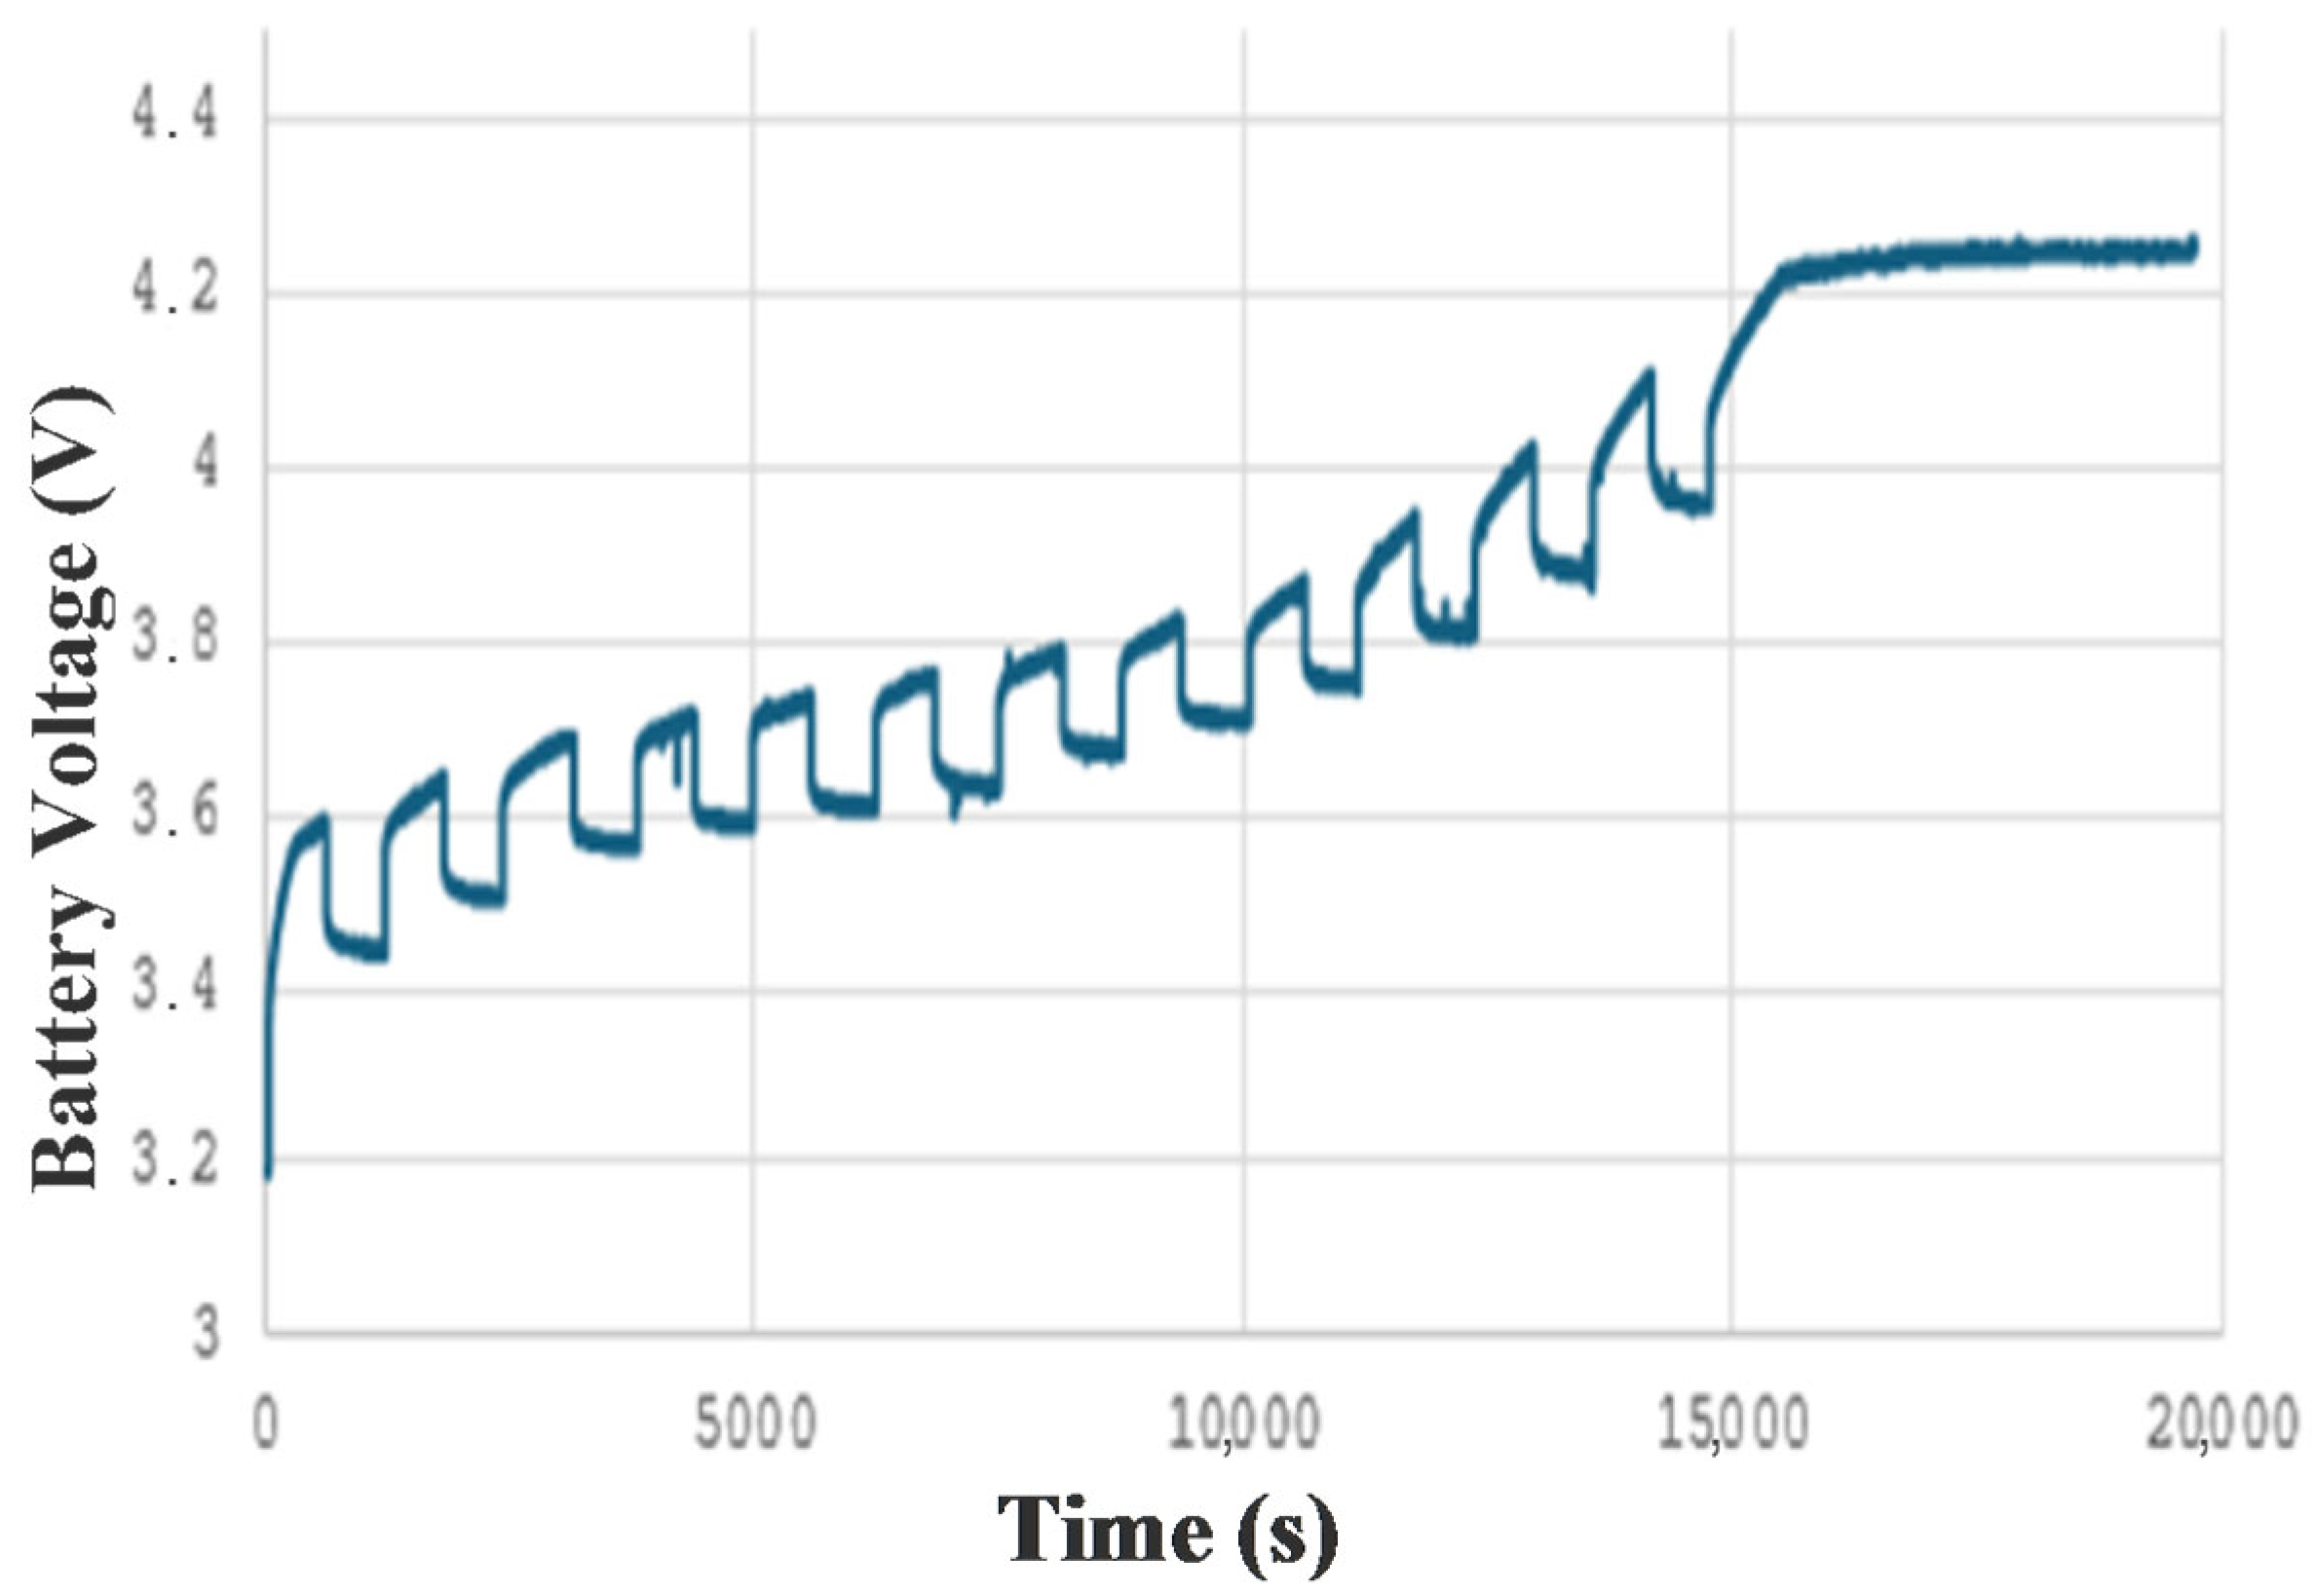
This section outlines the experimental steps followed during the battery charging process and includes the corresponding circuit schematic as presented in
Figure 1. All tests were conducted at a stable ambient temperature of 25 °C using a new, unused Li-Mn 26650 cylindrical cell. The charging protocol followed the standard Constant Current–Constant Voltage (CC–CV) method, which is widely accepted for lithium–ion batteries due to its balance between efficiency, safety, and cell life. The custom-built test bench integrates dSPACE data acquisition (DAQ) hardware with MATLAB-based control algorithms to enable precise measurement and control of current and voltage during battery cycling tests. The DAQ system is configured with a sampling rate of 1 kHz (1000 samples per second), ensuring sufficient temporal resolution to accurately capture the dynamic response of the lithium–ion battery throughout both charging and discharging cycles. This sampling rate is chosen to support accurate modeling and performance analysis.
2.2.1. Constant Current (CC) Stage
In the first stage, the battery was charged at a constant current of 0.9 A, continuing until the terminal voltage reached 4.2 V, which is the upper cutoff limit for the cell.
2.2.2. Constant Voltage (CV) Stage
After reaching 4.2 V, the charger switched to constant voltage mode, maintaining the voltage at that level while the charging current gradually decreased. This phase ended when the current dropped below a set threshold, typically around 0.1 A (C/20 rate), to ensure the cell was fully charged without risking overcharge or lithium plating.
This two-stage CC–CV approach is designed to protect the battery from thermal stress, thereby extending its cycle life and improving overall system safety.
2.3. Battery Discharge Procedure
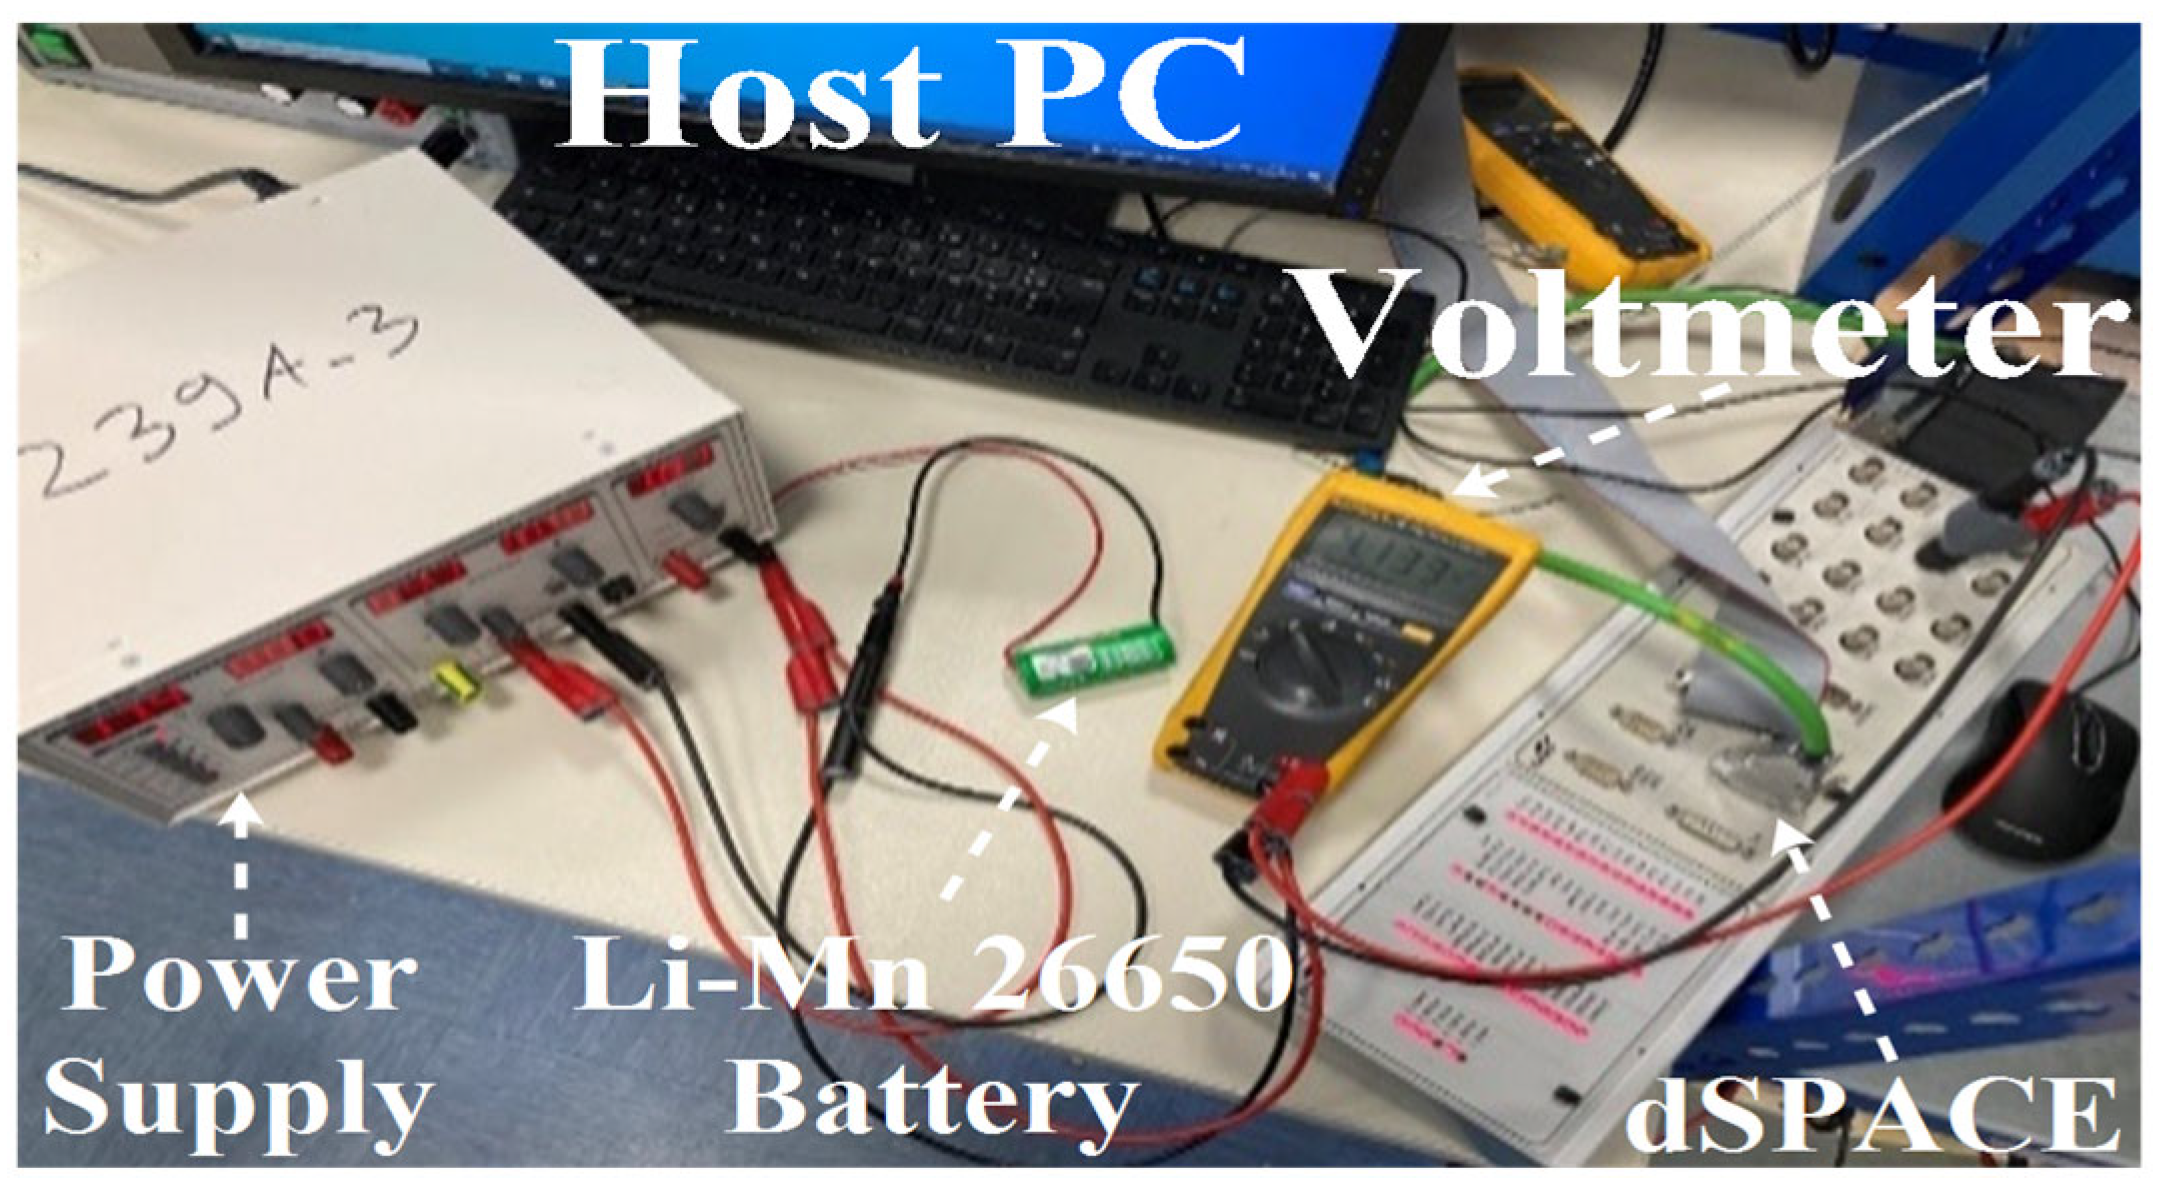
To evaluate the discharge behavior of the tested Li-Mn 26650 battery, a controlled intermittent discharge protocol was implemented. All experiments were conducted under stable ambient conditions (25 ± 2 °C), with continuous monitoring of both the state of charge (SoC) and open-circuit voltage (OCV) throughout the testing process. The discharge current was regulated using a laboratory-grade programmable DC power supply equipped with multiple output channels, voltage and current adjustment knobs, digital displays, and built-in safety indicators. This setup enabled precise control of discharge conditions while ensuring operational safety. The experimental configuration also incorporated thermal and safety monitoring mechanisms to detect potential anomalies during the cycling procedure. The complete discharge circuit arrangement is illustrated in
Figure 2.
The experimental procedure consists of two primary stages:
2.4. Preconditioning Phase
Before initiating the full discharge test, the battery is subjected to a preconditioning phase consisting of 31 controlled cycles to stabilize its electrochemical behavior and simulate intermittent operational conditions. Each cycle involves:
This process spans approximately 10.3 h, allowing the battery to be partially cycled in a controlled environment. The rest period was chosen based on preliminary observations indicating that voltage stabilization typically occurs within 4 to 6 min. To ensure consistency and margin, a 10 min rest duration was adopted after each discharge event.
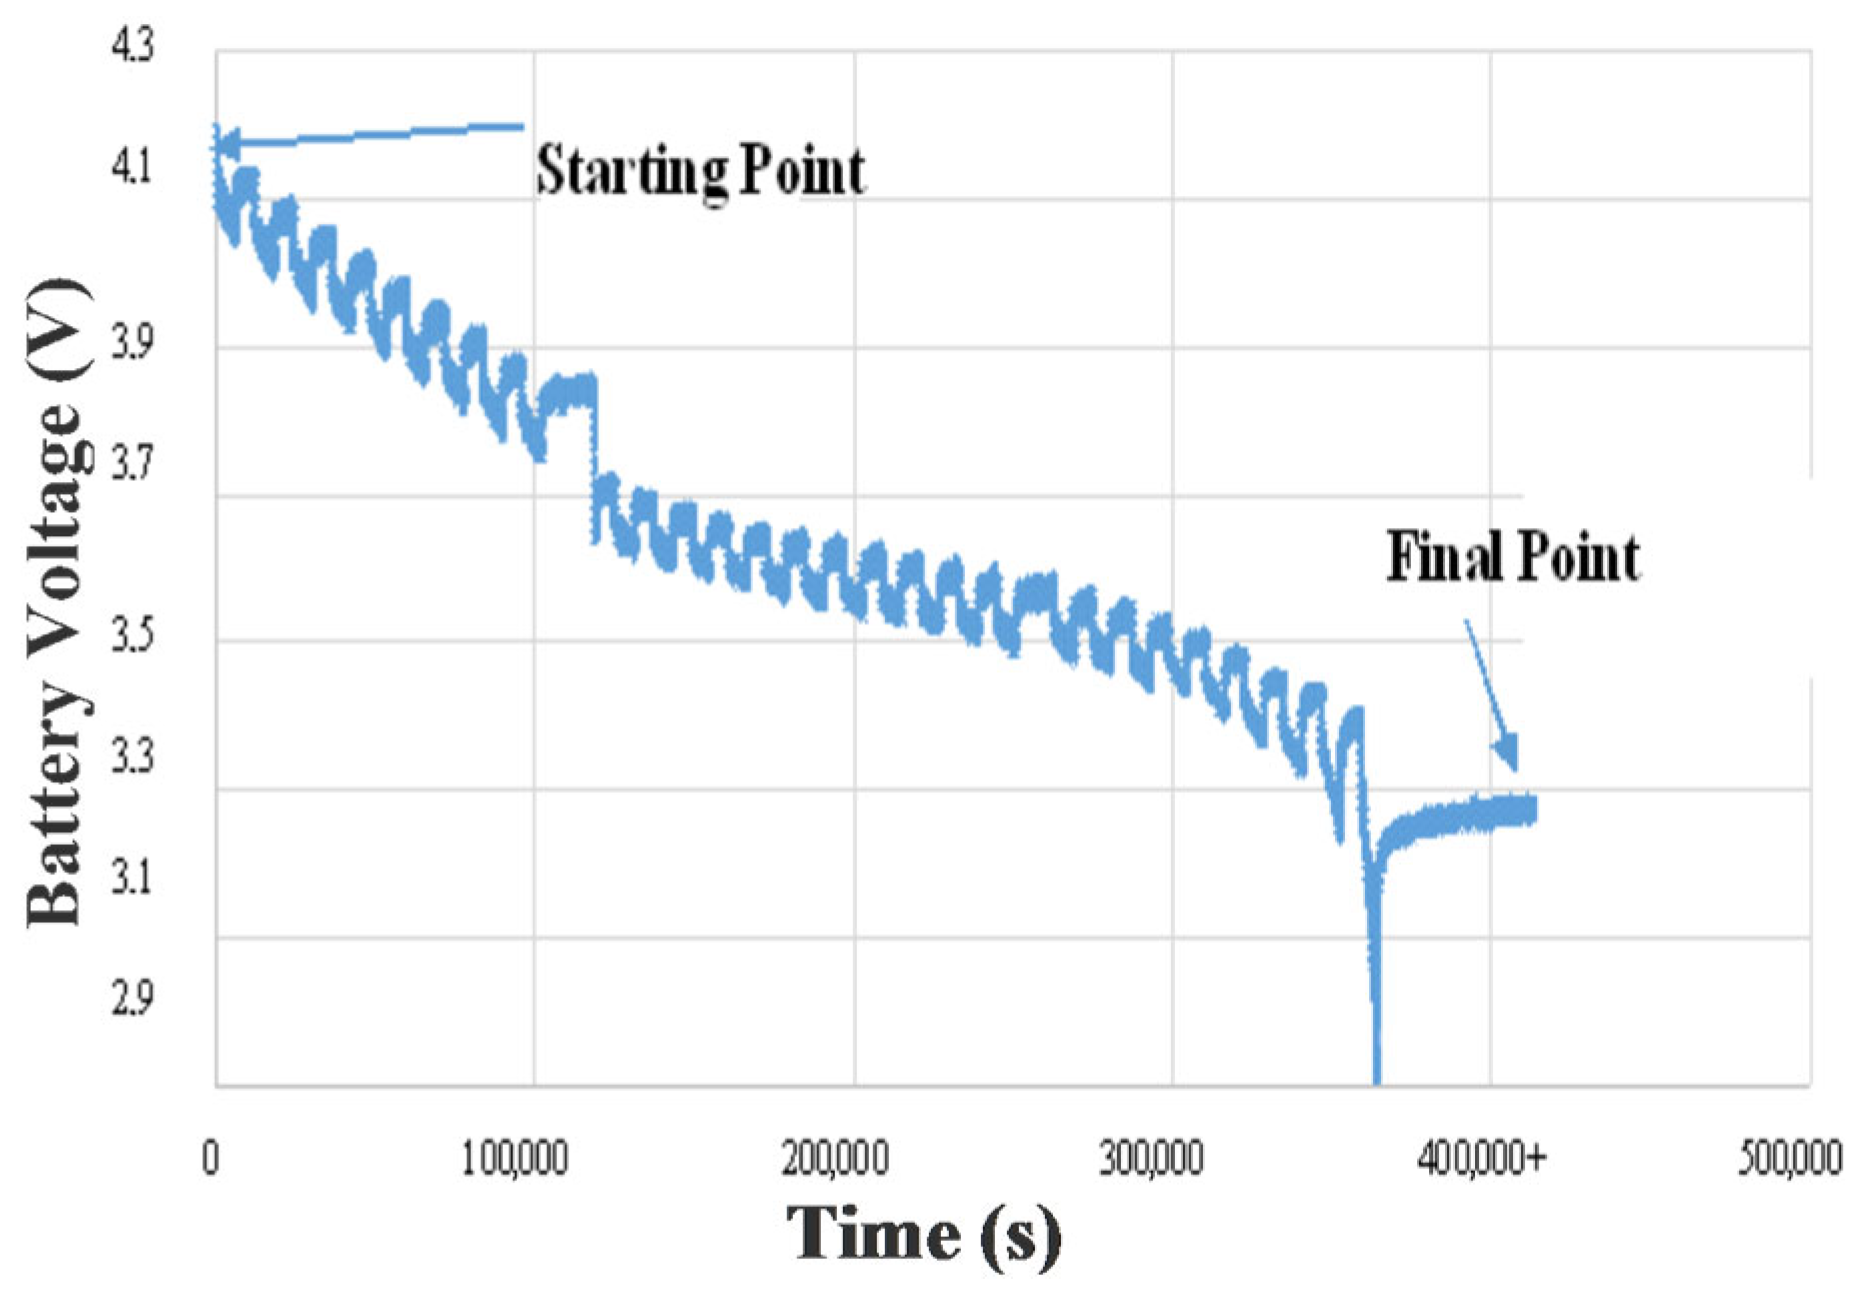
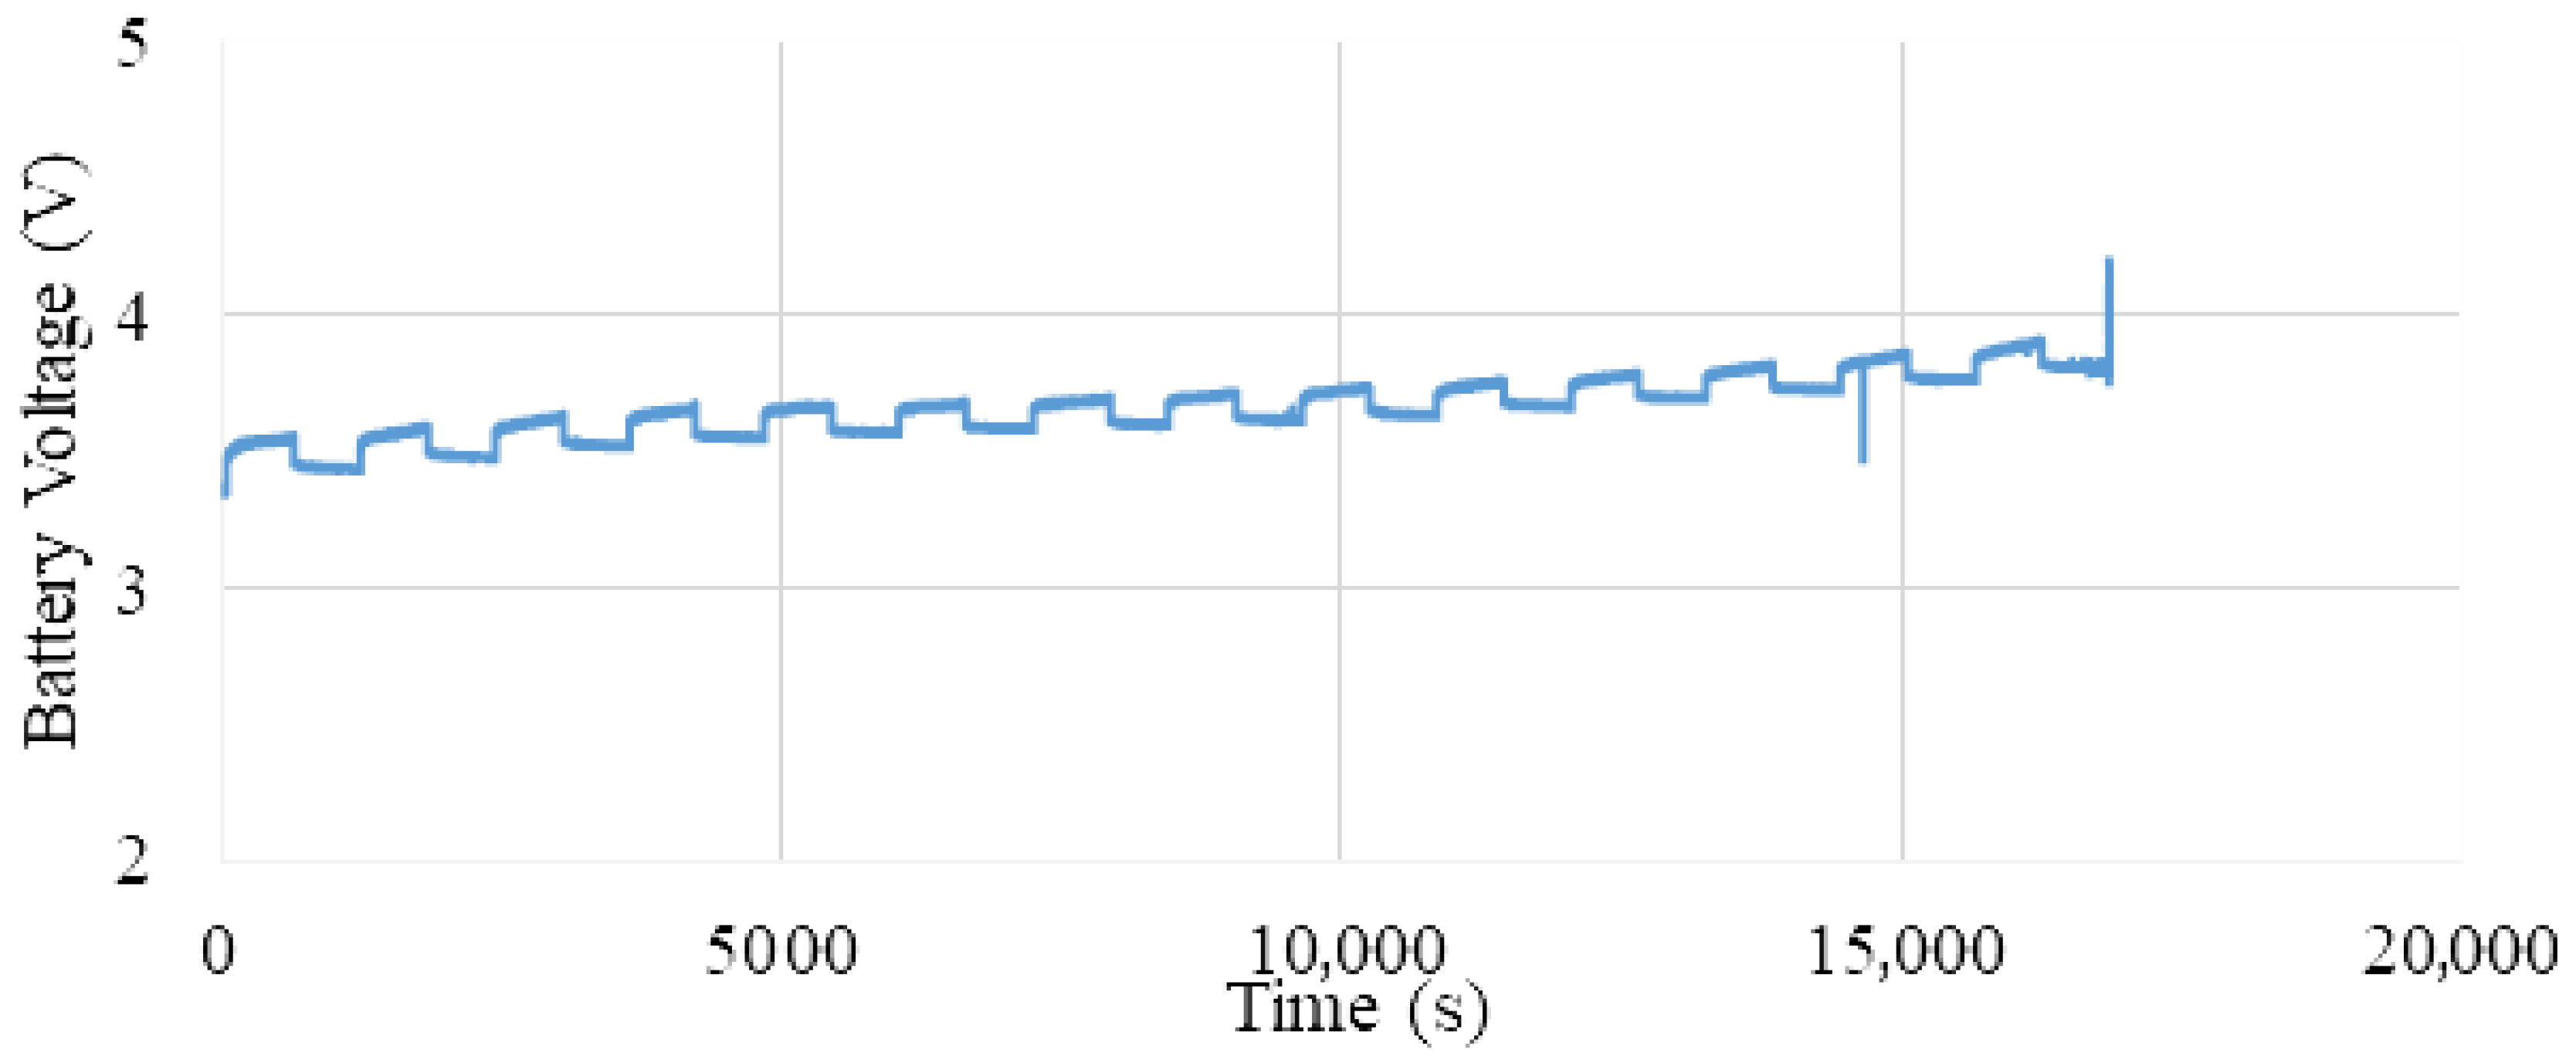
Figure 3 clearly illustrates the evolution of terminal voltage over time during this preconditioning phase. The periodic voltage drops correspond to discharge intervals, while the plateaus represent rest periods where the battery voltage stabilizes. The gradual decrease in voltage over successive cycles reflects the partial energy depletion and dynamic internal adjustments of the battery.
It is important to note that aging effects or faulty battery behaviors were not considered within the scope of this study. These aspects are suggested for future research to further explore long-term performance degradation.
Figure 3 depicts the voltage behavior of the battery over the course of 31 preconditioning cycles. A clear pattern of periodic voltage decline during discharge and recovery during rest is observed. This structured fluctuation helps ensure a stable baseline for subsequent discharge tests.
To ensure a well-defined initial SoC, the battery was fully charged prior to the preconditioning phase using a standard constant-current/constant-voltage (CC-CV) protocol. The charging process continued until the terminal voltage reached 4.2 V and the current dropped below 0.05 C, indicating full charge saturation. This procedure established the battery’s SoC at 100%. To validate this assumption, the cumulative discharge capacity during the test cycles was closely monitored and found to be consistent with the manufacturer’s nominal rated capacity, thereby confirming the reliability of the initial SoC setting.
The selection of 31 preconditioning cycles was based on preliminary experiments and literature guidelines, which suggest that 25–35 cycles are typically sufficient to stabilize battery behavior before conducting precise characterization tests [
6,
11,
13]. During our initial trials, we observed that after approximately 30 cycles, the terminal voltage and SoC variations between successive cycles became minimal, indicating a stable electrochemical state. Therefore, 31 cycles were chosen to ensure consistency while avoiding unnecessary aging, striking a balance between reliability and test efficiency.
2.5. Main Discharge Phase
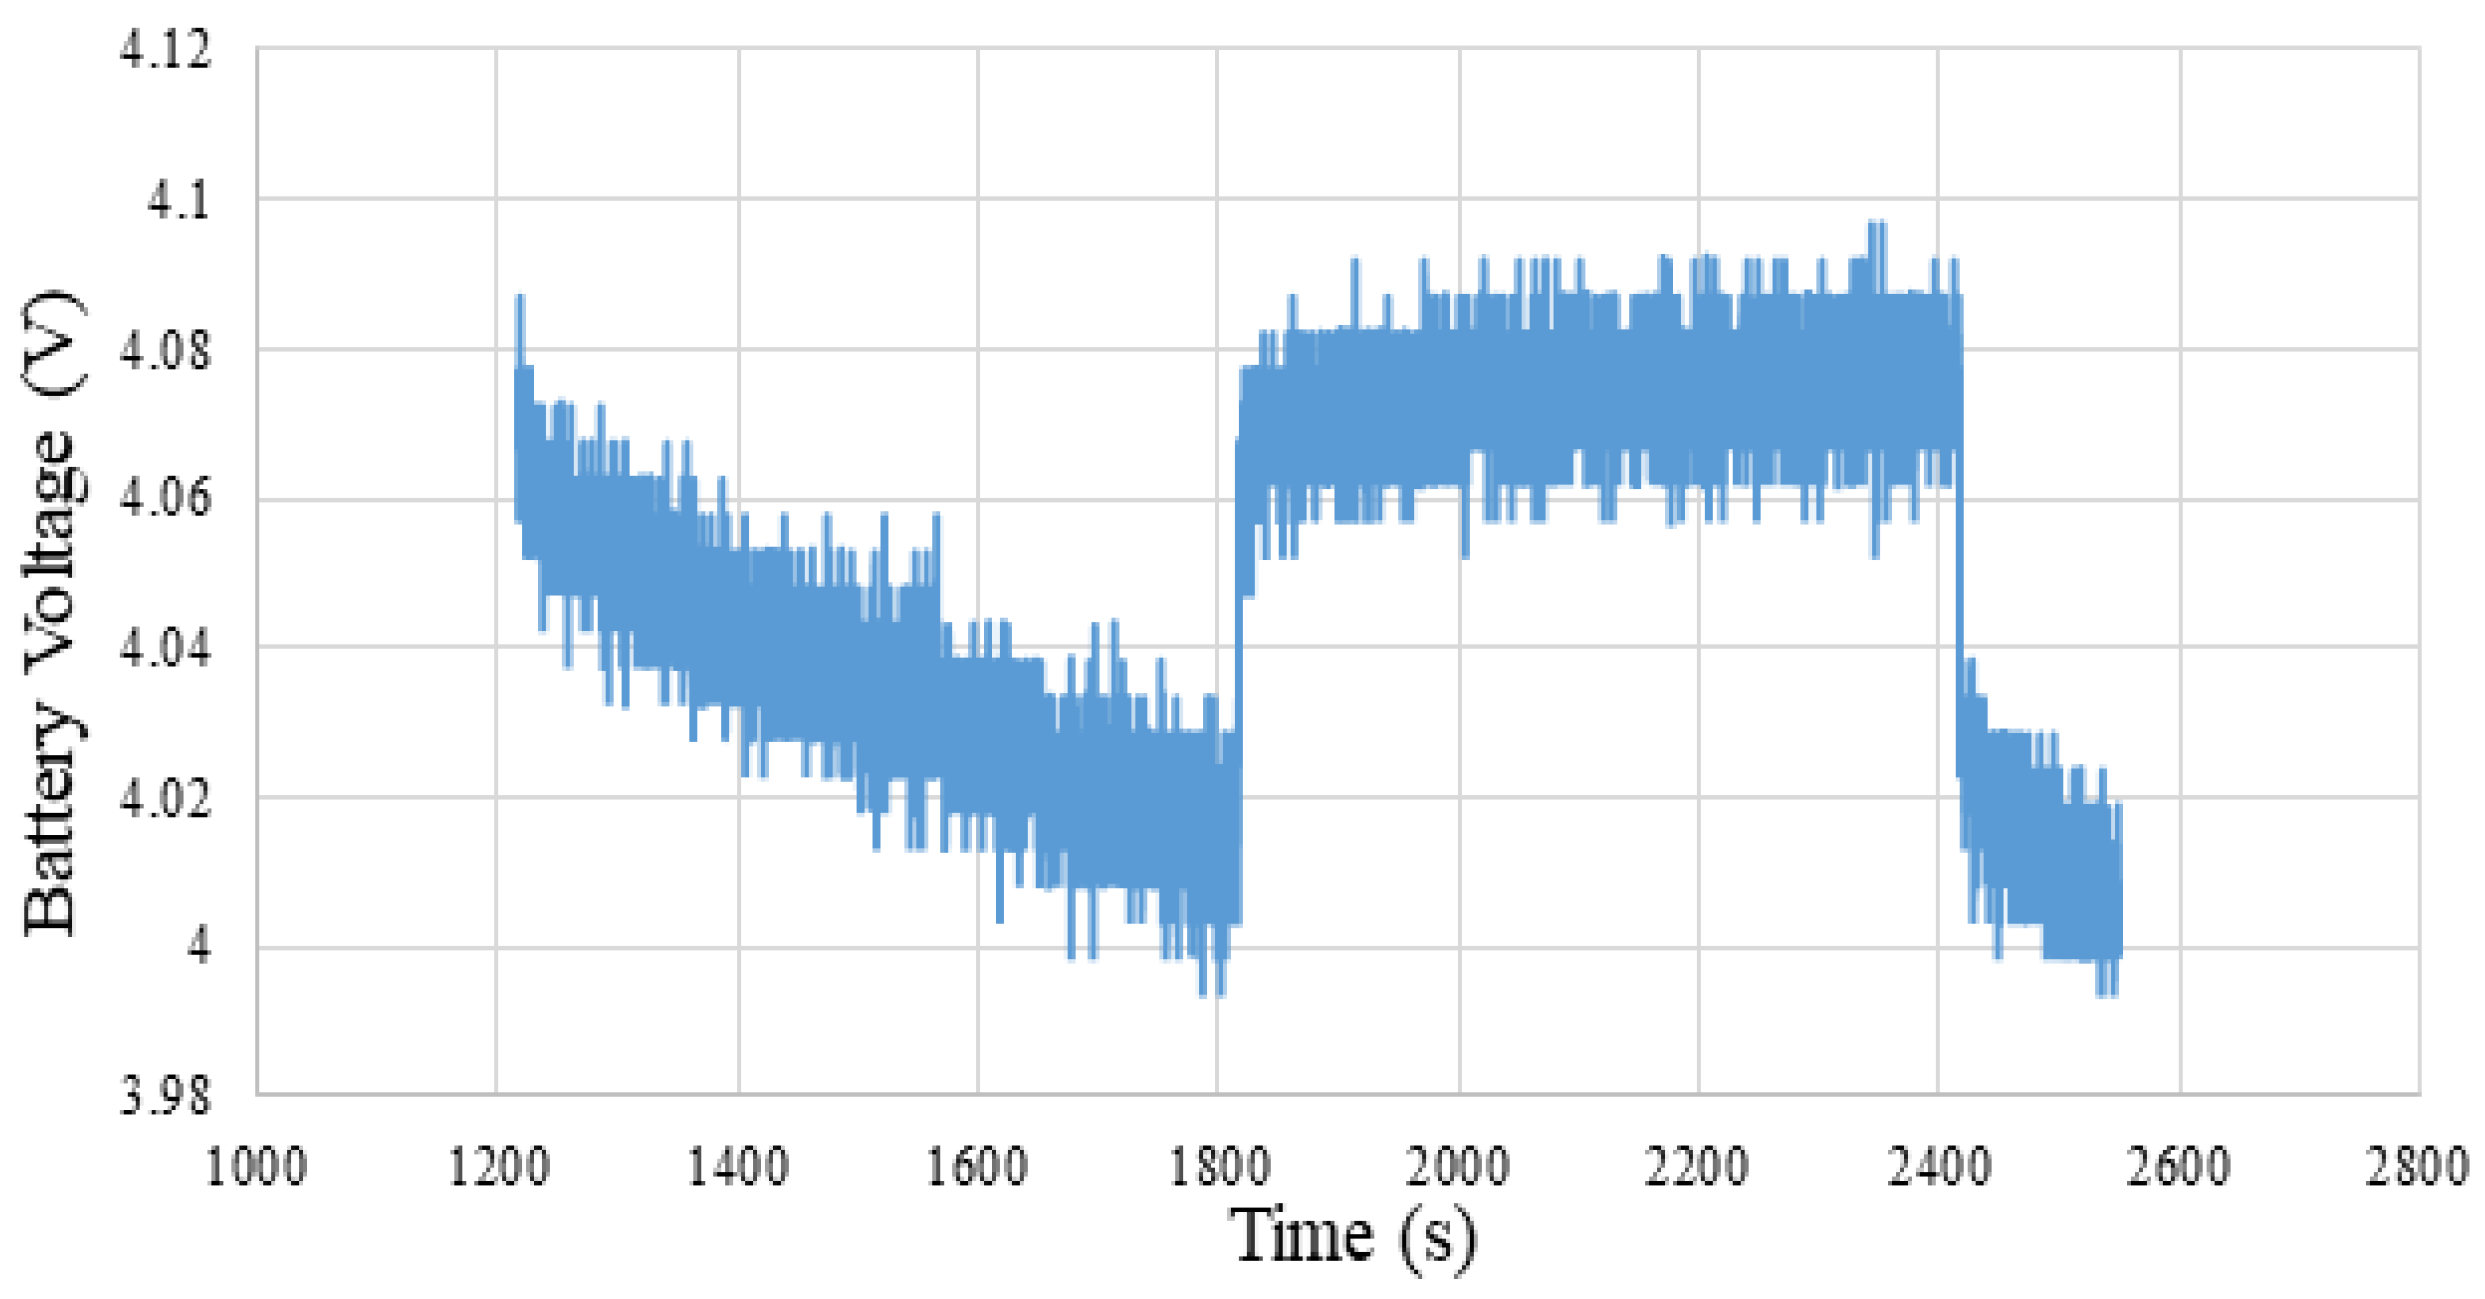
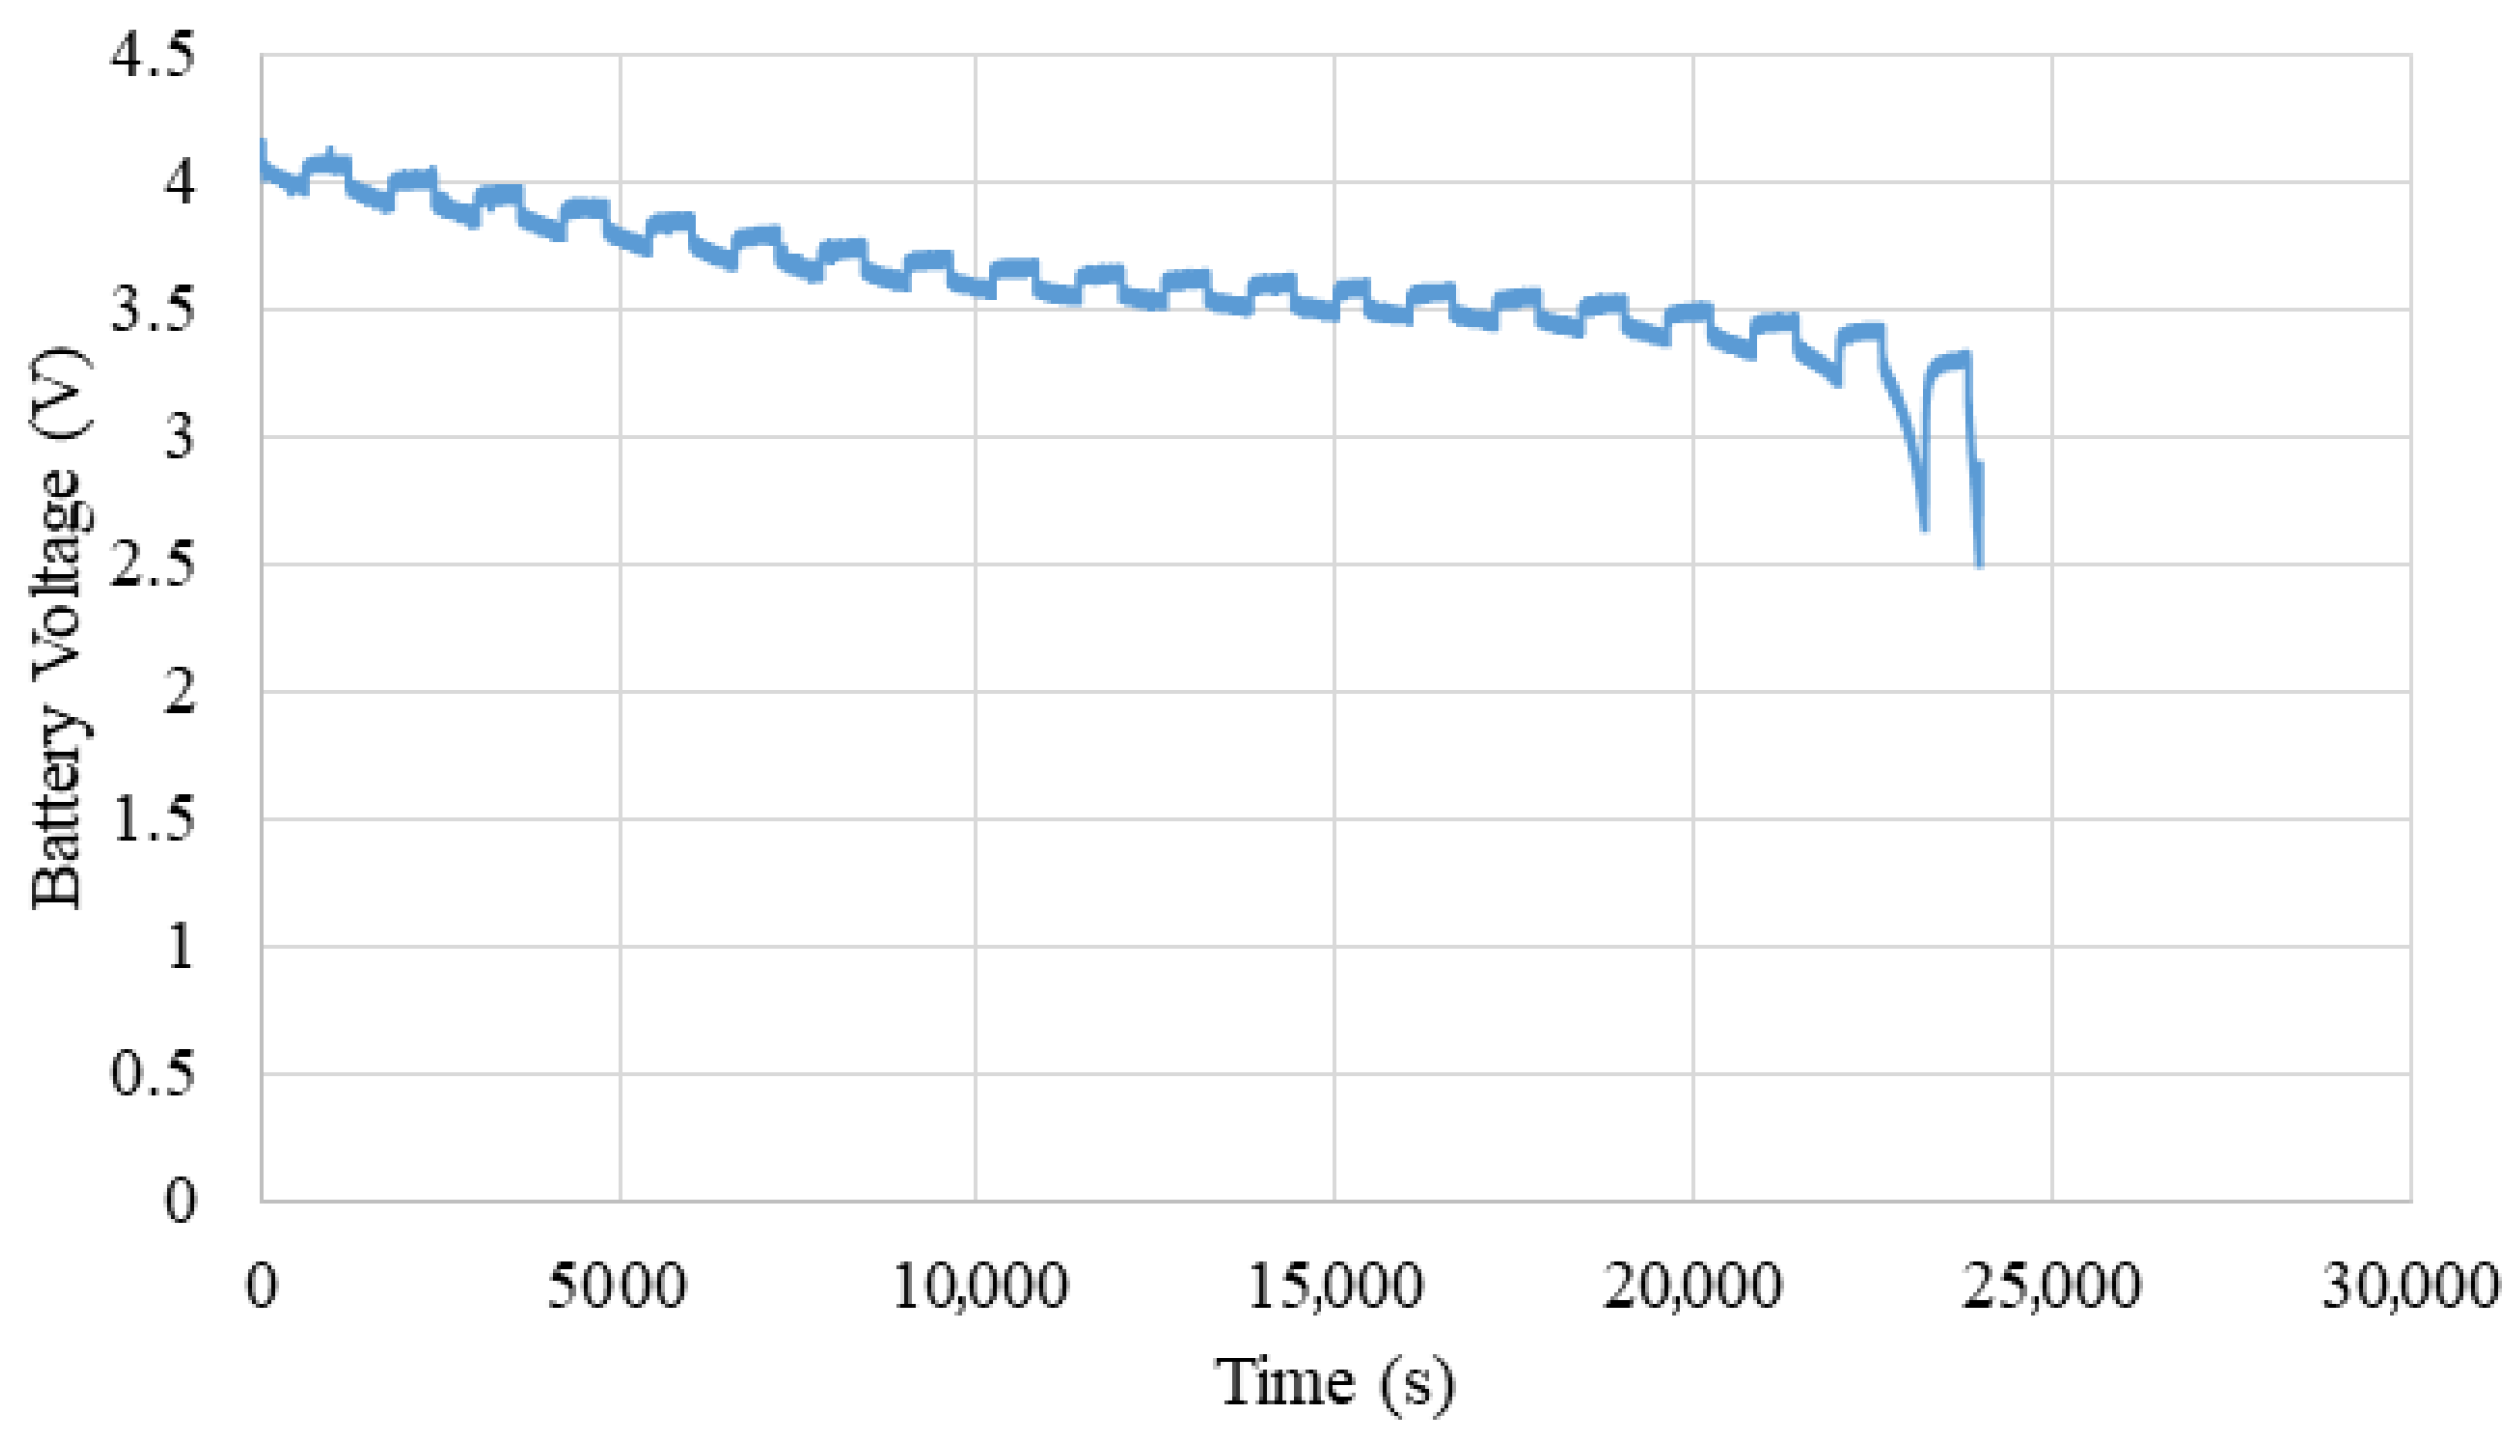
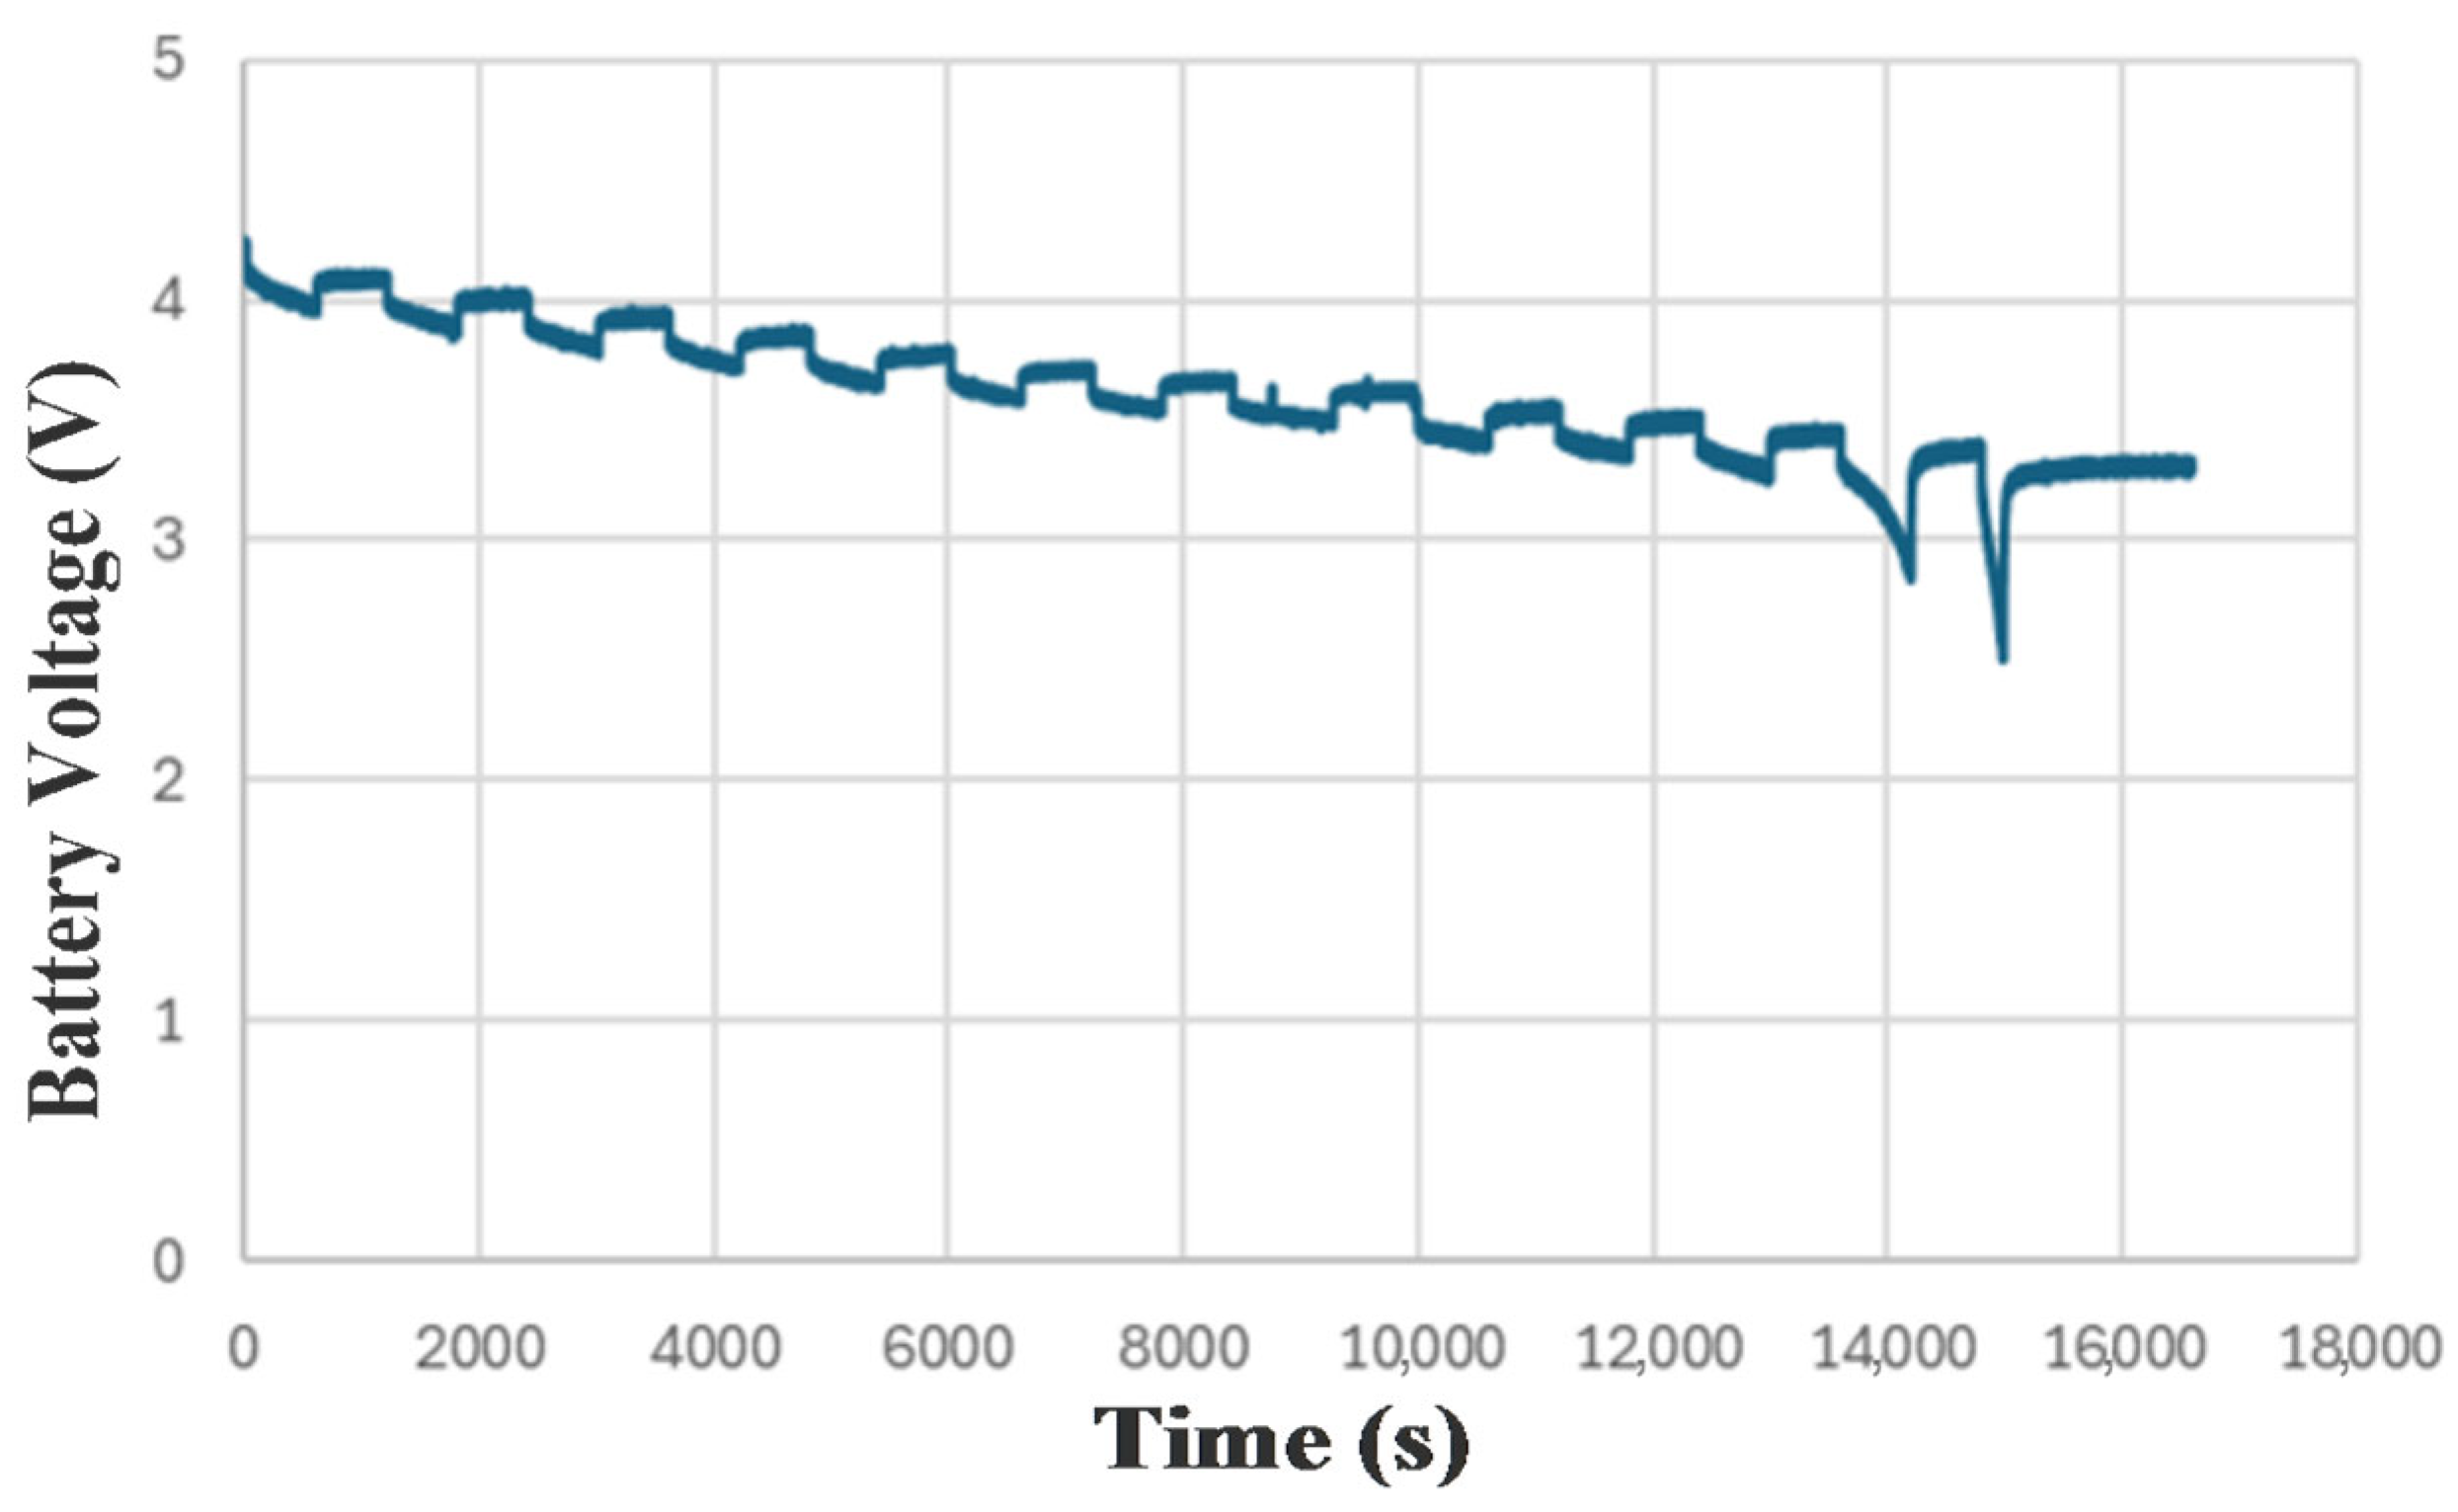
Following the preconditioning phase, the battery underwent a structured discontinuous discharge protocol lasting approximately 10 h. As depicted in
Figure 4, the voltage profile reflects controlled current interruptions and resting intervals designed to assess dynamic performance and relaxation behavior. The discharge was conducted at a constant current of 0.8 A, with periodic pauses allowing the cell to stabilize thermally and electrochemically.
To ensure high-fidelity monitoring, key parameters such as terminal voltage, internal temperature, accumulated capacity, and internal resistance were recorded. Data acquisition was performed at one-minute intervals using an integrated Battery Management System, enabling time-resolved analysis of cell behavior under non-steady-state conditions. This detailed voltage trajectory not only validates the consistency of the discharge method but also supports reliable calibration for subsequent state-of-charge estimation and performance benchmarking.
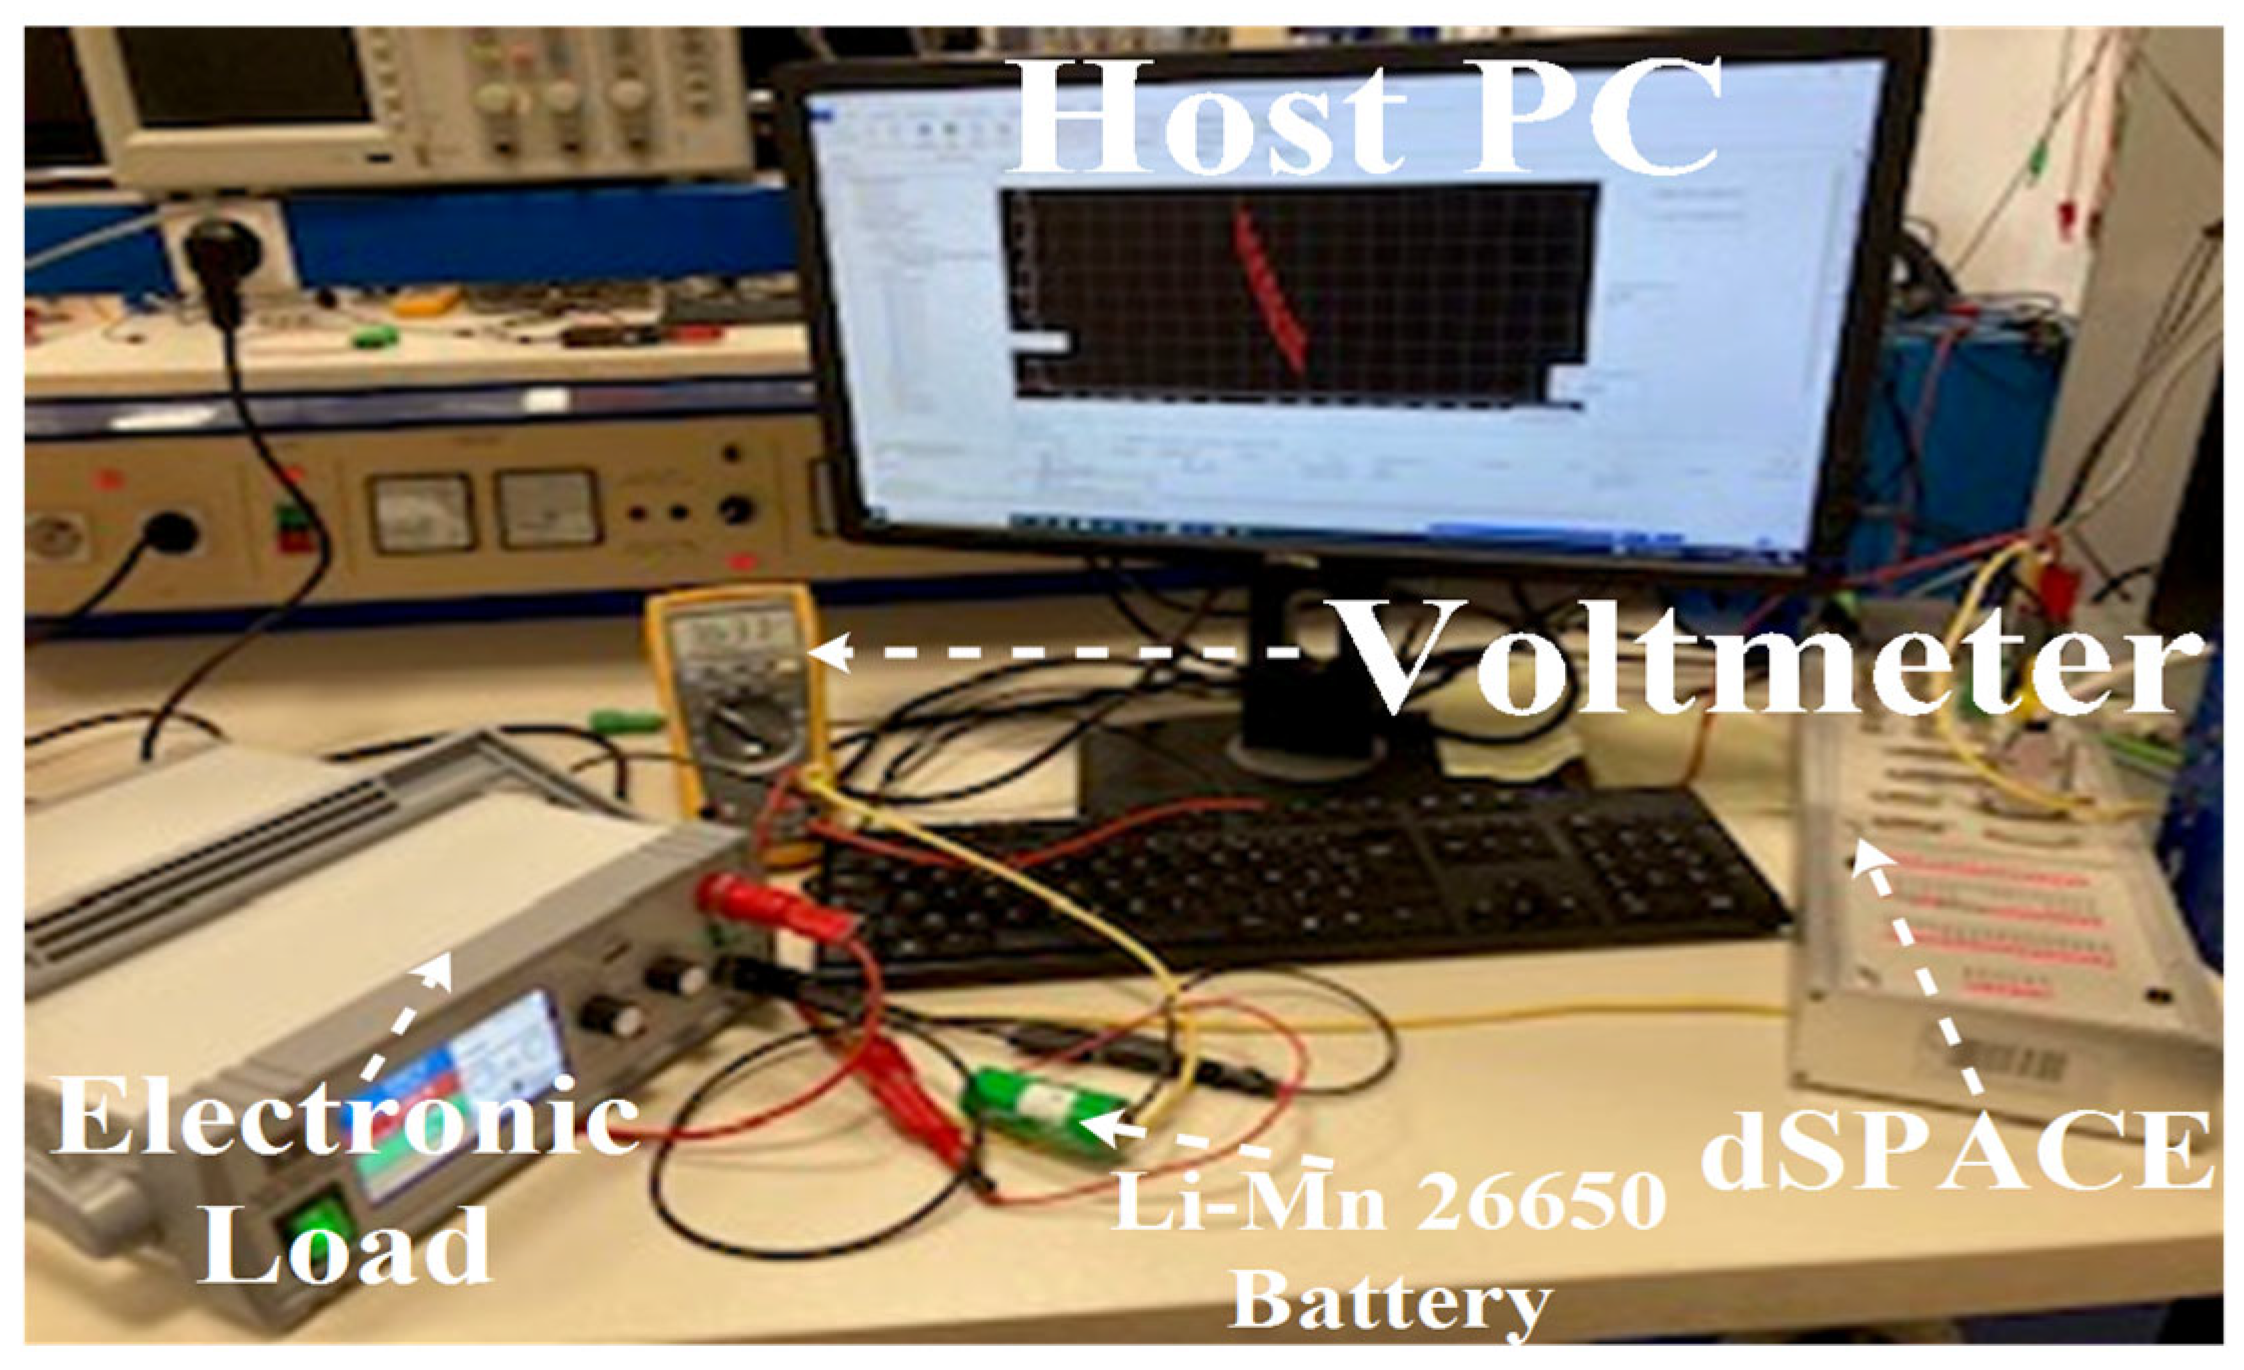
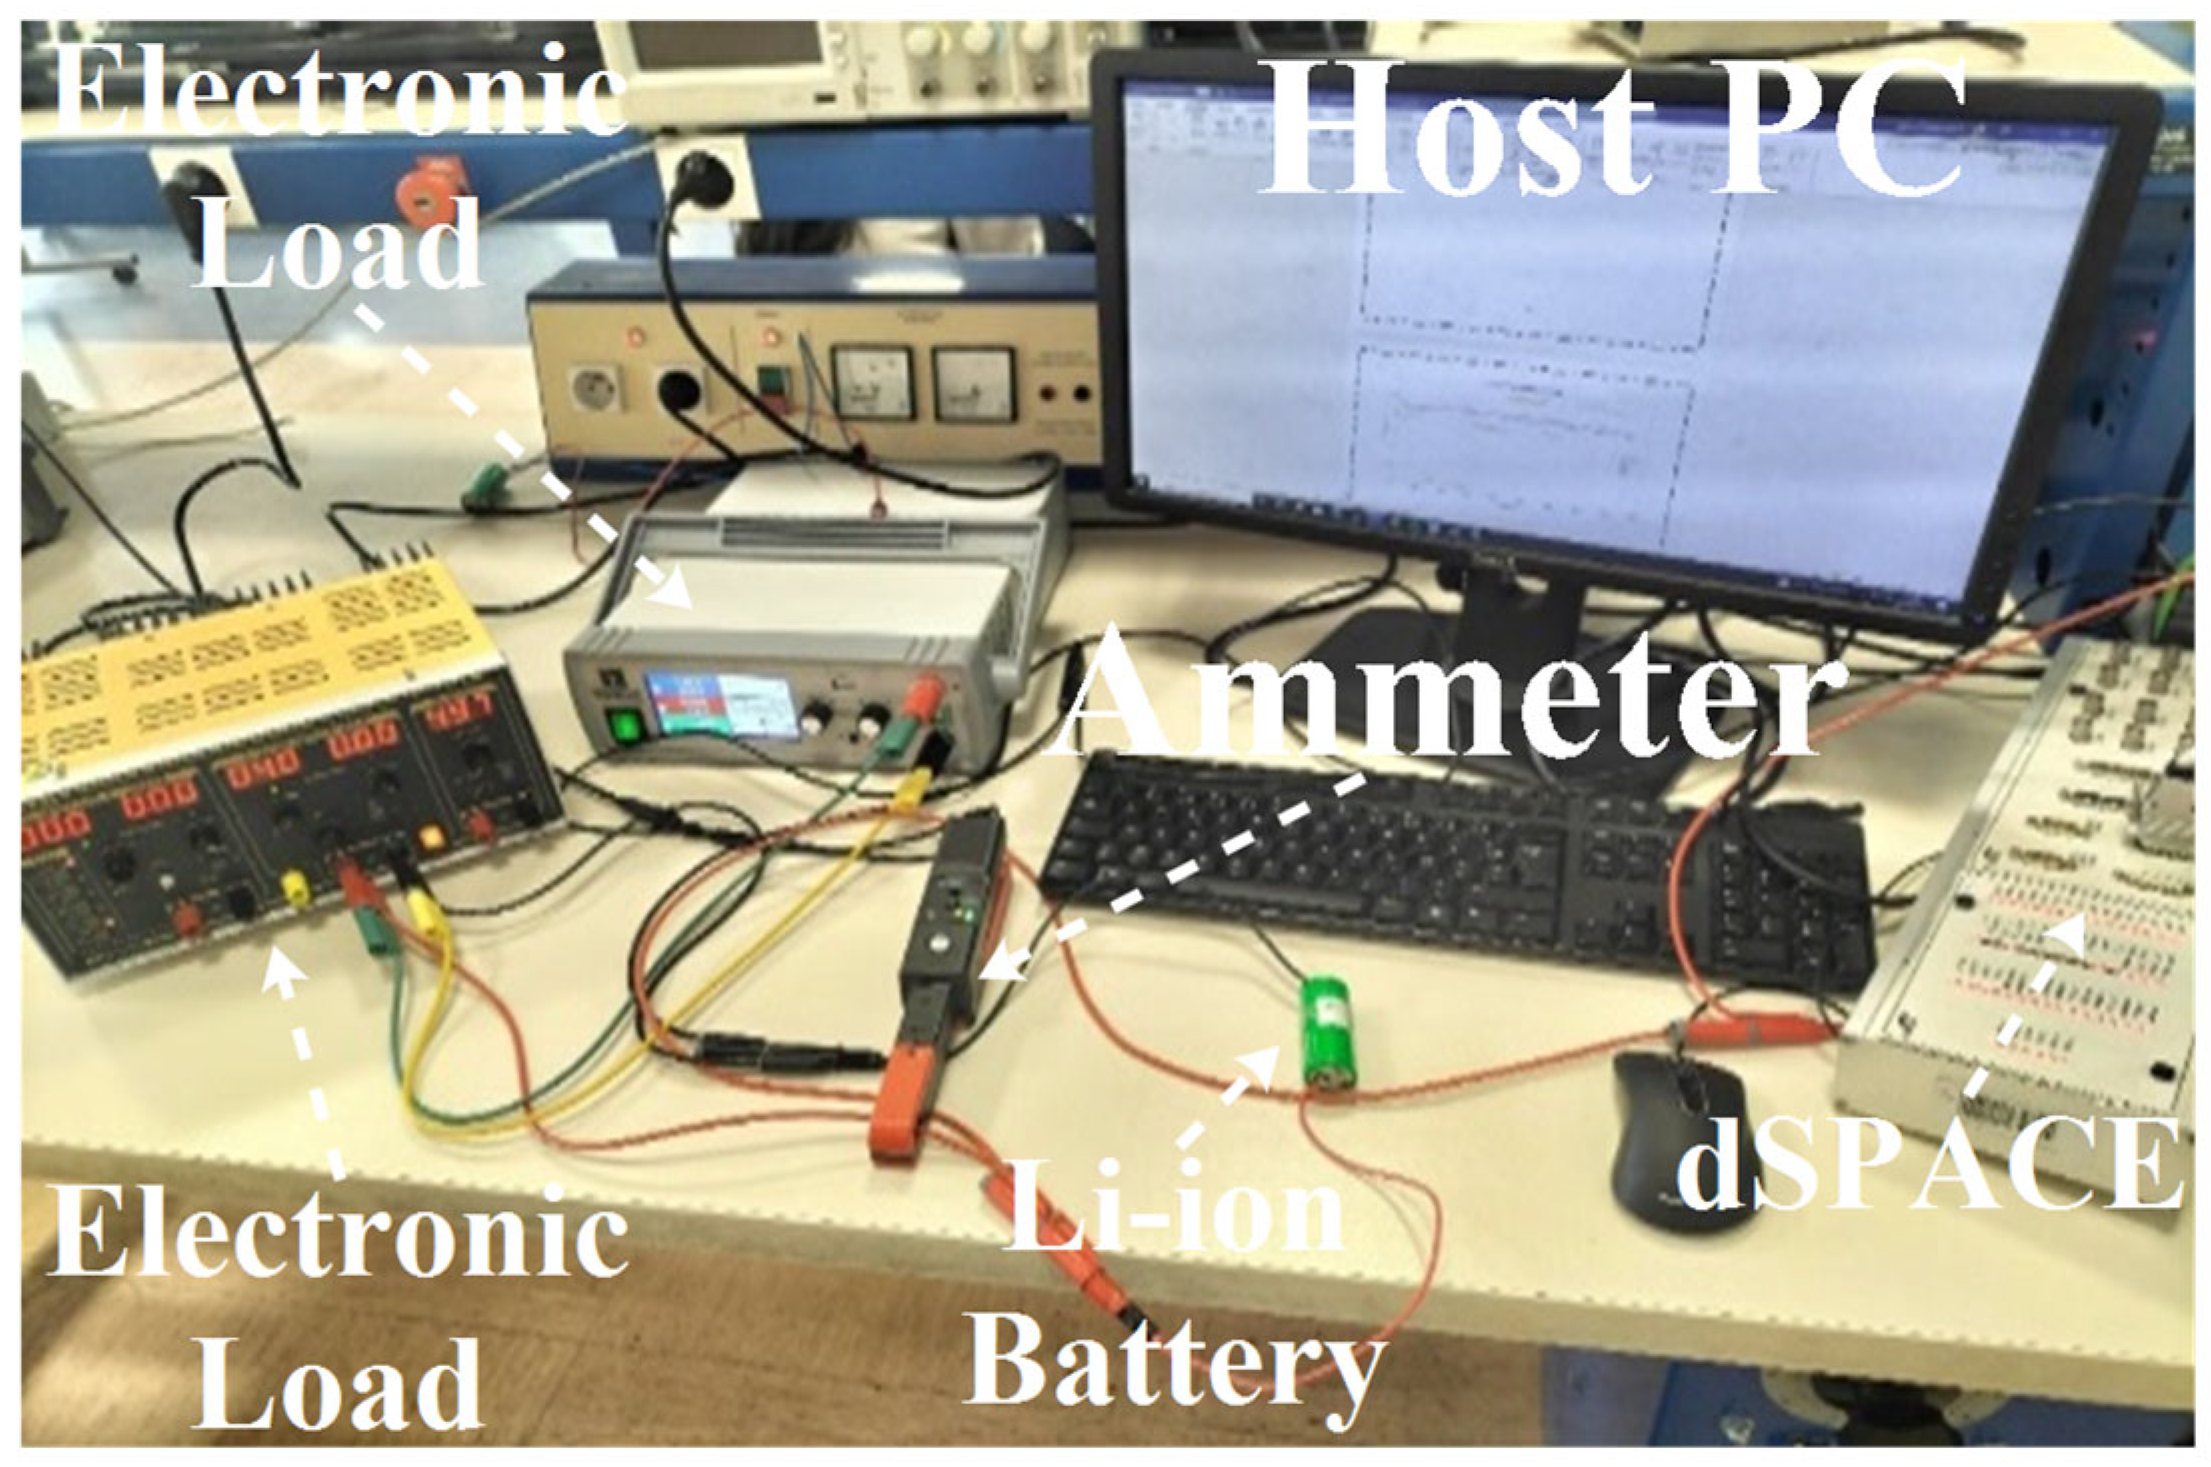
Figure 5 illustrates the complete experimental test bench established to implement the proposed battery characterization and monitoring framework. The setup includes a host PC for control and data acquisition, an electronic load for emulating discharge conditions, a high-precision ammeter for current monitoring, a Li–ion battery under test, and a dSPACE system for real-time hardware-in-the-loop interfacing. This configuration was used to execute discontinuous discharge protocols and rest intervals as part of the preconditioning phase.
Battery current data were acquired using synchronized current sensors, sampled at 1 Hz via a 16-bit analog-to-digital converter. To minimize noise interference and preserve signal integrity, a second-order low-pass Butterworth filter with a 0.3 Hz cutoff frequency was applied. All sensing channels were time-synchronized to ensure accurate multi-stage correlation during the test cycles. The resulting current profile—monitored and visualized in real-time—was crucial for validating cycle consistency, detecting anomalies, and assessing system reliability across repeated discharge tests.
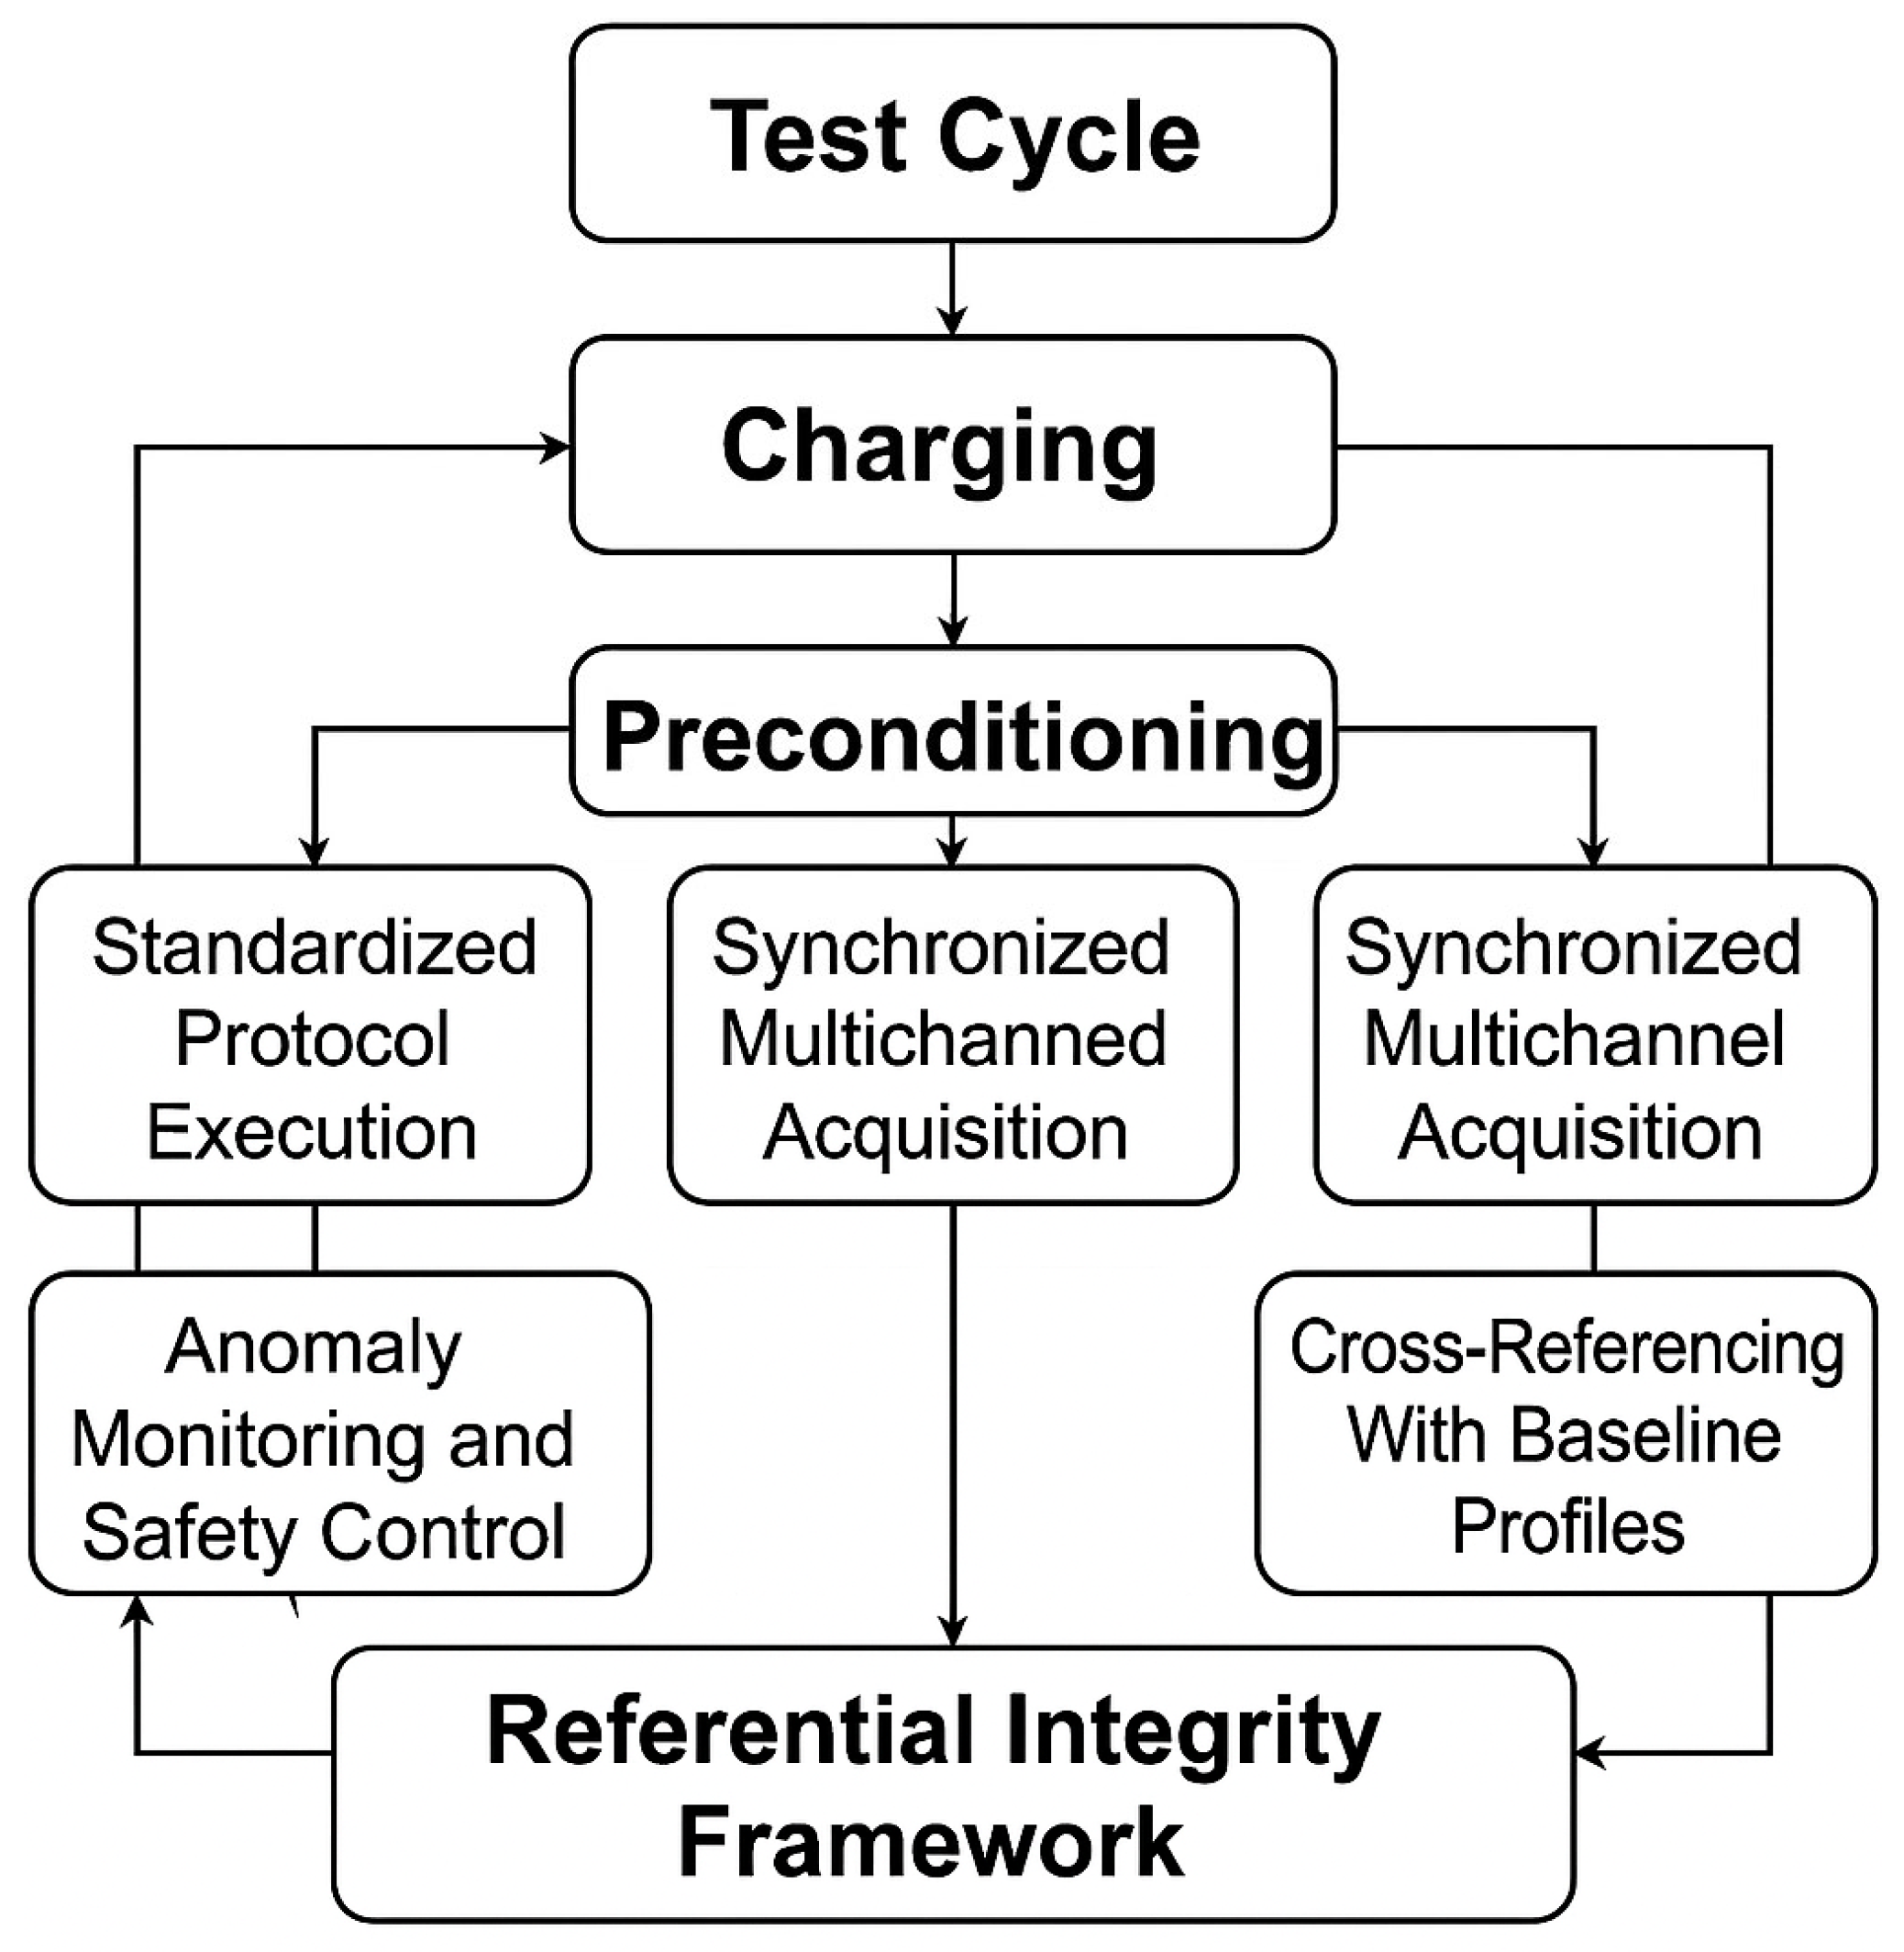
This experimental platform allowed for continuous feedback, anomaly detection, and referential data tracking in accordance with the Referential Integrity Framework introduced earlier.
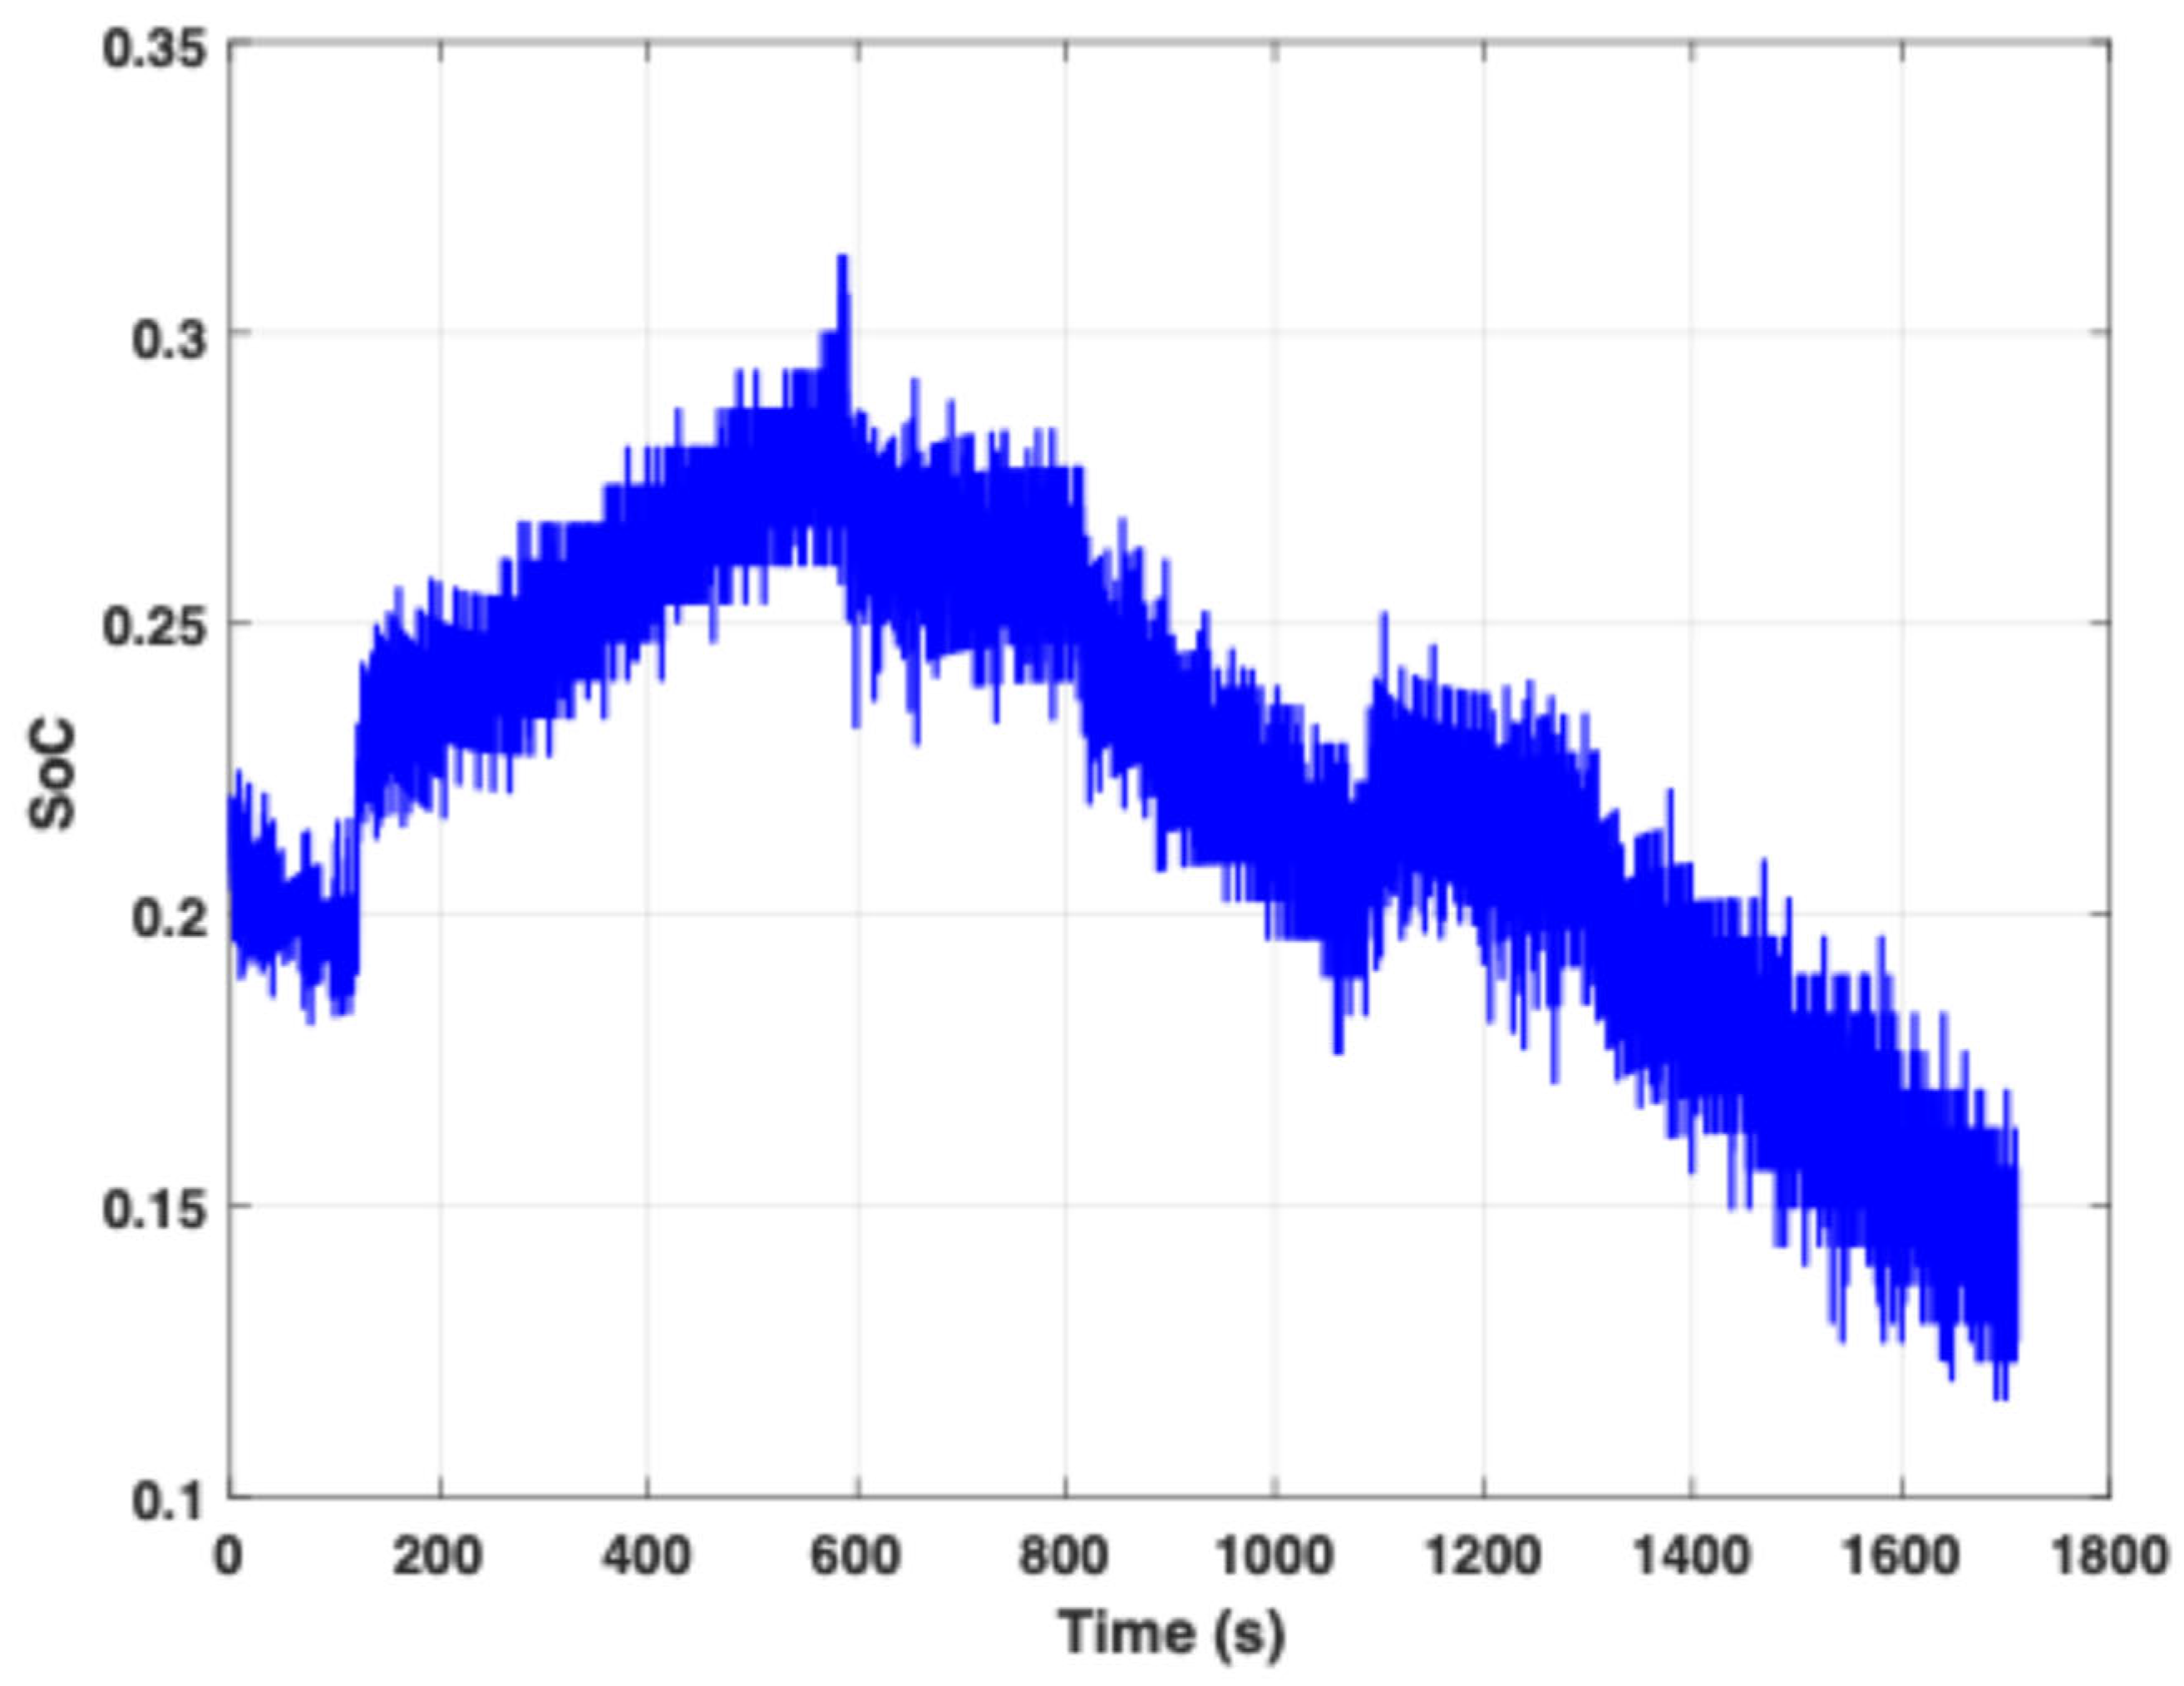
Figure 6 illustrates the battery current during the experimental process. Initially, between 0 and 187 s, the battery remains in a rest state with no current flow. At 187 s, a charging current of approximately −1.8 A is applied, which is maintained until 600 s. After this phase, a series of charging and discharging steps is introduced, creating a staircase-like profile that allows for precise SoC and OCV evaluation under varying current loads.
In
Figure 7, the SoC remains stable at around 20% during the initial rest phase. When the charging current is applied, the SoC increases to approximately 29% by 600 s. Following this, the profile reflects both charging and discharging stages, resulting in a gradual decrease in SoC. These dynamic shifts in SoC closely align with the current transitions shown in
Figure 6.
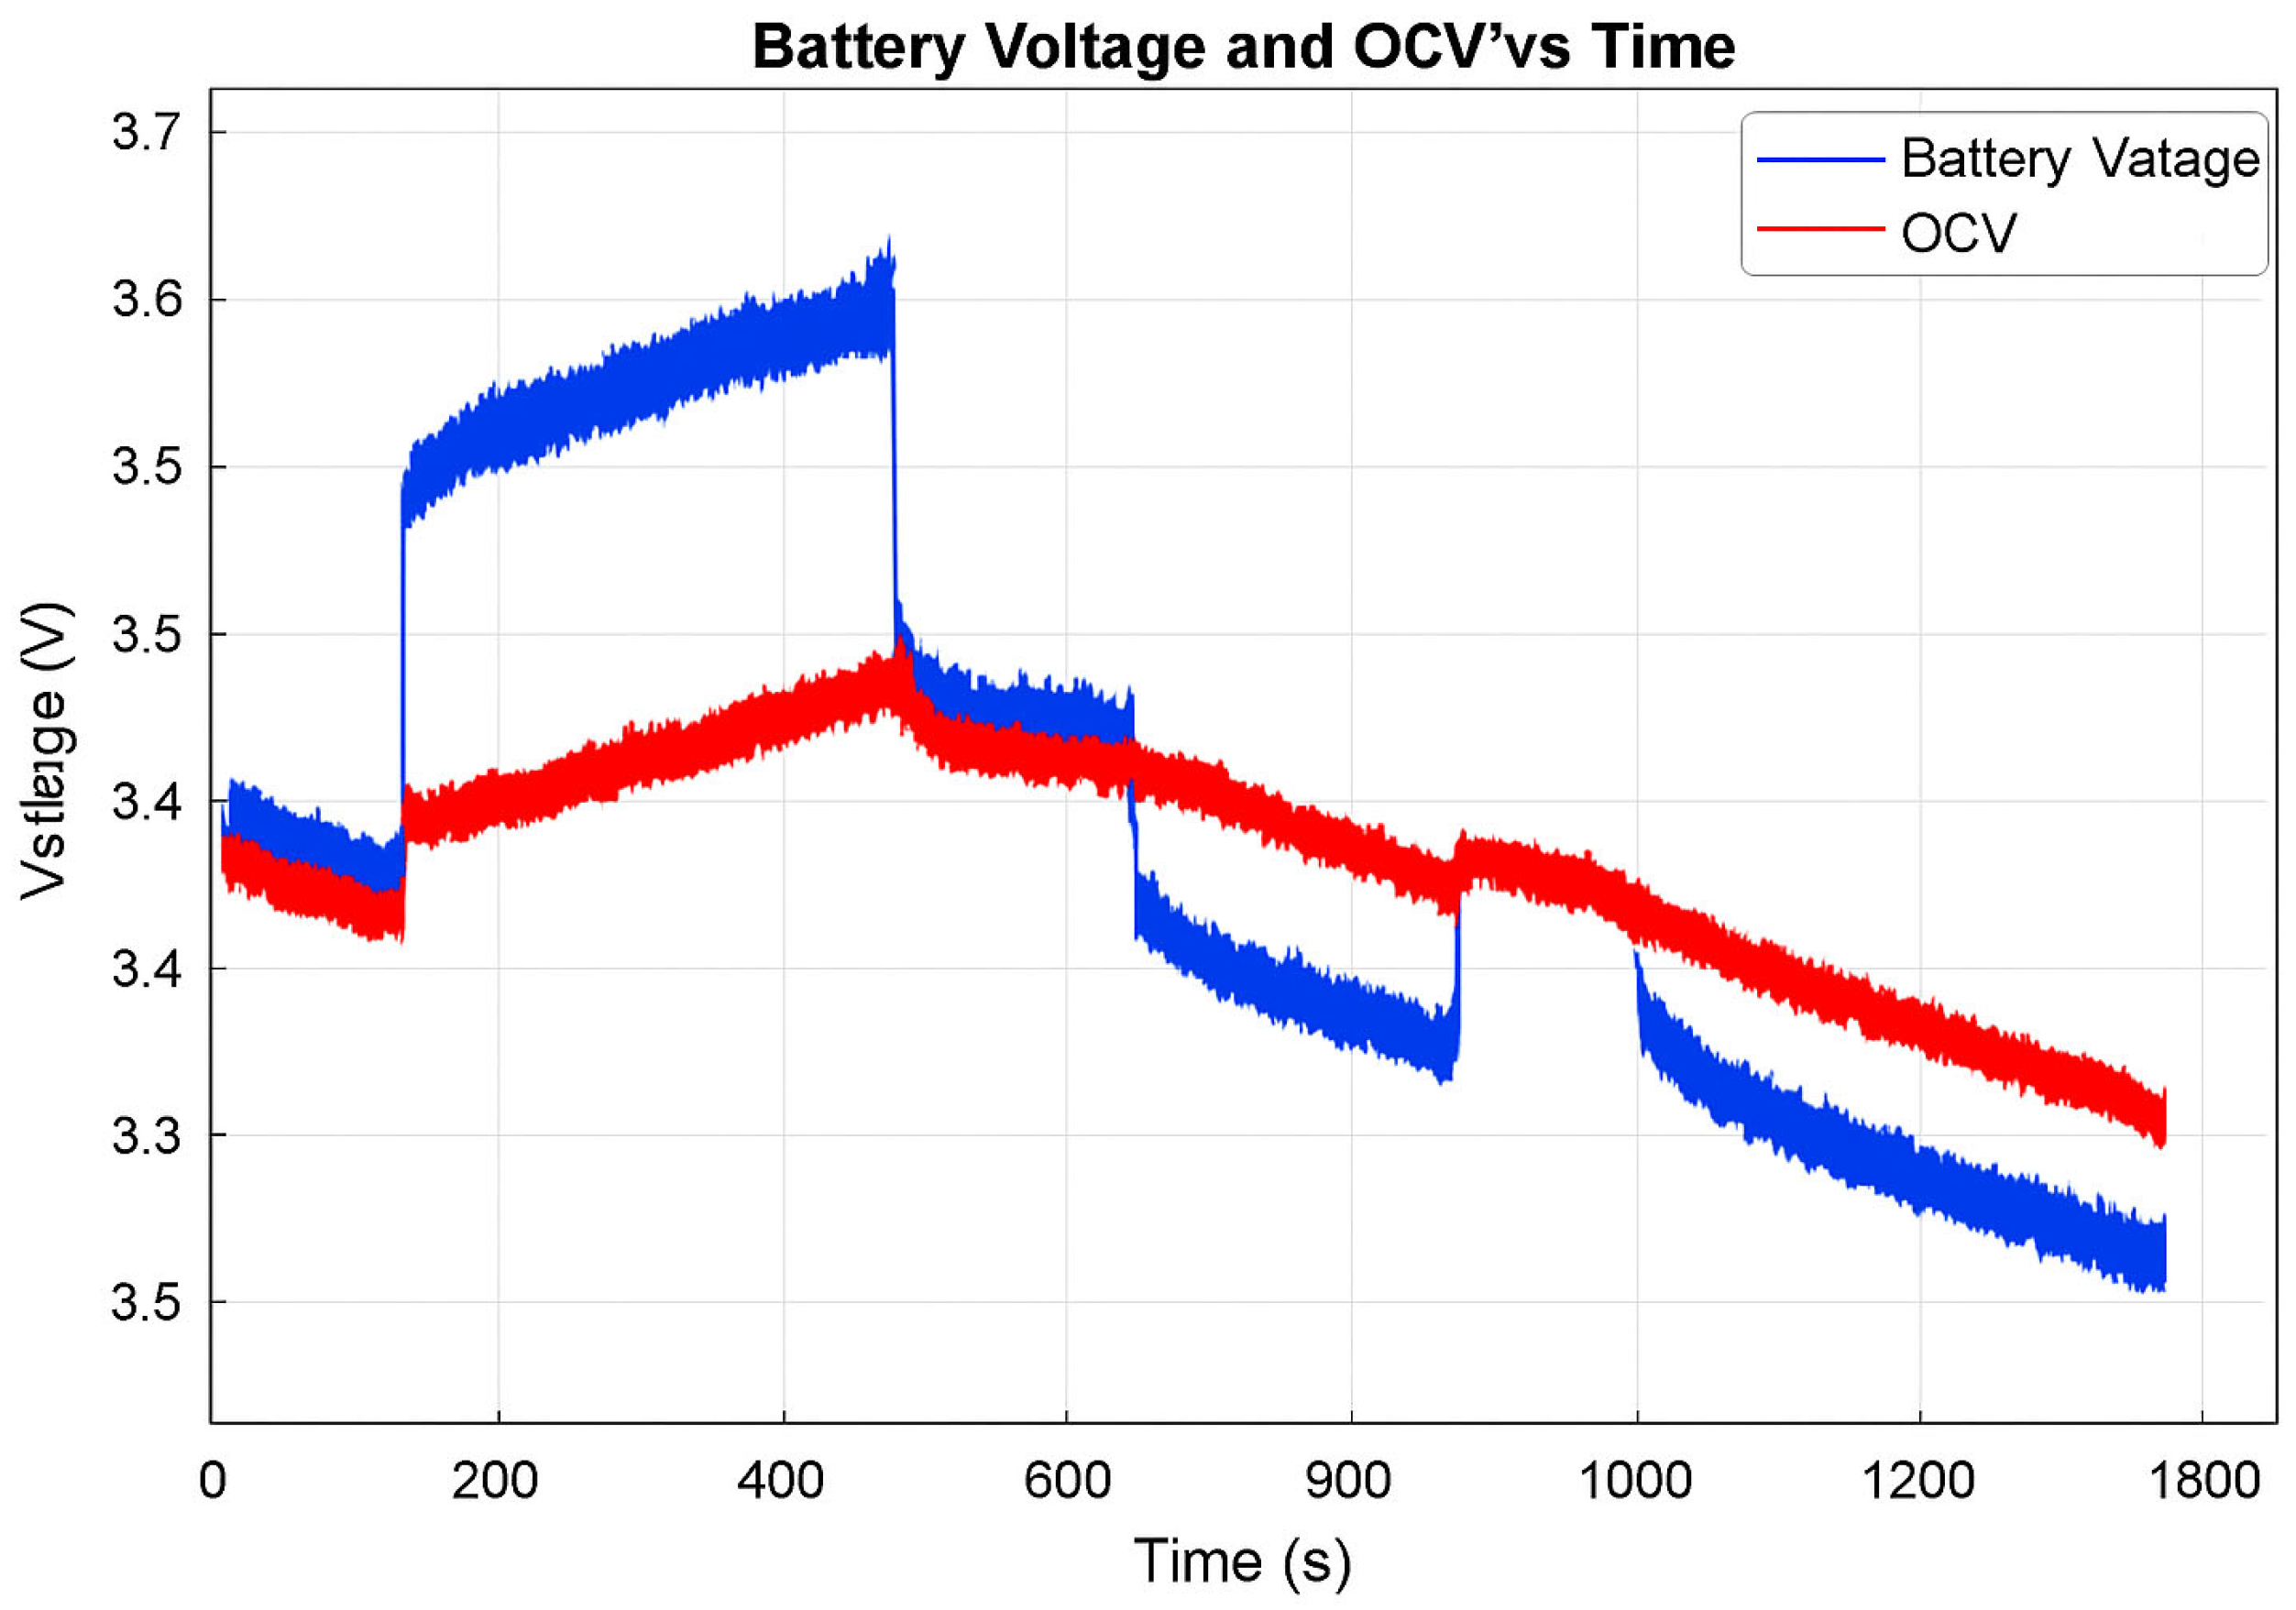
Figure 8 presents the measured battery voltage and the corresponding open-circuit voltage (OCV). During rest, both voltages stabilize around 3.46 V. As charging begins, the battery voltage increases more sharply than the OCV, peaking at 3.65 V and 3.53 V, respectively, around 600 s. The plot clearly highlights the voltage response lag due to internal resistance and electrochemical dynamics.
A second idle period occurs between 600 and 800 s, where the current again drops to 0 A. The SoC slightly decreases to 25%, and both the terminal voltage and Voc stabilize around 3.5 V. Between 800 and 1100 s, the battery undergoes a discharge phase under a load of 0.8 A, causing the SoC to fall from 25% back to 20%. The terminal voltage decreases to 3.42 V, and the Voc holds at 3.46 V. During this period, hybrid operation is initiated: a total load of 1.8 A is applied, but the DC source supplies only 1 A, requiring the battery to provide the remaining 0.8 A. This leads to further SoC depletion from 22% to 13%, confirming the battery’s active role in load sharing. Another short resting interval follows between 1100 and 1200 s, during which the SoC recovers slightly to 22%, and the voltages stabilize at 3.49 V (Vbat) and 3.46 V (Voc). In the final phase, from 1200 to 1700 s, hybrid mode resumes with the same 1.8 A load. The battery again compensates for the current shortfall, reducing the SoC to 13%, the battery voltage to 3.37 V, and the Voc to 3.44 V. Throughout the experiment, Voc serves as a reference voltage. During hybrid operation, the battery acts as a current source in parallel with the load, as evidenced by the drop in voltage (from 3.49 V to 3.37 V) and corresponding SoC decrease. Coulomb counting-based method for SoC estimation: This approach uses current as an input and calculates SoC by integrating current over time. A key limitation of this method is that it requires a known initial SoC, which may be estimated using methods such as Electrochemical Impedance Spectroscopy (EIS) or Extended Kalman Filter (EKF). In our lab experiments, the initial SoC is known, and the final SoC values obtained from the Coulomb counter are stored and used as the starting point for subsequent tests. The Coulomb counter is defined by Equation (1).
Among various SoC estimation techniques, Coulomb Counting remains one of the most widely implemented due to its simplicity and suitability for real-time embedded applications. Unlike more complex approaches such as Kalman Filtering, Model-Based Estimation, or Machine Learning-driven methods, Coulomb Counting does not require intensive computation or a detailed electrochemical model of the battery. This makes it particularly advantageous in resource-constrained systems where real-time performance is prioritized.
However, this simplicity comes with limitations. Coulomb Counting is sensitive to cumulative sensor drift, current measurement errors, and inaccurate initial SoC settings. Despite these drawbacks, it remains a practical choice when used in tightly controlled environments with periodic recalibration, as in the present study. Its straightforward implementation enables consistent and interpretable measurements, supporting the study’s focus on validating a referential integrity framework for battery testing.
The Coulomb Counting method is a widely adopted technique for estimating the SoC by integrating the measured charge and discharge currents over time. Although it offers a straightforward implementation, especially in embedded systems, the accuracy of this method can degrade over prolonged use due to accumulated errors from sensor drift, current integration noise, or initial SoC estimation inaccuracies. These limitations necessitate regular recalibration or hybrid estimation methods, particularly in applications requiring high reliability, such as electric vehicles or aerospace systems. In this study, Coulomb Counting is applied under tightly controlled laboratory conditions, minimizing environmental and sensor-related deviations to ensure high-quality data acquisition.
In this study, all experiments were conducted in a climate-controlled laboratory environment, where ambient temperature was maintained at 25 ± 1 °C and humidity levels were kept below 45%. The battery under test was isolated from external airflow and radiant heat sources, and all current and voltage measurements were captured using calibrated high-precision equipment (Keysight 34461A multimeter and BK Precision 8500B DC load). To minimize electromagnetic interference and ensure stable signal acquisition, shielded cabling and a dedicated measurement chamber were used. These controlled conditions ensured consistent data acquisition, minimized thermal drift, and improved the reproducibility of results.
where C
N is the rated capacity,
ibatt the battery current, and SOC
0 is the initial SOC.
Despite its simplicity, this method has several drawbacks, including the sensitivity to the initial SOC value that could be inaccurately estimated and the accumulated error due to the use of integration. The estimation accuracy is influenced by the temperature and other internal battery effects, such as self-discharge, capacity loss, and discharging efficiency. However, this method is largely used even by car manufacturers.
5. Simulated vs. Experimental Results: Methodology and Analysis
In this section, a detailed comparison is made between the simulated and experimental results for Experiment 2, conducted with a 1.8 A current.
Figure 16 shows the equivalent circuit model of the battery that is used.
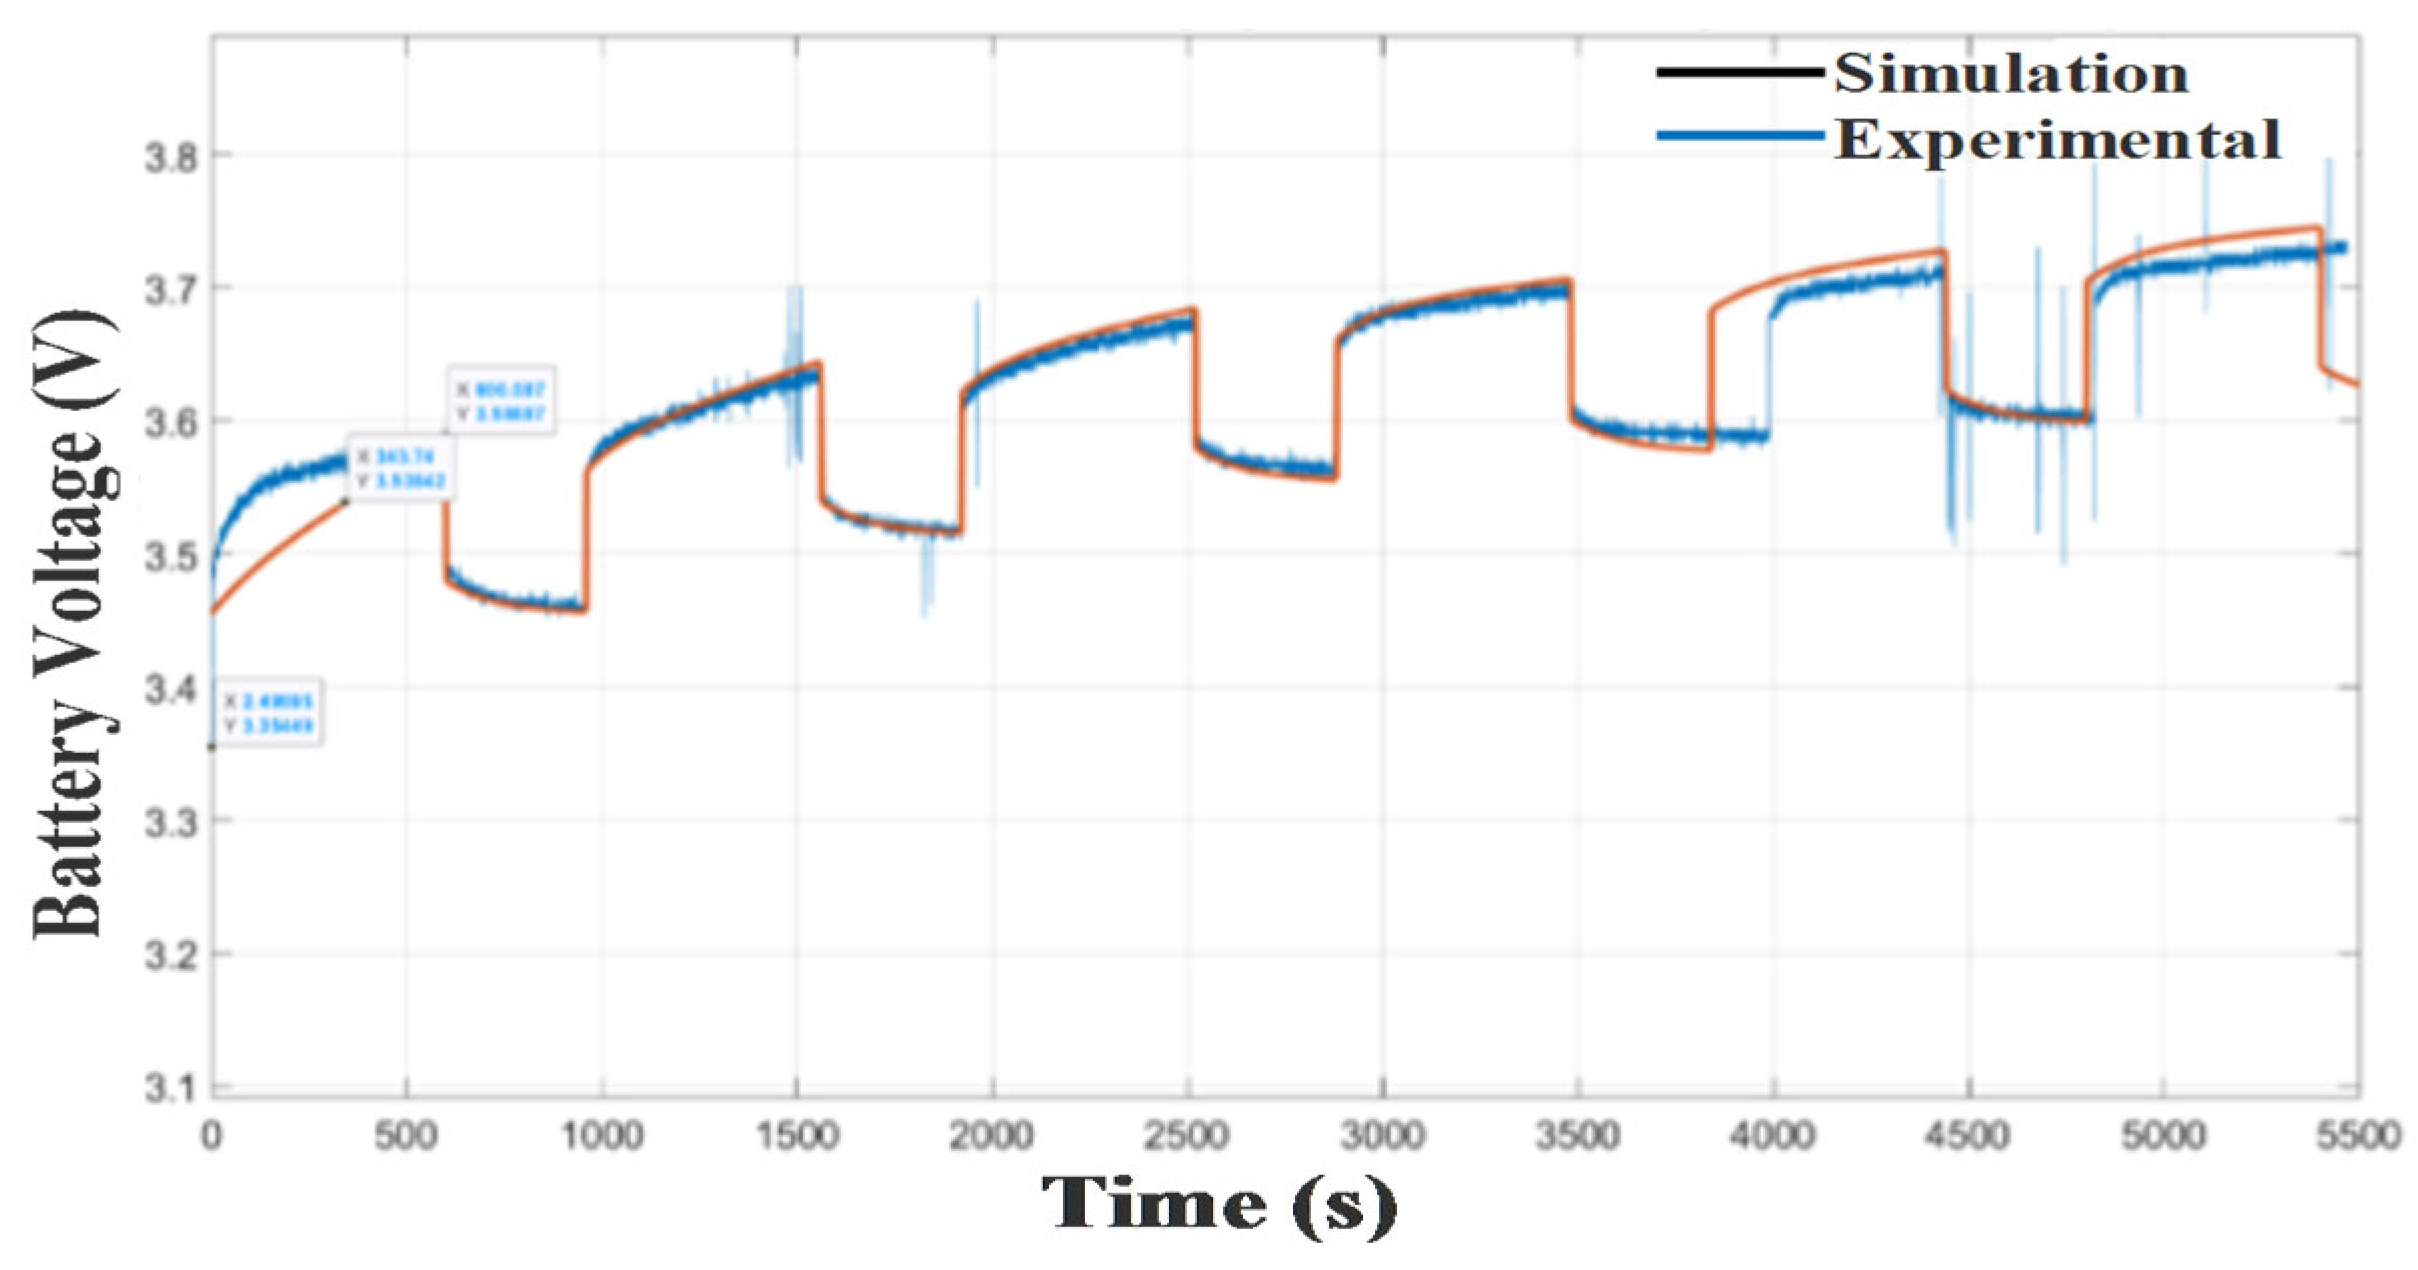
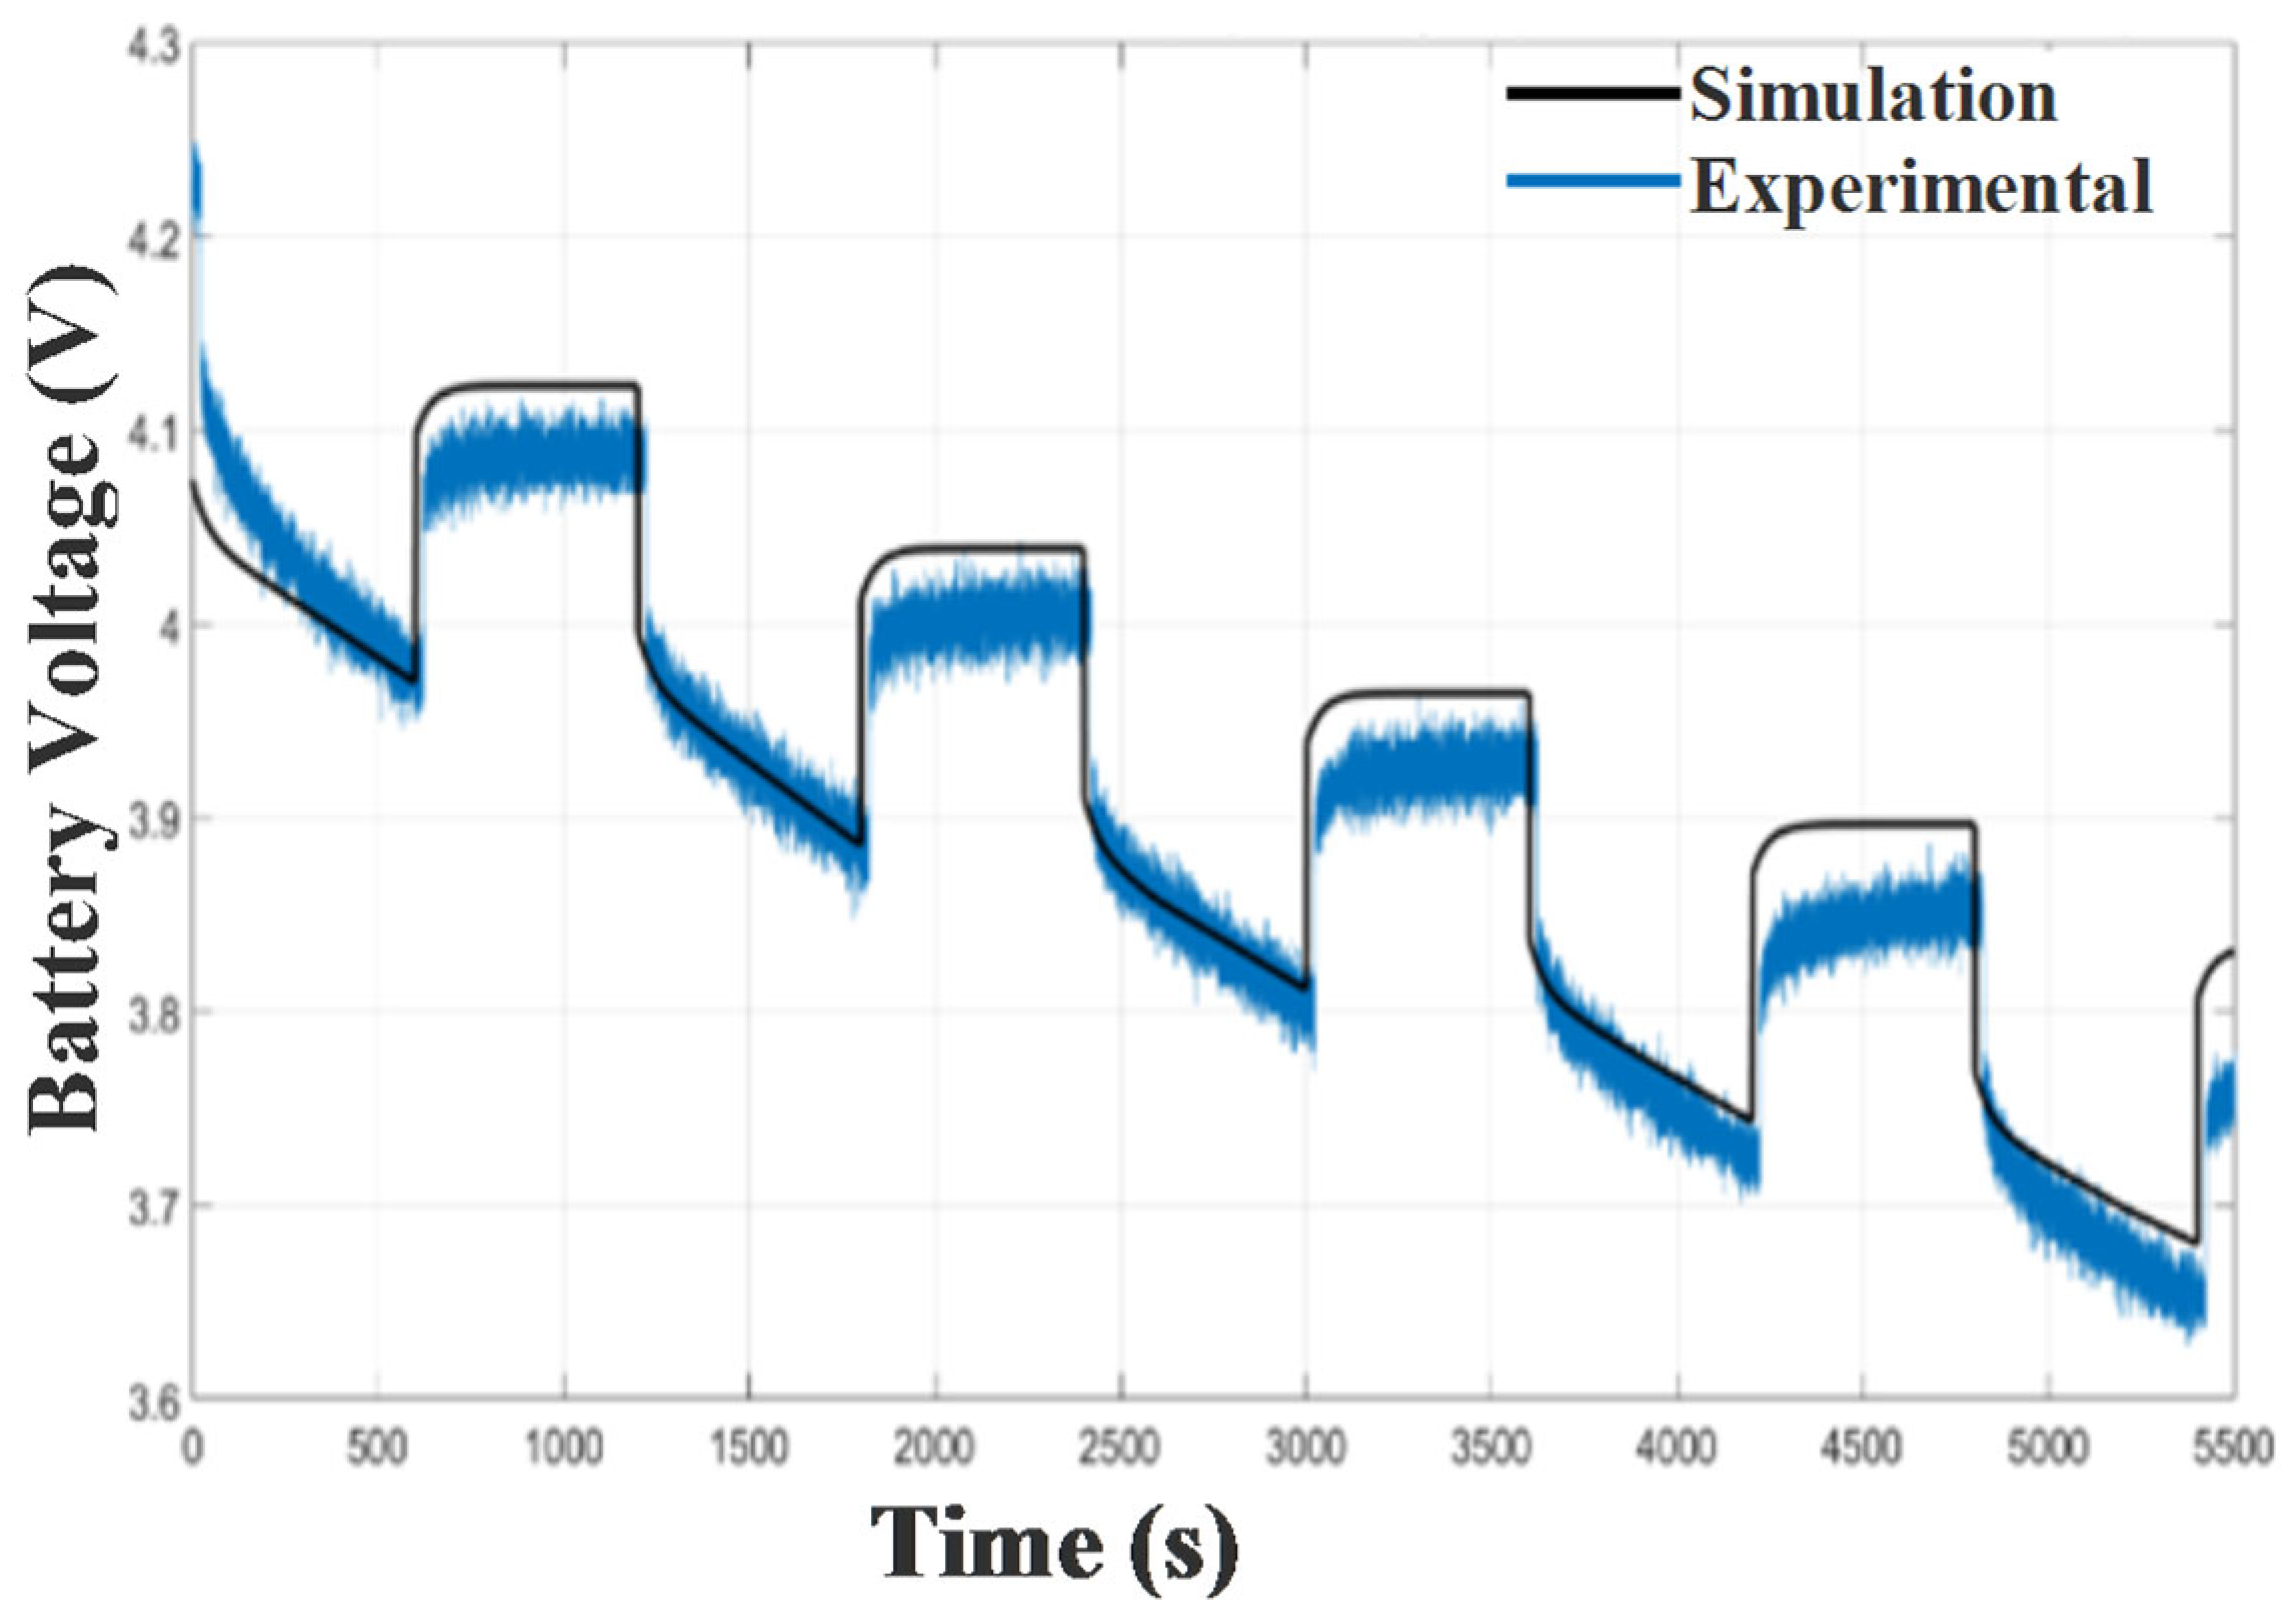
Figure 17 and
Figure 18 illustrate the agreement between the simulated and experimental data during the charging and discharging phases, respectively. The small fluctuations observed in the experimental curves are attributed to the battery’s nonlinear behavior and the sampling rate limitations of the data acquisition system.
Moreover, the proposed hybrid estimation framework (the referential integrity paradigm) has been quantitatively benchmarked against several state-of-the-art techniques, including (i) Adaptive Extended Kalman Filter (AEKF); (ii) Deep Neural Network (DNN)-based SoC estimator; and (iii) Physics-Informed Machine Learning (PIML) model. The comparative evaluation is conducted using the same dataset (Li-Mn 26650 cells under dynamic stress test profiles) and identical test conditions (1C–2C rates, 25 °C ambient, SoC range: 0–100%).
Table 2 showcases the achieved progress, such as a 42.4% reduction in RMSE compared with AEKF and a 36.2% improvement in MAE compared with DNN. These results demonstrate that the suggested referential integrity paradigm not only integrates the strengths of data-driven and model-based estimators but also introduces dynamic cross-verification and trust weighting mechanisms that yield statistically significant improvements across all major SoC estimation metrics. The
Table 2 presents a comparison with different models.
The simulation model for the battery uses the equivalent electrical model shown in
Figure 16. Thevenin’s circuit is employed to analyze the transient behavior of the lithium battery. This electrical model comprises a series resistor (R
series) and a parallel RC circuit (R
transient and C
transient) used to predict the battery’s response to transient load events at a particular SoC, assuming a constant open-circuit voltage, Voc(SoC). The batteries are subjected to self-discharge under open-circuit conditions.
The different parameters were determined using the curve-fitting method in MATLAB to ensure alignment between the simulation and the experimental data.
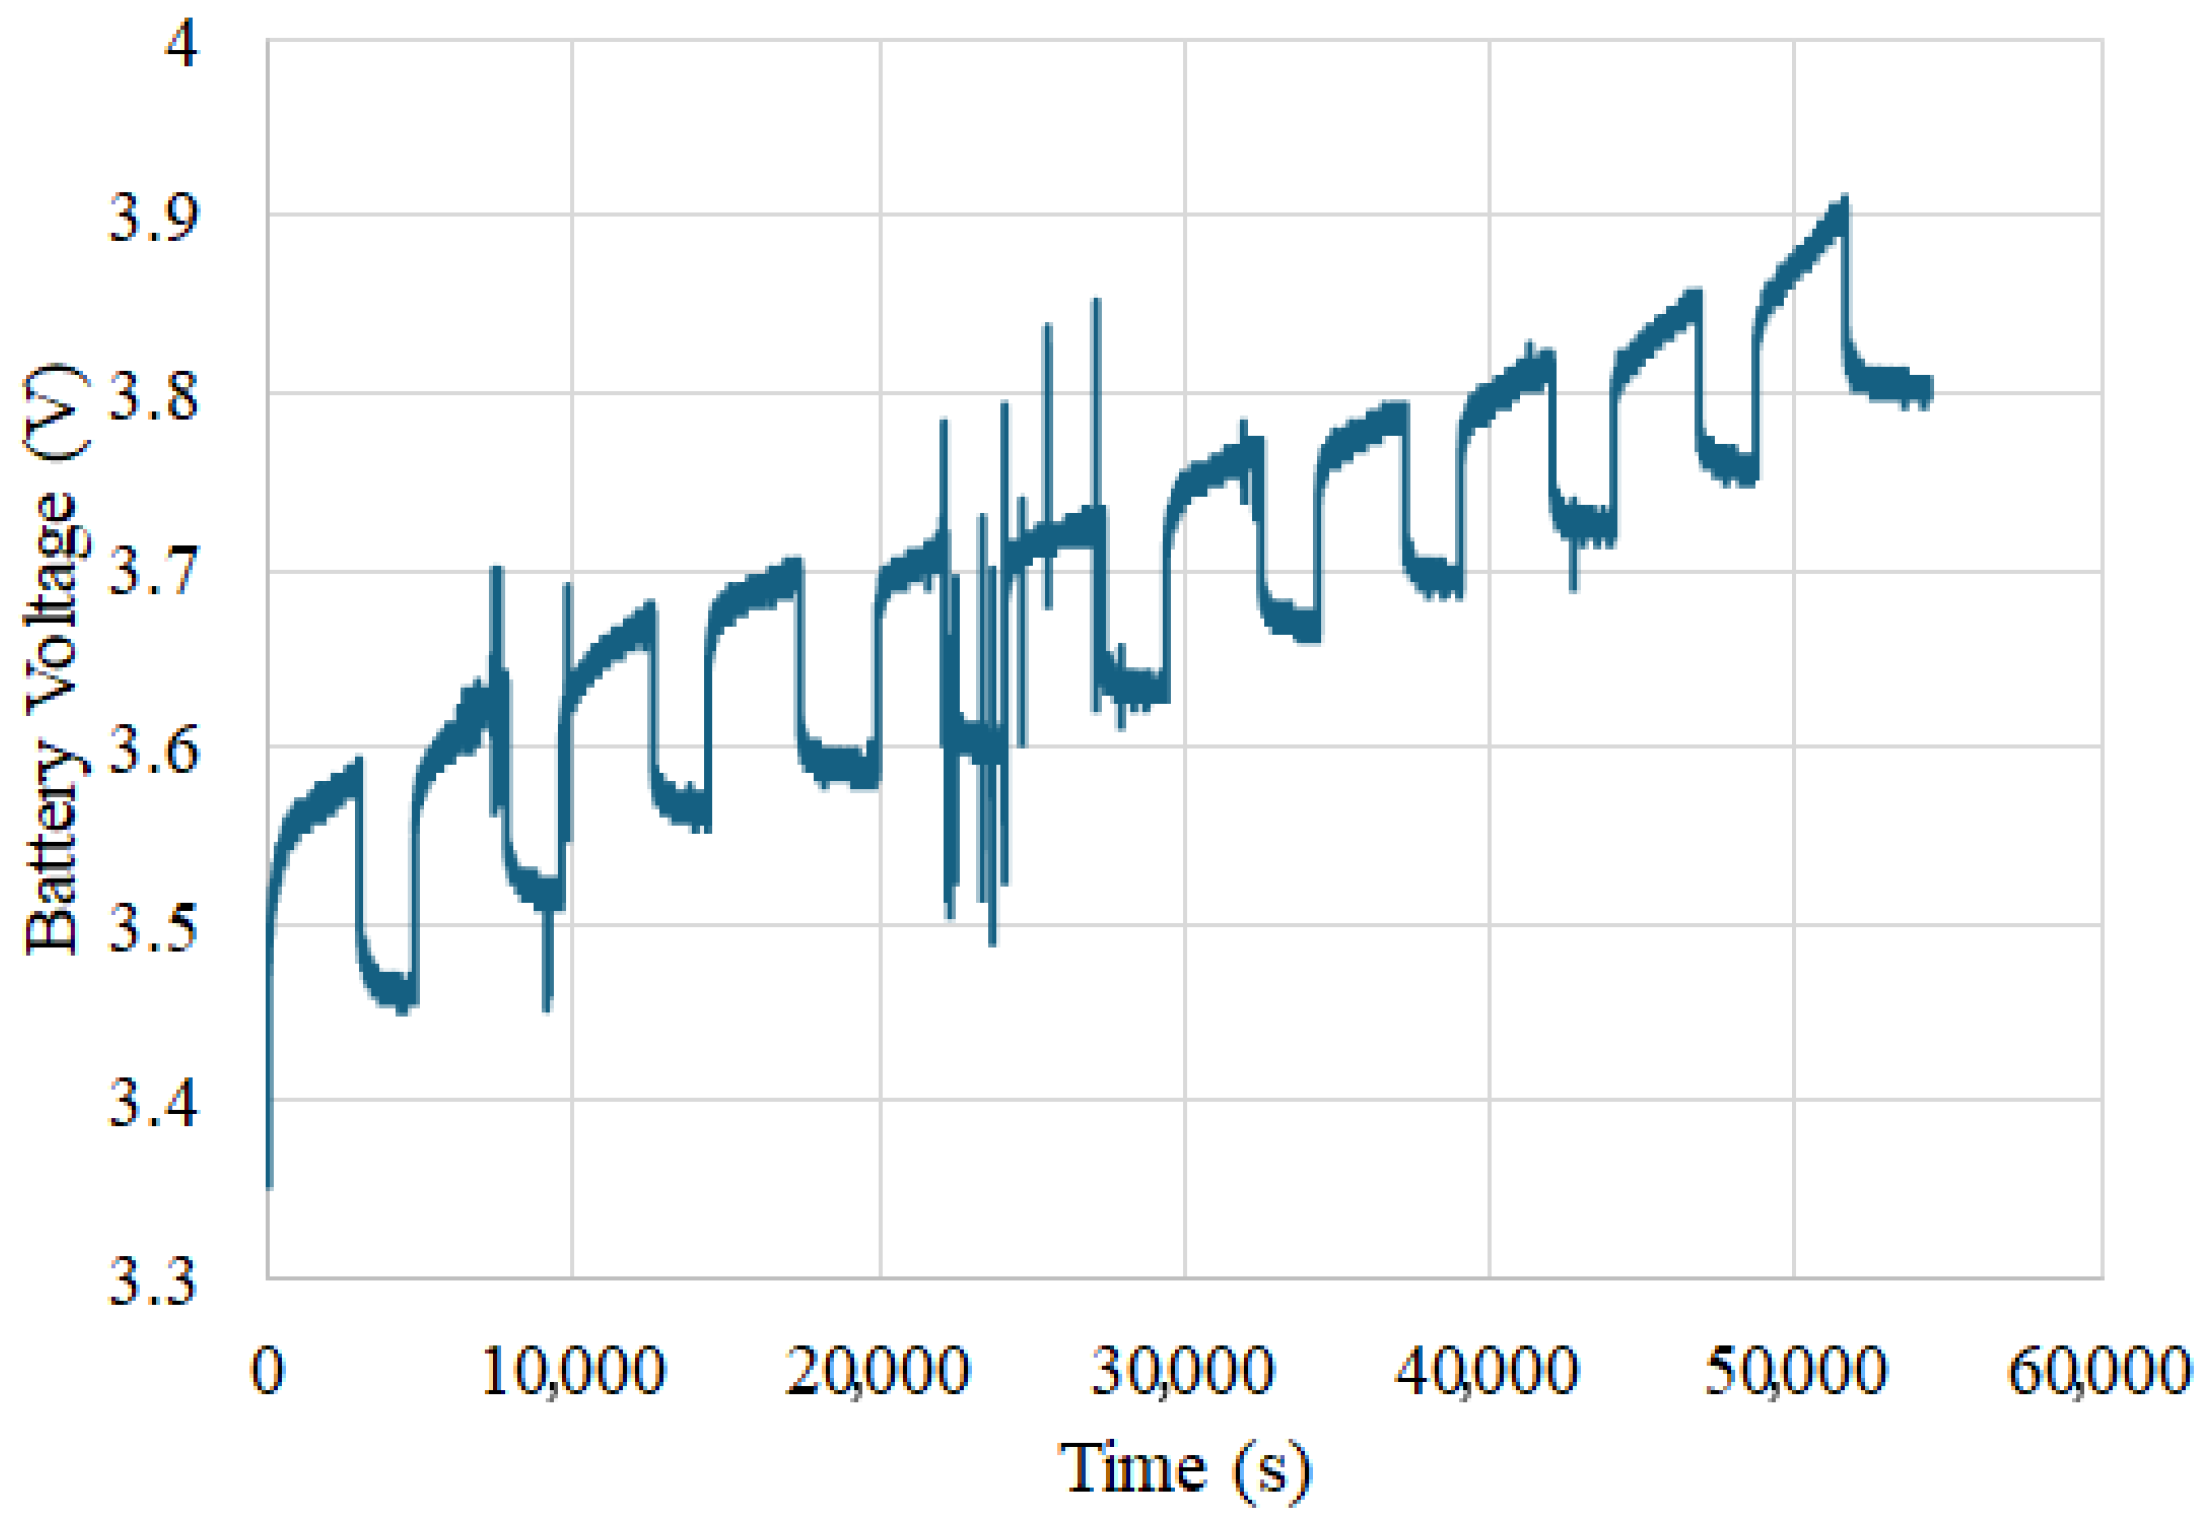
Figure 17 illustrates the simulated and experimental battery voltage profiles during successive charging intervals, highlighting the system’s ability to capture the staircase-like voltage increase and resting periods with good accuracy. Minor discrepancies observed are likely associated with transient response delays and real-world measurement noise.
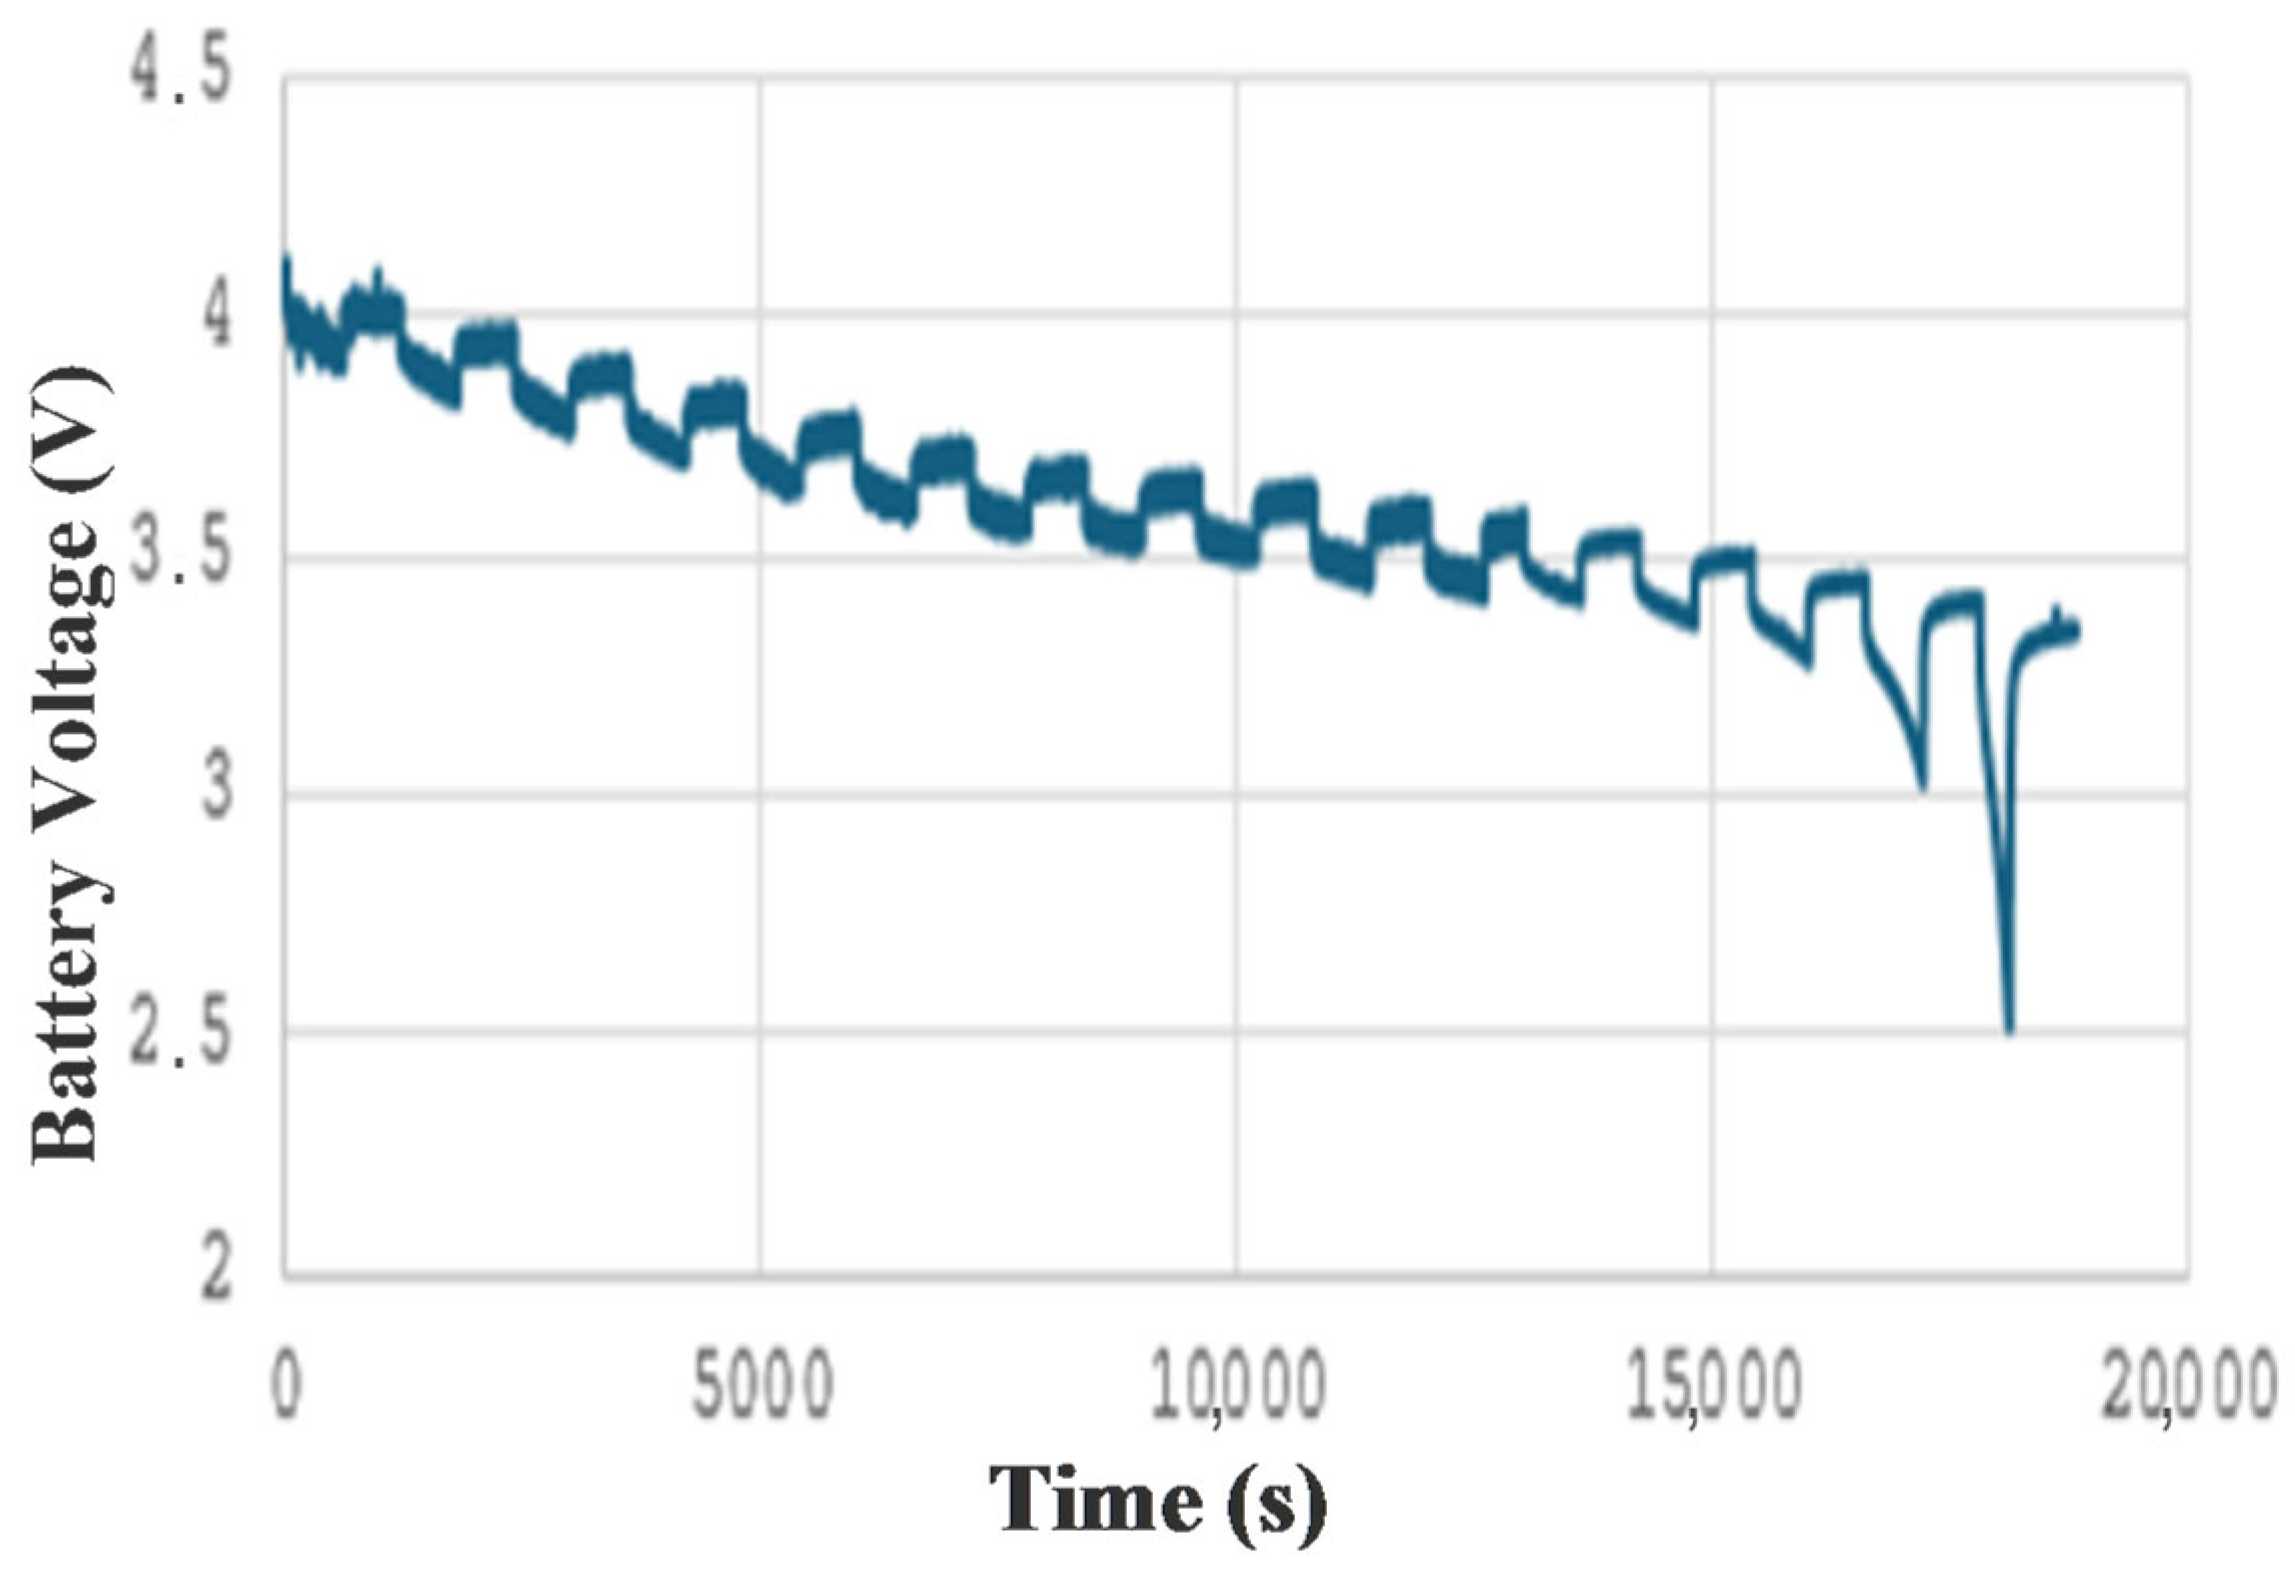
Figure 18 presents the voltage behavior under discharge cycles, where the gradual voltage decline and recovery periods are well-reproduced by the simulation. The consistency between curves supports the model’s effectiveness in representing dynamic discharging characteristics.
6. Novelty of This Work
The well-known Coulomb counter SoC estimator faces the drawback of difficulties in estimating the initial SoC(0). This estimation can be established in laboratory tests by completely discharging or fully recharging the battery or by using certain EIS methods, which can be time-consuming at low frequencies.
The common solution is to fully recharge the battery once, then use the last estimated SoC as the next initial SoC. This memory-based approach is widely used, but it may be prone to deviation if the battery (or vehicle) remains parked for an extended period, due to self-discharge mechanisms that are not captured by the Coulomb counter estimator.
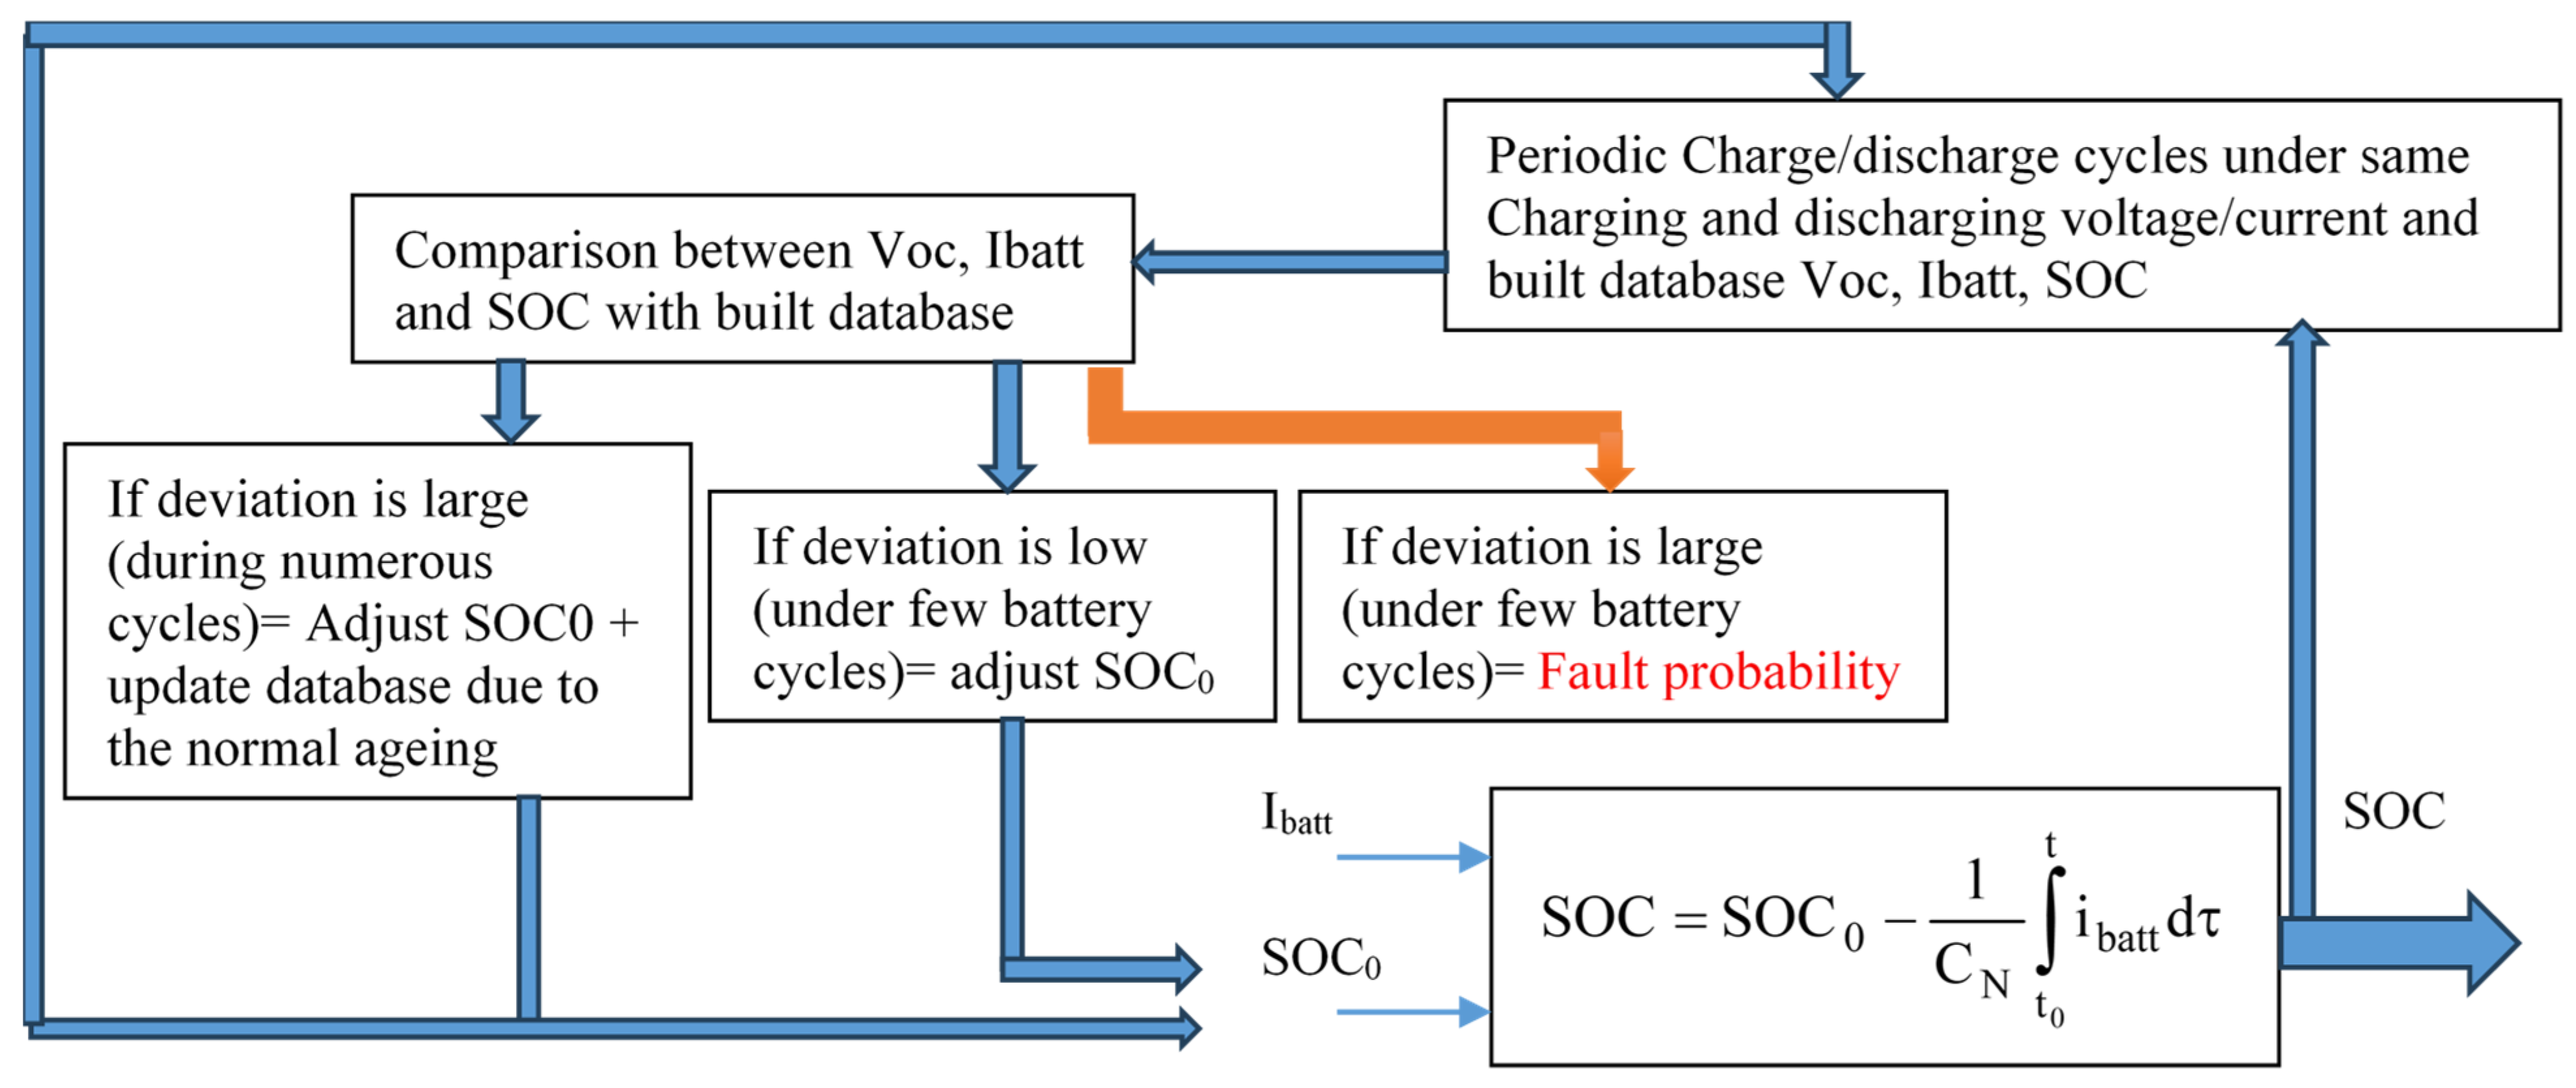
By periodically performing charge and discharge cycles such as those presented in this article, a database can be built linking Voc, battery current (Ibatt), and SoC estimation such that:
The diagram in
Figure 19 illustrates the proposed method, which involves the following steps:
Estimate the SoC using a Coulomb counter with a known initial value, SOC(0), established by fully charging or discharging the battery.
Periodically perform charge/discharge cycles under consistent voltage or current conditions to create a reference database (or lookup table) linking Voc, Ibatt, and SoC. This also helps align the existing mathematical model with new measurements.
Compare newly collected data with the existing entries in the database.
If the deviation is small over a few cycles, it likely results from self-discharge, and the SOC(0) should be updated.
If the deviation is large after only a few cycles, it may indicate battery degradation. In such cases, the battery should be checked for safety and health before further use.
If the deviation is significant over several cycles, it likely reflects normal aging, requiring updates to the SOC(0) and the database.
Thresholds for terms such as “low/large deviation” or “few/several cycles” should be defined by experts, as they depend on the specific battery type and cannot be generalized numerically.
The integration of AI-based approaches, including black-box methods such as fuzzy logic or neural networks, may enhance database creation and comparison processes. The potential of these techniques will be further explored in future studies.
Moreover, incorporating temperature measurements into the dataset can enable the model to account for extreme environmental conditions, improving its generalizability.
7. Conclusions
In this study, we present a practical and validated approach for estimating the SoC in rechargeable lithium–ion batteries. By combining simulation-based analysis with real-world experiments, the proposed method aims to improve SoC estimation under dynamic operating conditions, accounting for real-time current variations and initial charge states.
To assess the model’s accuracy, three experimental scenarios were conducted using constant current levels of 1.3 A, 1.5 A, and 1.8 A—values commonly seen in electric vehicles, renewable energy systems, and portable electronics. Each test started from a predefined SoC and tracked battery behavior throughout the charging and discharging process. Experimental results were then compared with simulation outputs based on an equivalent circuit model.
The findings show a clear link between initial SoC, current intensity, and the total duration of charge/discharge cycles. While higher current speeds up the process, it also introduces nonlinearities such as voltage recovery and internal resistance changes, which can complicate estimation. Ignoring these factors can lead to notable errors and undermine system reliability.
Overall, this work highlights the value of incorporating both initial conditions and current dynamics into SoC estimation algorithms to improve battery performance and support more dependable energy management in real-world applications.
