Article

Experimental and Numerical Study of the Impact of Pressure During the Pyrolysis of Diethyl Carbonate and Ethyl Methyl Carbonate

by
Claire M. Grégoire
,
Eric L. Petersen
and
Olivier Mathieu
*
J. Mike Walker ’66 Department of Mechanical Engineering, Texas A&M University, College Station, TX 77843, USA
*
Author to whom correspondence should be addressed.
Batteries 2025, 11(8), 303; https://doi.org/10.3390/batteries11080303
Submission received: 1 May 2025 / Revised: 8 July 2025 / Accepted: 6 August 2025 / Published: 8 August 2025
(This article belongs to the Special Issue Battery Thermal Performance and Management: Advances and Challenges)

Abstract

During a thermal runaway, Lithium-ion battery cells are subjected to a large increase in temperature, which will vaporize and potentially thermally degrade their liquid electrolyte. The formation of gas in the battery cell will increase the pressure until the flammable gases vent and potentially lead to a fire incident. While the pyrolysis chemistry of the electrolyte components has been studied near atmospheric pressure, the effect of pressure has not been investigated. This study was undertaken to better understand the effect of pressure on the thermal dissociation of two common linear electrolyte components, diethyl carbonate (DEC) and ethyl methyl carbonate (EMC). The pyrolysis of DEC and EMC was studied in the gas phase, in 99.75% He/Ar, and was carried out at high temperatures and for pressures near 5.5 atm. The time-resolved CO formation was measured using a quantum cascade laser, providing a unique experimental dataset. A detailed chemical kinetics analysis was performed to understand the effect of pressure on DEC and EMC, with CO time-history results obtained in similar conditions at near-atmospheric pressure for DEC and EMC serving as baselines for comparison. Numerical predictions using detailed chemical kinetics mechanisms from the literature were carried out, and reaction pathways at different pressures were highlighted to emphasize the effect of pressure on the pyrolysis chemistry.

1. Introduction

The electrification of vehicles has been largely increasing globally and is recognized as an incredibly popular, viable option in some countries [1]. This growth in electric vehicle sales was partly due to strong legislative pushes motivated by mitigating air pollution associated with internal combustion engines and also as a key aspect of sustainable transport, with transformative technical developments leading to an ease for its adoption and its high competitiveness in the automotive industry [2]. Additionally, smartphone technology development has led to a phenomenal increase in its use worldwide, triggering the need for efficient and durable Li-ion batteries (LIBs) that are free of significant safety hazards. These fire hazards are due to thermal runaways generally induced by an abuse of the LIB. During a thermal runaway event, the temperature increases rapidly, and the liquid electrolytes in the battery cell—which allow the movement of the Li-salt ions during charge and discharge cycles [3]—will vaporize and undergo thermal breakdown. In some cases, if sufficient pressure is generated in the cell, the flammable thermal runaway gases will vent to the surrounding environment [4] and ignite, leading to a fire that is difficult to control.
In essence, the fire hazard associated with LIBs is due to the flammability of the electrolyte [5] and its vent gases [6]. Linear carbonates such as diethyl carbonate (DEC) and ethyl methyl carbonate (EMC) are among the most common constituents of the liquid electrolytes in LIBs. Understanding the pyrolysis kinetics of these components at higher pressure to observe the effect on the type of flammable gases generated during a thermal runaway is of interest to developing strategies to minimize the risks of LIB thermal runaways and ultimately fire events that are difficult to extinguish [7,8]. The chemical structures of DEC and EMC are presented in Figure 1.
This paper is a continuation of a pyrolysis study of DEC and EMC [9] by the present authors, where CO time-history profiles were obtained behind reflected shock waves for temperatures ranging from 1300 to 1800 K, and at near 1.3 atm. The impact of pressure on DEC and EMC is investigated herein at similar conditions found in [9], with pressure increased by approximately a factor of four-to-five, from 1.3 atm to approximately 5.5 atm, to represent the higher-pressure conditions found in the battery cell during a thermal runaway event and before the venting of the gases. In previous work on DEC [10,11,12,13,14,15], only a couple of studies focused on varying the pressure to highlight its effects. Shahla et al. [11] observed the impact of pressure in oxidative conditions by measuring laminar flame speeds (LFS) of DEC in air at 393 K, from 1 atm up to 3 atm. It can be seen that the increase in pressure decreases the LFS for equivalence ratios between 0.7 and 1.3. Sun et al. [13] measured species mole fractions by gas chromatography (GC) using a flow reactor at three different pressures (0.04, 0.2, and 1.03 atm) at 700–1200 K, and under pyrolysis conditions. The formation of the intermediate species C2H4, C2H5OH, and final product CO2 accelerates when the pressure is augmented (i.e., 0.2 and 1.03 atm).
Previous work on EMC [14,15,16,17,18,19,20] shows that Yu et al. [16] carried out rapid compression machine (RCM) testing at 810–980 K, equivalence ratios (ϕ) of 0.5, 1.0, and 2.0, for two different pressures, namely 19.7 and 39.5 atm, where a drastic reduction in their measured IDTs was exhibited at 39.5 atm when compared to 19.7 atm. Feng et al. [17], Zhang et al. [18,19], and Luo et al. [20] focused on LFS for temperatures ranging from 373 to 543 K, ϕ = 0.6–1.6, where the effect of pressure was tested between 0.7 and 3 atm. As expected, the LFS decreased as the pressure was increased, with the same conclusions found in the work from Shahla et al. [11] for DEC. Conversely, for another linear carbonate—the dimethyl carbonate (DMC)—the effect of pressure was studied more extensively, e.g., Hu et al. [21] with ignition delay times (IDTs) in a shock tube (ST) at pressures ranging from 1 to 10 atm (1100–1600 K, ϕ = 0.5–2.0); Alexandrino et al. [22] with IDTs in a ST and a RCM (791–974 K, ϕ = 0.5–1.0 and 954–1585 K, ϕ = 0.5–2.0, respectively) from 2 to 40 atm; and Sun et al. [23] using a burner (quantification of CO, CO2, CH4, C2H2, C2H4 to cite a few). These studies of oxidation at high pressures were performed because linear carbonates are also considered as biofuels for internal combustion engines [10,24]. To summarize, except in the study of Sun et al. [13] with DEC, the effect of pressure was not measured under the pyrolysis conditions that are encountered in battery cells. Moreover, the investigation of the pressure effect was conducted for sub-atmospheric pressures that are essentially not realistic for common applications in the Sun et al. [13] study (0.04 and 0.20 atm).
The aim of the present study was to provide new experimental results for DEC and EMC pyrolysis at higher pressures to complement the current database. The effect of pressure was investigated by comparisons with the results from an earlier effort in [9]. This paper is organized as follows: the experimental methods and conditions are first introduced. Then, the new pyrolysis measurements are presented, and finally, chemical kinetics analyses are shown. This paper compares the reactivity of DEC and EMC pyrolysis at high pressure, utilizing CO time-history profiles for the first time.

2. Method

2.1. Shock-Tube Facility

Experiments were carried out in a stainless-steel shock tube, for which only a brief description is provided here, as further details are available in the literature [25]. The shock tube consists of a 6.78-m long driven section and a 3.0-m long driver section, with inner diameters of 16.2 cm and 7.62 cm, respectively. The two sections were separated by a 0.508 mm-thick polycarbonate diaphragm. Prior to each experiment, the driven section was evacuated to a pressure of approximately 10−8 atm or lower using a combination of a mechanical pump and a turbomolecular pump. Five piezoelectric pressure transducers, positioned along the final 2 m of the driven section, were employed to monitor the propagation of the incident shock wave and extrapolate its velocity to the endwall. This velocity, along with the initial gas temperature and pressure in the driven section, was used to calculate the temperature (T5) and pressure (P5) behind the reflected shock wave. The estimated uncertainties for T5 and P5 are 0.8% and 1.0%, respectively [26].
Mixtures were prepared in a separate stainless-steel tank using the partial pressure method. The DEC and EMC were introduced in vials and degassed several times to ensure no air was introduced into the mixture. Then, the DEC or EMC in the vapor phase was introduced into the mixing tank well below its maximum vapor pressure (9 Torr at 23.8 °C and 45 Torr at 25 °C for DEC and EMC, respectively) to guarantee that no condensation occurs during the mixture preparation. The mixtures investigated are presented in Table 1. The experimental conditions correspond to temperatures ranging from 1218 to 1656 K and pressures from 5.06 to 6.06 atm. Due to the aforementioned limitations with the vapor maximum pressures of the components considered herein (e.g., 10 Torr of EMC was used to prepare a 524 kPa mixture highly diluted in He/Ar, which allowed for three to four experiments), multiple mixtures were produced to investigate the ranges of temperatures, ensuring reproducibility and reliability. Mixtures were highly diluted in 0.2 He/0.7975 Ar to minimize the temperature change due to chemical reactions. Since the main component of the mixtures in the driven section is argon, the non-ideal boundary-layer effects (i.e., dP/dt) are minimal [27]. The DEC and EMC were purchased from Sigma Aldrich with a purity of 99%, and the gases, He and Ar, were provided by Praxair (Bryan, TX, USA), both with 99.999% purity.

2.2. CO Laser Absorption Diagnostic

The CO time-history profiles were measured using a continuous quantum cascade laser (Alpes Lasers) producing light near 4.8 μm to monitor the P(20) transition line of the 1 0 fundamental band of CO. The maximum absorption strength of the P(20) line is ensured by centering the laser wavelength using a removable cell containing a mixture of 10% CO in Ar. This quantification technique works in relative isolation from H2O and CO2 absorption [28], and the uncertainty in the measurements is estimated to be approximately 5.5% [29]. The laser light is split into two beams, and their intensities are collected using infrared, cryogenically cooled, photovoltaic detectors. The time-resolved incident intensity ( I 0 ) is directed to the first detector as a referenced intensity, while the time-resolved transmitted intensity ( I t ) is going through the sapphire windows of the shock tube and the reacting gases to terminate in the second detector and follow CO absorption signals during the experiment. Before the beams pass bypass filters, irises, and lenses (a direct-absorption setup) and reach the detectors, careful attention to the dark current phenomenon from the detectors themselves was made, and the associated offsets were collected to correct the CO profiles during the post-processing [30]. Time histories of CO mole fractions are processed with these two intensities based on the Beer-Lambert relation, defined as
I t / I 0 = e x p S T ϕ ν P   L   X C O
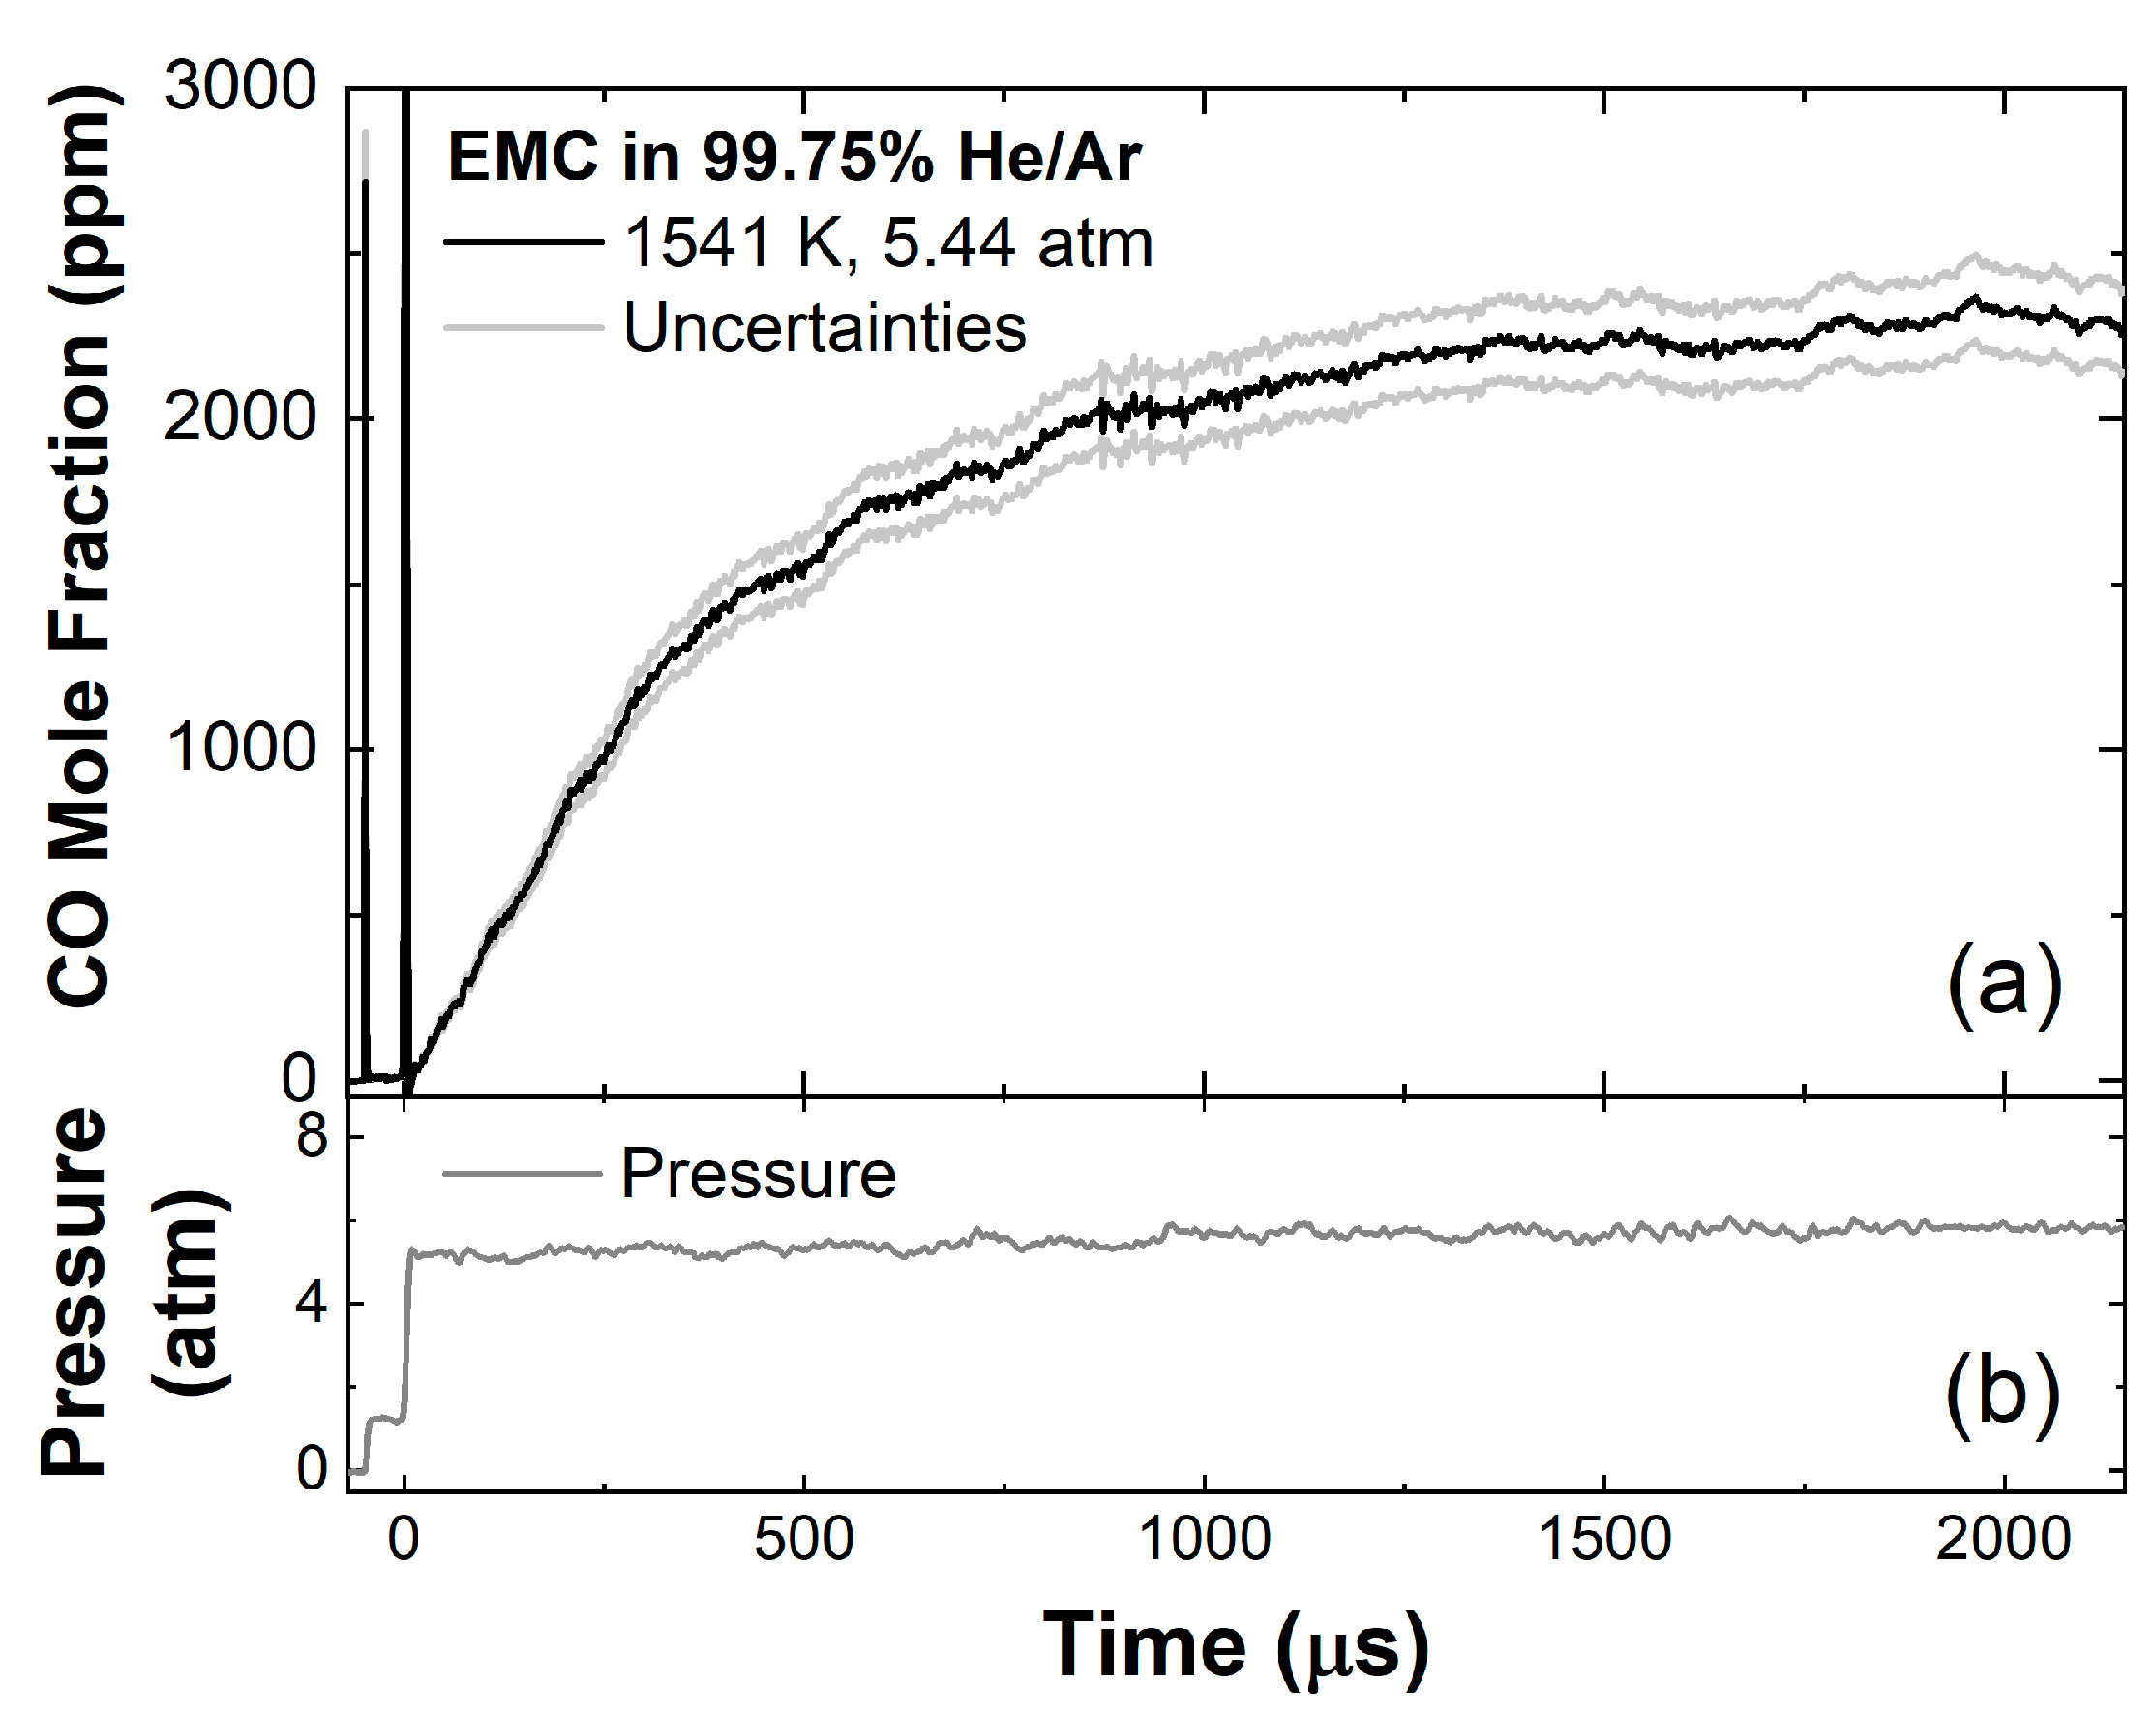
where S T is the linestrength, ϕ ν is the lineshape function, P is the pressure, L is the path length, and X C O is the CO mole fraction. The linestrengths were taken from the HITEMP database [31], while the lineshape function was modeled using a Voigt profile per the method of Liu et al. [32]. The collisional broadening coefficients of the bath-gas components He and Ar were taken from Grégoire et al. [29], and 20% of the diluent is helium to accelerate the vibrational relaxation of CO. A representative example of a CO time-history profile for the pyrolysis of EMC in 99.25% He/Ar is presented in Figure 2, and the uncertainties are shown in the mole fraction levels.

3. Results and Model Comparison

3.1. DEC Pyrolysis

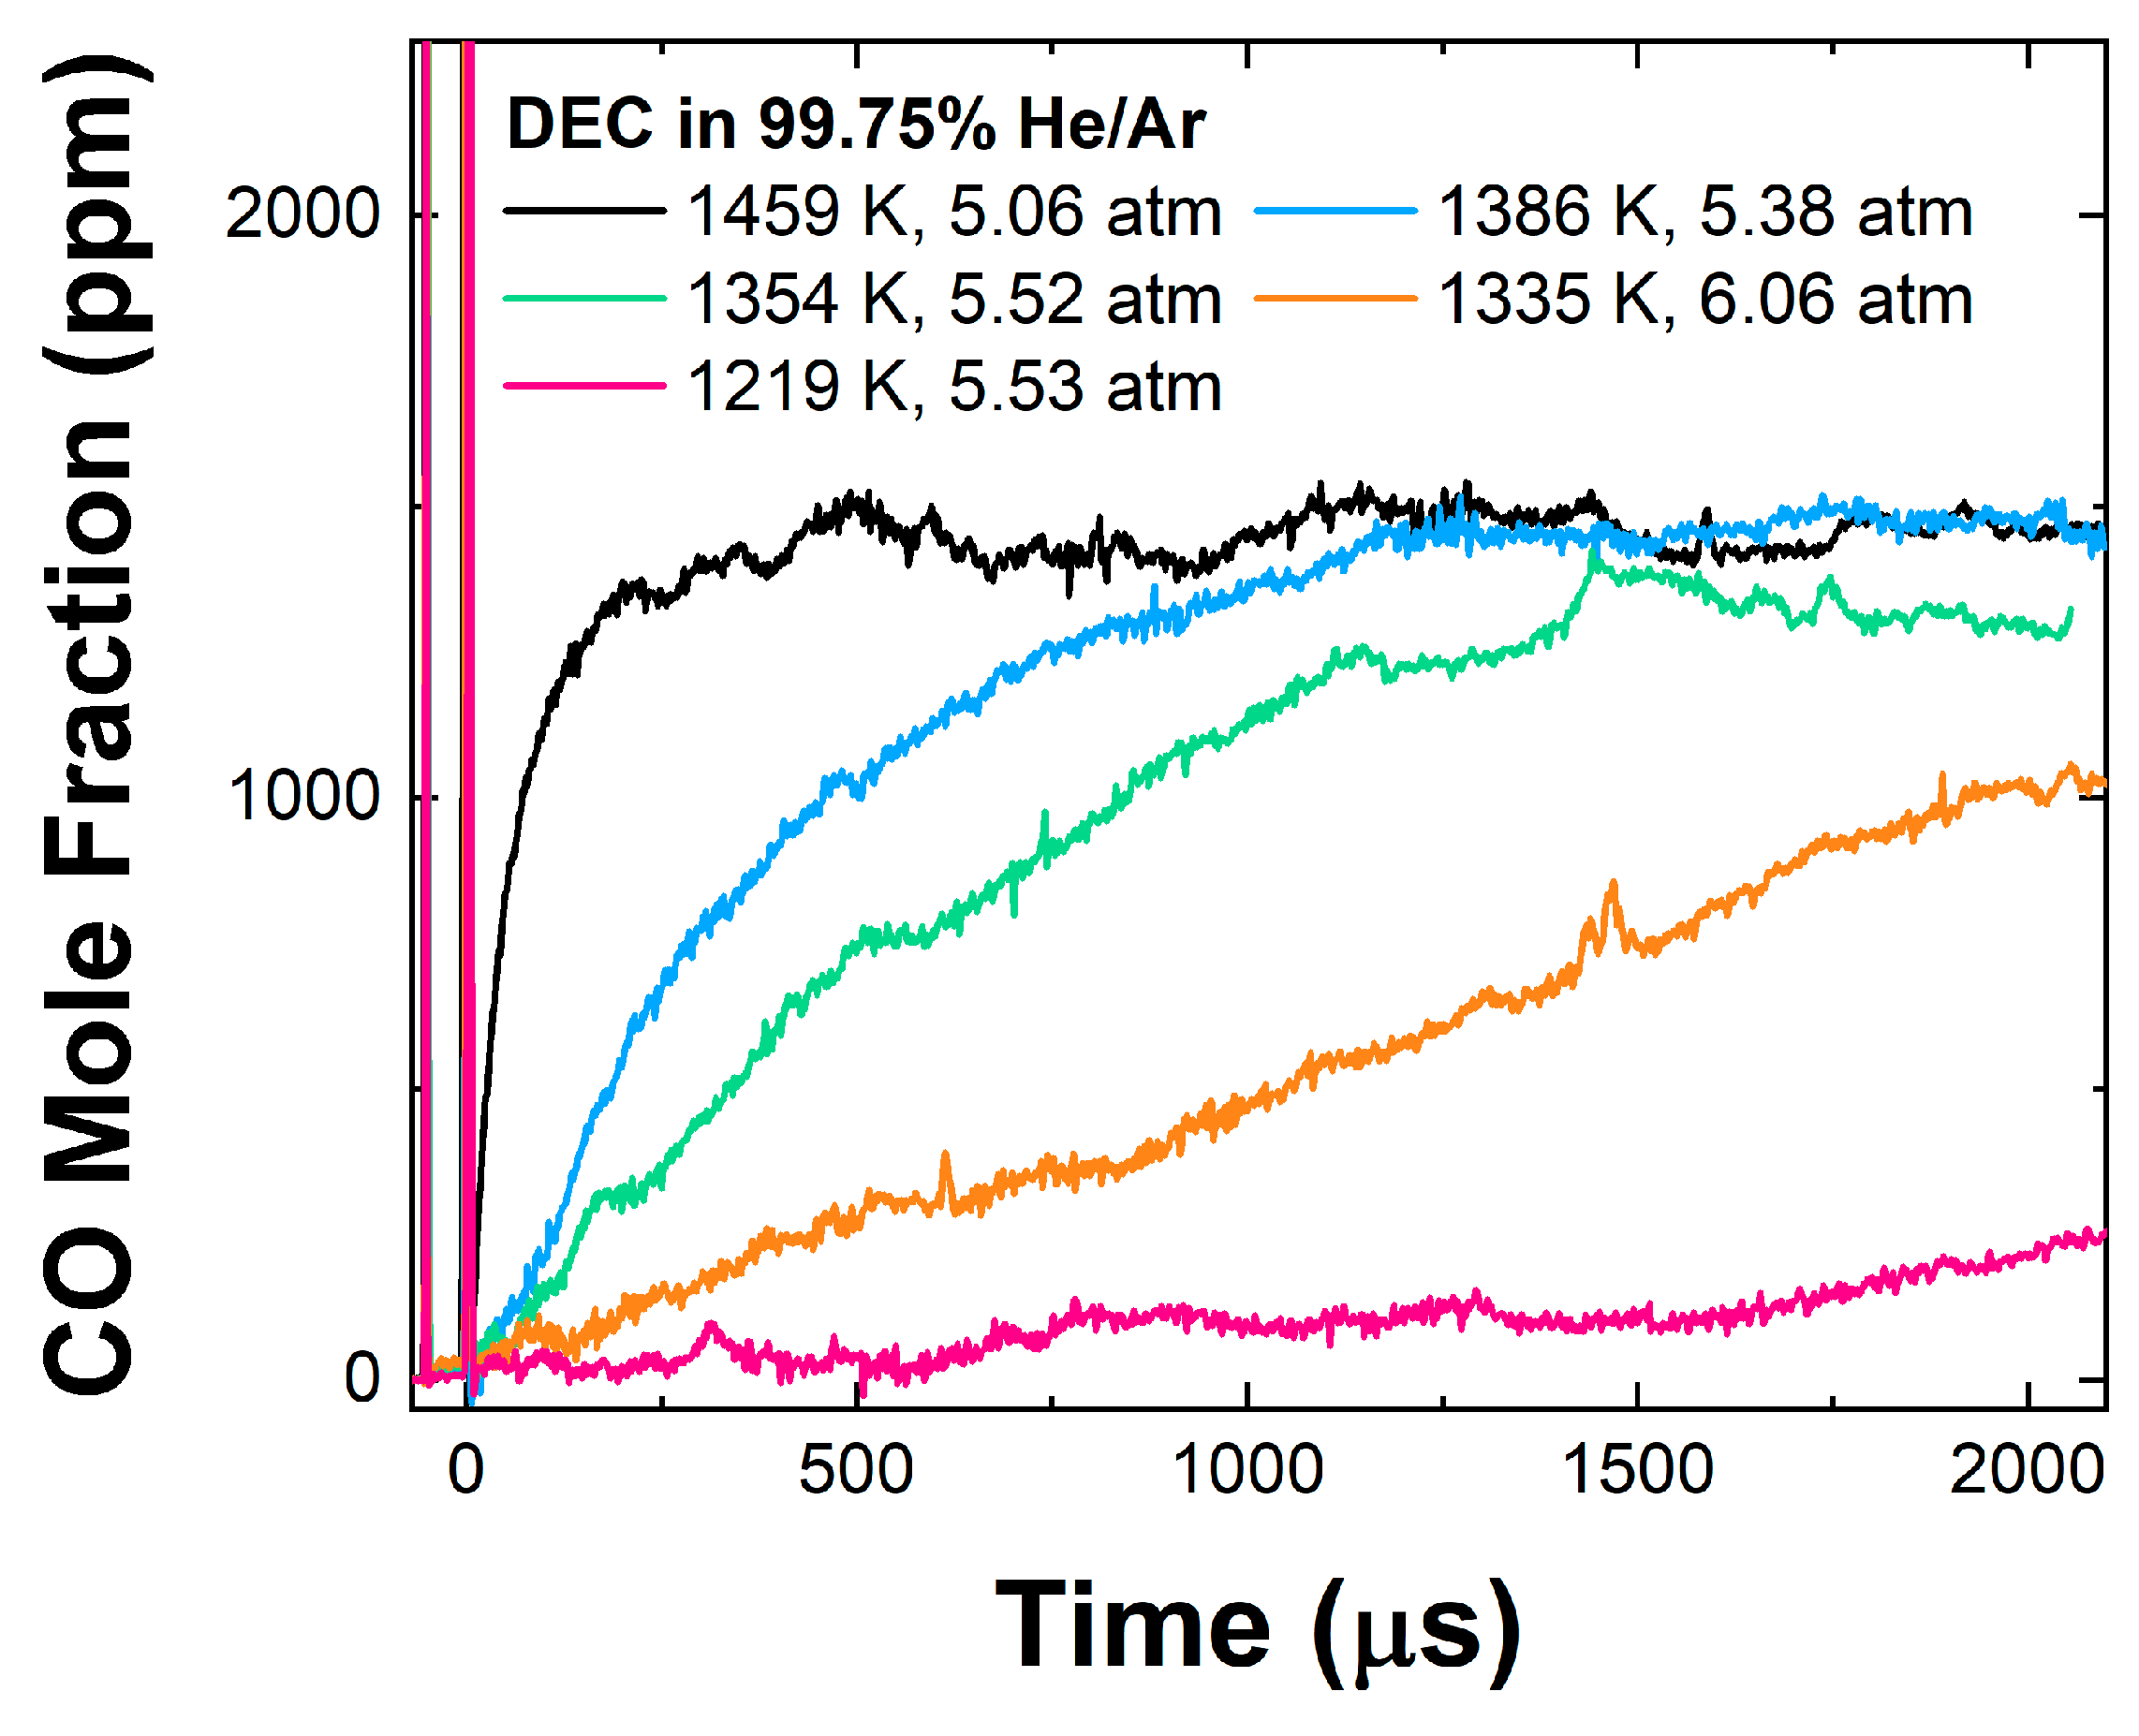
New experimental measurements were carried out in a shock tube to obtain CO time-history profiles for DEC pyrolysis in 99.75% He/Ar near 5.5 atm, see Figure 3. The spikes observed before and at 0 µs are due to temporary laser beam steering, which results from the density change caused by the passage of the incident and reflected shock waves. Laser absorption measurements in a shock tube at elevated pressures are more challenging than at pressures near 1 atm, and care was taken to best align the optical components to minimize any negative impacts on the S/N of the measured beam intensity due to facility vibrations and increased turbulence-induced fluctuations within the beam path, as in Mulvihill [33]. As can be seen from these profiles, the CO mole fractions increase across all temperature cases studied. At lower temperatures (1219 and 1335 K), the CO profile increases relatively slowly with time, with a steeper gradient for the intermediate temperature of 1354 K. At higher temperatures (1386–1459 K), the CO growth rate is more noticeable with a rapid increase in the CO mole fractions from the start of the experiment. The CO time-history profiles at higher temperatures show significant formation of CO from the pyrolysis of DEC, followed by a plateau at approximately 250 and 1200 µs at 1459 and 1386 K, respectively. The DEC decomposes via a pyrolysis process where approximately 20% of the O-atoms introduced in the fuel are converted to CO in our conditions, at the plateau. Additionally, the CO mole fraction reaches a plateau at the highest temperatures due to the absence of oxygen, which would allow the CO-to-CO2 production reaction mechanism [34,35].
These new experimental results were compared to detailed chemical kinetics models from the literature, namely Nakamura et al. [10], Shahla et al. [11], Sun et al. [13], Sela et al. [12], Takahashi et al. [15], Grégoire et al. [9], Feng et al. [17], Yu et al. [16], Khan-Ghauri et al. [36], and Luo et al. [20]. Three representative CO time-history profiles at high (a), intermediate (b), and low (c) temperatures are exhibited in Figure 4. At 1459 K and 5.06 atm (Figure 4a), all models are under-reactive: when comparing the time at which 50% of the experimental CO formation occurs, at approximately 40 µs, the numerical simulations predict this parameter at approximately 150 µs for most of the models, with the Shahla et al. [11] mechanism (solid orange line) being slightly slower with a 50% CO formation reached near 190 µs. Significant discrepancies are also observed at the plateau, where all models are 8–20% above the measured 1470 ppm, except that the Grégoire et al. [9] (dashed magenta line) and Luo et al. [20] (solid red line) models are underpredicting by 4% the final CO mole fraction, which is within the experimental error. Overall, at this high temperature, the Luo et al. model appears to be the most accurate both in rate of CO formation and CO level at the plateau.
At 1386 K and 5.38 atm, Figure 4b, a similar under-reactivity is seen for the models, i.e., at 50% of the CO production (720 ppm at 270 µs experimentally), all models predict 720 ppm of CO at a slower time near 490 µs, with Shahla et al. (solid orange line) the slowest model at 600 µs and Luo et al. [20] (solid red line) the fastest model observed at 400 µs. Note that no model reaches the plateau within the conditions tested; however, the Grégoire et al. [9] (dashed magenta line) and Luo et al. [20] (red solid line) models fall behind with a 170 ppm difference at 2 ms. Overall, the shape is better predicted by the Luo et al. [20] model under this condition. Conversely, the lower-temperature case at 1335 K and 6.06 atm shows that models are over-reactive compared to the experimental profile, except the Shahla et al. [11] mechanism, which predicts the CO formation with high accuracy.

3.2. EMC Pyrolysis

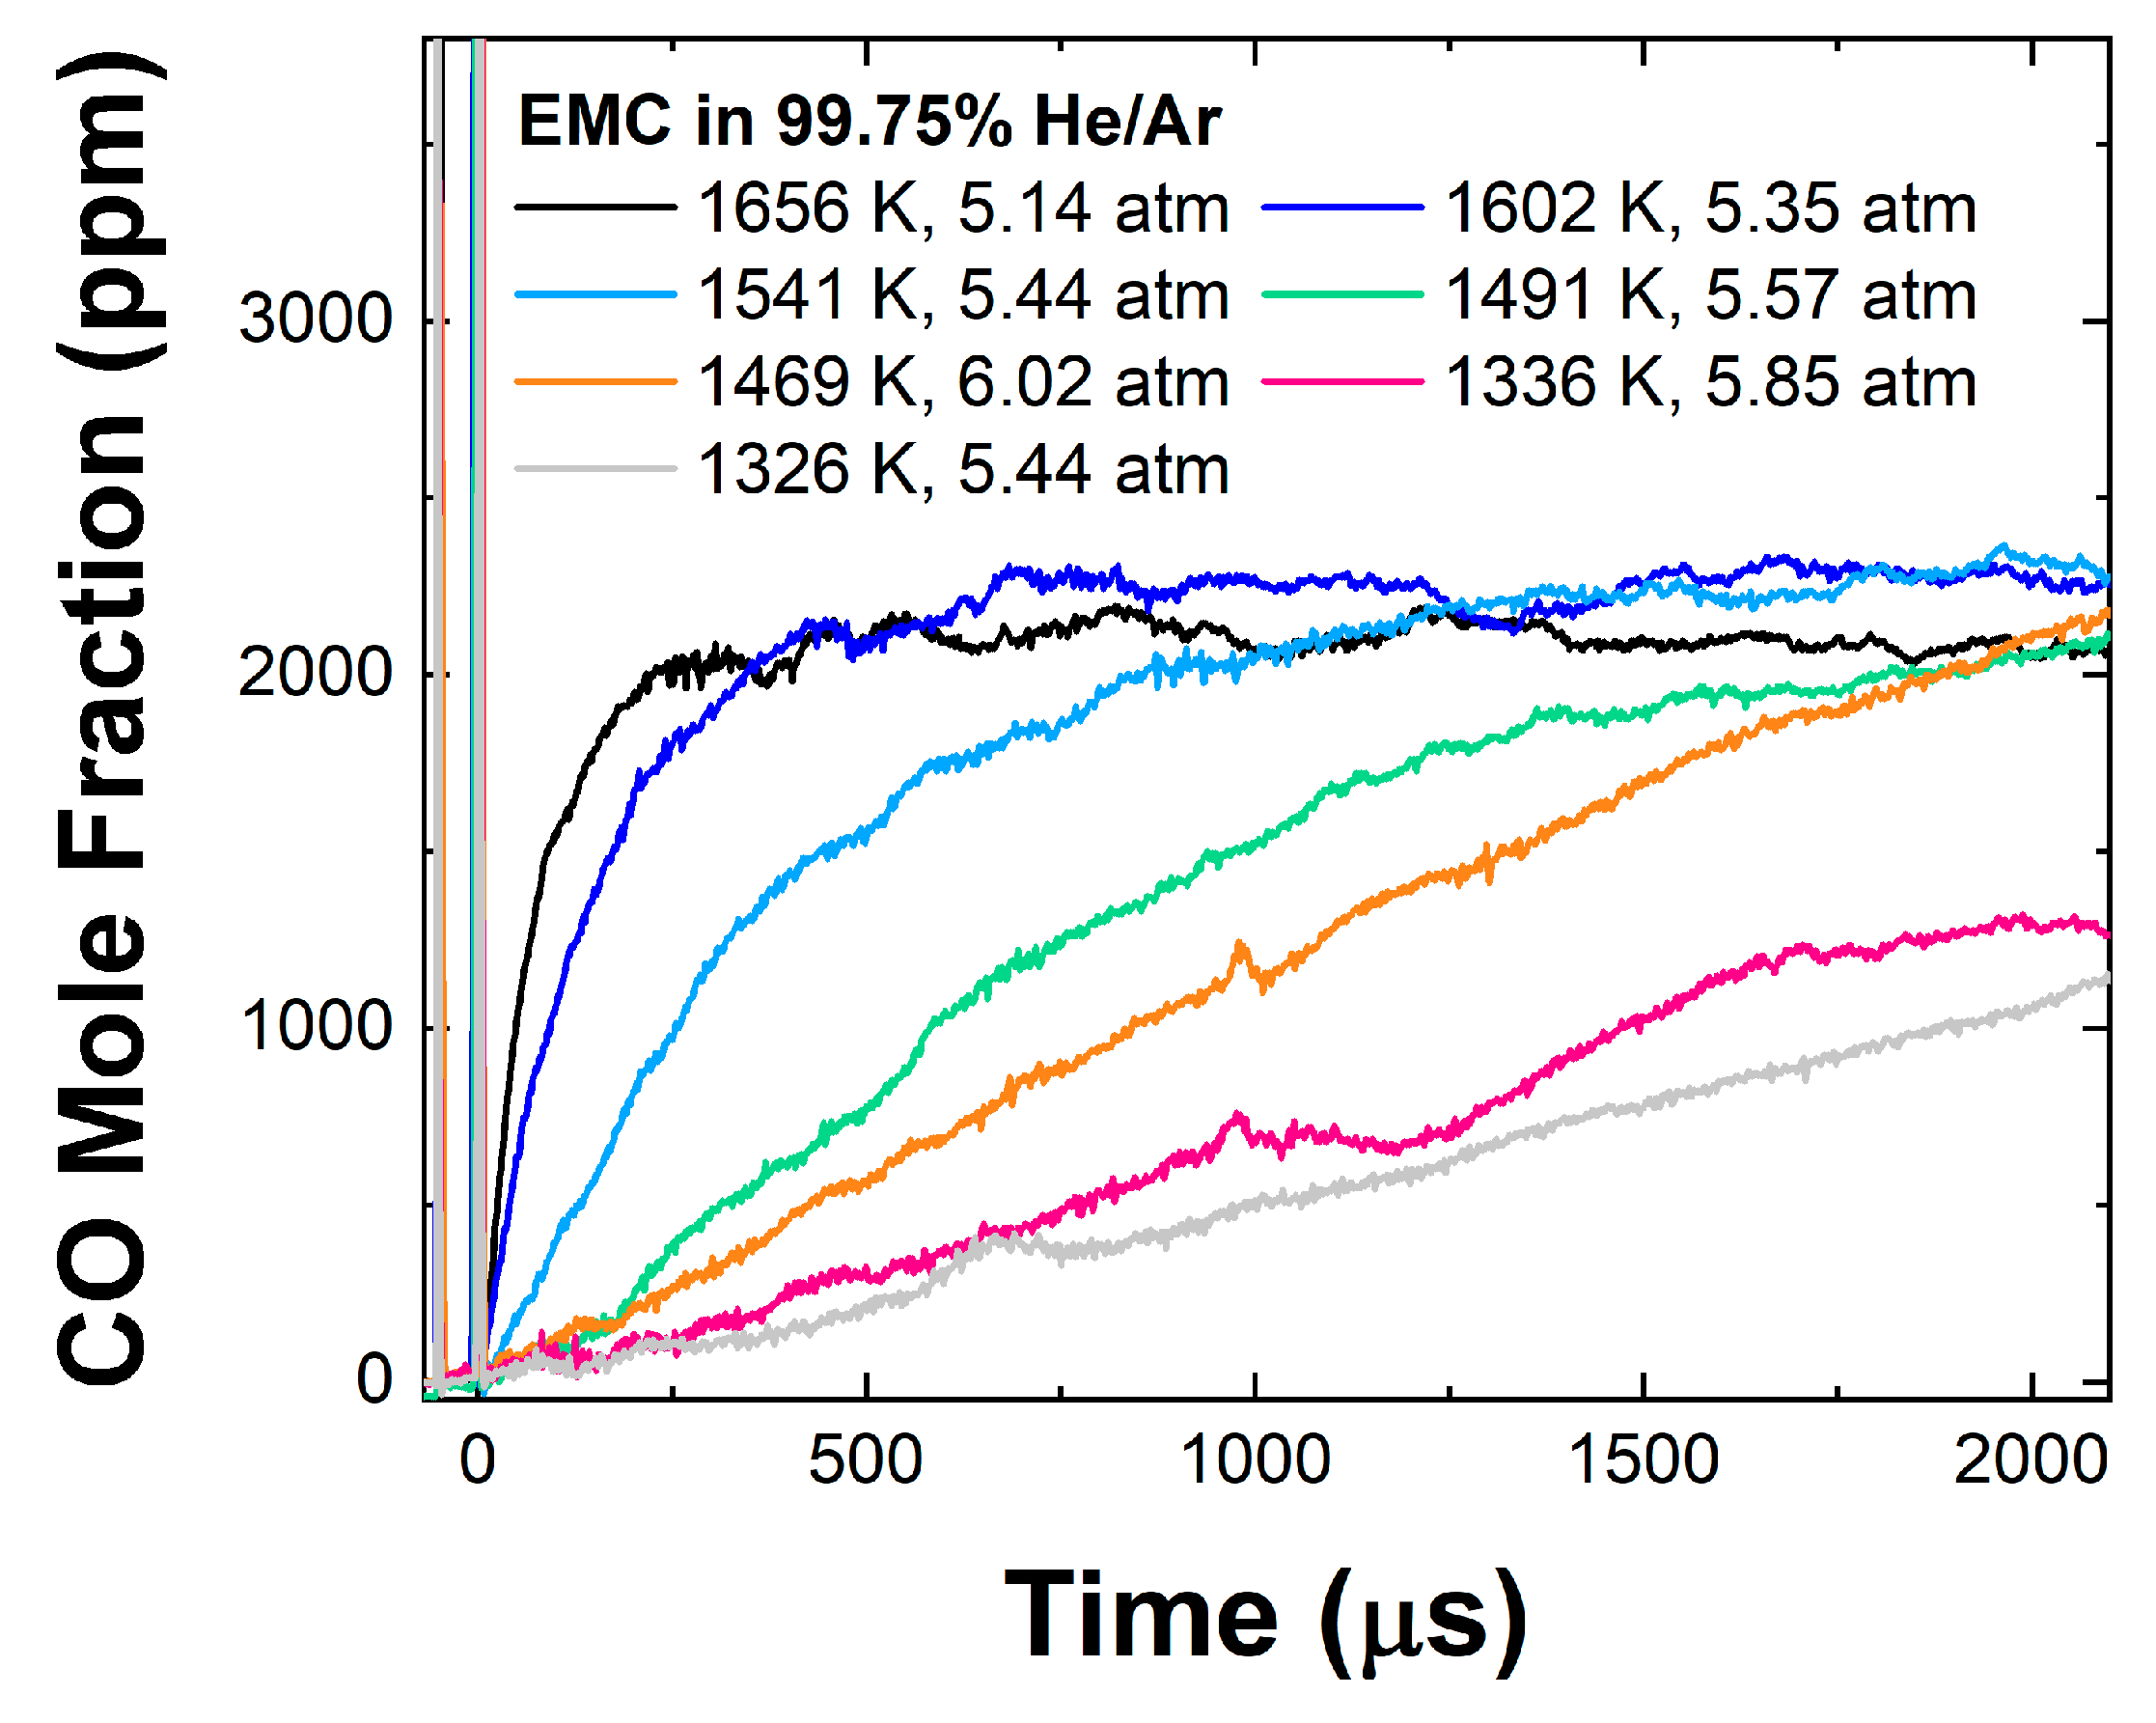
Figure 5 presents the new CO time-history profiles for the pyrolysis of EMC in 99.75% He/Ar near 5.5 atm at temperatures ranging from 1326 to 1656 K, where similar observations can be made on the general feature of the profiles (referring to Figure 3). However, the CO concentrations reached at the plateau are much more important, i.e., near 2250 ppm for the high-temperature conditions (1541–1656 K), which corresponds to a conversion of 30% of the O-atoms into CO at the plateau. The work from Grégoire et al. [9] compared the DEC and EMC with another linear LIB electrolyte, dimethyl carbonate (DMC). That work also exhibited a large effect from the methoxy groups present in the DMC molecule. In summary, DMC, DEC, and EMC were studied in 99.75% He/Ar near 1.3 atm at temperatures from 1230 to 2375 K. On the one hand, the ppm levels of CO at the plateau were as follows (from the highest to the lowest at 1660 K, 1.2 atm in [9]): DMC produced a higher CO mole fraction, followed by EMC, and then DEC, with a step decrease in the CO level by roughly 700 ppm with each methoxy group replaced by an ethoxy one. On the other hand, DMC and DEC were more reactive than EMC at near-atmospheric pressure.
A comparison of DEC and EMC is provided in Figure 6 at 1464 ± 5 K, and near 5.5 atm. The higher-pressure conditions explored herein do not change the main characteristics of DEC and EMC pyrolysis observed in Grégoire et al. [9]: (1) the CO concentrations obtained at the end of the test (at roughly 2.4 ms) are still higher for EMC than DEC, and (2) DEC is noticeably more reactive than EMC. Note that the current time histories in Figure 6 were also recorded in a highly diluted mixture, i.e., 99.75% He/Ar, matching the Grégoire et al. [9] dilution parameter, so further discussion on the effect of pressure can be found below. While the CO experimental profile of EMC pyrolysis shows a slower increase, it ultimately crossed with the result from DEC at roughly 1480 µs at this temperature.
The EMC experimental profiles are compared to the detailed chemical kinetics mechanisms from the literature in Figure 7. Six models are available, namely Takahashi et al. [15], Grégoire et al. [9], Feng et al. [17], Yu et al. [16], Khan-Ghauri et al. [36], and Luo et al. [20]. Their numerical predictions are shown for three representative results at (a) high (1602 K), (b) intermediate (1541 K), and (c) low (1469 K) temperatures. As one can see, the high-temperature case (Figure 7a) is well predicted by all models, with results from Takahashi et al. [15] and Feng et al. [17] slightly over-reactive in the first 400 µs. Note that the Grégoire et al. [9] and Khan-Ghauri et al. [36] models produce equivalent CO time histories, as updates in the most recent mechanism (Khan-Ghauri et al. [36]) focused on the electrolytes’ oxidation reactions as well as the unique chemistry of a fire suppressant candidate (bis(2,2,2-trifluoroethyl) carbonate) for LIB fire hazard [37]. Moreover, Grégoire et al. [9] indicated that the major changes were mostly implemented for DMC and DEC; however, sensitivity and rate-of-production analyses demonstrated that the model’s performance for EMC was suffering from the methanol (CH3OH) sub-mechanisms in our conditions, an issue that was not visible with other validation targets data like ignition delay time or laminar flame speed. The importance of the CH3OH sub-mechanism at high pressure is investigated in the next section.
Moderate agreement is visible at 1541 K and 5.44 atm in Figure 7b for the prediction of the plateau, but the onset of CO is not well-reproduced by any model. The largest discrepancies in the CO levels were denoted at 500 µs for the Takahashi et al. [15] and Feng et al. [17] models that differ by 51% from the experimental measurement, closely followed by the remaining models, which deviate by a maximum of 23% near 330 µs. Lastly, Figure 7c used a CO profile obtained at a lower temperature, 1469 K and 6.02 atm, and the models have difficulty matching the slow CO growth, as the curvature of all models exhibits a much steeper rise at the beginning of the test time, and therefore an early transition to the plateau. This behavior indicates that the EMC models require further improvements for the lower temperatures at pressures near 6 atm.

3.3. Effect of Pressure

The effect of pressure can be observed using the new CO time-history profiles presented herein and the CO time-history results obtained in similar conditions at near-atmospheric pressure from the Grégoire et al. [9] study. Figure 8 shows two cases where similar temperatures were recorded, namely 1381 ± 5 K (Figure 8a) and 1487 ± 4 K (Figure 8b), with the two pressures of roughly 1.3 and 5.5 atm. One can see that the overall effect of a higher pressure is the augmentation in the reactivity for both electrolytes, leading to larger concentrations of CO in the time frame of our experiments. The effect of an increase in the pressure also leads to an increase in the amount of CO produced at the plateau (see numerical predictions in the Supplementary Materials). Along with the experimental profiles are the numerical predictions from the Luo et al. [20] mechanism, which performs relatively well at intermediate and low temperatures for both electrolytes considered in this work. Unsurprisingly, the reaction mechanism is able to predict the DEC and EMC pyrolysis behavior near 1.3 atm, as most of the kinetic efforts in the literature were conducted for near-atmospheric conditions, even if the comparison with EMC shows a 14% difference in the CO ppm levels between the experimental measurement and modeled profile.
At 5.6 atm, the model is even more over-reactive for EMC, whereas the model is now under-reactive for DEC. On the one hand, the lack of performance regarding DEC at 5.6 atm could be due to pressure-dependent reactions that are not necessarily having a large contribution at 1.3 atm. Moreover, EMC seems to carry over a set of reactions that are neither properly tuned at 1.3 atm nor at 5.6 atm. The increase in the reactivity could also indicate the onset of other reactions at the early stage of EMC thermal decomposition. Overall, the detailed chemical kinetics mechanism from Luo et al. [20] exhibits satisfying performance and is to be used for further analyses. More comparisons (1.3 vs. 5.5 atm) with DEC and EMC pyrolysis CO time-history profiles are available in the Supplementary Materials at different temperatures.

4. Discussion

Understanding the complexity of the pyrolysis of these electrolytes is crucial to allow better prediction and control of the processes at higher pressures, typically generated within the LIBs during thermal runaway. Sensitivity and rate-of-production analyses were carried out for DEC and EMC using the Luo et al. [20] mechanism for two pressures, 1.3 and 5.5 atm, at 1380 and 1490 K, respectively. As can be expected and seen in our former study at 1.3 atm [9], the chemistry involved for the DEC and EMC electrolytes’ pyrolysis is drastically different.
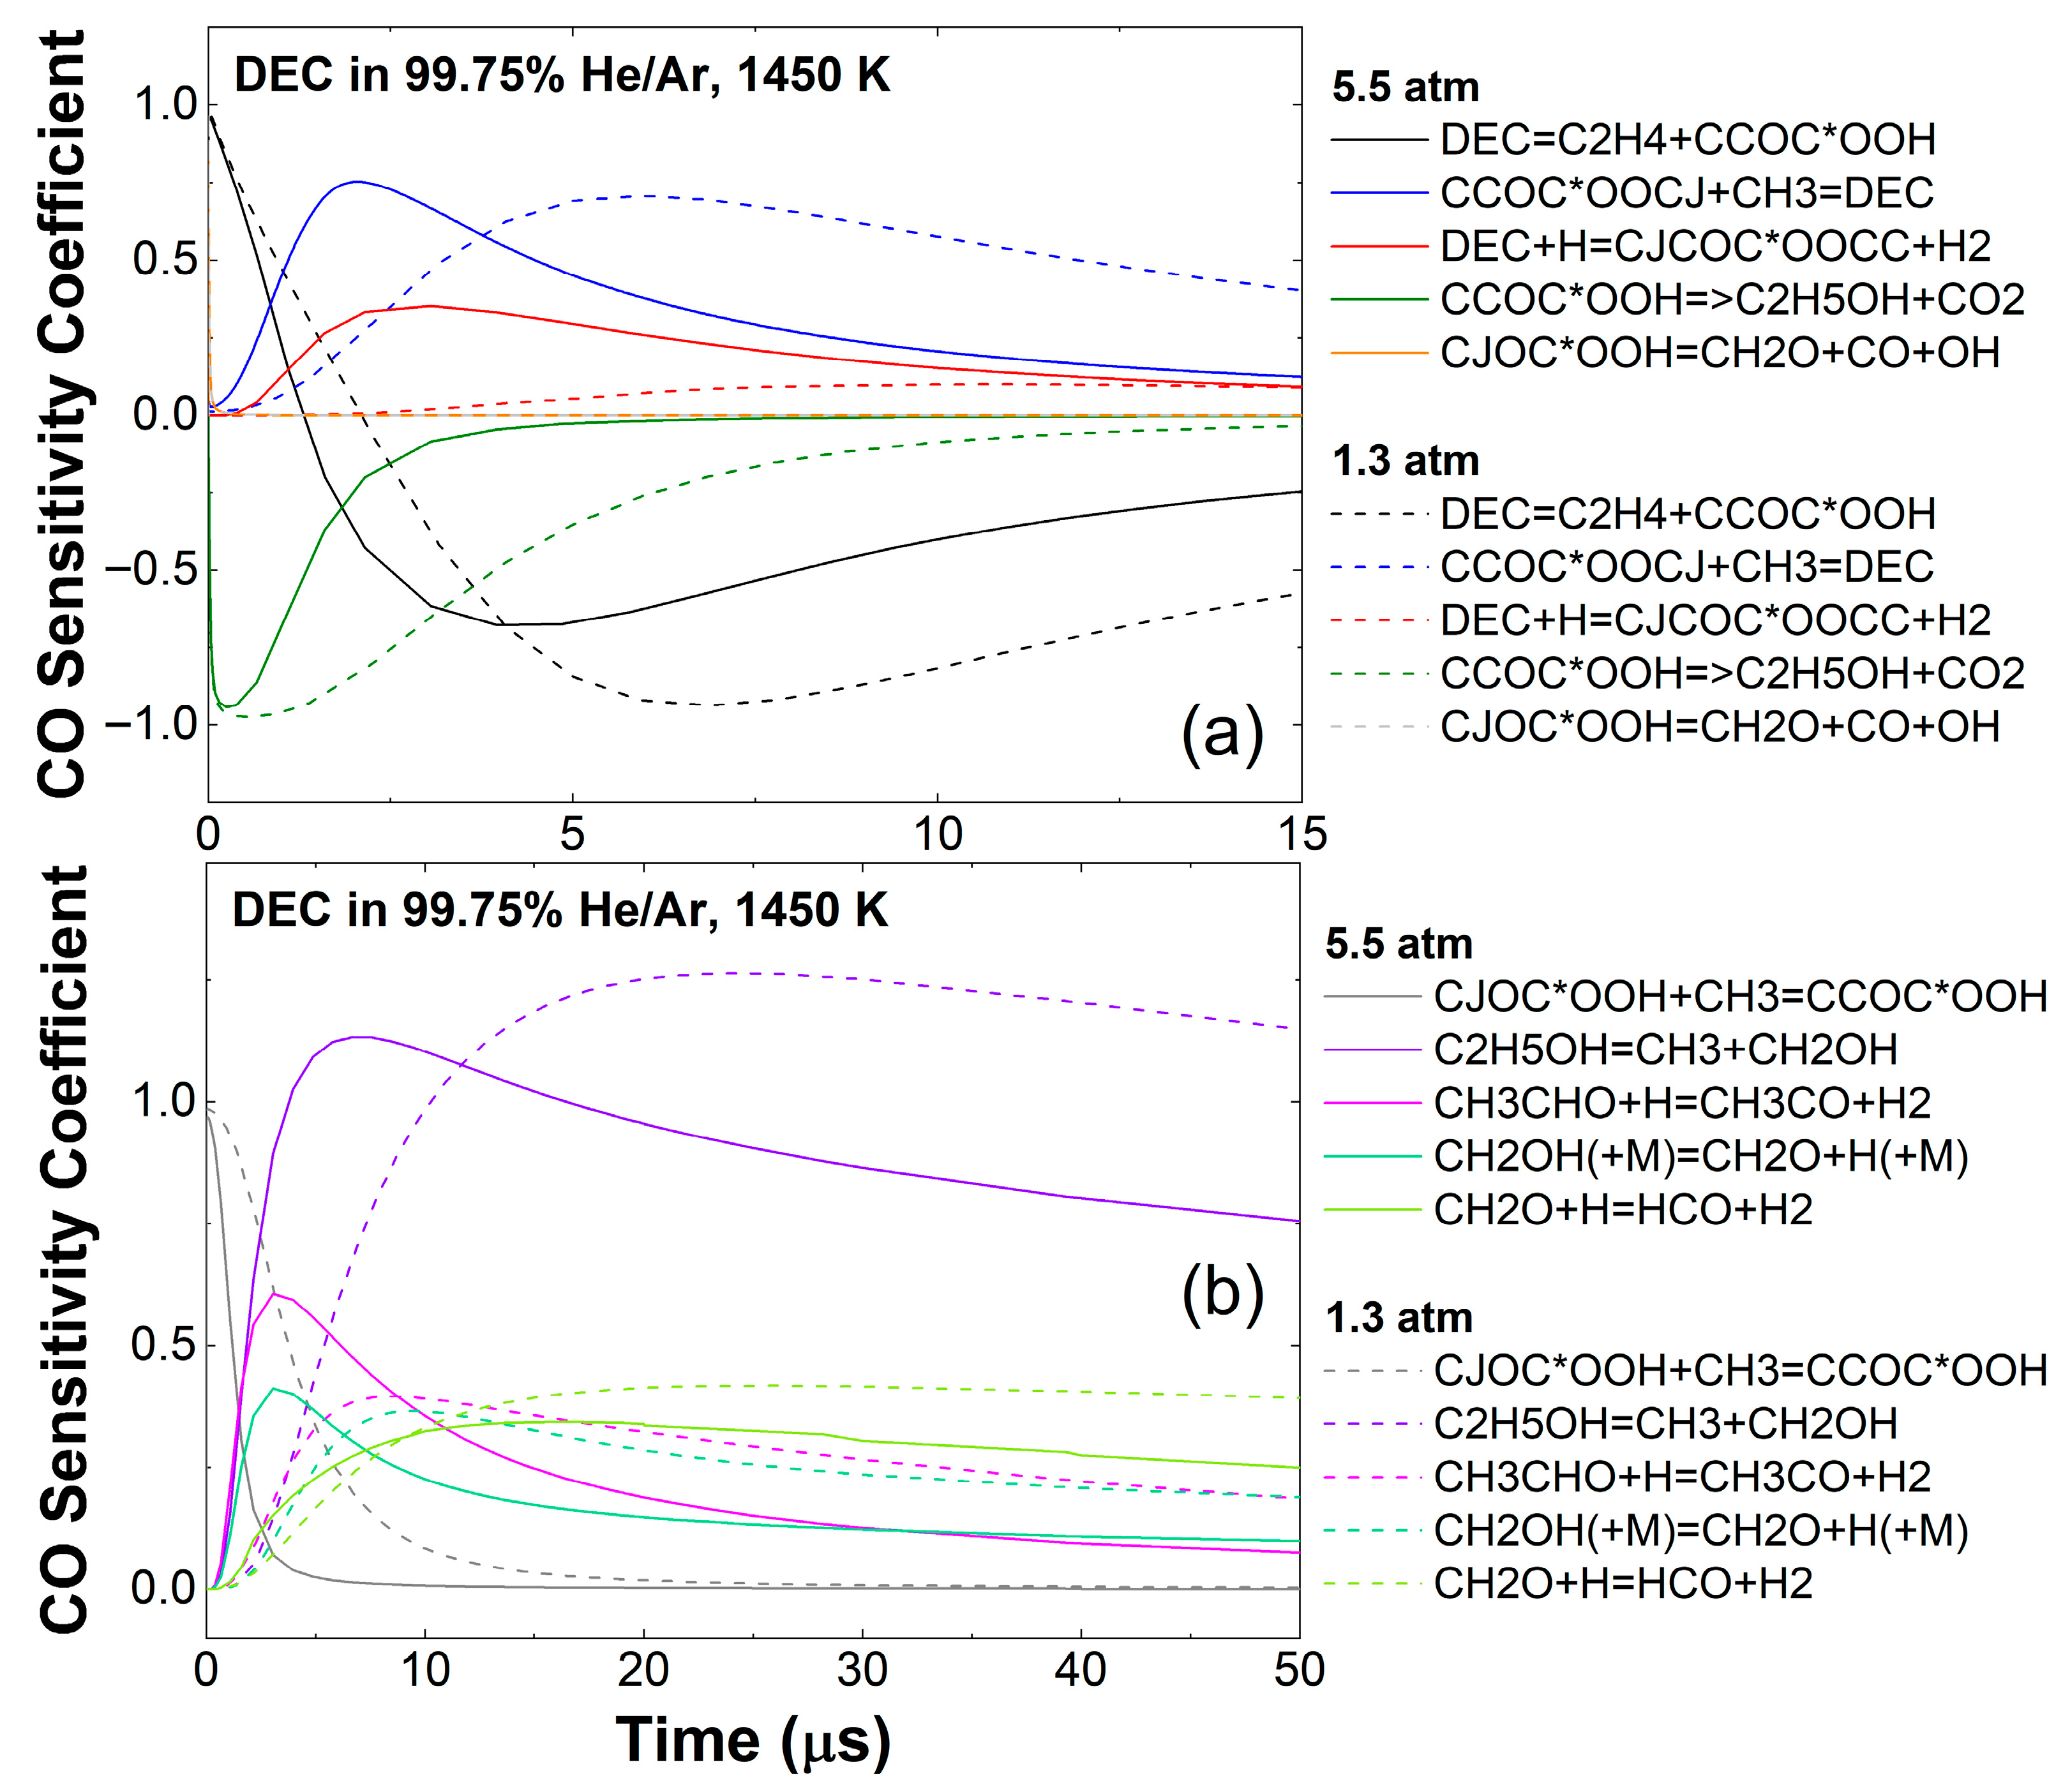
The sensitivity analysis for CO (see Figure 9a) reveals that the most dominant reactions remain the same at higher pressure (5.5 atm) as the ones discussed in Grégoire et al. [9] at 1.3 atm, with the reactions DEC CCOC*OOH + C2H4 (R1) and the subsequent reaction CCOC*OOH C2H5OH + CO2 (R2) giving ethylene (C2H4) and ethanol (C2H5OH). The reaction (R2) is highly inhibiting the production of CO because it produces CO2 instead, which prevents an important O-atom conversion into CO.
DEC ⇄ CCOC*OOH + C2H4
CCOC*OOH → C2H5OH + CO2
Nevertheless, the set of reactions for C2H5OH at near-atmospheric pressure is primarily led by C2H4OH radicals obtained via the reactions C2H5OH + H SC2H4OH + H2 (R3) and C2H5OH + H PC2H4OH + H2 (R4)—producing CO with the sequence C2H4OH CH3CHO CH3CO CO—whereas a higher sensitivity from the reaction DEC CCOC*OOCj + CH3 (R5), written in reverse in the model), at higher pressure is observed. It contrasts starkly with the inhibiting reaction (R2) at 1.3 atm.
C2H5OH + H ⇄ SC2H4OH + H2
C2H5OH + H ⇄ PC2H4OH + H2
DEC ⇄ CCOC*OOCj + CH3
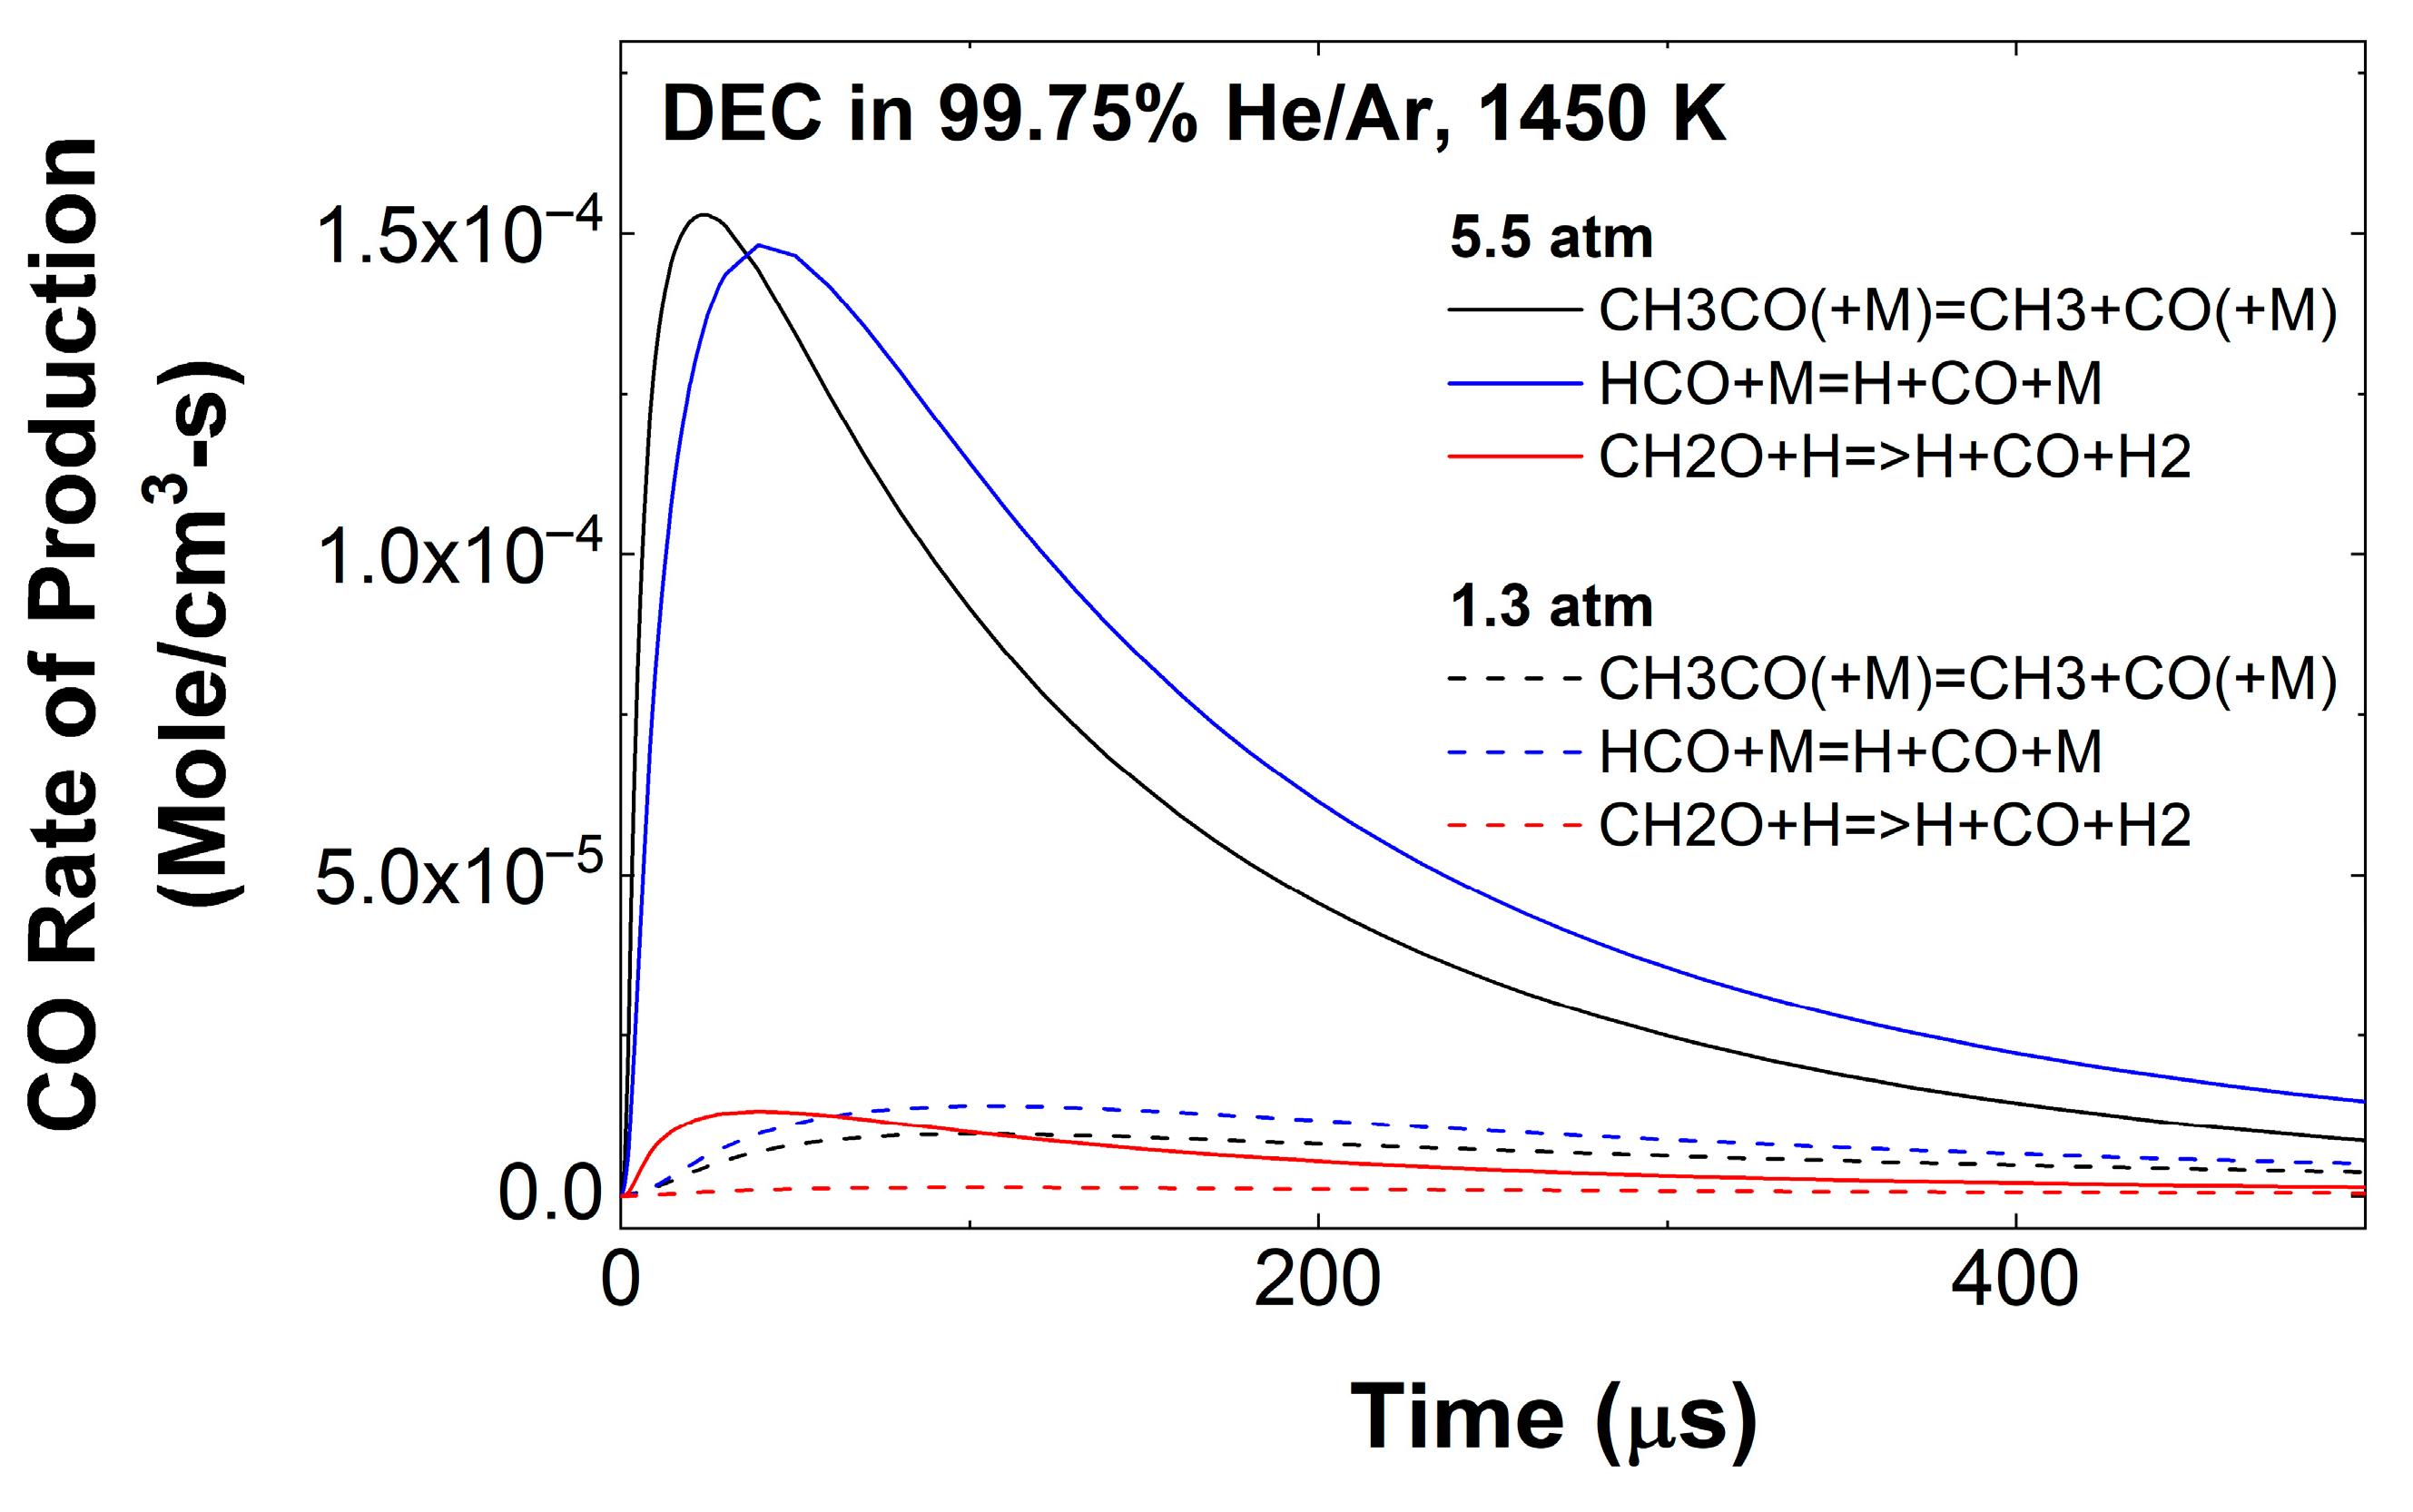
As shown in Figure 10, the routes for CO production at higher pressure are first CH3CO(+M) CH3 + CO(+M) (R6), closely followed by HCO + M H + CO + M (R7). At 5.5 atm, the reaction CH3CHO + H CH3CO + H2 (R8) has a larger contribution compared to the results at 1.3 atm (see Figure 9b), and direct CO formation from CH3CO is preferred at 5.5 atm over the reaction (R7) at 1.3 atm.
CH3CO(+M) ⇄ CH3 + CO(+M)
HCO + M ⇄ H + CO + M
CH3CHO + H ⇄ CH3CO + H2
The CH3CHO comes from the intermediate species mentioned above, CCOC*OOCj, from the reaction (R9), such as:
CCOC*OOCj ⇄ CH3CHO + CH3OCO
The acetaldehyde reaction pathway leading to CO can be described with the reactions (R8)–(R6). Conversely, the reaction CH2O + H HCO + H2 (R10) contributes noticeably at 1.3 atm, see Figure 9b, from the reaction pathway of C2H5OH CH2OH CH2O HCO CO, following the set of reactions (R1)–(R2)–(R11)–(R12)–(R10)–(R7). While the reaction (R2) is still active at higher pressure, its inhibiting effect is shortened in duration, as visible in Figure 9a.
CH2O + H ⇄ HCO + H2
C2H5OH ⇄ CH3 + CH2OH
CH2OH(+M) ⇄ CH2O + H(+M)
The crucial effect of increased pressure lies in the production of CCOC*OOCj via the reaction (R5). When the same sensitivity and rate-of-production analyses are performed with a slightly less performant model—in this case the Khan-Ghauri et al. [36] mechanism—the same core of reactions is involved; however, their sensitive distribution differs considerably. Firstly, the reaction DEC CCOC*OOCj + CH3 (R5), adding CO via CH3CHO and subsequent reactions (R9)–(R8)–(R6), is remarkably less sensitive in the Khan-Ghauri et al. model. Secondly, the reactions DEC CCOC*OOH + C2H4 (R1) and CCOC*OOH CjOC*OOH + CH3 (R13) are more sensitive, which induces a competition with CjOC*OOH CH2O + CO + OH (R14) during the early stage of the pyrolysis. Thirdly, and at a later stage, a stronger pressure effect for the SC2H4OH sub-mechanism is observed with the reactions SC2H4OH(+M) CH3CHO + H(+M) (R15) and SC2H4OH(+M) CH3 + CH2O(+M) (R16). These three steps could explain the slower CO induction and higher CO plateau from this model [36]. The detailed comparison between the Luo et al. [20] and the Khan-Ghauri et al. [36] models can be found in the Supplementary Material.
CCOC*OOH ⇄ CjOC*OOH + CH3
CjOC*OOH ⇄ CH2O + CO + OH
SC2H4OH(+M) ⇄ CH3CHO + H(+M)
SC2H4OH(+M) ⇄ CH3 + CH2O(+M)
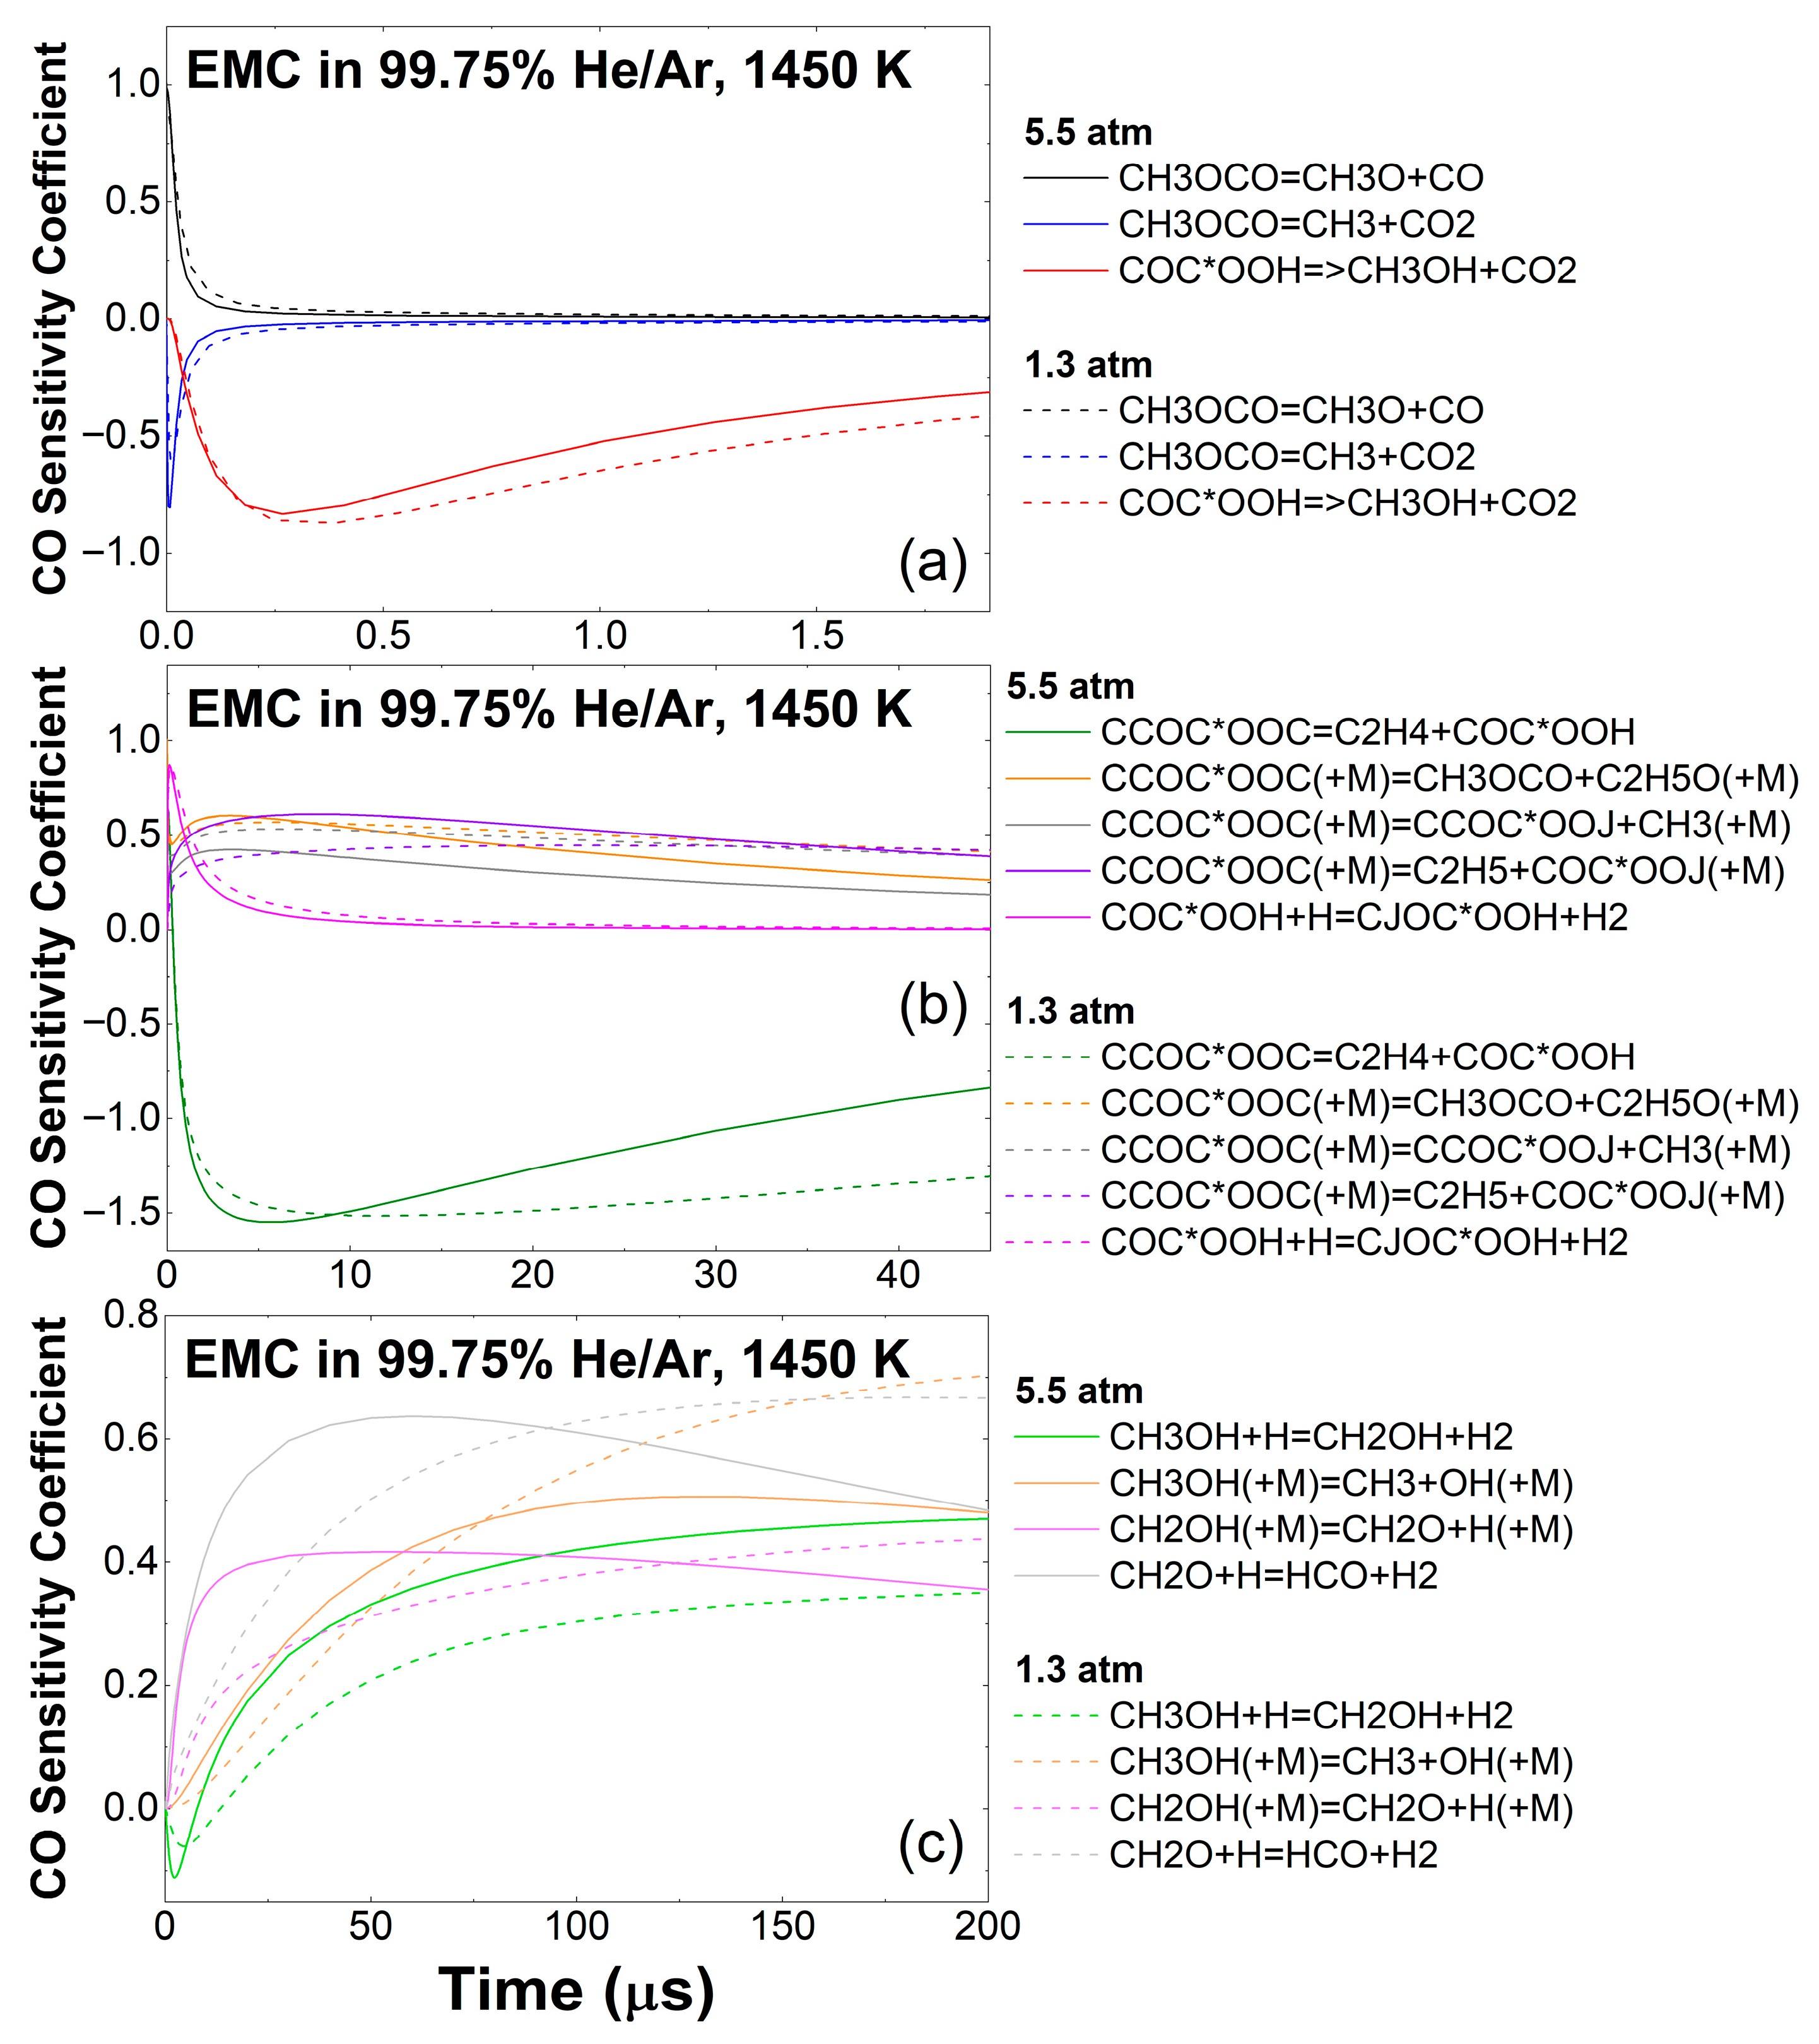
Figure 11 shows the sensitivity analysis for EMC (CCOC*OOC in the model). At 1.3 atm (based on Grégoire et al. [9]), the EMC key reactions were determined as CCOC*OOC COC*OOH + C2H4 (R17), followed by COC*OOH CH3OH + CO2 (R18), and it remains the same at 5.5 atm.
CCOC*OOC ⇄ COC*OOH + C2H4
COC*OOH → CH3OH + CO2
Two reaction pathways are available for CH3OH, i.e., the sequences CH3OH CH3O CH2O HCO CO (R19–R20–R10–R7) and CH3OH CH2OH CH2O HCO CO (R21-R12-R10-R7), where both routes are strongly enhanced at higher pressure, see Figure 11c.
CH3OH + H ⇄ CH3O + H2
CH3O(+M) ⇄ CH2O + H(+M)
CH3OH + H ⇄ CH2OH + H2
As commented for DEC pyrolysis, the EMC decomposition also shows an alternative pathway via CH3OCO with the reaction CH3OCO CH3O + CO (R22) promoted by CCOC*OOC(+M) CH3OCO + C2H5O(+M) (R23), see Figure 11a,b.
CH3OCO ⇄ CH3O + CO
CCOC*OOC(+M) ⇄ CH3OCO + C2H5O(+M)
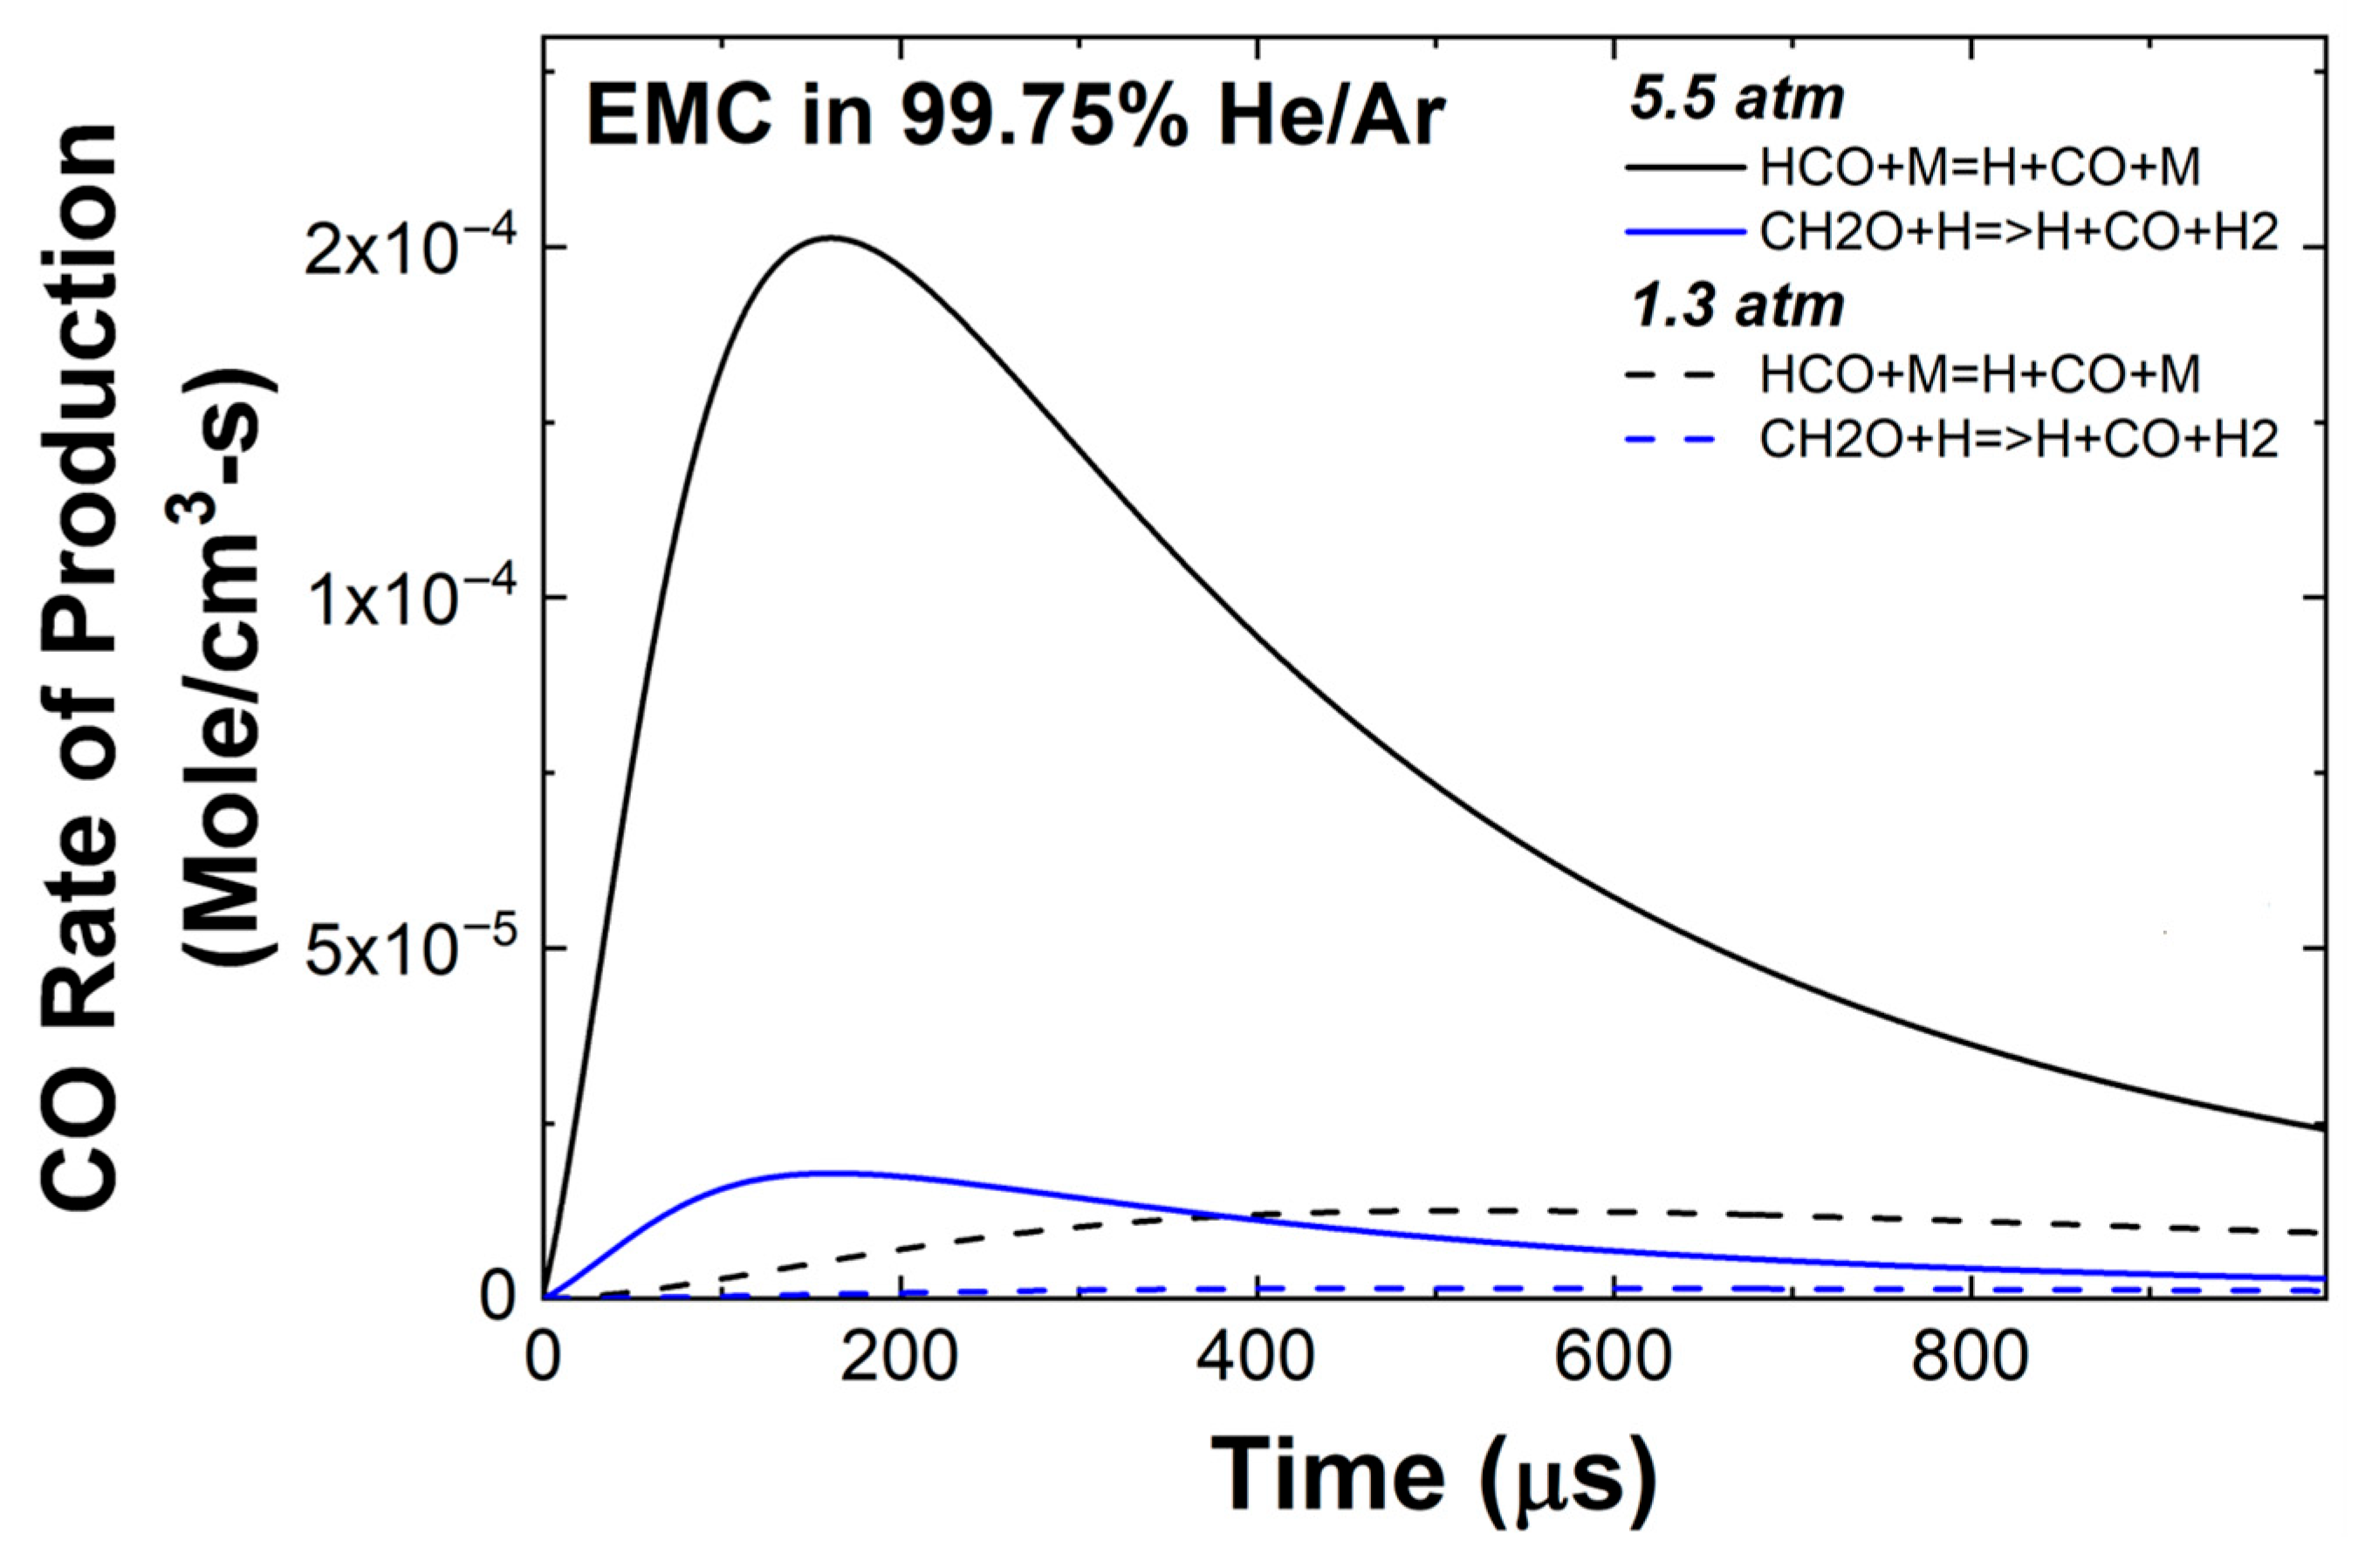
Note that the CH3OCO directly produces CO with the reaction (R22) but is not the main CO producer. Additionally, and as highlighted in Figure 12 using a rate-of-production analysis, the more traditional reaction HCO + M H + CO + M (R7) is present and is fed by CH3OCO via the sequence CH3OCO CH3O CH2O HCO CO (R22–R20–R10–R7). Interestingly, the reaction (R17) inhibiting effect is tempered at higher pressure, enhancing the reaction (R23) during the EMC pyrolysis. It can be noted that this is the main difference between the Luo et al. [20] and the Khan-Ghauri et al. [36] models, which could explain the slightly larger discrepancies in the numerical predictions using [36], and this comparison can be found in the Supplementary Materials.
Ultimately, similar reaction pathways for both DEC and EMC persist at higher pressure when compared to the CO time-history results obtained in similar conditions at near-atmospheric pressure in Grégoire et al. [9] and serving as baselines. Nonetheless, the sensitivities are modified significantly, increasing both the CO induction time and the CO ppm levels. While models from the literature exhibit various performance, it seems that the core reactions from the Luo et al. [20] and the Khan-Ghauri et al. [36] mechanisms are identical, implying that no key reaction is missing and that fine tuning (i.e., high-level calculations) is still needed for DEC and EMC pyrolysis conditions, especially at higher pressure, for realistic understanding in the battery cell during thermal runaway.

5. Conclusions

This research investigated how pressure influences the pyrolysis of two commonly used linear electrolytes, diethyl carbonate (DEC) and ethyl methyl carbonate (EMC). As gas forms within the battery cell, pressure increases until the gases are vented, which could potentially result in a fire hazard. The pyrolysis of DEC and EMC was examined in the gas phase, in a 99.75% He/Ar mixture, under high-temperature conditions and pressures close to 5.5 atm. A quantum cascade laser was utilized to measure the time-dependent CO production, generating a unique set of experimental data. CO time-history results obtained under similar conditions at near-atmospheric pressure from Grégoire et al. [9] were used as reference points for comparing DEC and EMC. Numerical predictions based on detailed chemical kinetics models from the literature were performed, and the Luo et al. [20] model exhibited satisfactory performance to be used for further analyses. Highlights in the reaction pathways at high pressure and their impact on CO formation were described and illustrated. In essence, the DEC and EMC sub-mechanisms at 1.3 atm are driven by ethanol (C2H5OH) and methanol (CH3OH), respectively, whereas at higher pressure, the DEC and EMC find alternative routes with CH3CHO and CH3OCO, respectively. Note that the former one, CH3CHO produces dominantly CO via CH3CHO CH3CO CO, instead of the more traditional HCO + M H + CO + M (R7). The latter one still relies on the reaction (R7) with the sequence CH3OCO CH3O CH2O HCO CO along with a direct CO formation from CH3OCO CH3O + CO (R22). Finally, more validation targets obtained with laser absorption experiments will further improve the insight on the fire hazard from LIBs.

Supplementary Materials

The following supporting information can be downloaded at: https://www.mdpi.com/article/10.3390/batteries11080303/s1, Figure S1: CO time-history profile for DEC in 99.75% He/Ar at 1219 K, 5.53 atm.; Figure S2: CO time-history profile for DEC in 99.75% He/Ar at 1335 K, 6.06 atm.; Figure S3: CO time-history profile for DEC in 99.75% He/Ar at 1354 K, 5.52 atm.; Figure S4: CO time-history profile for DEC in 99.75% He/Ar at 1386 K, 5.38 atm.; Figure S5: CO time-history profile for DEC in 99.75% He/Ar at 1459 K, 5.06 atm.; Figure S6: CO time-history profile for EMC in 99.75% He/Ar at 1326 K, 5.44 atm., Figure S7: CO time-history profile for EMC in 99.75% He/Ar at 1336 K, 5.85 atm.; Figure S8: CO time-history profile for EMC in 99.75% He/Ar at 1469 K, 6.02 atm.; Figure S9: CO time-history profile for EMC in 99.75% He/Ar at 1491 K, 5.57 atm.; Figure S10: CO time-history profile for EMC in 99.75% He/Ar at 1541 K, 5.44 atm.; Figure S11: CO time-history profile for EMC in 99.75% He/Ar at 1602 K, 5.35 atm.; Figure S12: CO time-history profile for EMC in 99.75% He/Ar at 1656 K, 5.14 atm.; Figure S13: Effect of pressure on the pyrolysis of DEC in 99.75% He/Ar using CO time histories from this study near 5.5 atm and measurements in similar conditions from Grégoire et al. (1) obtained near 1.3 atm. Results are near (a) 1226 ± 7 K and (b) 1325 ± 15 K, and 1474 ± 16 K.; Figure S14: Effect of pressure on the pyrolysis of EMC in 99.75% He/Ar using CO time histories from this study near 5.5 atm and measurements in similar conditions from Grégoire et al. (1) obtained near 1.3 atm. Results are near (a) 1541 K and (b) 1601 ± 1 K, and 1660 ± 4 K.; Figure S15: Predictions of CO for the pyrolysis of DEC and EMC in 99.75% He/Ar at 1600 K, 1.3-5.5 atm using the Luo et al. model (2). A higher pressure leads to the increase of reactivity for the electrolytes and larger CO concentrations at the plateau.; Figure S16: CO sensitivity (a) and rate-of-production (b) analyses for the pyrolysis of DEC in 99.75% He/Ar at 1380 K, 5.5 atm using two different mechanisms (2,3).; Figure S17: CO sensitivity analyses for the pyrolysis of EMC (CCOC*OOC in the model) in 99.75% He/Ar, 5.5 atm at 1490 K using two different mechanisms (2,3). DEC EMC Pyrolysis data.

Author Contributions

Data curation, C.M.G.; Writing—original draft, C.M.G.; Writing—review & editing, E.L.P. and O.M.; Supervision, E.L.P.; Funding acquisition, O.M. All authors have read and agreed to the published version of the manuscript.

Funding

The authors would like to thank the National Science Foundation for the financial support of this study (award # 2037795). Additional support came from the TEES Turbomachinery Laboratory.

Data Availability Statement

The original contributions presented in the study are included in the article, further inquiries can be directed to the corresponding author.

Conflicts of Interest

The authors declare no conflict of interest.

References

  1. Altenburg, T.; Corrocher, N.; Malerba, F. China’s leapfrogging in electromobility. A story of green transformation driving catch-up and competitive advantage. Technol. Forecast. Soc. Change 2022, 183, 121914. [Google Scholar] [CrossRef]
  2. Haghani, M.; Sprei, F.; Kazemzadeh, K.; Shahhoseini, Z.; Aghaei, J. Trends in electric vehicles research. Transp. Res. Part D Transp. Environ. 2023, 123, 103881. [Google Scholar] [CrossRef]
  3. Goodenough, J.B.; Park, K.-S. The Li-Ion Rechargeable Battery: A Perspective. J. Am. Chem. Soc. 2013, 135, 1167–1176. [Google Scholar] [CrossRef] [PubMed]
  4. Roth, E.P.; Orendorff, C.J. How Electrolytes Influence Battery Safety. Electrochem. Soc. Interface 2012, 21, 45. [Google Scholar] [CrossRef]
  5. Mejame, P.P.M.; Jung, D.-Y.; Lee, H.; Lee, D.S.; Lim, S.-R. Effect of technological developments for smartphone lithium battery on metal-derived resource depletion and toxicity potentials. Resour. Conserv. Recycl. 2020, 158, 104797. [Google Scholar] [CrossRef]
  6. Mathieu, O.; Grégoire, C.M.; Turner, M.A.; Mohr, D.J.; Alturaifi, S.A.; Thomas, J.C.; Petersen, E.L. Experimental Investigation of the Combustion Properties of an Average Thermal Runaway Gas Mixture from Li-Ion Batteries. Energy Fuels 2022, 36, 3247–3258. [Google Scholar] [CrossRef]
  7. Yang, Y.; Wang, R.; Shen, Z.; Yu, Q.; Xiong, R.; Shen, W. Towards a safer lithium-ion batteries: A critical review on cause, characteristics, warning and disposal strategy for thermal runaway. Adv. Appl. Energy 2023, 11, 100146. [Google Scholar] [CrossRef]
  8. Terazono, A.; Oguchi, M.; Akiyama, H.; Tomozawa, H.; Hagiwara, T.; Nakayama, J. Ignition and fire-related incidents caused by lithium-ion batteries in waste treatment facilities in Japan and countermeasures. Resour. Conserv. Recycl. 2024, 202, 107398. [Google Scholar] [CrossRef]
  9. Grégoire, C.; Cooper, S.; Khan-Ghauri, M.; Alturaifi, S.; Petersen, E.; Mathieu, O. Pyrolysis Study of Dimethyl Carbonate, Diethyl Carbonate, and Ethyl Methyl Carbonate using Shock-Tube Spectroscopic CO Measurements and Chemical Kinetics Investigation. Combust. Flame 2023, 249, 112594. [Google Scholar] [CrossRef]
  10. Nakamura, H.; Curran, H.J.; Polo Córdoba, A.; Pitz, W.J.; Dagaut, P.; Togbé, C.; Sarathy, S.M.; Mehl, M.; Agudelo, J.R.; Bustamante, F. An experimental and modeling study of diethyl carbonate oxidation. Combust. Flame 2015, 162, 1395–1405. [Google Scholar] [CrossRef]
  11. Shahla, R.; Togbé, C.; Thion, S.; Timothée, R.; Lailliau, M.; Halter, F.; Chauveau, C.; Dayma, G.; Dagaut, P. Burning velocities and jet-stirred reactor oxidation of diethyl carbonate. Proc. Combust. Inst. 2017, 36, 553–560. [Google Scholar] [CrossRef]
  12. Sela, P.; Zhang, Y.; Herzler, J.; Fikri, M.; Schulz, C.; Peukert, S. Pyrolysis of diethyl carbonate: Shock-tube and flow-reactor measurements and modeling. Proc. Combust. Inst. 2021, 38, 987–996. [Google Scholar] [CrossRef]
  13. Sun, W.; Huang, C.; Tao, T.; Zhang, F.; Li, W.; Hansen, N.; Yang, B. Exploring the high-temperature kinetics of diethyl carbonate (DEC) under pyrolysis and flame conditions. Combust. Flame 2017, 181, 71–81. [Google Scholar] [CrossRef]
  14. Kanayama, K.; Takahashi, S.; Morikura, S.; Nakamura, H.; Tezuka, T.; Maruta, K. Study on oxidation and pyrolysis of carbonate esters using a micro flow reactor with a controlled temperature profile. Part I: Reactivities of dimethyl carbonate, ethyl methyl carbonate and diethyl carbonate. Combust. Flame 2022, 237, 111810. [Google Scholar] [CrossRef]
  15. Takahashi, S.; Kanayama, K.; Morikura, S.; Nakamura, H.; Tezuka, T.; Maruta, K. Study on oxidation and pyrolysis of carbonate esters using a micro flow reactor with a controlled temperature profile. Part II: Chemical kinetic modeling of ethyl methyl carbonate. Combust. Flame 2022, 238, 111878. [Google Scholar] [CrossRef]
  16. Yu, R.; Liu, J.; Wu, Y.; Tang, C. Experimental and modeling study on ignition kinetics of ethyl methyl carbonate. Combust. Flame 2024, 261, 113318. [Google Scholar] [CrossRef]
  17. Feng, G.; Yang, Q.; Liu, Z.; Jiang, Z.; Zhao, C.; Wang, K.; Fuentes, A.; Chen, D.; He, X. Study of combustion characteristics of linear carbonates (DMC/DEC/EMC) and cyclic carbonate (EC): Laminar burning velocity and chemical reaction kinetics modeling. Fuel 2024, 363, 130881. [Google Scholar] [CrossRef]
  18. Zhang, S.; Zheng, L.; Wang, J.; Shao, X.; Wang, X.; Luo, Q.; Li, Y.; Tang, S. Laminar Combustion Characteristics of Spherically Propagating Ethyl Methyl Carbonate Flames. Energ. Fuels 2024, 38, 10156–10167. [Google Scholar] [CrossRef]
  19. Zhang, S.; Zheng, L.; Wang, X.; Tang, S.; Li, Y.; Xu, M.; Luo, Q. Investigation on the intrinsic instabilities of ethyl methyl carbonate flames. Fuel 2024, 367, 131526. [Google Scholar] [CrossRef]
  20. Luo, Q.; Zheng, L.; Wang, J.; Jia, H.; Wang, X.; Zhang, S.; Wang, D.; Lu, J. Investigation of chemical kinetic models for electrolyte solvent vapors released from thermal runaway lithium-ion batteries. J. Energy Storage 2025, 107, 114932. [Google Scholar] [CrossRef]
  21. Hu, E.; Chen, Y.; Zhang, Z.; Pan, L.; Li, Q.; Cheng, Y.; Huang, Z. Experimental and kinetic study on ignition delay times of dimethyl carbonate at high temperature. Fuel 2015, 140, 626–632. [Google Scholar] [CrossRef]
  22. Alexandrino, K.; Alzueta, M.U.; Curran, H.J. An experimental and modeling study of the ignition of dimethyl carbonate in shock tubes and rapid compression machine. Combust. Flame 2018, 188, 212–226. [Google Scholar] [CrossRef]
  23. Sun, W.; Yang, B.; Hansen, N.; Westbrook, C.K.; Zhang, F.; Wang, G.; Moshammer, K.; Law, C.K. An experimental and kinetic modeling study on dimethyl carbonate (DMC) pyrolysis and combustion. Combust. Flame 2016, 164, 224–238. [Google Scholar] [CrossRef]
  24. Peukert, S.L.; Sivaramakrishnan, R.; Michael, J.V. High Temperature Shock Tube and Theoretical Studies on the Thermal Decomposition of Dimethyl Carbonate and Its Bimolecular Reactions with H and D-Atoms. J. Phys. Chem. A 2013, 117, 3718–3728. [Google Scholar] [CrossRef] [PubMed]
  25. Cooper, S.P.; Grégoire, C.M.; Mohr, D.J.; Mathieu, O.; Alturaifi, S.A.; Petersen, E.L. An Experimental Kinetics Study of Isopropanol Pyrolysis and Oxidation behind Reflected Shock Waves. Energies 2021, 14, 6808. [Google Scholar] [CrossRef]
  26. Petersen, E.L.; Rickard, M.J.A.; Crofton, M.W.; Abbey, E.D.; Traum, M.J.; Kalitan, D.M. A facility for gas- and condensed-phase measurements behind shock waves. Meas. Sci. Technol. 2005, 16, 1716. [Google Scholar] [CrossRef]
  27. Lipkowicz, J.T.; Nativel, D.; Cooper, S.; Wlokas, I.; Fikri, M.; Petersen, E.; Schulz, C.; Kempf, A.M. Numerical Investigation of Remote Ignition in Shock Tubes. Flow Turbul. Combust. 2021, 106, 471–498. [Google Scholar] [CrossRef]
  28. Spearrin, R.M.; Goldenstein, C.S.; Jeffries, J.B.; Hanson, R.K. Quantum cascade laser absorption sensor for carbon monoxide in high-pressure gases using wavelength modulation spectroscopy. Appl. Opt. 2014, 53, 1938–1946. [Google Scholar] [CrossRef]
  29. Grégoire, C.M.; Mathieu, O.; Petersen, E.L. High-Temperature Line Strengths with He- and Ar-Broadening Coefficients of the P(20) line in the 1 ← 0 band of Carbon Monoxide. Appl. Phys. B 2023, 129, 187. [Google Scholar] [CrossRef]
  30. Hanson, R.K.; Spearrin, R.M.; Goldenstein, C.S. Spectroscopy and Optical Diagnostics for Gases. In Spectroscopy and Optical Diagnostics for Gases; Springer: Cham, Switzerland, 2016. [Google Scholar]
  31. Rothman, L.S.; Gordon, I.E.; Barber, R.J.; Dothe, H.; Gamache, R.R.; Goldman, A.; Perevalov, V.I.; Tashkun, S.A.; Tennyson, J. HITEMP, the high-temperature molecular spectroscopic database. J. Quant. Spectrosc. Radiat. Transf. 2010, 111, 2139–2150. [Google Scholar] [CrossRef]
  32. Liu, Y.; Lin, J.; Huang, G.; Guo, Y.; Duan, C. Simple empirical analytical approximation to the Voigt profile. J. Opt. Soc. Am. B 2001, 18, 666–672. [Google Scholar] [CrossRef]
  33. Mulvihill, C.R. H2O Laser Absorption and OH* Chemiluminescence Measurements of H2-NO2 Oxidation in a Shock Tube. Ph.D. Thesis, Mechanical Engineering, Texas A&M University, College Station, TX, USA, 2019. [Google Scholar]
  34. Cooper, S.P.; Grégoire, C.M.; Almarzooq, Y.M.; Petersen, E.L.; Mathieu, O. Experimental Kinetics Study on Diethyl Carbonate Oxidation. Fuel 2023, 4, 243–260. [Google Scholar] [CrossRef]
  35. Grégoire, C.; Almarzooq, Y.M.; Petersen, E.; Mathieu, O. Experimental and Modeling Study of the Combustion of Ethyl Methyl Carbonate, a Battery Electrolyte. Combust. Flame 2024, 260, 113225. [Google Scholar] [CrossRef]
  36. Khan-Ghauri, M.; Grégoire, C.M.; Kanayama, K.; Diévart, P.; Takahashi, S.; Tezuka, T.; Almarzooq, Y.M.; Nakamura, H.; Catoire, L.; Maruta, K.; et al. Experimental and Detailed Kinetics Modeling Study of Bis(2,2,2-trifluoroethyl) Carbonate, a Fire Suppressant for Lithium-Ion Battery. Energ. Fuels 2025, 39, 4893–4908. [Google Scholar] [CrossRef]
  37. Grégoire, C.M.; Almarzooq, Y.M.; Khan-Ghauri, M.; Diévart, P.; Catoire, L.; Petersen, E.L.; Mathieu, O. Enhancing lithium-ion battery safety: Investigating the flame-retardant efficacy of bis(2,2,2-trifluoroethyl) carbonate during ethyl methyl carbonate combustion. Proc. Combust. Inst. 2024, 40, 105559. [Google Scholar] [CrossRef]
Figure 1. Chemical structure for (a) diethyl carbonate (DEC) and (b) ethyl methyl carbonate (EMC).
Batteries 11 00303 g001
Figure 2. Illustration of (a) CO time-history profile of EMC pyrolysis in 99.75% He/Ar at 1541 K and 5.44 atm along with (b) experimental pressure profile.
Batteries 11 00303 g002
Figure 3. Complete set of CO time-history profiles obtained for the pyrolysis of DEC in 99.75% He/Ar at temperatures and pressures ranging from 1219 to 1459 K and 6.06 to 5.06 atm, respectively.
Batteries 11 00303 g003
Figure 4. Representative CO time-history profiles obtained for the pyrolysis of DEC in 99.75% He/Ar at (a) 1459 K, 5.06 atm, (b) 1386 K, 5.28 atm, and (c) 1335 K, 6.06 atm. Comparisons are performed with models from the literature, namely Nakamura et al. [10], Shahla et al. [11], Sun et al. [13], Sela et al. [12], Takahashi et al. [15], Grégoire et al. [9], Feng et al. [17], Yu et al. [16], Khan-Ghauri et al. [36], and Luo et al. [20].
Batteries 11 00303 g004
Figure 5. Complete set of CO time-history profiles obtained for the pyrolysis of EMC in 99.75% He/Ar at temperatures and pressures ranging from 1326 to 1656 K and 6.02 to 5.14 atm, respectively.
Batteries 11 00303 g005
Figure 6. CO time histories for the pyrolysis of DEC and EMC in 99.75% He/Ar. Comparison between EMC and DEC measured at the same temperature, 1464 ± 5 K, and near 5.5 atm.
Batteries 11 00303 g006
Figure 7. Representative CO time-history profiles obtained for the pyrolysis of EMC in 99.75% He/Ar at (a) 1602 K, 5.35 atm, (b) 1541 K, 5.44 atm, and (c) 1469 K, 6.02 atm. Comparisons are performed with models from the literature, namely Takahashi et al. [15], Grégoire et al. [9], Feng et al. [17], Yu et al. [16], Khan-Ghauri et al. [36], and Luo et al. [20].
Batteries 11 00303 g007
Figure 8. Effect of pressure on the pyrolysis of DEC and EMC in 99.75% He/Ar using CO time histories (solid lines) from this study near 5.5 atm and measurements at similar conditions from Grégoire et al. [9] obtained near 1.3 atm. Shown are (a) DEC results near 1380 K, and (b) EMC results near 1490 K. Results are compared with the Luo et al. mechanism [20] (dashed lines).
Batteries 11 00303 g008
Figure 9. CO sensitivity analysis on the effect of pressure for the pyrolysis of DEC in 99.75% He/Ar at 1450 K using two pressures, namely 1.3 and 5.5 atm. Note that the sensitive reactions are separated into two figures for clarity in (a,b). Numerical predictions were performed using the Luo et al. [20] mechanism.
Batteries 11 00303 g009
Figure 10. CO rate-of-production analysis showing the effect of pressure for the pyrolysis of DEC in 99.75% He/Ar at 1450 K using two pressures, namely 1.3 and 5.5 atm. Numerical predictions were performed using the Luo et al. [20] mechanism.
Batteries 11 00303 g010
Figure 11. CO sensitivity analyses on the effect of pressure for the pyrolysis of EMC (CCOC*OOC in the model) in 99.75% He/Ar at 1450 K using two pressures, namely 1.3 and 5.5 atm. Note that the sensitive reactions are separated in three figures for clarity in (ac). Numerical predictions were performed using the Luo et al. [20] mechanism.
Batteries 11 00303 g011
Figure 12. CO rate of production analysis on the effect of pressure for the pyrolysis of EMC (CCOC*OOC in the model) in 99.75% He/Ar at 1450 K using two pressures, namely 1.3 and 5.5 atm. Numerical predictions were performed using the Luo et al. [20] mechanism.
Batteries 11 00303 g012
Table 1. Mixture compositions and experimental conditions covered during this study.
X D E C X E M C X H e X A r T5 (K)P5 (atm)
0.002500.20.79751219–14595.06–6.06
00.00250.20.79751326–16565.14–6.02
Disclaimer/Publisher’s Note: The statements, opinions and data contained in all publications are solely those of the individual author(s) and contributor(s) and not of MDPI and/or the editor(s). MDPI and/or the editor(s) disclaim responsibility for any injury to people or property resulting from any ideas, methods, instructions or products referred to in the content.