Article

PyBEP: An Open-Source Tool for Electrode Potential Determination from Battery OCV Measurements

Faculty of Mechanical Engineering, University of Ljubljana, Aškerčeva 6, SI-1000 Ljubljana, Slovenia
*
Author to whom correspondence should be addressed.
Batteries 2025, 11(8), 295; https://doi.org/10.3390/batteries11080295
Submission received: 22 May 2025 / Revised: 10 July 2025 / Accepted: 29 July 2025 / Published: 4 August 2025
(This article belongs to the Section Battery Modelling, Simulation, Management and Application)

Abstract

This paper introduces PyBEP, a Python-based tool for the automated and optimized selection of open-circuit potential (OCP) curves and calculation of stoichiometric cycling ranges for lithium-ion battery electrodes based on open-circuit voltage (OCV) measurements. Thereby, it overcomes key challenges in traditional approaches, which are often time-intensive and susceptible to errors due to manual curve digitization, data inconsistency, and coding complexities. The originality of PyBEP arises from the systematic integration of automated electrode chemistry identification, quality-controlled database usage, refinement of the results using incremental capacity methodology, and simultaneous optimization of multiple electrode parameters. The PyBEP database leverages high-quality, curated OCP data and employs differential evolution optimization for precise OCP determination. Validation against literature data and experimental results confirms the robustness and accuracy of PyBEP, consistently achieving precision of 10 mV or better. PyBEP also offers features like electrode chemical composition identification and quality enhancement of measurement data, further extending the battery modeling functionalities without the need for battery disassembly. PyBEP is open-source and accessible on GitHub, providing a streamlined, accurate resource for the battery research community, making PyBEP a unique and directly applicable toolkit for electrochemical researchers and engineers.

Graphical Abstract

1. Introduction

Lithium-ion batteries (LIBs) are one of the key technologies for green transportation, the green energy sector and industrial applications. Because of this, LIBs are the subject of extensive research, with the aim being to improve their energy density, power density, and battery lifetime, as well as safety.
One of the very important aspects of LIB research involves modeling at various levels. Fundamental mechanisms of chemical energy storage are explored using first-principle and molecular dynamics models on an atomistic scale [1,2]. On a higher scale, continuum models play a key role in virtual prototyping and design space exploration when developing battery cells for specific applications, e.g., [3,4,5]. System-level continuum models are also employed for predicting and controlling battery cells during operation, e.g., [6,7,8], or for analyzing and deciphering EIS spectra, e.g., [9].
Despite the distinct nature of these model families, they share a common prerequisite: the accuracy and predictive capability of models critically depends on the quality of model input parameters. Therefore, the precise determination of input parameters of the model significantly influences the suitability and applicability of the model.
This paper focuses on the determination of arguably one of the most crucial parameters, especially in higher-scale models—open-circuit potential (OCP) of the electrode. The fundamental physico-chemical significance of the OCP makes this parameter indispensable for many types of models, ranging from basic nanoscopic simulations to battery pack system-level simulations.
To successfully parameterize such battery models, it is essential to determine OCP characteristics of both electrodes, which comprise the following:
  • The functional dependence of OCPs as the function of the amount of intercalated lithium for both electrode materials (hereafter referred to as OCP curves).
  • The stoichiometric ranges of lithium within which both electrodes are cycled (hereafter referred to as stoichiometry ranges).
In this context, stoichiometry represents the amount of lithium intercalated in the electrode, expressed as a molar fraction (e.g., x in LixC6 for the lithiated graphite anode or x in LixNi3/4Mn1/8Co1/8O2 for the NMC cathode). The stoichiometry range corresponds to the range of lithium content over which the battery is cycled during operation, defined by the upper and lower cut-off voltages.
The precise experimental determination of both, i.e., OCP curves and stoichiometry ranges, is usually quite complex, requiring battery disassembly [10]. When a complex, time-consuming and expensive procedure of cell disassembly is not an option, it is possible to estimate OCPs of both electrodes from the measurement of the battery’s open-circuit voltage (OCV) as a function of the state of charge (SOC). This procedure requires knowing the availability of accurate OCP curve data, which are available in the literature for widely used material, e.g., [11,12], and adequate numerical methods.
One such method for decomposing battery OCV into the OCPs of both electrodes, including the determination of the corresponding stoichiometry ranges, is presented in [13]. The method relies on the availability of accurate OCP data. Although the approach of determining OCP curves and stoichiometry ranges using measured OCP data and a numerical method is less complex and requires less effort compared to the rigorous experimental determination of OCPs, it remains time-consuming and, in many cases, insufficiently precise for the intended application, as well as being prone to several challenges. One of the challenges, when utilizing method proposed in reference [13], is the selection of adequate OCP curves. Chemical composition of the electrodes is often unknown to the battery user; hence, selection of adequate OCP curves might result in a lengthy trial-and-error process prone to errors. Additionally, the quality of literature data on OCP curves is often not adequate for detailed numerical analyses, which can undermine the effectiveness of the methods described in [13]. Frequently, the datasets are derived by manual digitization of OCP curves from images, necessitating quality enhancement through post-processing interpolation. If not done carefully, this can introduce physico-chemical inconsistencies into the data. Moreover, the process of coding the optimization algorithm itself is complex and time-consuming as well. It, therefore, turns out that listed challenges can lead to errors, which accumulate and ultimately compromise the accuracy of the determined OCP curves and stoichiometric ranges, making them unreliable and potentially also misleading. These challenges can be overcome by automatizing and optimizing the entire procedure, which significantly reduces efforts of a user along with potential user-induced errors.
In this context, we introduce PyBEP, an open-source Python-based tool that innovatively addresses these challenges by automating the full workflow of OCP curve selection and stoichiometric range determination from simple battery OCV measurements.
A variety of open-source software tools exist for modeling, simulating, and analyzing lithium-ion battery behavior. Among the most widely recognized is PyBaMM [14], which provides a flexible framework for solving physics-based battery models such as the Doyle–Fuller–Newman (DFN), Single-Particle Model (SPM), and their variants. Tools like battsimpy [15] offer implementations of these models with a focus on modularity or high-resolution numerical schemes. Equivalent circuit-based modeling is enabled by packages such as PyECN [16], while specialized methods for electrochemical impedance analysis are implemented in extensions like PyBaMM-EIS [17]. On the data-driven side, machine learning-based approaches such as PINN4SOH [18] and MambaLithium [19] have emerged for state estimation and health diagnostics. Complementary to Python-based tools, the Julia ecosystem also features high-performance libraries, including PETLION.jl [20] and JuBat [21] for P2D modeling and LiiBRA.jl [22] for reduced-order modeling.
Several tools specifically address model parameterisation, such as PyBOP [23], which facilitates the estimation of full parameter sets for DFN, SPM, or equivalent circuit models. However, PyBOP does not include functionality for deriving electrode open-circuit potentials (OCPs), which remain essential for accurate parametrization. Similarly, the LiionDB [24] database provides curated OCP curves for various electrode materials, but it does not guide users in selecting the optimal combination of OCPs for a given battery cell—a decision that can significantly impact model fidelity. The software presented in this work—PyBEP—targets this critical gap. It enables the automated and accurate extraction of electrode OCPs and stoichiometric ranges from OCV measurements, thereby complementing both PyBOP and simulation frameworks. As such, PyBEP does not replicate existing simulation or parameterisation capabilities but instead enhances them by providing a robust and automated mechanism for selecting appropriate electrode curves, which are indispensable inputs for models built using tools like PyBaMM, PETLION.jl, or any other DFN-, SPM-, or P2D-based approach.
In addition to its compatibility with open-source modeling tools, PyBEP is also highly applicable in workflows involving commercial battery simulation and diagnostic platforms such as COMSOL Multiphysics [25], AVL CRUISE M [26], and ALAWA [27]. These tools often rely on accurate OCP inputs for defining material models, performing incremental capacity analysis, or tuning electrochemical diagnostics. PyBEP provides a streamlined and automated method to obtain these.
PyBEP combines simultaneous selection of OCP curves from a database and the determination of stoichiometry ranges. The database was created using data available from the literature on OCP curves and by applying tailored digitalisation methods to comply with quality criteria to adequately determine the OCP characteristics of both electrodes. Another important feature of the tool is its capability to automatically select most appropriate OCP curves from the database. The proposed approach, therefore, resolves multiple methodological challenges related to the unambiguous determination of OCP characteristics of both electrodes of the Li-ion battery solely from the battery OCV measurement, with no need to disassemble the battery or code complex optimization algorithms.
The digital tool we used for the automated selection of OCP curves and the calculation of stoichiometric ranges of both electrodes of a Li-ion battery from OCV measurements is named PyBEP, and it requires only measured data of battery OCV vs. battery SOC to perform the following steps:
  • Select appropriate OCP curves from the database corresponding to the chemical composition of both electrodes.
  • Calculate stoichiometric cycling ranges for both electrodes.
  • Calculate incremental capacity ( d Q d V , i.e., the inverse of the OCV derivative with respect to the charge) of both electrodes for refining results.
Moreover, it delivers OCP curves of both electrodes aligned with the measured SOC range of the battery with high precision and reliability.
While the underlying concepts of OCV decomposition are established, the originality of PyBEP lies in its systematic integration of automated electrode chemistry identification, quality-controlled database usage, refinement of the results using incremental capacity methodology, and simultaneous optimization of multiple electrode parameters. Validation against benchmarks and experimental measurements from the literature confirms the typical precision on the order of a few millivolts, making PyBEP a unique and directly applicable toolkit for electrochemical researchers and engineers. Beyond lithium-ion batteries, the modular structure and data-driven nature of PyBEP also offer promising applicability to other electrochemical energy storage systems, such as lithium-ion capacitors, which could benefit from automated OCP curve analysis and stoichiometric range determination.
Through this contribution, PyBEP enables researchers and engineers to perform high-accuracy analyses with significantly reduced experimental and computational efforts. The PyBEP (Python Battery Electrode Potential calculator) Python package is openly accessible on GitHub (https://github.com/JonPisek/PyBEP), together with a graphical user interface that simplifies the use of presented package.

2. Methods

The PyBEP package features two main pillars, which comprise the database and the numerical procedure for the automated selection of open-circuit potential curves and calculation of stoichiometric ranges. Each of these comprises several methodological steps, which are crucial for obtaining accurate battery electrode potentials. The flow of these methodological steps, which make automated and efficient execution of the PyBEP possible, is illustrated in Figure 1.
The following subsections describe the key steps outlined in Figure 1 in detail.

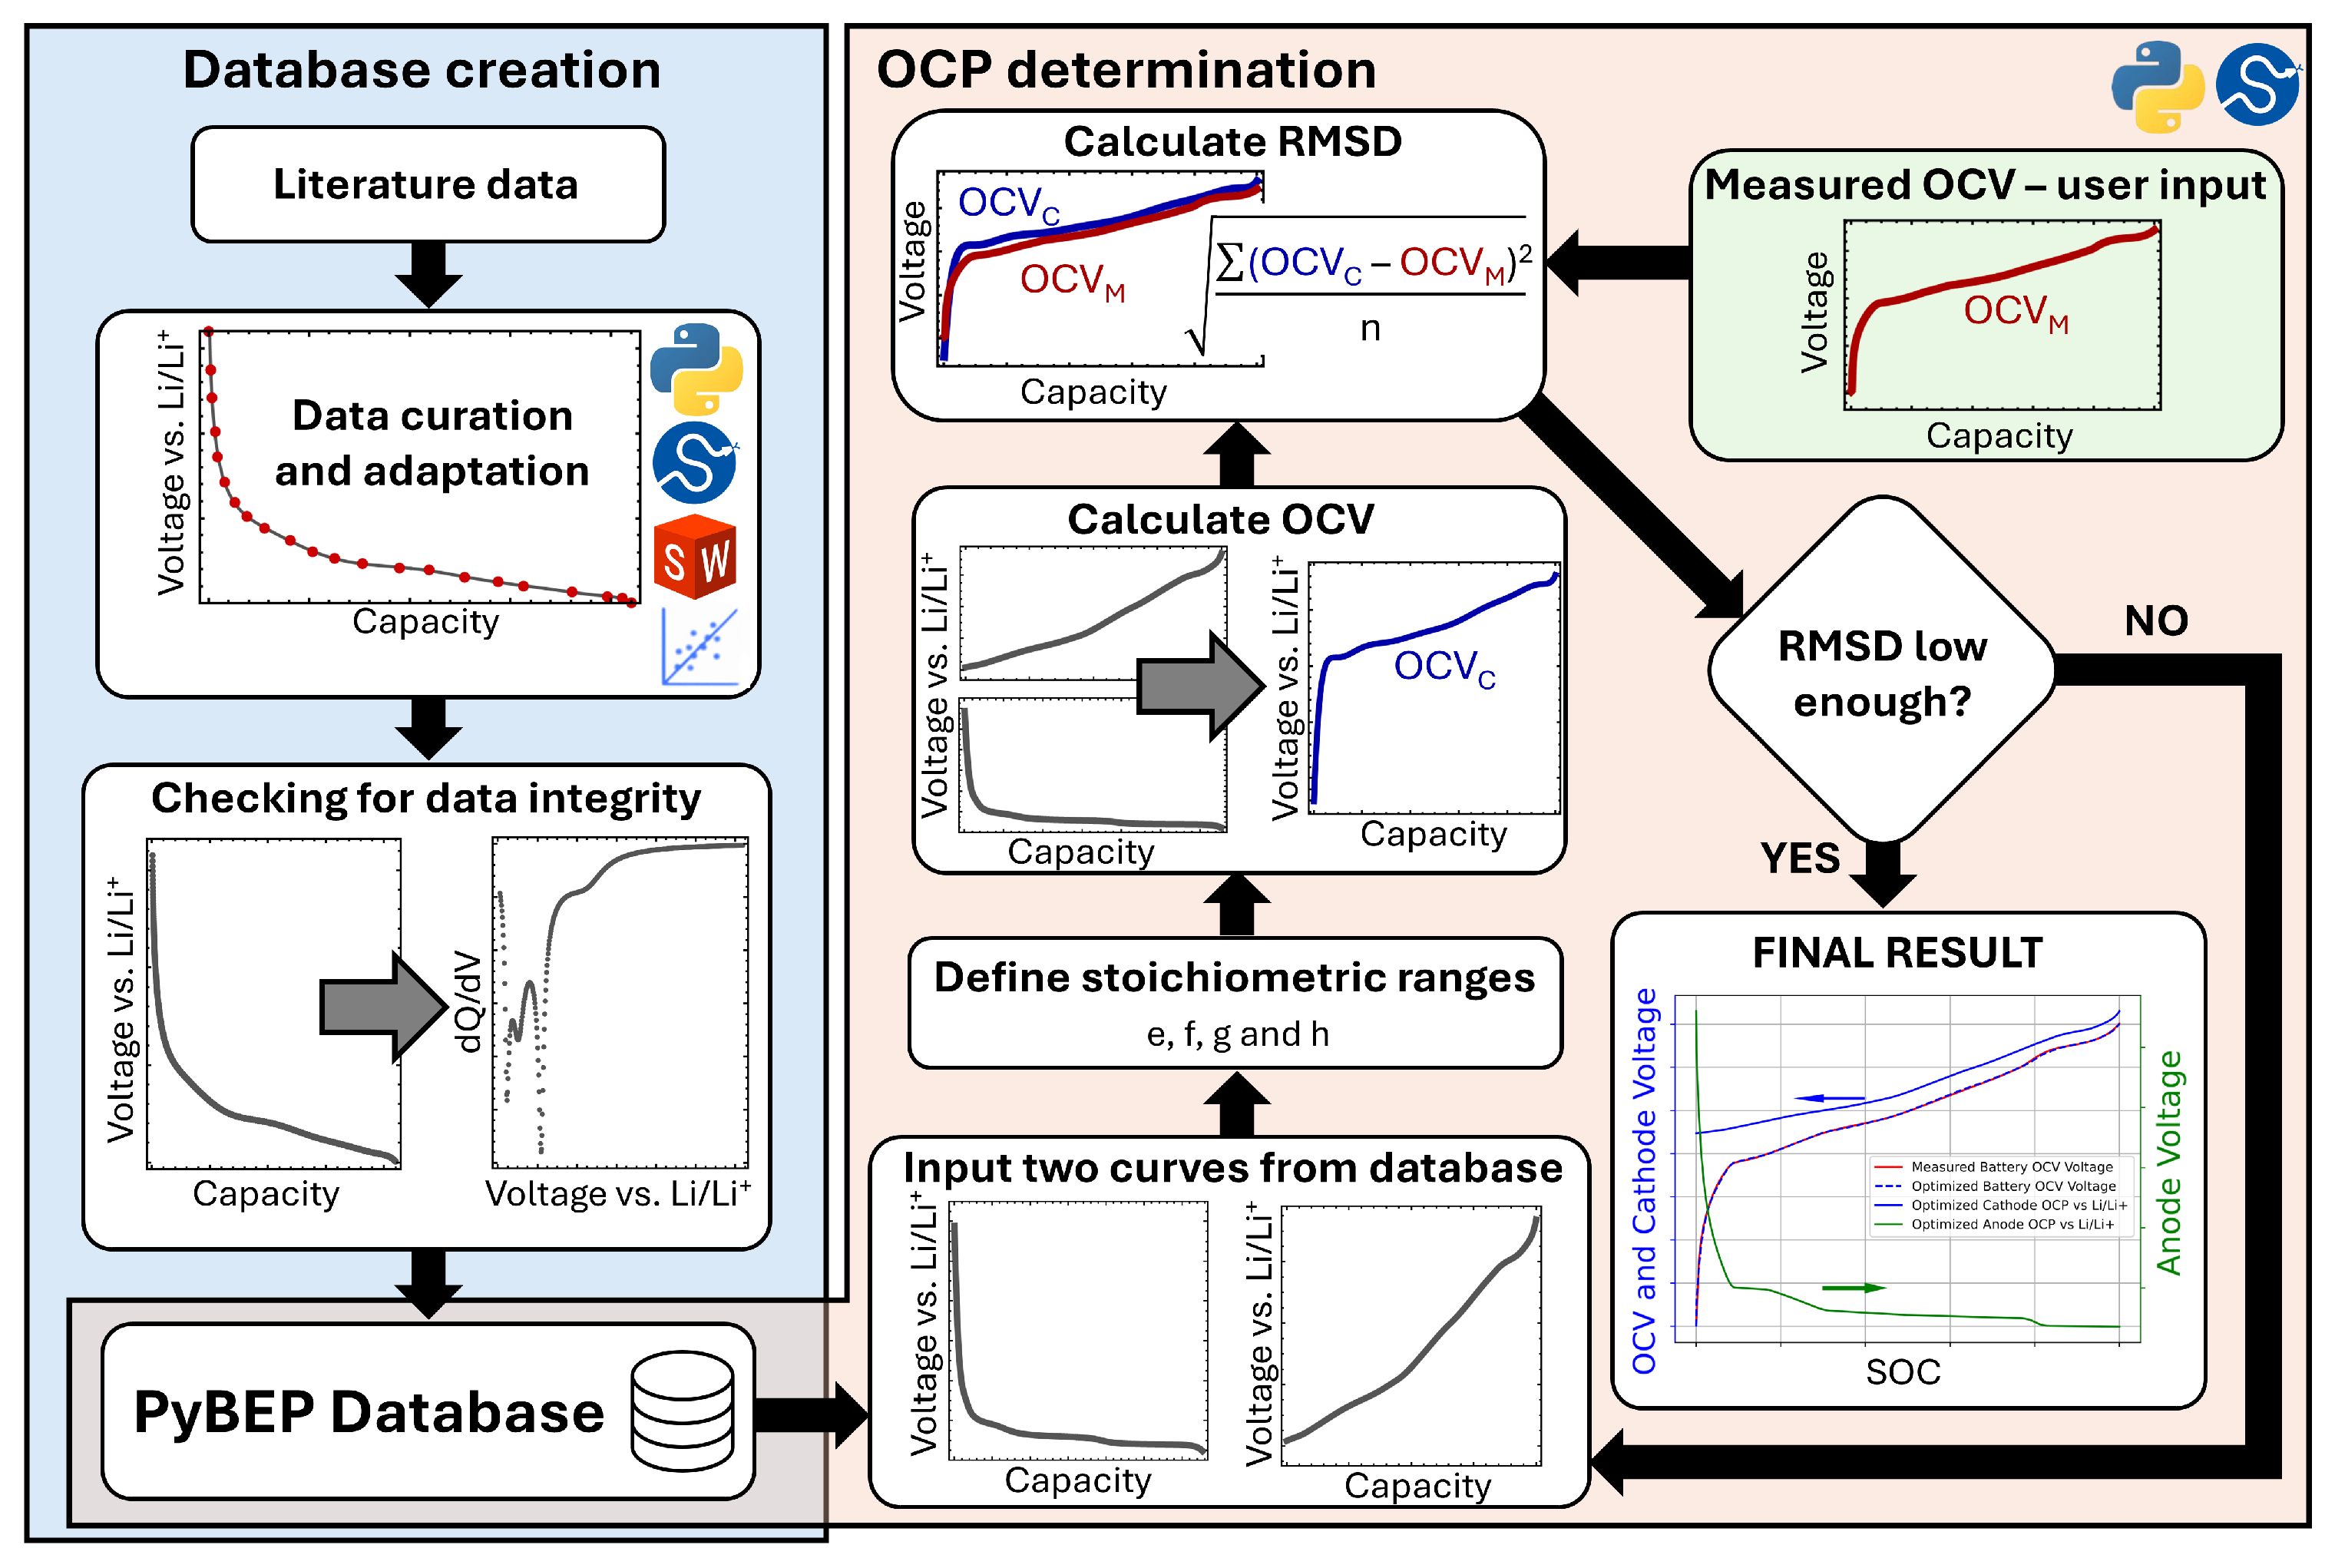
2.1. Database Creation

The effectiveness of the PyBEP tool depends on the availability of a robust database of OCP curves, requiring a large quantity of digitized electrode OCP data. These curves are essential for the optimization process. The database creation procedure is schematically represented on the left side of Figure 1, highlighted in blue. The individual steps involved in this process are described below.

2.1.1. Literature Data

Literature data were used to build the PyBEP database of OCP curves. The LiionDB database [28,29] served as guidance for the literature search; however, it was not feasible to use the LiionDB open-source database directly within PyBEP, as the quality of its data varies significantly. In the current version of PyBEP, OCP curves have been incorporated from the following references: [30,31,32,33,34,35].

2.1.2. Data Curation and Adaptation

All the data from the literature offering the most reliable OCP measurements were found without corresponding digital datasets. Therefore, data points had to be manually extracted from images using a process known as curve digitization. SolidWorks (2024 version) was used for this task, as it provided fine control over interpolation. In this process, the image was imported into a SolidWorks part file, and spline curves were manually traced over the original plot. Points were then added along the spline, and a new part file was created, containing only the sketch with these points. This part file was saved as an IGS file and subsequently converted into a text file (TXT) containing the x and y coordinates of each point.
The TXT file was then imported into Python (version 3.12.3), where a densely populated and highly accurate digitized curve was generated using the interp1d function from the scipy.interpolate library. This function was used for both interpolation and extrapolation. For anode OCPs, extrapolation was applied in the high-SOC direction, covering an additional 10% of the original SOC range. For cathode OCPs, extrapolation was applied in both directions (low and high SOC), each extending 10% beyond the original SOC range. This extrapolation was added to improve the stability of the optimization algorithm that determines stoichiometry limits, as described in Section 2.2.
The final output of this procedure was a series of TXT files, each containing two columns with 1000 entries. The first column represents the normalized lithiation level of the electrode material, and the second column outlines the corresponding electric potential vs. Li/Li+ at each lithiation level. Before these files—representing the OCP curves—were stored in the PyBEP database, their integrity was verified.

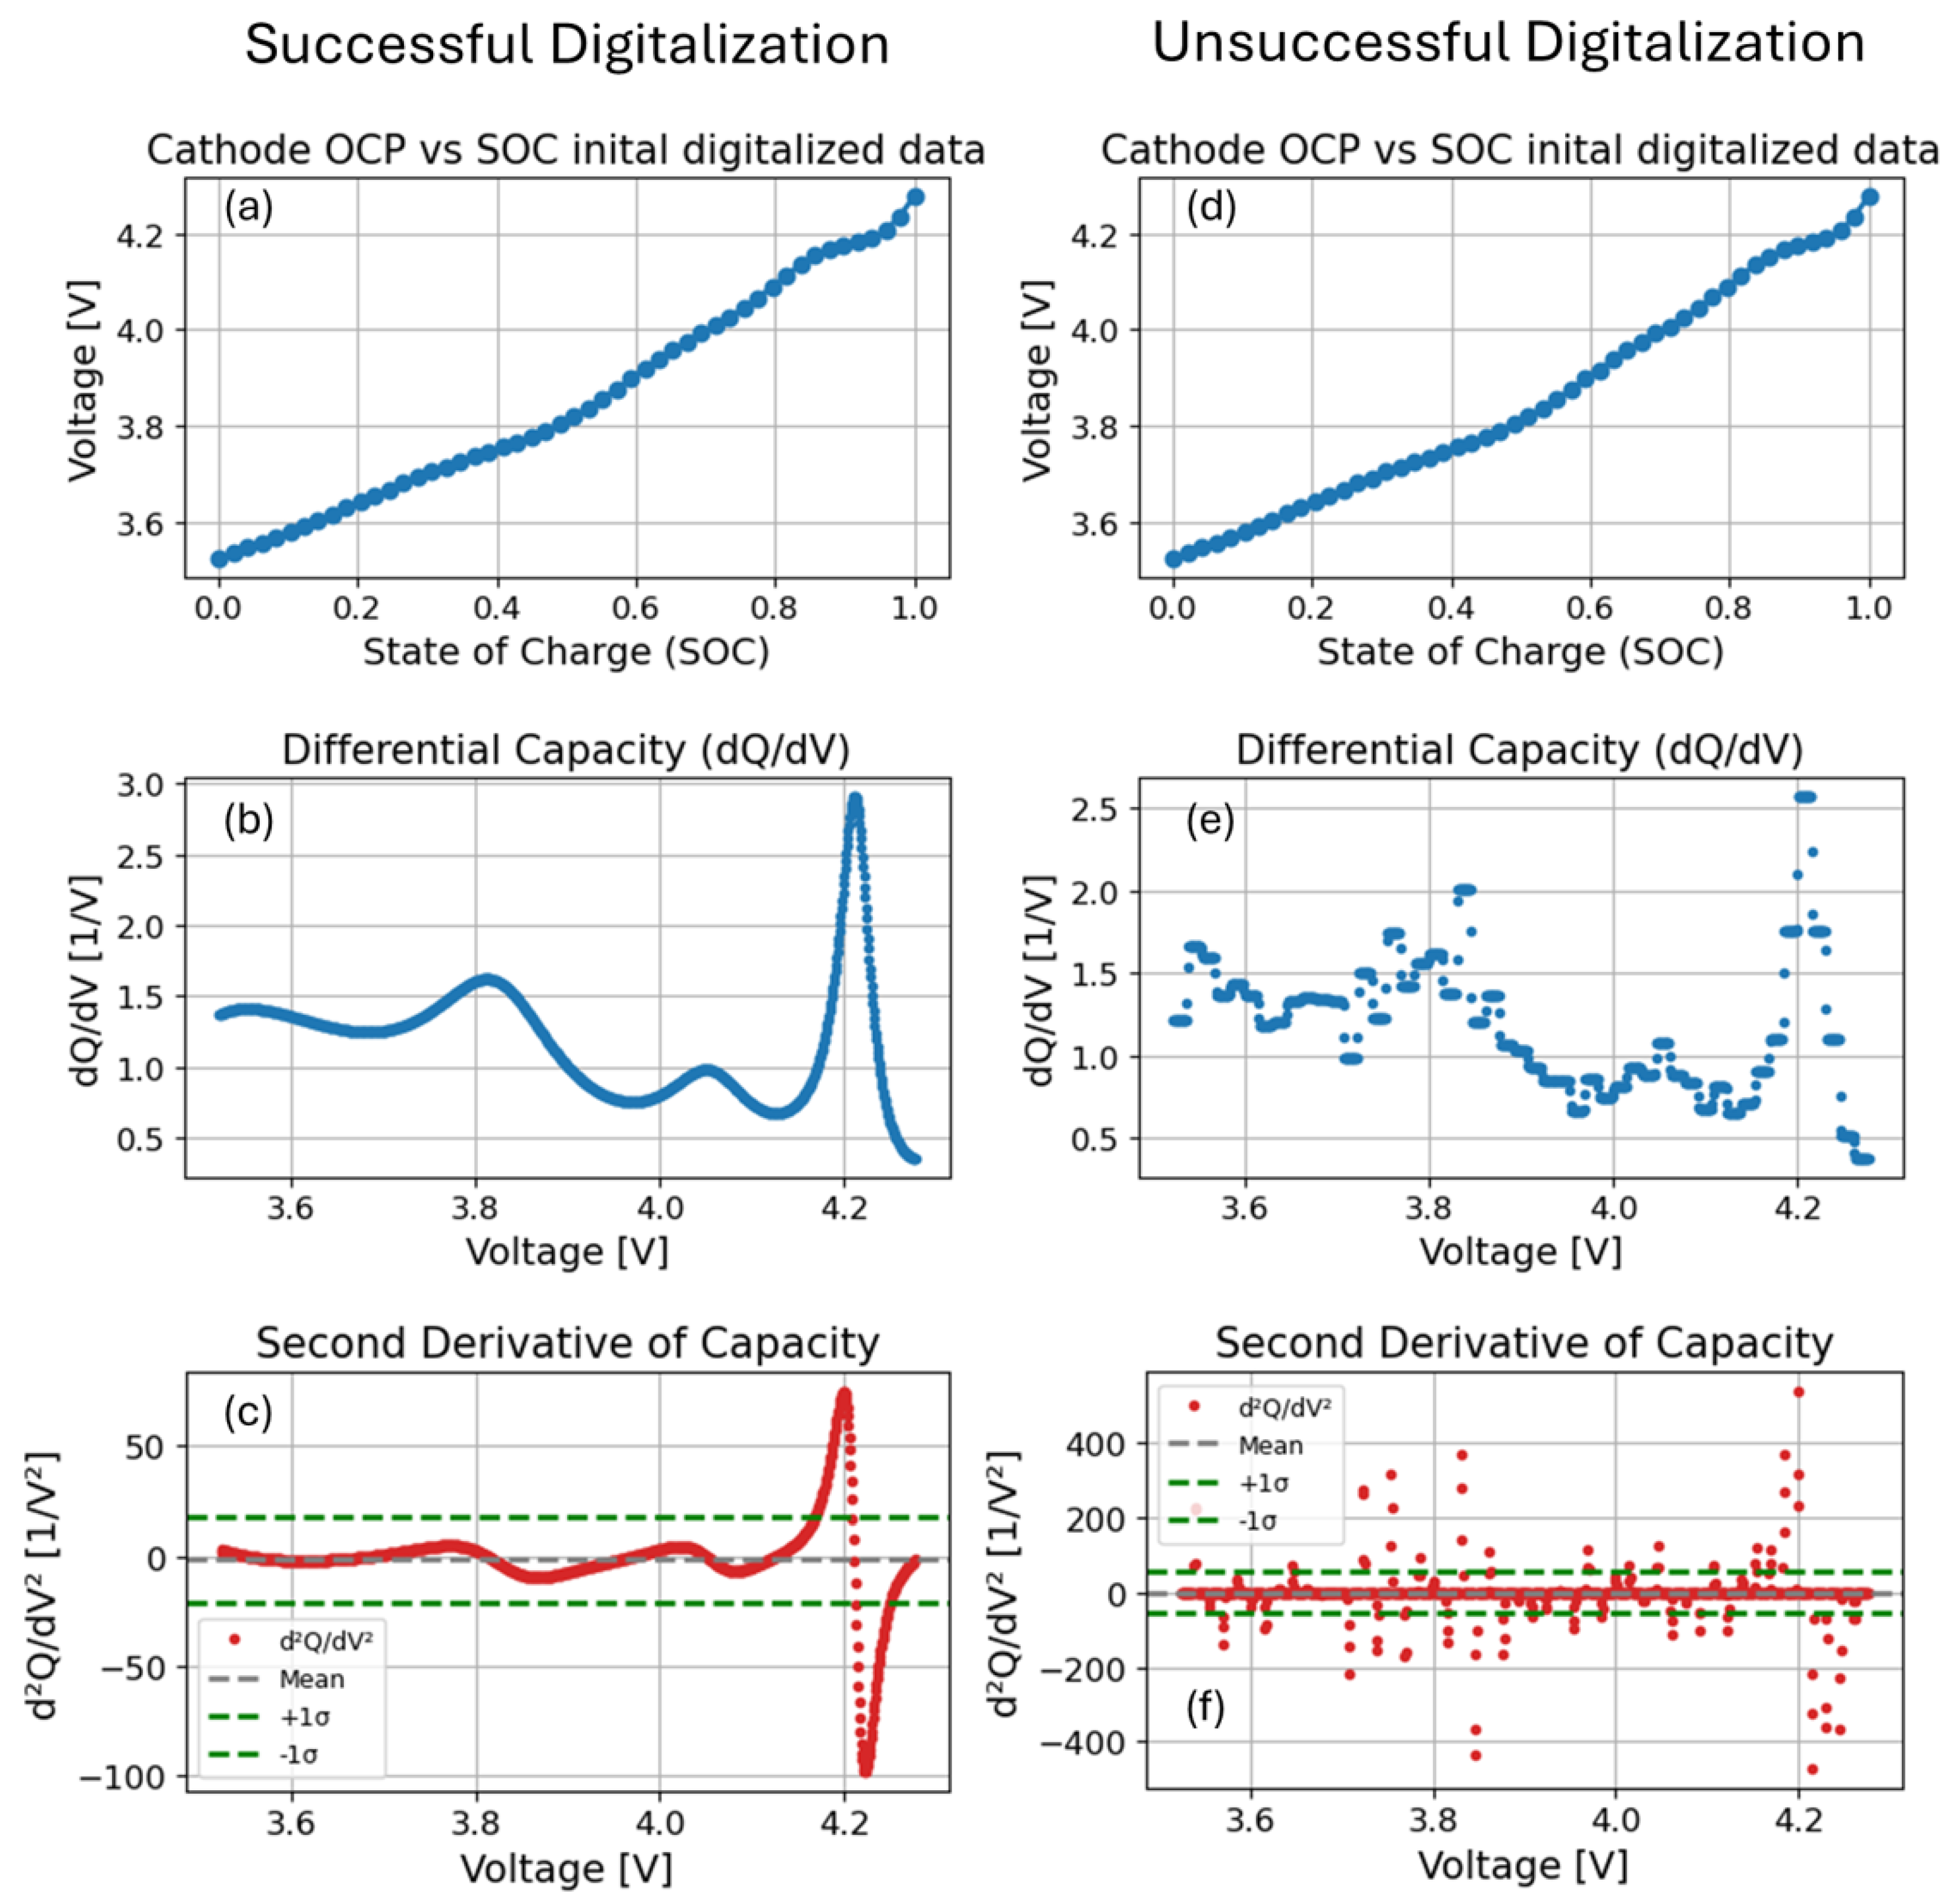
2.1.3. Data Integrity Check

Following the data curation and adaptation steps (Section 2.1.2), the quality of each dataset was assessed to ensure accurate and reliable results. Only data of sufficiently high quality were retained in the final PyBEP database. The selection focused on curves with favorable numerical properties, particularly those capable of producing a well-defined incremental capacity curve (also referred to as d Q / d V ).
Even if an OCP curve appears smooth, the calculation of the incremental capacity can introduce significant noise. This is due to the fact that incremental capacity is defined as the inverse of the derivative of the OCP curve with respect to the lithiation level. Both numerical differentiation and inversion are highly sensitive to small irregularities in discretized data.
Because incremental capacity is essential for determining stoichiometric ranges in PyBEP, only those OCP curves that produced smooth, continuous d Q / d V curves were considered suitable.
To distinguish between acceptable and unacceptable datasets, a specific quality criterion was developed. The second derivative of the capacity curve with respect to voltage—denoted d 2 Q / d V 2 —was computed from the discrete d Q / d V values. This second derivative approximates the difference between adjacent points in the d Q / d V curve. The standard deviation ( σ ) of the d 2 Q / d V 2 values was calculated and compared to the extreme values within the same dataset. If either the maximum or minimum value deviated by more than 4 × σ from the mean, this indicated the presence of a discontinuity or sharp jump in the d Q / d V curve. Such datasets were deemed unsuitable for inclusion in the PyBEP database. This procedure is illustrated in Figure 2.
Figure 2 shows two attempts to digitize the cathode OCP curve from reference [9], each using 50 data points. The left column of the figure (Figure 2a–c) illustrates a successful digitization, where the resulting d 2 Q / d V 2 satisfies the criterion for inclusion in the PyBEP database. The extrema of d 2 Q / d V 2 lie within the 4 × σ region, as clearly shown in Figure 2c.
In contrast, the right column (Figure 2d–f) displays an unsuccessful attempt at digitization. In this case, the extrema of d 2 Q / d V 2 fall far outside the 4 × σ range. Although the digitized OCP curves themselves (Figure 2a,d) appear nearly identical to the naked eye, making the differences visually indistinguishable, the shortcomings of the digitization procedure become clearly evident in the derived d Q / d V and d 2 Q / d V 2 curves—shown in Figure 2b,c,e,f—following the interpolation step.

2.1.4. PyBEP Database

The OCP curves included in the PyBEP database are available through the PyBEP package GitHub repository (https://github.com/JonPisek/PyBEP). The open-source database is set up in way that it is easily extendable with OCP data from the community. In cases where data quality is uncertain, users are encouraged to contact the package developers.

2.2. Automated Selection of Open-Circuit Potential Curves and Calculation of Stoichiometric Ranges

Unlike the database creation process, which is performed only once by the PyBEP developers, the automated selection of open-circuit potential curves and calculation of stoichiometric ranges is automatically executed each time a user wishes to determine these parameters from the measured OCV curve using PyBEP. This methodology is the core component of the PyBEP package. The methodology utilizes the differential evolution [36] optimization algorithm, implemented via the differential_evolution function from the Python library scipy.optimize. Differential evolution was selected as it is well-suited for finding the global minimum of discontinuous, multidimensional cost functions, which is the challenge encountered when determining optimal battery OCPs from OCV data, utilizing the OCP curves’ database. In addition to differential evolution, users have the option to apply the Nelder–Mead (Amoeba) optimization algorithm after differential evolution is completed, further refining the result to accurately locate the minimum.
The methodology for automated selection of open-circuit potential curves and calculation of stoichiometric ranges simultaneously searches for the most adequate OCP curves from the database and the corresponding stoichiometric ranges that best fit the given measured OCV. To accomplish this efficiently, the algorithm is designed as a wrapper around several subroutines, which are described in the following subsections. This structure is graphically represented in Figure 1, where this methodological step is depicted in light orange.

2.2.1. Selecting Both OCP Curves from the Database

In the first step of the methodology for automated selection of open-circuit potential curves and calculation of stoichiometric ranges, two OCP curves are selected from the database—one for the cathode and one for the anode. In the initial iteration, this selection is random. In subsequent iterations, the selection follows the differential evolution algorithm, as described in detail in [36]. These two selected OCP curves are represented as two-dimensional arrays with 1000 rows and two columns each. For clarity, the selected cathode and anode OCP curves will be denoted as OCPc and OCPa, respectively.

2.2.2. Determination of the Stoichiometric Ranges

In the second step of each of the iterations of the proposed methodology, stoichiometric ranges for the selected OCP curves are determined. Four parameters, denoted as e, f, g, and h, are used for this purpose. Parameters e and f represent the lower and upper stoichiometric limits for the cathode, while g and h represent the lower and upper stoichiometric limits for the anode. The significance of these parameters is illustrated in Figure 2 of reference [13], where the methodology for determining stoichiometric ranges, now automated in PyBEP, was first introduced.
The stoichiometric range limits—parameters e, f, g, and h—are selected in each optimization iteration according to the differential evolution algorithm [36].
Once the values of e, f, g, and h are selected, the corresponding sections of OCPc and OCPa (from Section 2.2.1) are truncated to span the normalized stoichiometry ranges defined by e-f for the cathode and g-h for the anode (OCPc[e:f] and OCPa[g:h] in Python syntax). These truncated arrays are then interpolated and evaluated at 1000 points across the normalized stoichiometry range, now representing the state of charge (SOC) of the battery. The resulting arrays are denoted as OCP c SOC and OCP a SOC , where the superscript “SOC” indicates that the initial OCP curves have been transformed to the battery SOC range.

2.2.3. OCV Calculation

In the third step of the optimization iteration, the battery’s OCV is calculated using the interpolated OCP curves from the previous step. The OCV is determined by subtracting the anode potential from the cathode potential, as shown in Equation (1):
OCV c = OCP c SOC OCP a SOC
It is important to note that the OCV (SOC) dependency calculated at this stage is only an estimate of the final OCV proposed by the optimization algorithm. Due to the vast number of possible parameter combinations, the calculated OCV c might not be accurate in the early iterations, while it improves toward a final converged solution during the optimization process. To evaluate the accuracy of the calculated OCV c , a cost function is applied, as described in the following subsection.

2.2.4. RMSD Calculation

The root mean square deviation (RMSD) is used as the cost function to estimate how close the optimization algorithm is to the desired result at each iteration. RMSD is calculated from the difference between the calculated OCVc and the measured OCV, denoted as OCVm. It is at this stage that the algorithm first encounters the user-provided measured OCVm, which the PyBEP package aims to use for the automated selection of open-circuit potential curves and calculation of stoichiometric ranges. The measured OCV is a two-dimensional array with two columns and 1000 rows, where the first column represents the battery SOC and the second column represents the corresponding measured OCV.
The RMSD calculation is inspired by methodologies discussed in reference [13], which describe various approaches to determining optimal OCPs from OCVm. PyBEP combines two of the most promising methods that complement its optimization routine. The first method calculates the simple difference between OCVc and OCVm, providing a measure of how far the calculated result deviates from the measured data [13]. The second method, first introduced in [13] and implemented in PyBEP, compares the incremental capacities ( d Q / d V ) of OCVc and OCVm. Peaks in the d Q / d V function correspond to plateaus in the OCV curves and can serve as distinct markers for determining the stoichiometric ranges of battery electrodes [13]. The final RMSD function is a weighted combination of both methods, as shown in Equation (2):
RMSD = P OCV c OCV m 2 N + ( 1 P ) d Q c / d V d Q m / d V 2 N ,
where
d Q c / d V = d OCV c d SOC 1 ,
d Q m / d V = d OCV m d SOC 1 ,
N is the number of data points in the OCV arrays (1000 by default), ∑ represents summation across the array, and P is a user-adjustable weighting factor that determines the relative influence of the two methods on the final result. P allows users to prioritize either the incremental capacity comparison or the direct OCV difference. It serves as a tuning parameter for the users, since both methods are not necessarily equally efficient in every case.

2.2.5. Convergence Criterion

The methodology for the automated selection of open-circuit potential curves and calculation of stoichiometric ranges iterates through the steps outlined above until the convergence criterion is met. The criterion used is standard for the differential evolution algorithm: the procedure halts when the RMSD for all agents in the population differs by less than 10 6 . This condition ensures, with high probability, that the optimization has converged near the global minimum, corresponding to the optimal OCPs for the measured battery. Once the convergence criterion is satisfied and the differential evolution algorithm terminates, the Nelder–Mead (Amoeba) optimization algorithm is applied to refine the result and ensure the precise location of the minimum. The final result is returned as two two-dimensional arrays (2 × 1000), representing the potential dependencies on SOC for both electrodes of the tested battery. The entire optimization procedure typically converges within a minute on a modern AMD or Intel processor.

2.3. OCV Measurements
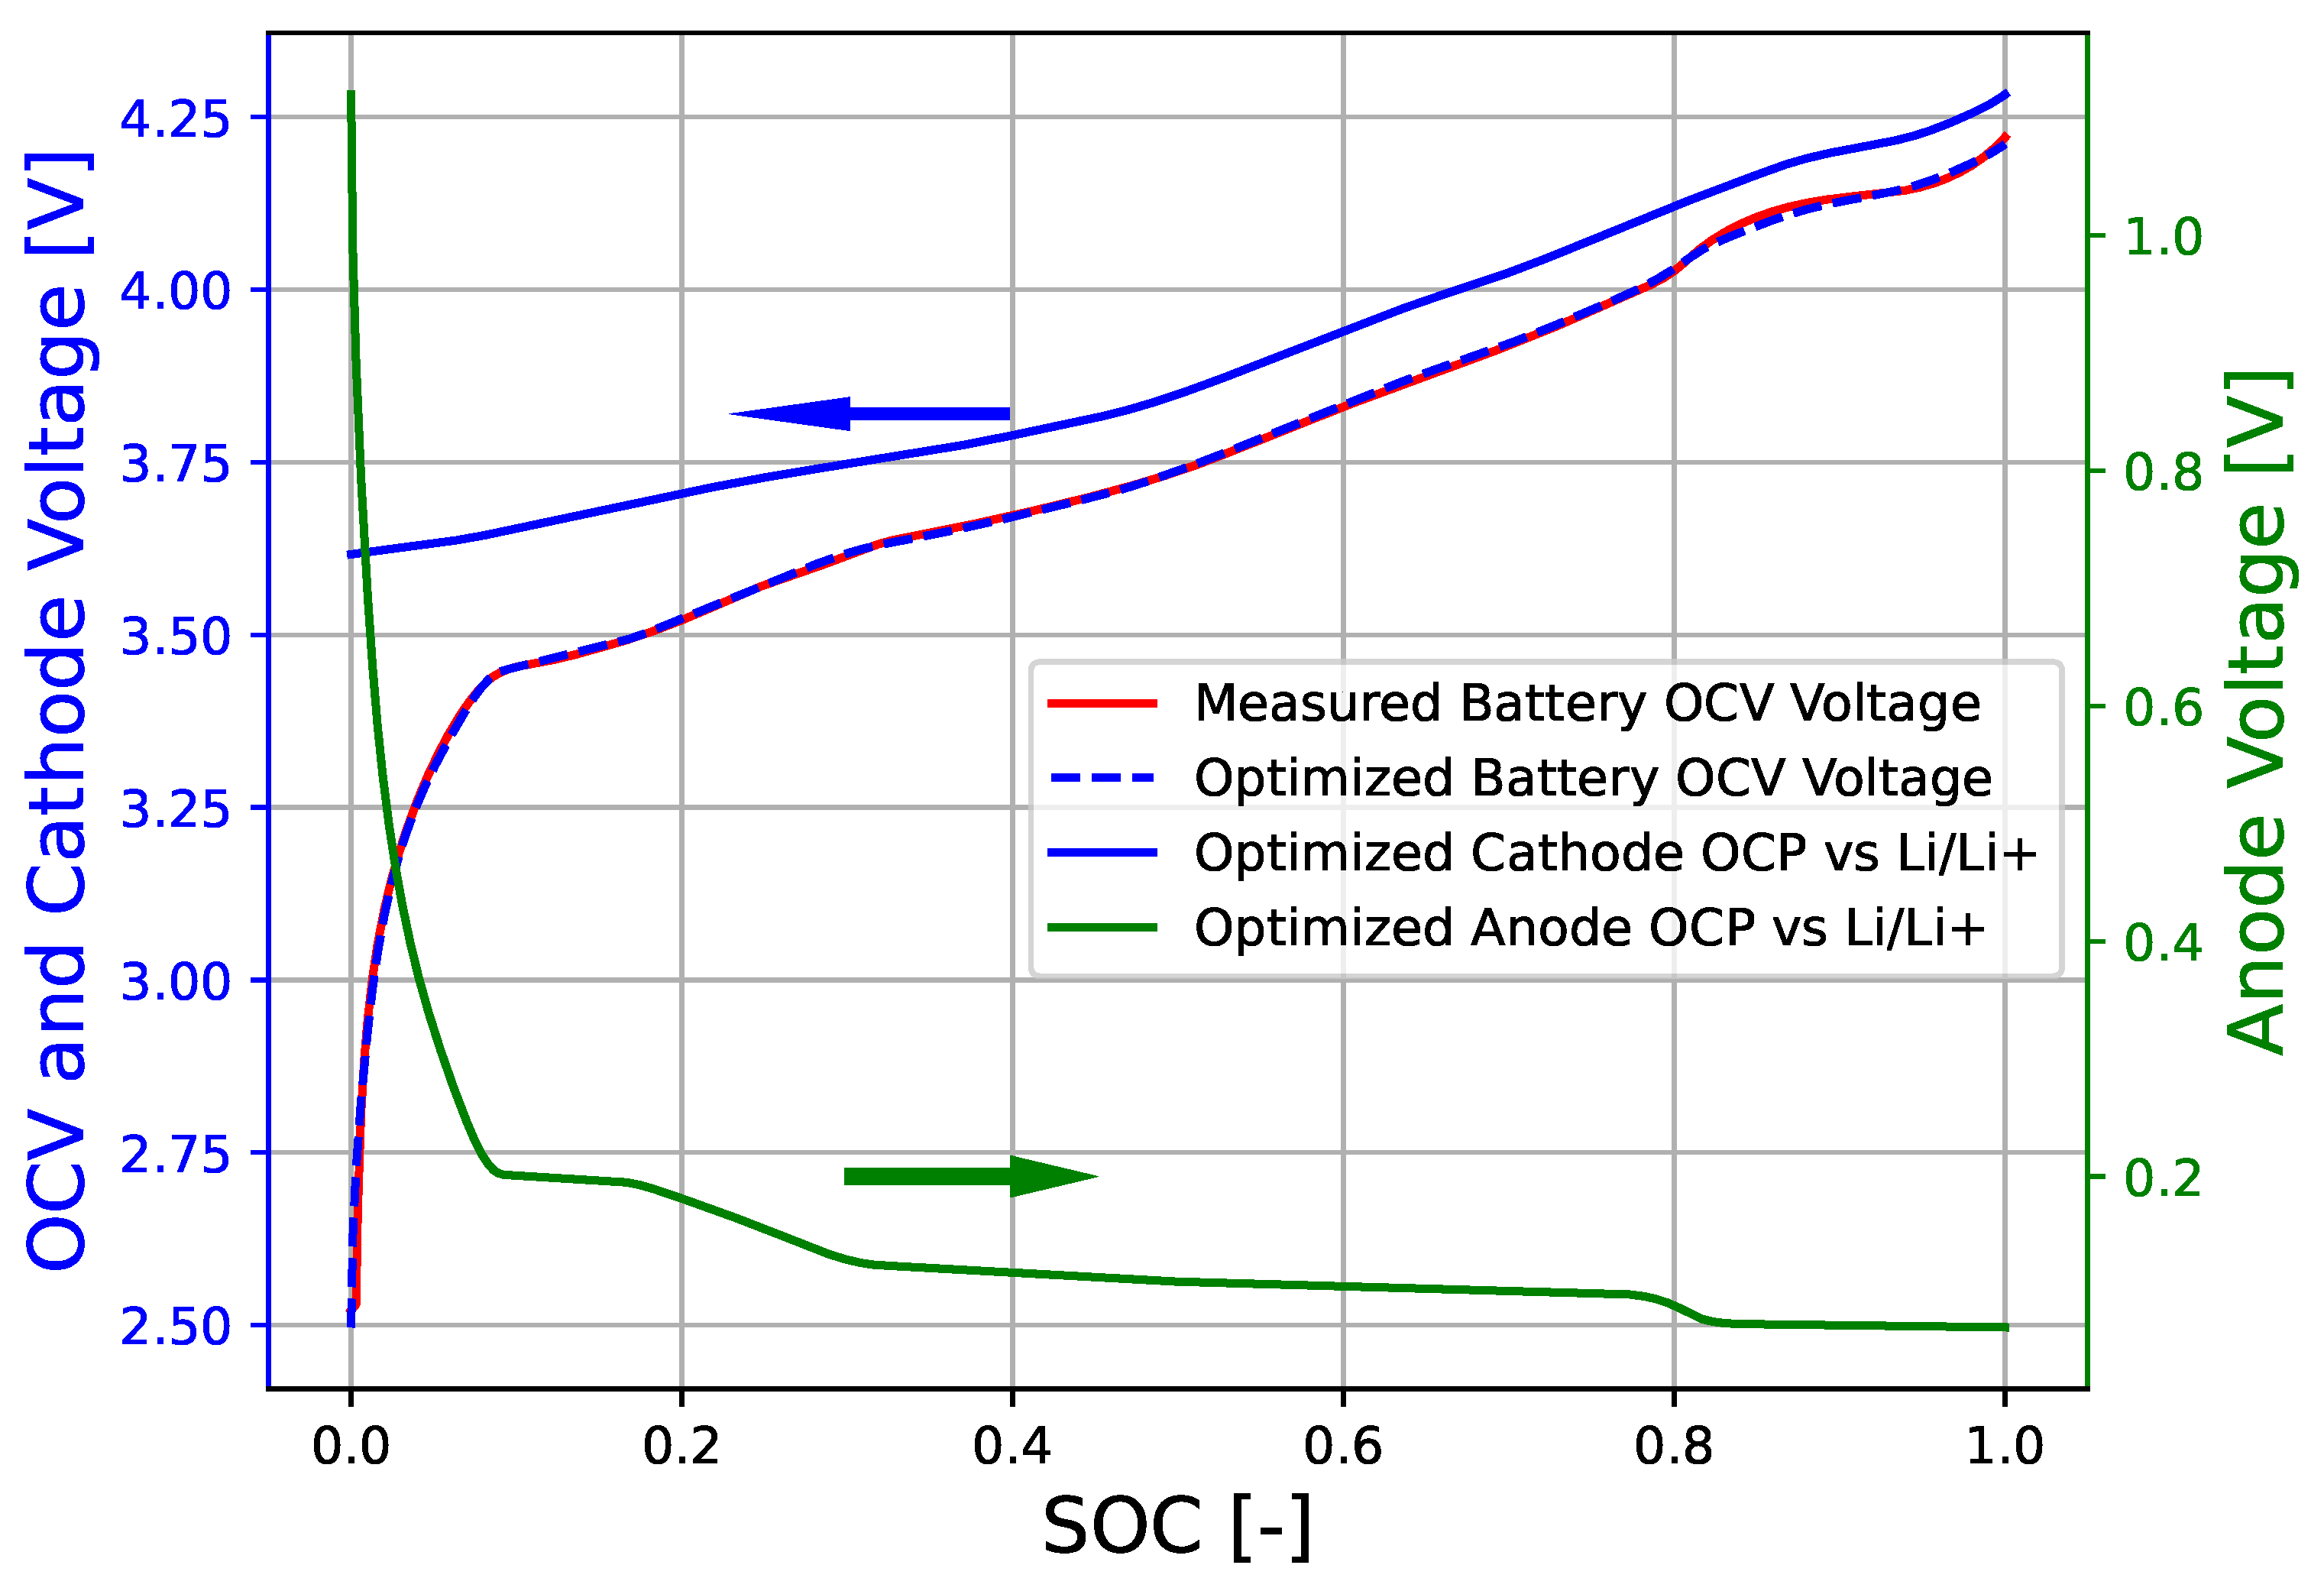
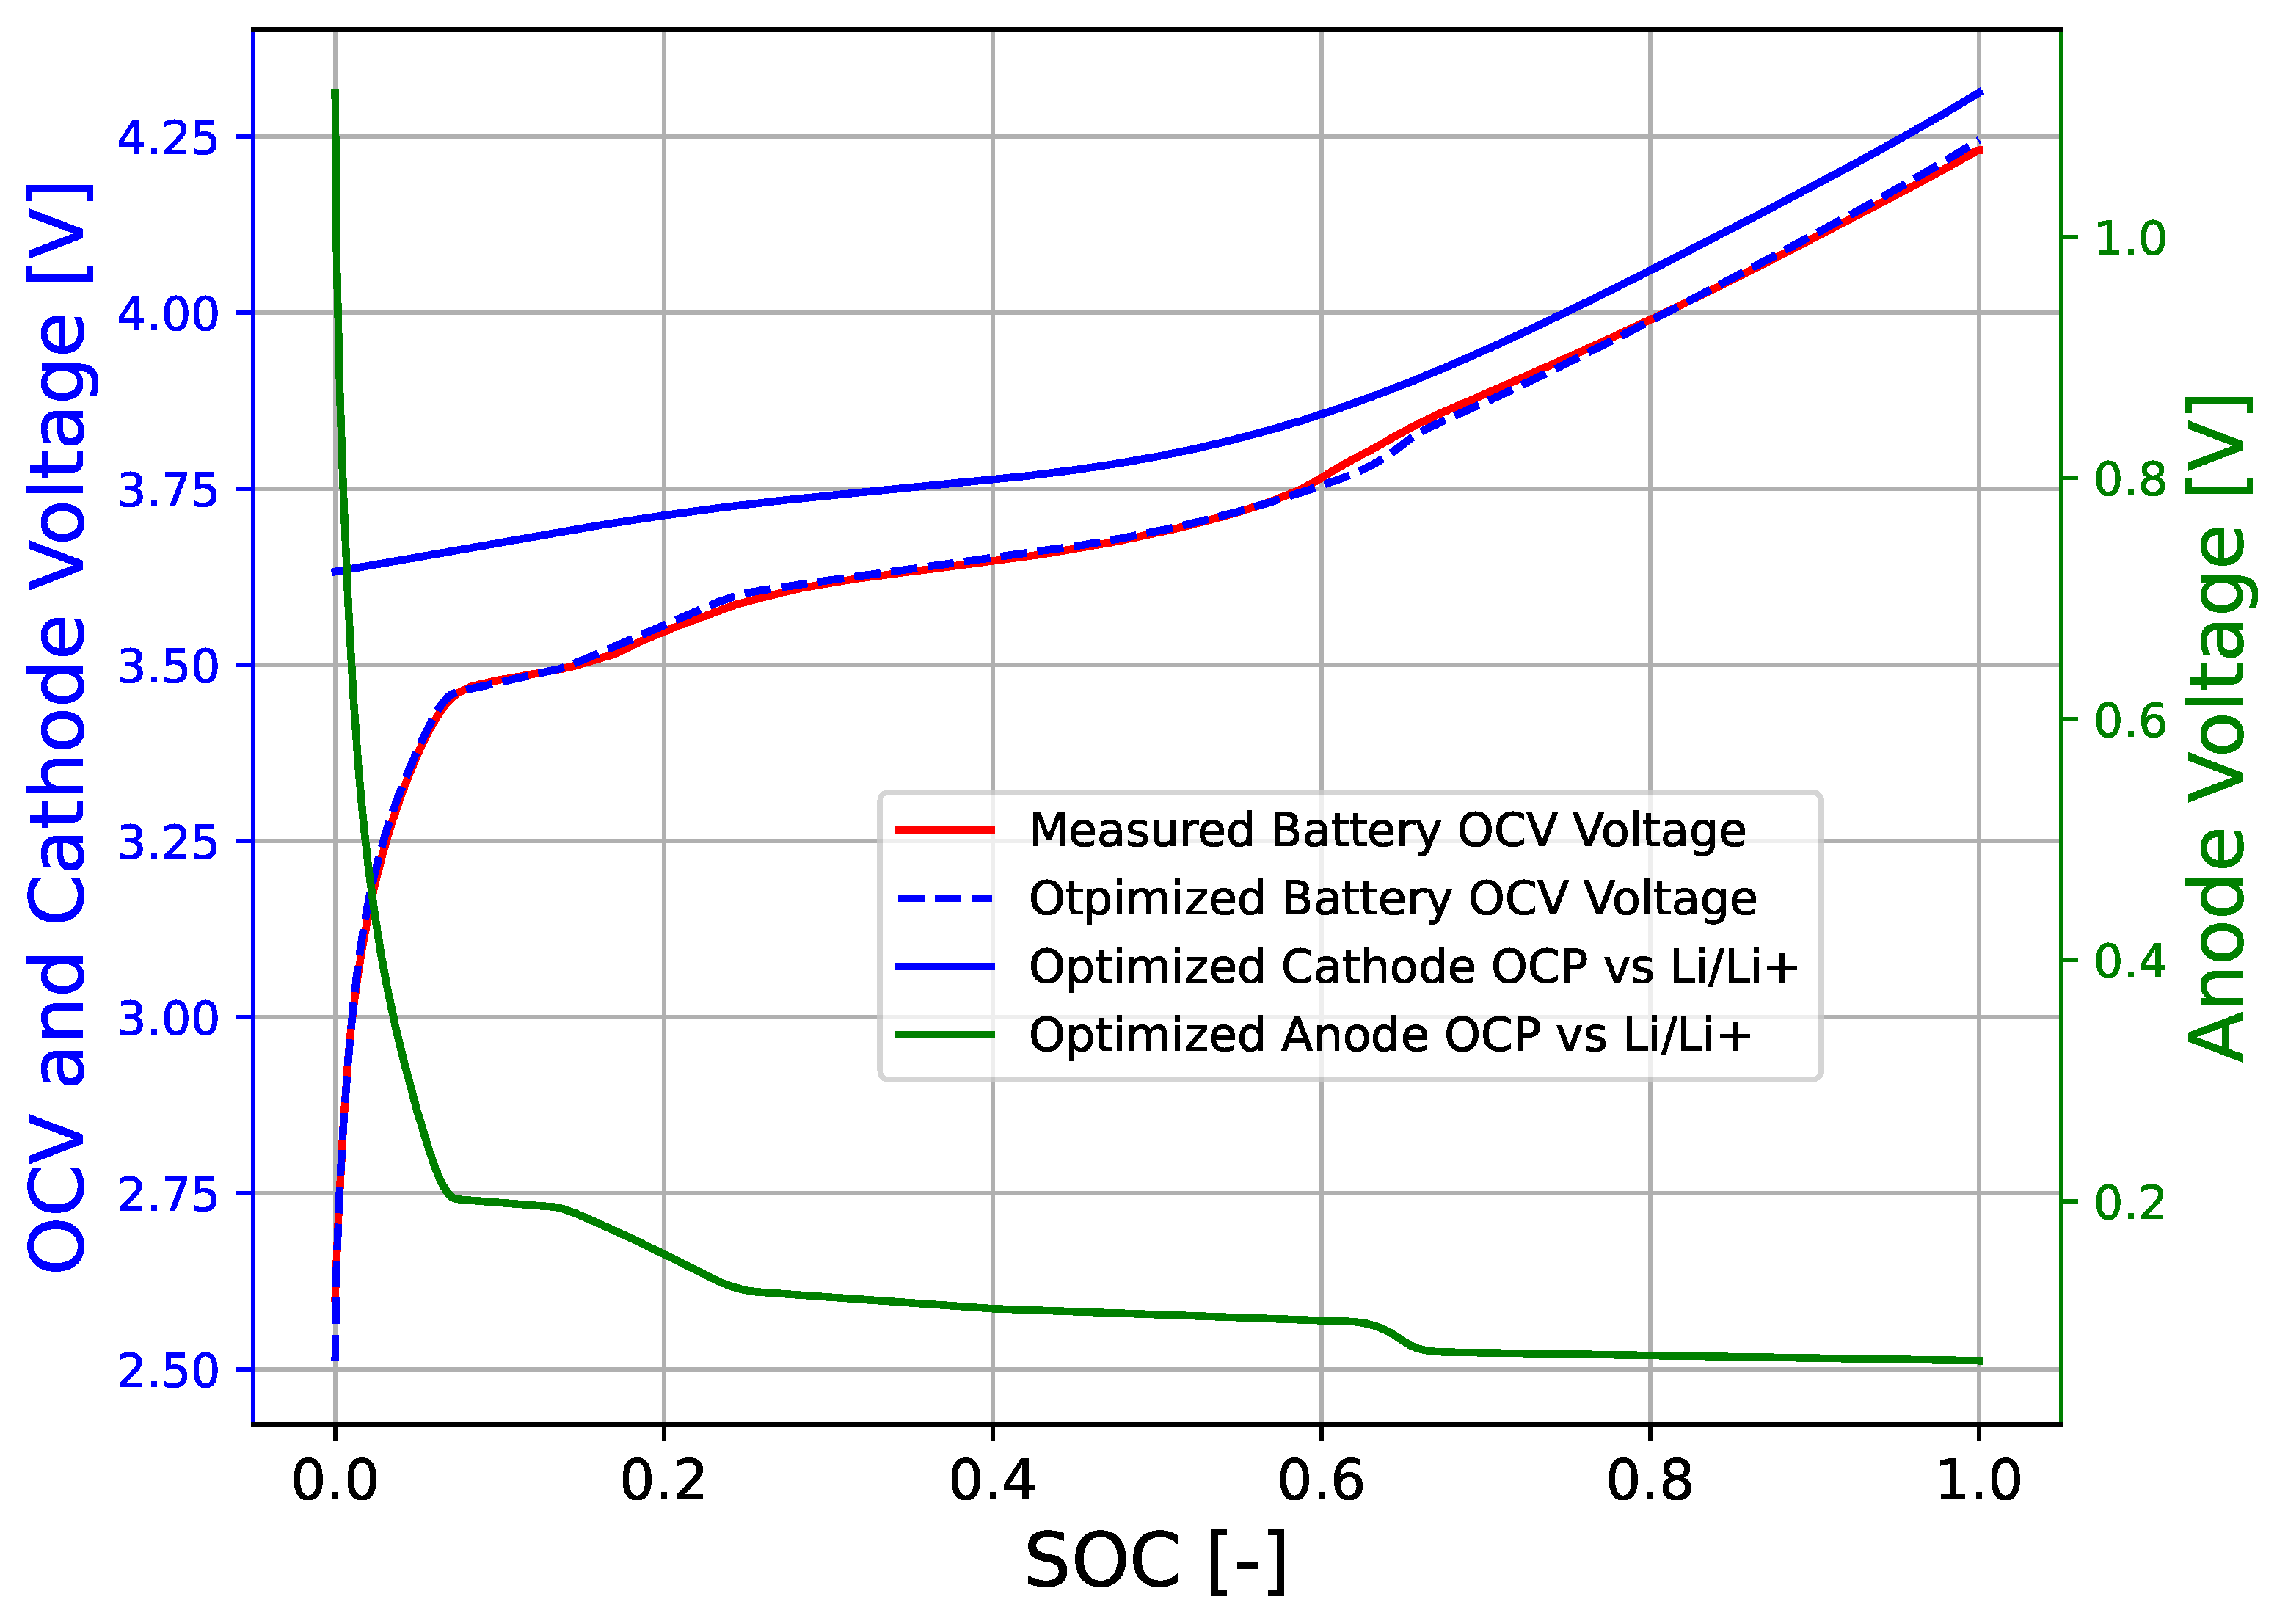
The only input required from the user for PyBEP to return electrode potentials is the measured battery OCV (OCVm). These data should be provided as an array with two columns: the first containing the battery SOC and the second containing the corresponding OCV. The number of rows (data points) in the provided measurement is flexible, as PyBEP automatically performs interpolation on the user-provided data prior to optimization to ensure the correct format. However, high-precision measurements are recommended to achieve optimal results with the PyBEP package.
The experimental procedure used to determine the OCV curves in the Results Section 3 is outlined below. Although this does not limit the use of any other method, it makes it possible for us to obtain accurate OCV data considering the specifics of battery chemistry. A GITT (galvanostatic intermittent titration technique) experiment was first performed on the battery, consisting of twenty 1C (C = amperage/battery capacity) charge and discharge pulses, each altering the battery SOC by 5%. The rest periods between the current pulses lasted 5 h, except for the three pulses at the lowest battery voltages, where overpotentials are highest. For these three pulses, the rest periods lasted 10 h during both charge and discharge.
Following the GITT experiment, the battery was fully discharged and allowed to rest at a constant voltage corresponding to 0% SOC, as per the battery specifications. After a long rest period (20 h), the battery was slowly charged and discharged at a C/100 current rate. The final OCV curve was determined as the average of the 40 data points obtained from the GITT experiment and the central average of the narrow hysteresis observed during the C/100 charge and discharge cycle.

3. Results

The results obtained using the PyBEP package demonstrate its functionality and accuracy. To validate both aspects, we conducted an analysis using reliable data from the literature [31]. In [31], the authors reported measurements of the OCV curve versus the state of charge (SOC—normalized percentage of battery remaining charge between 0 and 1), as well as measurements of both OCP curves for the cathode and anode. They measured the OCV of the full cell they assembled in their laboratory using a C/30 charge–discharge cycle. To obtain accurate OCPs of both electrodes, they performed the same measurement on two half-cells assembled separately from the cathode and anode materials. We digitized the data for the OCP curves from this paper and incorporated them into the database of the presented tool. Subsequently, PyBEP methodology was applied on the digitized measurements of the OCV from the same reference [31]. Out of all OCP curves in the database, PyBEP selected OCP curves digitized from the same reference [31] as the best candidates to replicate the OCV curve, which confirms its robustness and applicability. Furthermore, the PyBEP successfully calculated cell stoichiometric cycling ranges that matched exceptionally well with those reported in the original paper [31]. Figure 3 illustrates the results of the optimization process.
Excellent agreement between the measured and optimized OCV curve is evident in Figure 3.
Next, we conducted our own measurement on commercial lithium-ion battery with an NMC cathode and graphite anode. The OCV dependence on state of charge was measured as described in Section 2.3. The measured OCV curves were utilized to test the capability of PyBEP to identify the chemistry of the given battery. The determination of electrode chemistry was successful, along with the determination of cell stoichiometric cycling ranges. The results are presented in Figure 4a. In Figure 4b, the corresponding root mean square deviation (RMSD) between the measured and calculated OCV curves is shown. The average RMSD is 3.36 mV, which is close to the OCV measurement precision, demonstrating the exceptional precision of the PyBEP.
To demonstrate the efficiency of PyBEP (Figure 3 and Figure 4), cells with NMC811 and graphite electrodes were deliberately selected—not only because this chemistry is among the most commonly used in commercial batteries today but also because the OCV curve of NMC811/graphite cells has a distinctive shape that is immediately recognizable to experts in the field. Two prominent regions with a reduced slope appear in the OCV curve between SOC 0.10–0.15 and 0.30–0.45 (Figure 3 and Figure 4). These correspond to the first two plateaus in the graphite OCP curve, resulting from the phase-separating nature of graphite. Additionally, a characteristic bump appears around SOC 0.85, originating from the cathode due to the higher redox activity of NMC811 in this region. Notably, this feature is unique to NMC811 among NMC chemistries and does not appear in other compositions at high SOC. PyBEP successfully identified all of these features and, based on them, correctly determined the electrode chemistry. In this test case, we used the parameter p = 1 , meaning that PyBEP accounted only for the differences between OCV curves in the optimization cost function, without including the incremental capacity. Nevertheless, the results were highly accurate.
In the next part of the Results Section, we present two additional test cases involving chemistries that are more challenging to optimize precisely due to the lack of distinct features in their OCV curves. The first case involves an NMC532/graphite cell (Figure 5), and the second an LFP/graphite cell (Figure 6). The OCVs of the NMC532/graphite cell were measured in our laboratory using the same procedure as the one described in Section 2.3 and the measurement data for the LFP/graphite cell were taken from reference [37].

4. Conclusions

This paper introduces PyBEP, a robust and automated tool for the selection of open-circuit potential curves and precise calculation of stoichiometric ranges, achieving accuracy within the ten millivolt range.
The PyBEP package provides users with several valuable features based on measured battery OCV curves:
  • Determination of electrode chemical composition.
  • Calculation of electrode stoichiometric ranges.
  • Analysis of the dependence of electrode open-circuit potential on SOC.
  • Enhancement of low-accuracy measurements of battery OCV.
The robustness and accuracy of PyBEP are proven by validation against experimental results, confirming a precision of approximately 10 mV or better. These high levels of robustness, automatization, accuracy and user friendliness are arise from the following original contributions of the PyBEP: systematic integration of automated electrode chemistry identification, quality-controlled database usage, refinement of the results using incremental capacity methodology, and simultaneous optimization of multiple electrode parameters.
The open-source tool, PyBEP, is available on our GitHub page https://github.com/JonPisek/PyBEP, where users can access detailed instructions and a user-friendly graphical interface.

Author Contributions

J.P.: conceptualization, methodology, software, validation, formal analysis, investigation, data curation, writing—original draft, and visualization. T.K.: conceptualization, methodology, writing—review and editing, supervision, funding acquisition and project administration. K.Z.: conceptualization, methodology, investigation, writing—original draft preparation, writing—review and editing, visualization, supervision, and project administration. All authors have read and agreed to the published version of the manuscript.

Funding

The authors acknowledge support from the European Union’s Horizon 2020 research and innovation programme under Grant Agreement Nos. 101103898 (NextBMS), 101137975 (InnoBMS), 101103755 (FASTEST), 101137626 (HiHELIOS) and 101192649 (TwinLoop). The authors also acknowledge financial support from the Slovenian Research Agency (research core funding No. P2-0401 and project J2-2494).

Data Availability Statement

The complete source code for the PyBEP package, along with the full database and OCV data utilized in this study to demonstrate the functionality of PyBEP, is available on the GitHub repository under the terms and conditions of the Creative Commons Attribution, NonCommercial, and ShareAlike (CC BY-NC-SA 4.0) license https://github.com/JonPisek/PyBEP (accessed on 28 July 2025).

Conflicts of Interest

The authors declare that they have no conflicts of interest.

References

  1. He, Q.; Yu, B.; Li, Z.; Zhao, Y. Density functional theory for battery materials. Energy Environ. Mater. 2019, 2, 264–279. [Google Scholar] [CrossRef]
  2. Euchner, H.; Groß, A. Atomistic modeling of Li-and post-Li-ion batteries. Phys. Rev. Mater. 2022, 6, 040302. [Google Scholar] [CrossRef]
  3. Brosa Planella, F.; Ai, W.; Boyce, A.M.; Ghosh, A.; Korotkin, I.; Sahu, S.; Sulzer, V.; Timms, R.; Tranter, T.G.; Zyskin, M.; et al. A continuum of physics-based lithium-ion battery models reviewed. Prog. Energy 2022, 4, 042003. [Google Scholar] [CrossRef]
  4. Grazioli, D.; Magri, M.; Salvadori, A. Computational modeling of Li-ion batteries. Comput. Mech. 2016, 58, 889–909. [Google Scholar] [CrossRef]
  5. Katrašnik, T.; Mele, I.; Zelič, K. Multi-scale modelling of Lithium-ion batteries: From transport phenomena to the outbreak of thermal runaway. Energy Convers. Manag. 2021, 236, 114036. [Google Scholar] [CrossRef]
  6. Rosewater, D.M.; Copp, D.A.; Nguyen, T.A.; Byrne, R.H.; Santoso, S. Battery energy storage models for optimal control. IEEE Access 2019, 7, 178357–178391. [Google Scholar] [CrossRef]
  7. Zhou, W.; Zheng, Y.; Pan, Z.; Lu, Q. Review on the battery model and SOC estimation method. Processes 2021, 9, 1685. [Google Scholar] [CrossRef]
  8. Zelič, K.; Katrašnik, T.; Gaberšček, M. Derivation of transmission line model from the concentrated solution theory (CST) for porous electrodes. J. Electrochem. Soc. 2021, 168, 070543. [Google Scholar] [CrossRef]
  9. Mele, I.; Zelič, K.; Firm, M.; Moškon, J.; Gaberšček, M.; Katrašnik, T. Enhanced Porous Electrode Theory Based Electrochemical Model for Higher Fidelity Modelling and Deciphering of the EIS Spectra. J. Electrochem. Soc. 2024, 171, 080537. [Google Scholar] [CrossRef]
  10. Marshall, J.; Gastol, D.; Sommerville, R.; Middleton, B.; Goodship, V.; Kendrick, E. Disassembly of Li ion cells—Characterization and safety considerations of a recycling scheme. Metals 2020, 10, 773. [Google Scholar] [CrossRef]
  11. Ahmed, M.S.; Balasingam, B.; Pattipati, K. Experimental data on open circuit voltage characterization for Li-ion batteries. Data Brief 2021, 36, 107071. [Google Scholar] [CrossRef]
  12. Pattipati, B.; Balasingam, B.; Avvari, G.; Pattipati, K.R.; Bar-Shalom, Y. Open circuit voltage characterization of lithium-ion batteries. J. Power Sources 2014, 269, 317–333. [Google Scholar] [CrossRef]
  13. Lu, D.; Trimboli, M.S.; Fan, G.; Zhang, R.; Plett, G.L. Implementation of a physics-based model for half-cell open-circuit potential and full-cell open-circuit voltage estimates: Part II. Processing full-cell data. J. Electrochem. Soc. 2021, 168, 070533. [Google Scholar] [CrossRef]
  14. Sulzer, V.; Marquis, S.G.; Timms, R.; Robinson, M.; Chapman, S.J. Python Battery Mathematical Modelling (PyBaMM). J. Open Res. Softw. 2021, 9, 14. [Google Scholar] [CrossRef]
  15. Klein, M. Battsimpy. 2017. Available online: https://github.com/matthewpklein/battsimpy (accessed on 28 July 2025).
  16. Li, S.; Rawat, S.K.; Zhu, T.; Offer, G.J.; Marinescu, M. Python-based Equivalent Circuit Network (PyECN) Model-ling Framework for Lithium-ion Batteries: Next generation open-source battery modelling framework for Lithium-ion batteries. engrXiv 2023. [Google Scholar] [CrossRef]
  17. Dhoot, R.; Timms, R.; Please, C. PyBaMM EIS: Efficient Linear Algebra Methods to Determine Li-ion Battery Behaviour. Available online: https://github.com/pybamm-team/pybamm-eis (accessed on 28 July 2025).
  18. Wang, F.; Zhai, Z.; Zhao, Z.; Di, Y.; Chen, X. Physics-informed neural network for lithium-ion battery degradation stable modeling and prognosis. Nat. Commun. 2024, 15, 4332. [Google Scholar] [CrossRef]
  19. Shi, Z. MambaLithium: Selective state space model for remaining-useful-life, state-of-health, and state-of-charge estimation of lithium-ion batteries. arXiv 2024, arXiv:2403.05430. [Google Scholar]
  20. Berliner, M.D.; Cogswell, D.A.; Bazant, M.Z.; Braatz, R.D. Methods—PETLION: Open-Source Software for Millisecond-Scale Porous Electrode Theory-Based Lithium-Ion Battery Simulations. J. Electrochem. Soc. 2021, 168, 090504. [Google Scholar] [CrossRef]
  21. Ai, W.; Liu, Y. JuBat: A Julia-based framework for battery modelling using finite element method. SoftwareX 2024, 27, 101760. [Google Scholar] [CrossRef]
  22. Planden, B.; Lukow, K.; Henshall, P.; Collier, G.; Morrey, D. A Computationally Informed Realisation Algorithm for Lithium-Ion Batteries Implemented with LiiBRA.jl. J. Energy Storage 2022, 55, 105637. [Google Scholar] [CrossRef]
  23. Planden, B.; Courtier, N.; Robinson, M.; Khetarpal, A.; Planella, F.B.; Howey, D. PyBOP: A Python package for battery model optimisation and parameterisation. arXiv 2024, arXiv:2412.15859. [Google Scholar]
  24. Wang, A.; O’Kane, S.; Planella, F.B.; Le Houx, J.; O’Regan, K.; Zyskin, M.; Edge, J.; Monroe, C.; Cooper, S.; Howey, D.A.; et al. Review of parameterisation and a novel database (LiionDB) for continuum Li-ion battery models. Prog. Energy 2022, 4, 032004. [Google Scholar] [CrossRef]
  25. COMSOL Multiphysics®, COMSOL AB, Stockholm, Sweden. Available online: https://www.comsol.com/ (accessed on 28 July 2025).
  26. AVL Cruise M. Available online: https://www.avl.com/en/simulation-solutions/software-offering/simulation-tools-a-z/avl-cruise-m (accessed on 28 July 2025).
  27. Dubarry, M.; Berecibar, M.; Devie, A.; Anseán, D.; Omar, N.; Villarreal, I. State of health battery estimator enabling degradation diagnosis: Model and algorithm description. J. Power Sources 2017, 360, 59–69. [Google Scholar] [CrossRef]
  28. Wang, A. LiionDB. 2022. Available online: https://github.com/ndrewwang/liiondb (accessed on 28 July 2025).
  29. Wang, A.; O’Kane, S.; Planella, F.B.; Houx, J.L.; O’Regan, K.; Zyskin, M.; Edge, J.; Monroe, C.; Cooper, S.; Howey, D.; et al. Parameterising continuum level Li-ion battery models & the LiionDB database. arXiv 2021, arXiv:2110.09879. [Google Scholar]
  30. Jiang, F.; Peng, P. Elucidating the performance limitations of lithium-ion batteries due to species and charge transport through five characteristic parameters. Sci. Rep. 2016, 6, 32639. [Google Scholar] [CrossRef] [PubMed]
  31. Dose, W.M.; Xu, C.; Grey, C.P.; De Volder, M.F. Effect of anode slippage on cathode cutoff potential and degradation mechanisms in Ni-rich Li-ion batteries. Cell Rep. Phys. Sci. 2020, 1, 100253. [Google Scholar] [CrossRef]
  32. Prada, E.; Di Domenico, D.; Creff, Y.; Bernard, J.; Sauvant-Moynot, V.; Huet, F. Simplified electrochemical and thermal model of LiFePO4-graphite Li-ion batteries for fast charge applications. J. Electrochem. Soc. 2012, 159, A1508. [Google Scholar] [CrossRef]
  33. Wu, S.L.; Zhang, W.; Song, X.; Shukla, A.K.; Liu, G.; Battaglia, V.; Srinivasan, V. High rate capability of Li (Ni1/3Mn1/3Co1/3)O2 electrode for Li-ion batteries. J. Electrochem. Soc. 2012, 159, A438. [Google Scholar] [CrossRef]
  34. Verma, A.; Smith, K.; Santhanagopalan, S.; Abraham, D.; Yao, K.P.; Mukherjee, P.P. Galvanostatic intermittent titration and performance based analysis of LiNi0.5Co0.2Mn0.3O2 cathode. J. Electrochem. Soc. 2017, 164, A3380. [Google Scholar] [CrossRef]
  35. Chaouachi, O.; Réty, J.M.; Génies, S.; Chandesris, M.; Bultel, Y. Experimental and theoretical investigation of Li-ion battery active materials properties: Application to a graphite/Ni0.6Mn0.2Co0.2O2 system. Electrochim. Acta 2021, 366, 137428. [Google Scholar] [CrossRef]
  36. Price, K.V. Differential evolution: A fast and simple numerical optimizer. In Proceedings of the IEEE North American Fuzzy Information Processing, Berkeley, CA, USA, 19–22 June 1996; pp. 524–527. [Google Scholar]
  37. Song, X.; Yang, F.; Wang, D.; Tsui, K.L. Combined CNN-LSTM network for state-of-charge estimation of lithium-ion batteries. IEEE Access 2019, 7, 88894–88902. [Google Scholar] [CrossRef]
Figure 1. Flowchart illustrating the PyBEP package. The left side of the figure depicts the database creation process, while the right side outlines the optimization algorithm. Parameters e, f, g, and h, which are determined during the optimization procedure, correspond to the lower and upper stoichiometric limits of the anode (e and f) and cathode (g and h). The standard root mean square deviation (RMSD) is used as the cost function for optimization. The optimization algorithm combines differential evolution with the Nelder–Mead method. Each step shown in the figure is described in detail later in the text.
Batteries 11 00295 g001
Figure 2. (a) Cathode OCP digitized from reference [9] with high precision. (b) Incremental capacity ( d Q / d V ) calculated from (a). (c) Second derivative ( d 2 Q / d V 2 ) calculated from (a). (d) Cathode OCP digitized from reference [9] with low precision. (e) Incremental capacity ( d Q / d V ) calculated from (d). (f) Second derivative ( d 2 Q / d V 2 ) calculated from (d).
Batteries 11 00295 g002
Figure 3. Validation of PyBEP functionality and accuracy. The red line represents the measured battery OCV from the reference source [31]. The green and blue lines indicate the electrode OCPs determined by the PyBEP tool. Through optimization, the PyBEP tool selected, from an extensive database, the two curves digitized from the same reference [31] where the OCPs were explicitly measured.
Batteries 11 00295 g003
Figure 4. (a) Results of electrode OCP determination from the measured OCV. The red line represents the OCV curve measured on a commercial 18650 Li-ion battery. The blue and green lines show the optimized OCP curves for the battery. The dashed blue line indicates the final calculated OCV obtained from the optimization procedure. (b) Absolute difference between the measured OCV curve and the calculated OCV curve, obtained as the difference between the determined OCP curves. The average absolute difference is 3.36 mV.
Batteries 11 00295 g004
Figure 5. Demonstration of PyBEP efficiency on a battery cell with an NMC523 cathode and graphite anode. RMSD, in this case, was 8.61 mV.
Batteries 11 00295 g005
Figure 6. Demonstration of PyBEP efficiency on a battery cell with an LFP cathode and graphite anode. RMSD, in this case, was 10.20 mV.
Batteries 11 00295 g006
Disclaimer/Publisher’s Note: The statements, opinions and data contained in all publications are solely those of the individual author(s) and contributor(s) and not of MDPI and/or the editor(s). MDPI and/or the editor(s) disclaim responsibility for any injury to people or property resulting from any ideas, methods, instructions or products referred to in the content.

