Article

Influence of Pulse Duration on Cutting-Edge Quality and Electrochemical Performance of Lithium Metal Anodes

Institute of Joining and Welding, Technical University Braunschweig, 38106 Braunschweig, Germany
*
Author to whom correspondence should be addressed.
Batteries 2025, 11(8), 286; https://doi.org/10.3390/batteries11080286
Submission received: 25 June 2025 / Revised: 21 July 2025 / Accepted: 25 July 2025 / Published: 26 July 2025
(This article belongs to the Section Battery Processing, Manufacturing and Recycling)

Abstract

Lithium metal is a promising anode material for next-generation batteries due to its high specific capacity and low density. However, conventional mechanical processing methods are unsuitable due to lithium’s high reactivity and adhesion. Laser cutting offers a non-contact alternative, but photothermal effects can negatively impact the cutting quality and electrochemical performance. This study investigates the influence of pulse duration on the cutting-edge characteristics and electrochemical behavior of laser-cut 20 µm lithium metal on 10 µm copper foils using nanosecond and picosecond laser systems. It was demonstrated that shorter pulse durations significantly reduce the heat-affected zone (HAZ), resulting in improved cutting quality. Electrochemical tests in symmetric Li|Li cells revealed that laser-cut electrodes exhibit enhanced cycling stability compared with mechanically separated anodes, despite the presence of localized dead lithium “reservoirs”. While the overall pulse duration did not show a direct impact on ionic resistance, the characteristics of the cutting edge, particularly the extent of the HAZ, were found to influence the electrochemical performance.

1. Introduction

Lithium metal for Li-ion rechargeable batteries is one of the most promising anode materials for future battery generations due to its high specific capacity (3860 mAh g−1), low density (0.534 g cm−3), and lower electrode potential (−3.04 V) vs. SHE [1]. However, these intrinsic material advantages are offset by the fact that lithium dendrites form and grow during electrochemical cyclization. These lithium dendrites could penetrate the separator and cause a short circuit in the cell, thus posing a safety risk [2]. As a result, no further research has been conducted on lithium metal anodes, even though they have been on the market since the 1970s [3]. In recent decades, research has focused on advanced electrolytes, new separators, and other battery components that reduce the safety risk of dendrite growth and make the use of lithium metal as an anode feasible again [4]. In addition to the electrochemical challenges, there are still processing issues associated with lithium metal. Conventional separation methods, such as the stamping process, are not reliable because lithium is a highly reactive alkali metal with strong adhesive properties. As a result, lithium residues always adhere to the cutting tool and damage the cutting tool [5]. This results in uneven cutting edges and consequently different cutting-edge qualities, which can affect electrochemical performance. A reasonable alternative to mechanical separation is non-contact separation by laser cutting.
Jansen et al. investigated laser cutting of pure lithium metal foils using an ns-pulsed laser system [5]. It has been demonstrated that separation with a dew point temperature of −30 °C is feasible.
The laser–matter interaction has been shown to induce distinct characteristics on the cutting edge, particularly with regard to melt formation, heat-affected zone, and melt elevation [6]. However, for composite-based anode materials, these characteristics are less pronounced, as the energy input primarily leads to material decomposition and binder degradation, with a minimal impact on electrochemical performance [6]. In the case of metallic materials, the characteristics differ due to their higher melting temperatures, heat conductivity, and heat capacities. The predominant cause of these characteristics is the photothermal energy input [7]. The challenge lies in averting excessive photothermal energy input and attaining complete separation. Achieving complete separation necessitates a substantial photonic energy input, though this could potentially ignite the lithium foils. Therefore, it is imperative to reduce or avoid the photothermal energy input [8]. One potential solution to this challenge is the utilization of a laser system with ultrashort pulses [9]. For ultrashort pulses with a duration measured in pico- and femtoseconds, the conventional laser–matter interaction model becomes ineffective. The predominant ablation mechanism in this case is the photochemical dissociation of the compounds [7]. Due to the brief timescale, the laser-induced energy results in the excitation of the electrons. However, given the electron’s relatively brief relaxation time, estimated to be less than 10 picoseconds, the energy of the excited electrons is not transferred to the solid-state lattice. This phenomenon is referred to as “cold ablation” [10,11,12]. In this timescale, the material is unable to vaporize completely; rather, the photochemical energy input causes the compounds to break, resulting in a state of overheated liquid [7]. Consequently, a binary system of liquid droplets and vapor, which is rapidly expanding, develops. This phenomenon, known as phase explosion, has been extensively researched in the scientific community [13,14,15]. The dynamics of this binary system are elegantly captured by the two-temperature model [9,12], which provides a quantitative framework for understanding the complex processes involved. Leitz et al. have demonstrated that the ablation rate for a pulse system operating within pico- and femtosecond timescales is considerably lower than that of a pulsed nanosecond system [11].
In this study, the impact of varying pulse durations on the cutting edge and the electrochemical performance of laser-cut 20 µm lithium metal on 10 µm copper foils was examined. To this end, laser systems with two distinct pulse durations, one within the nanosecond range (ns-laser) and the other within the picosecond range (ps-laser), were utilized. This approach was employed to ascertain whether a reduction in pulse duration could result in a decrease in the photothermal energy input. Although differences between nanosecond and picosecond pulse durations in terms of cutting-edge characteristics and heat-affected-zone (HAZ) formation have already been investigated [16], a systematic comparison maintaining constant secondary laser parameters has not been conducted. To address this gap the present study investigates the influence of pulse duration under controlled secondary laser conditions. Initially, the nanosecond laser system was employed for the cutting process of the lithium–copper foils. In this experiment, a range of pulse-repetition frequencies and cutting velocities were utilized to assess the cutting behavior of the metal. Subsequently, the secondary laser parameters (line energy, pulse overlap) were calculated based on the nanosecond parameters. Subsequently, the parameters for the picosecond laser were examined, while maintaining the values of the calculated secondary laser parameters in order to ensure comparability between these systems. The influence of these calculated laser parameters on the cutting edge was subsequently investigated for the picosecond laser. Finally, the investigation focused on cut anodes exhibiting distinct cutting-edge characteristics in symmetrical Li|Li cells, with the objective of assessing the electrochemical performance.

2. State-of-the-Art Electrochemical Characterization of Lithium Metal Anodes

The usage of symmetrical Li|Li cells is essential to quantitatively evaluate the influence of previous process steps on the lithium metal, without the influences of a cathode [17]. Nowadays it is common to evaluate the voltage vs. time or capacity profiles, which takes place during the galvanostatic cycling of Li|Li cells [18,19,20]. The advantage of this evaluation method is that the voltage curves can be directly correlated to the morphology and its change during the cyclization of the lithium metal anode [21]. From this, information about the current aging state of the electrode can be obtained. Dendrite formation is a critical element in the cyclization of lithium metal, as this can lead to a short circuit caused by the perforation of the separator [22,23]. In order to suppress this critical element, different methods have been evaluated in terms of addition of inhibiting cations [24], alloy formation [25], and surface film control [26,27]. The use of the correct current density is essential, since it has a significant influence on dendrite formation [28]. Higher current densities lead to faster dendrite formation. The inactive lithium may present with a whisker morphology or as a granulate-sized block-like accumulation. The whisker morphology is predestined to have a high tortuosity. These forms tend to lead to a large amount of unused metallic lithium and thus to a low coulombic efficiency due to the loss of the percolation network. The granulate-sized depositions show low tortuosity and better electronic connectivity. In this case, a large part of the metallic lithium can still be used, resulting in a significantly higher coulombic efficiency [29]. Beyond the dendrites, the formation of dead lithium is another critical element during the cyclization of lithium metal [30,31,32,33]. The dead lithium is chemically completely degraded lithium, which leads to electrochemical isolation of the fresh bulk lithium, resulting in a massive loss of capacity [17,18]. The final critical element is the continuous release of fresh lithium from the bulk into the electrolyte. This, as well as the liquid electrolyte, is used to build up the Solid Electrolyte Interface (SEI), which on the one hand strongly increases the ionic resistance and on the other hand dries out the cell [17,18,34].

3. Materials and Methods

3.1. Used Material and Test Sample Geometry

In this investigation, a lithium layer joined on copper is used, where the copper layer is 10 µm ± 5 µm and the lithium layer is 20 µm ± 15% (Goodfellow GmbH, Hamburg Germany), processed under a defined dry room atmosphere with a dew point of −30 °C. Circular stampings with a diameter of 12 mm are used as test samples for the investigation of the cutting edges and for the working electrode. As a counter electrode, mechanically separated circular stampings with a diameter of 18 mm are used.

3.2. Laser System and Laser Parameters

The lasers used in the scope of this study and their respective properties are listed in Table 1.
Secondary laser parameters are used to compare the two laser systems [12]. The line energy following the equation
L i n e   E n e r g y   L E = P a v g v c d s p o t   J c m 2
describes the energy per area, in this case, the energy introduced along the cutting line. This parameter can be used as a quantitative comparison of the scalability of the cutting speed or as a measure of the energy required to completely cut the material. In the course of this work, the line energy is used as a means of comparison between the nanosecond laser and the picosecond laser. First, the line energy of the nanosecond laser was calculated and then the same line energies were determined for the picosecond laser by adjusting the cutting velocity.

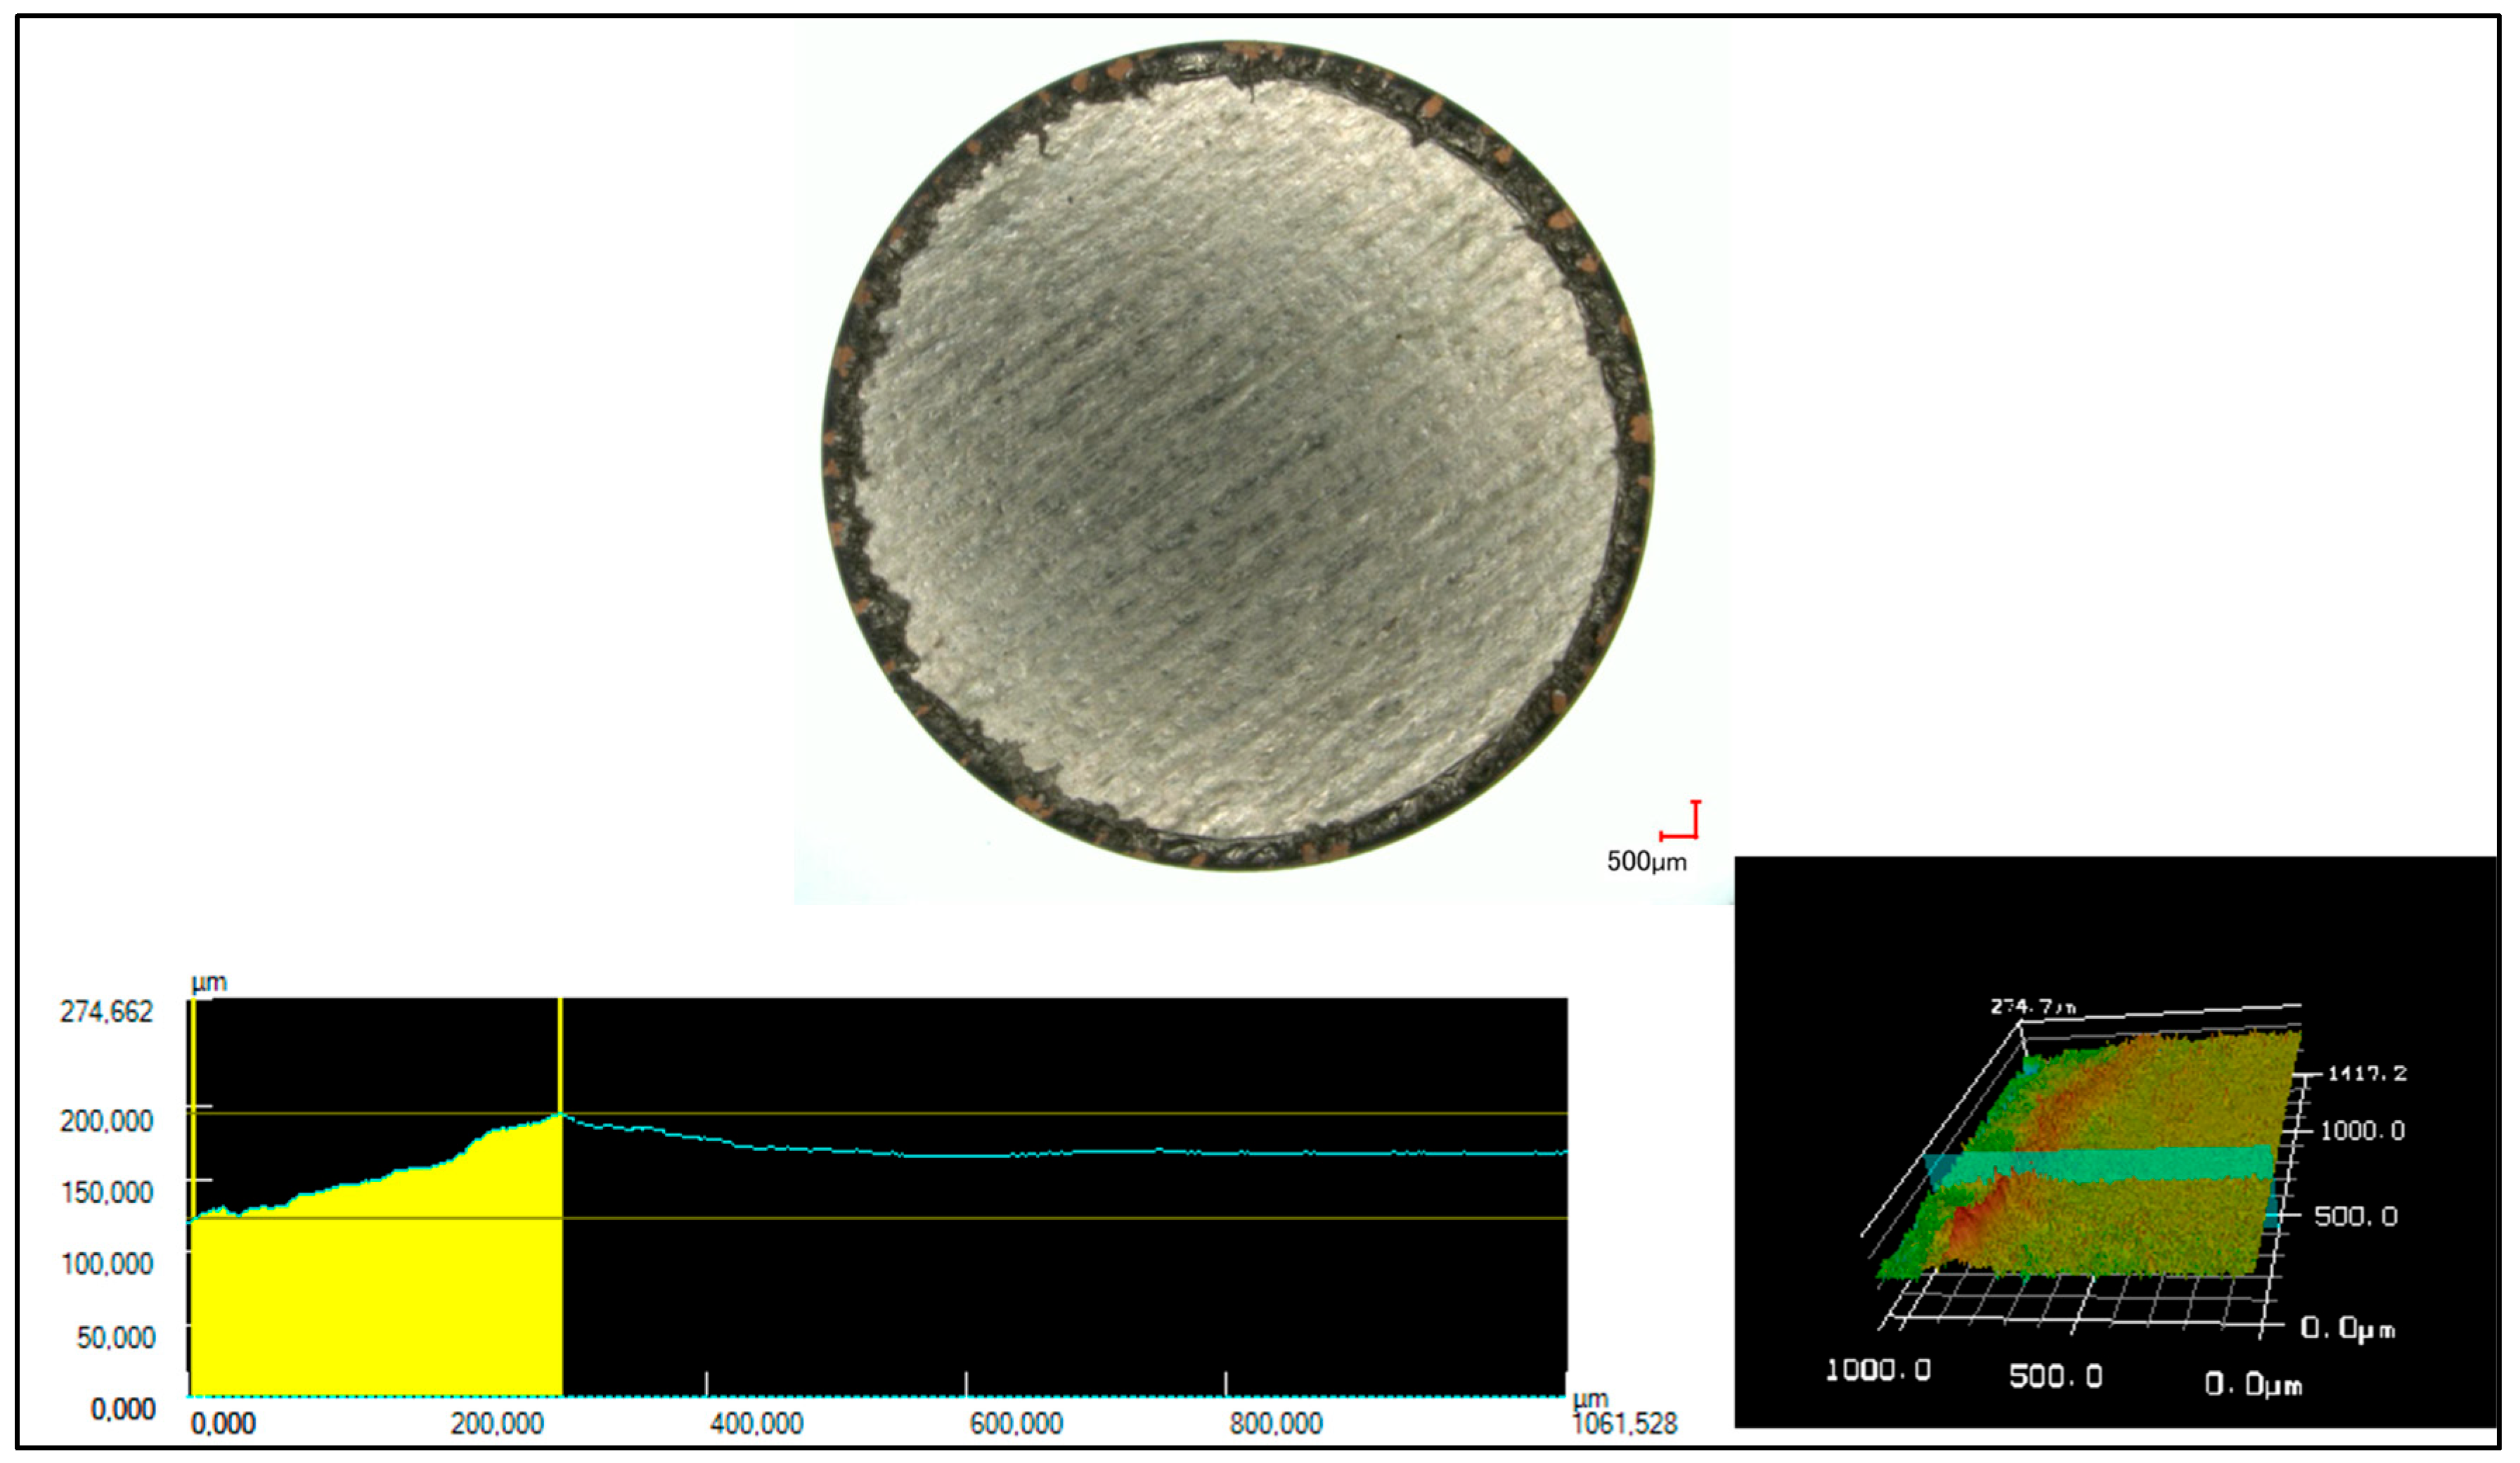
3.3. Analysis of Cutting-Edge Characteristics

A digital light microscope (Keyence, Osaka, Japan) on the one hand and a confocal laser scanning microscope (LSM) (Keyence, Osaka, Japan) on the other hand are used to examine the cutting-edge characteristics. The light microscope images are used to quantify both the melt formation and the heat-affected zone. For this purpose, measurements are taken at 10 points along the cutting edge, and the arithmetic mean is calculated. For this evaluation, 6 test samples per parameter set were used. The LSM images are used to quantify the melt elevation (Figure 1).

3.4. Electrochemical Setup

Symmetrical Li|Li half cells were used for the test cell construction. The working electrode here is the laser-generated anode with a diameter of 12 mm. The counter electrode is an 18 mm mechanically separated lithium metal. To ensure reproducibility and account for sample-to-sample variations, five independently prepared cells were tested for each electrode type, including the mechanically separated reference. The values reported in this study represent the arithmetic means of these measurements. The assembly of the electrode took place under argon atmosphere. PAT Cells (EL-Cell, Hamburg, Germany) were used as cell housings. The liquid electrolyte was 100 µL LiPF57 + 2% VC + 10% FEC and a glass fiber separator.
For a 12 mm lithium anode, a specific capacity Q s p e c . 12 m m of 4.2 mAh was calculated by the following equation:
Q s p e c . 12 m m = Q t h e o r e t i c a l _ l i t h i u m m l i t h i u m
whereby Qtheoretical_lithium is equal to 3860 mAhg−1, and mlithium is equal to the mass of the lithium on the used joint lithium copper. In the first charging step, the counter electrode is discharged, and the working electrode is charged. Both charging and discharging took place at 1.05 mA per hour. The electrochemical performance of the electrodes was subjected to a comparative analysis across a total of 15 complete cycles. While 15 cycles may appear to be limited in terms of long-term stability when compared with other active materials, this number is considered noteworthy and representative for Li|Li symmetric cells operated under unmodified conditions. The cycling stability of such cells is strongly influenced by factors including lithium thickness, current density, the separator chosen, and the electrolyte used. In the absence of dedicated modifications or stabilization strategies, Li|Li cells characteristically undergo merely a limited number of cycles prior to the occurrence of excessive dendrite growth, which in turn results in increased overpotentials and consequently leads to internal short circuits [35,36,37].

4. Results and Discussion

4.1. Characterization of the Cutting-Edge Characteristics

In most cases, the cutting edge can be subdivided into distinct regions, as illustrated in Figure 2. Each area is distinguished by the distinct laser–material interaction that has occurred therein. The nature of this interaction is determined by the distance to the kerf, the thermal conductivity of the material, and the selected laser parameters. The subsequent sections will meticulously examine and evaluate the distinct regions and the dependence of the employed laser parameters.

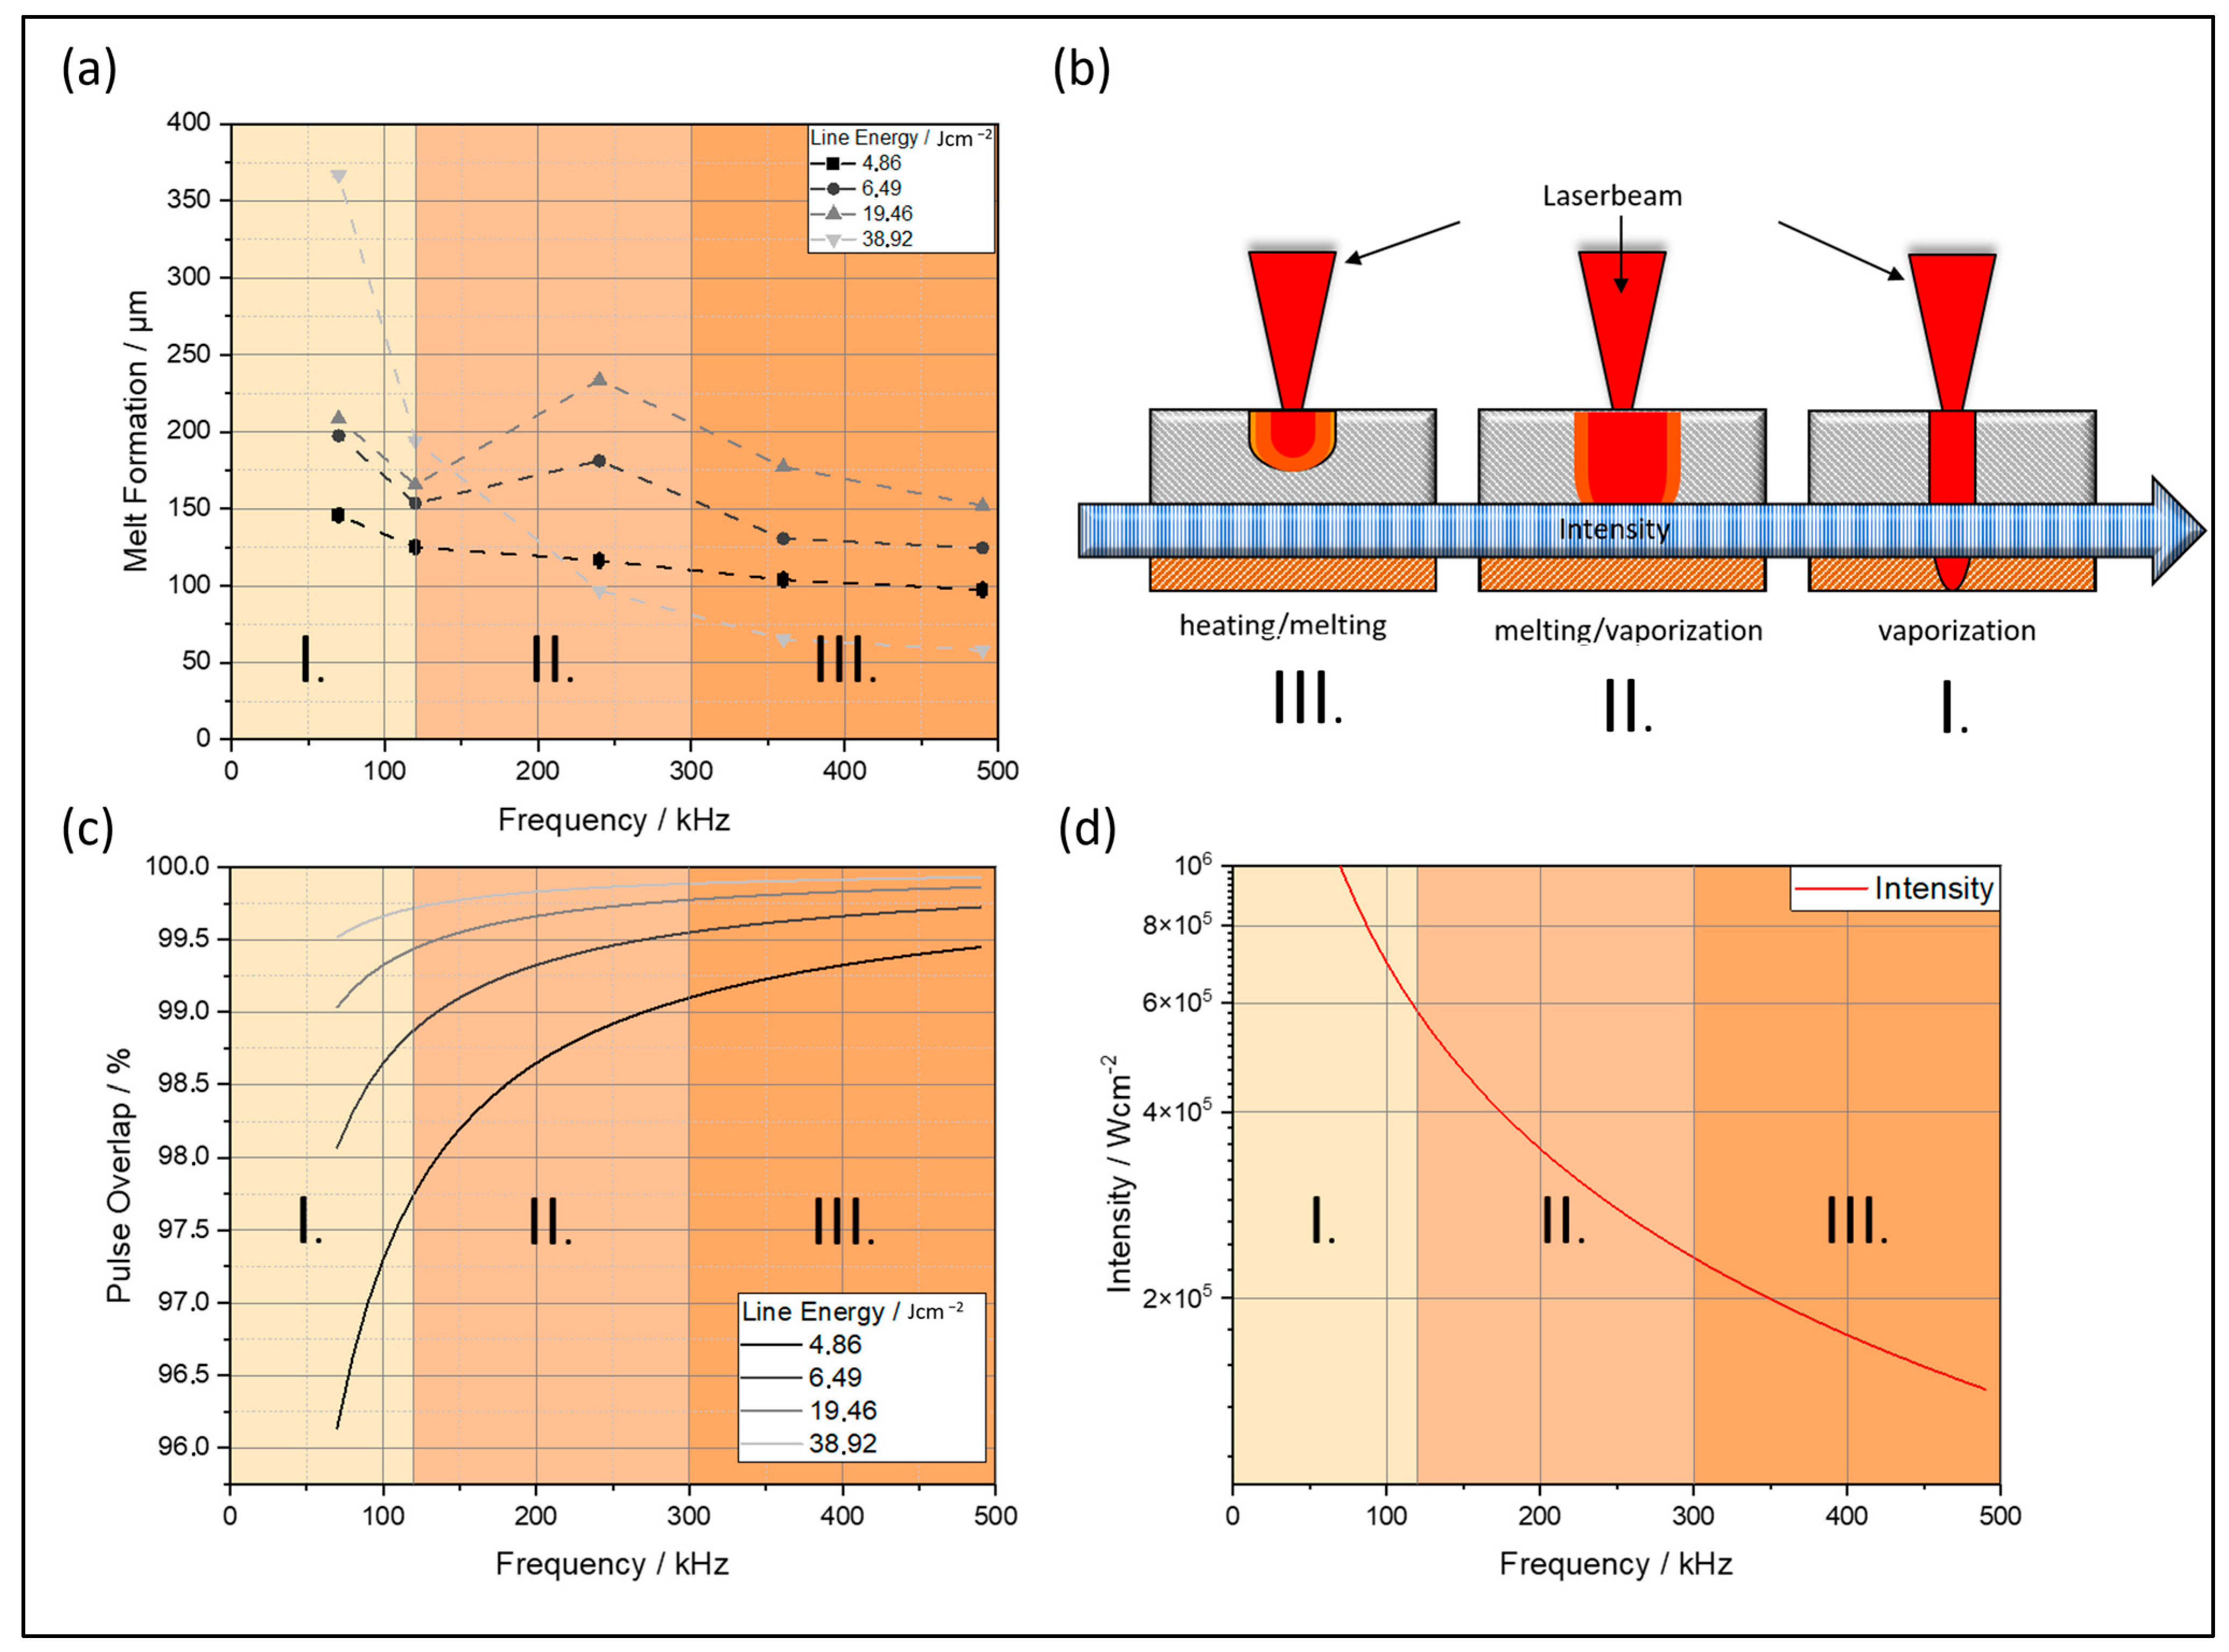
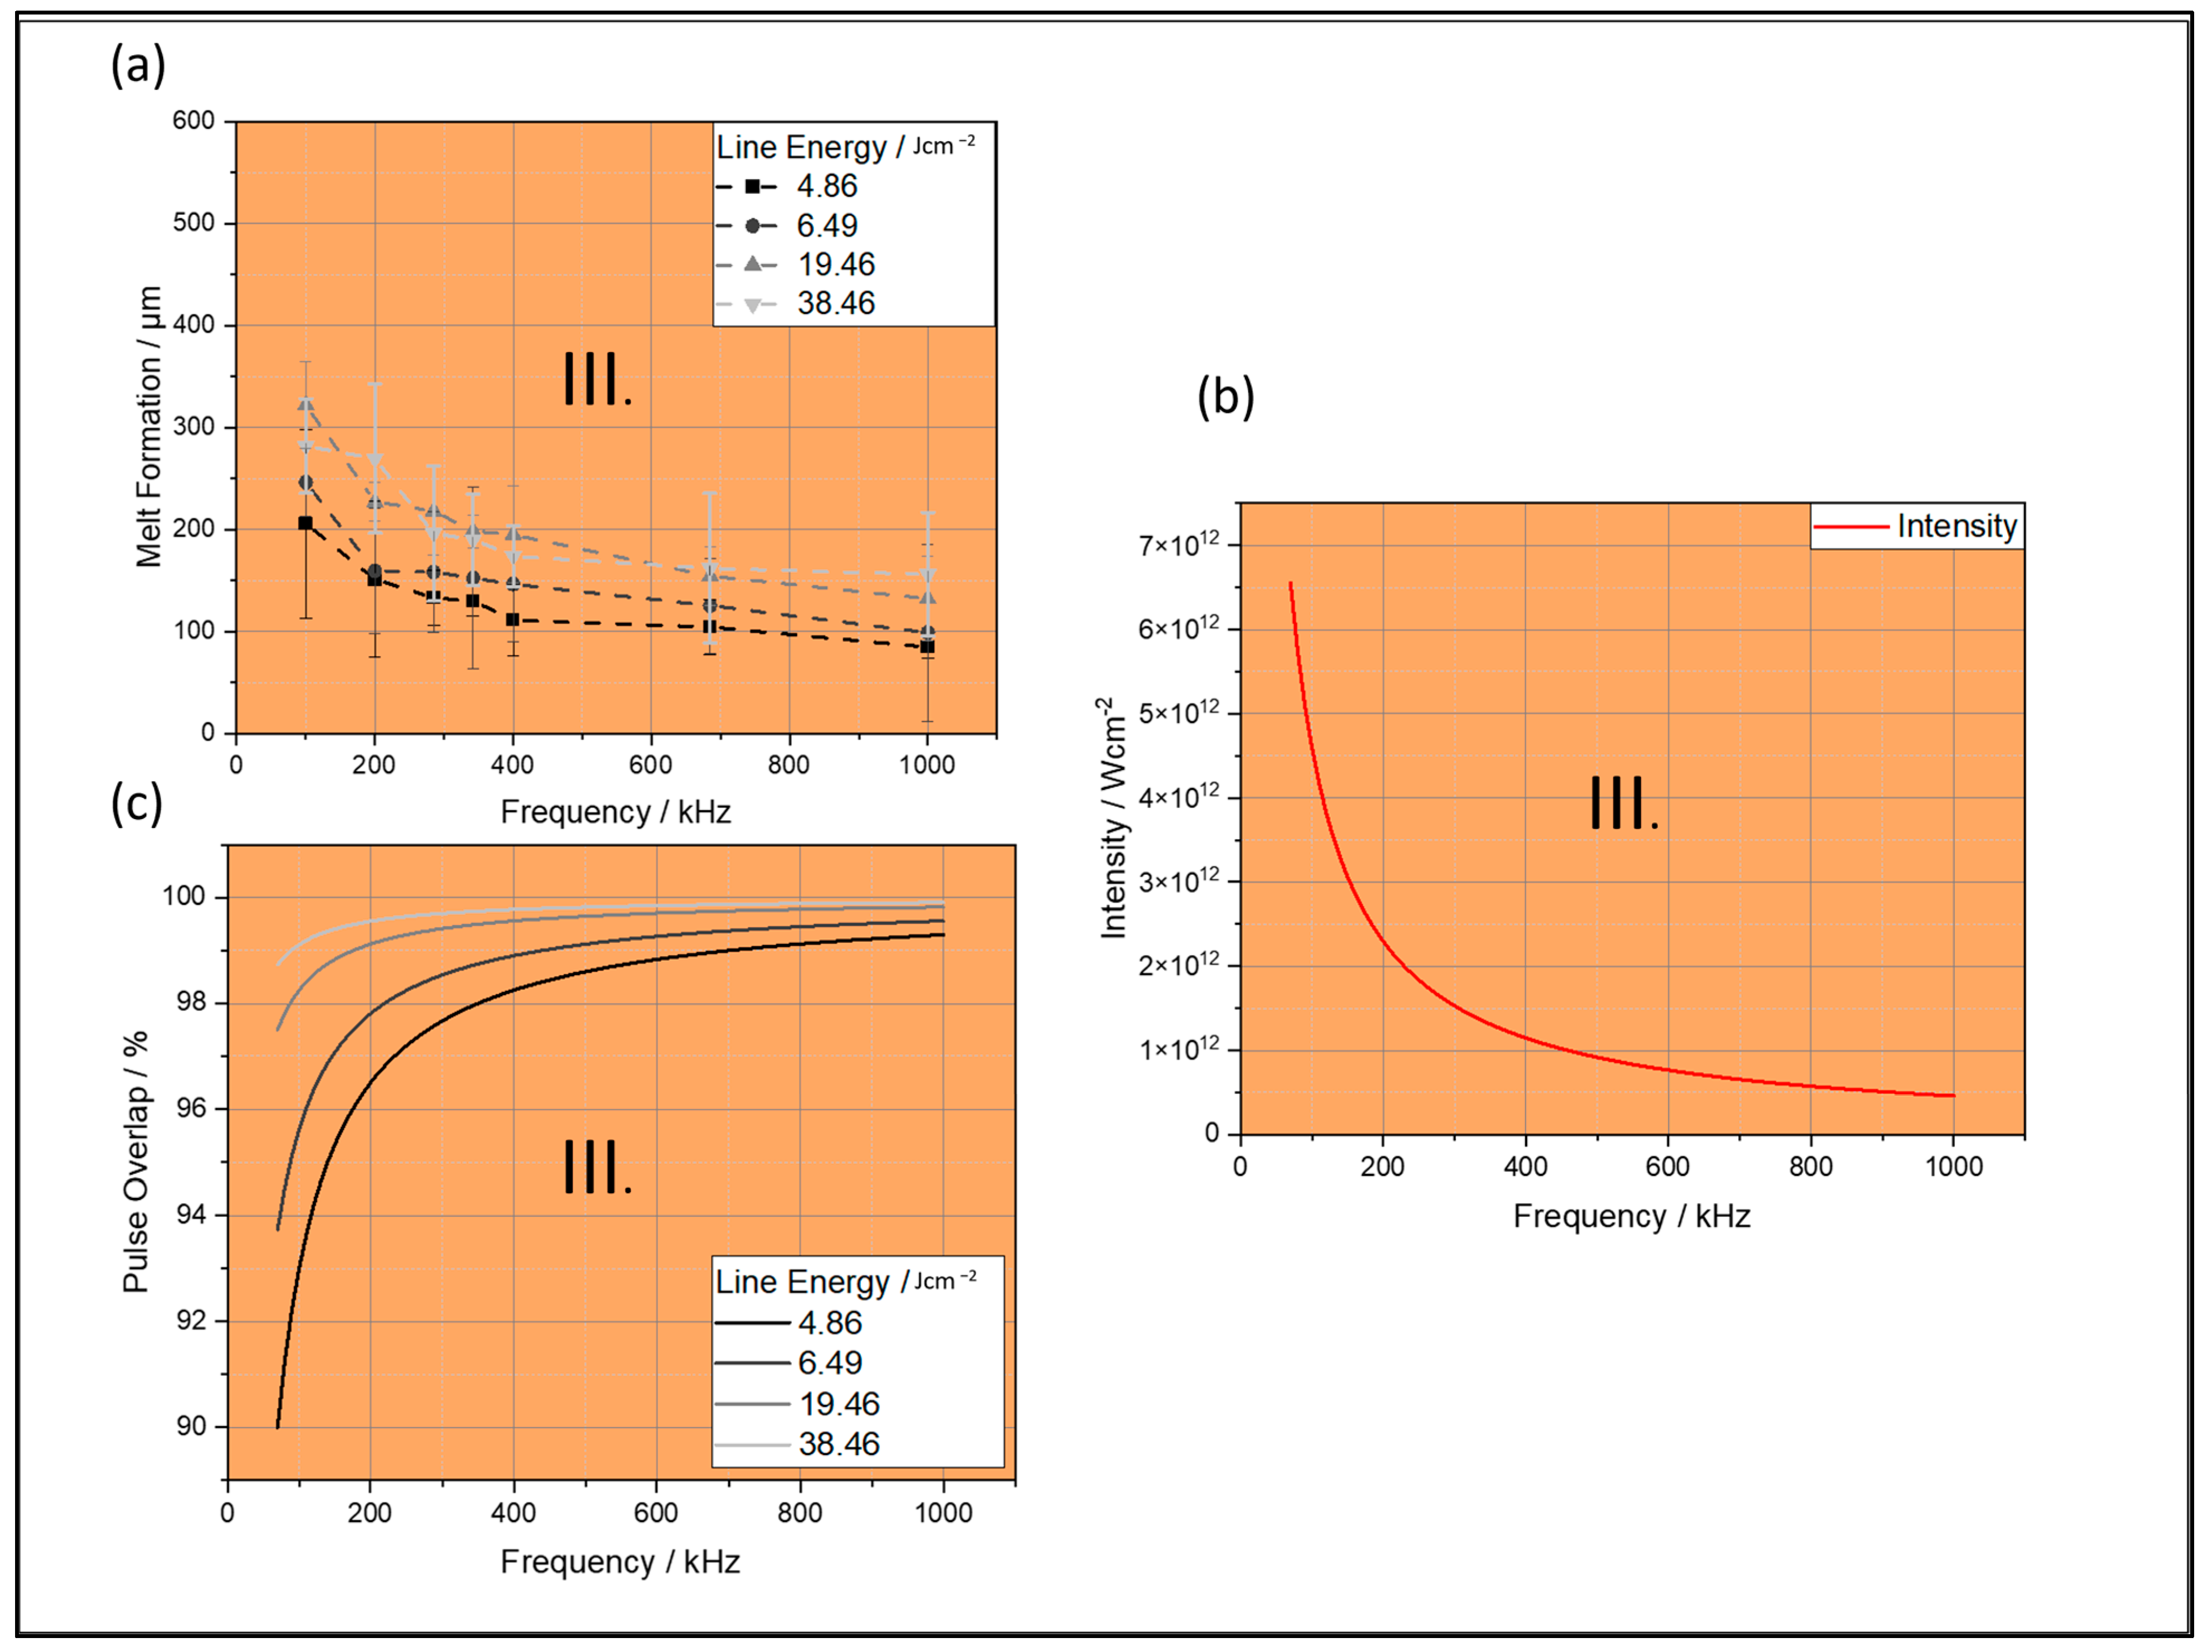
4.1.1. Melt Formation

The melt formation area is defined as the range in which the thermal energy influence and the heat transferred via thermal conduction are sufficient to melt the material but not to remove it completely [38]. Figure 3 illustrates the melt formation process for the pulsed nanosecond laser at varying frequencies and demonstrates the dependency of laser intensity.
As illustrated in Figure 3a, the melt formation over frequencies is contingent upon the line energy. Depending on the frequency, the melt formation can be divided into three ranges.
Low-frequency range (70–120 kHz, Figure 3a, I)
An increase in line energy leads to greater melt formation, with a maximum recorded width of 366 µm at 38.92 J·cm−2. This range is characterized by low pulse overlap (96.0–99.6%, Figure 3c, I) and high intensity (Figure 3d, I). As a result, vaporization becomes the predominant ablation mechanism (Figure 3b, I), and at sufficiently high intensities, phase explosion can occur—causing a rapid increase in ablation depth [40]. Melt formation occurs mainly at the beam edge due to residual thermal gradients. At low line energies and low pulse overlap, minimal energy is delivered per area, which results in negligible melt formation. With increasing pulse overlap, the melt width increases correspondingly.
Mid-frequency range (120–300 kHz, Figure 3a, II)
In this range, melt formation increases with higher line energies up to 19.46 J/cm2. The pulse overlap increases to between 98% and 99.8% (Figure 3c, II), while the intensity decreases compared with that in the low-frequency range (Figure 3d, II). The ablation mechanism shifts to a combination of melting and vaporization (Figure 3b, II). This behavior is influenced by intensity and pulse overlap. The presence of a vapor capillary can lead to melt displacement along the kerf, producing the observed peak in melt formation. These trends reflect varying degrees of thermal accumulation and corresponding ablation behavior [39,41].
High-frequency range (300–490 kHz, Figure 3a-III)
At higher frequencies, melt formation decreases again. This regime exhibits the highest pulse overlaps (Figure 3c, III) and the lowest intensities (Figure 3d, III). The dominant mechanism transitions to heating and surface melting (Figure 3b, III), where the energy input is insufficient for full melting or vaporization of the material. Consequently, only limited melt formation occurs. However, higher line energies lead to a moderate increase in melt width.
As illustrated in Figure 4, the process of melt formation is demonstrated for the pulsed picosecond laser under various frequencies. Additionally, the dependence of laser intensity is investigated.
Figure 4a shows that melt width decreases with increasing frequency for constant line energies. In contrast, increasing the line energy results in a significant increase in melt formation, ranging from 37% to 84% between 4.86 and 38.46 J cm−2.
This effect can be attributed to the laser intensities used, which exceed the evaporation threshold of 6 × 10⁵ J cm−2 (Figure 4b). Accordingly, vaporization is the dominant ablation mechanism. Within this intensity range, secondary parameters, such as pulse overlap, play a significant role in determining the extent of melt formation. Figure 4c shows that greater pulse overlap leads to increased melt width even at constant line energies.
A comparison with the nanosecond laser system shows that the latter produces the smallest melt formations, around 50 µm at 490 kHz and 38.92 J·cm−2. However, the picosecond laser, operating at lower line energies, also demonstrates the potential to minimize melt formation. Further investigation is therefore recommended to determine whether melt formation can be reduced at line energies below 4.86 J cm−2.

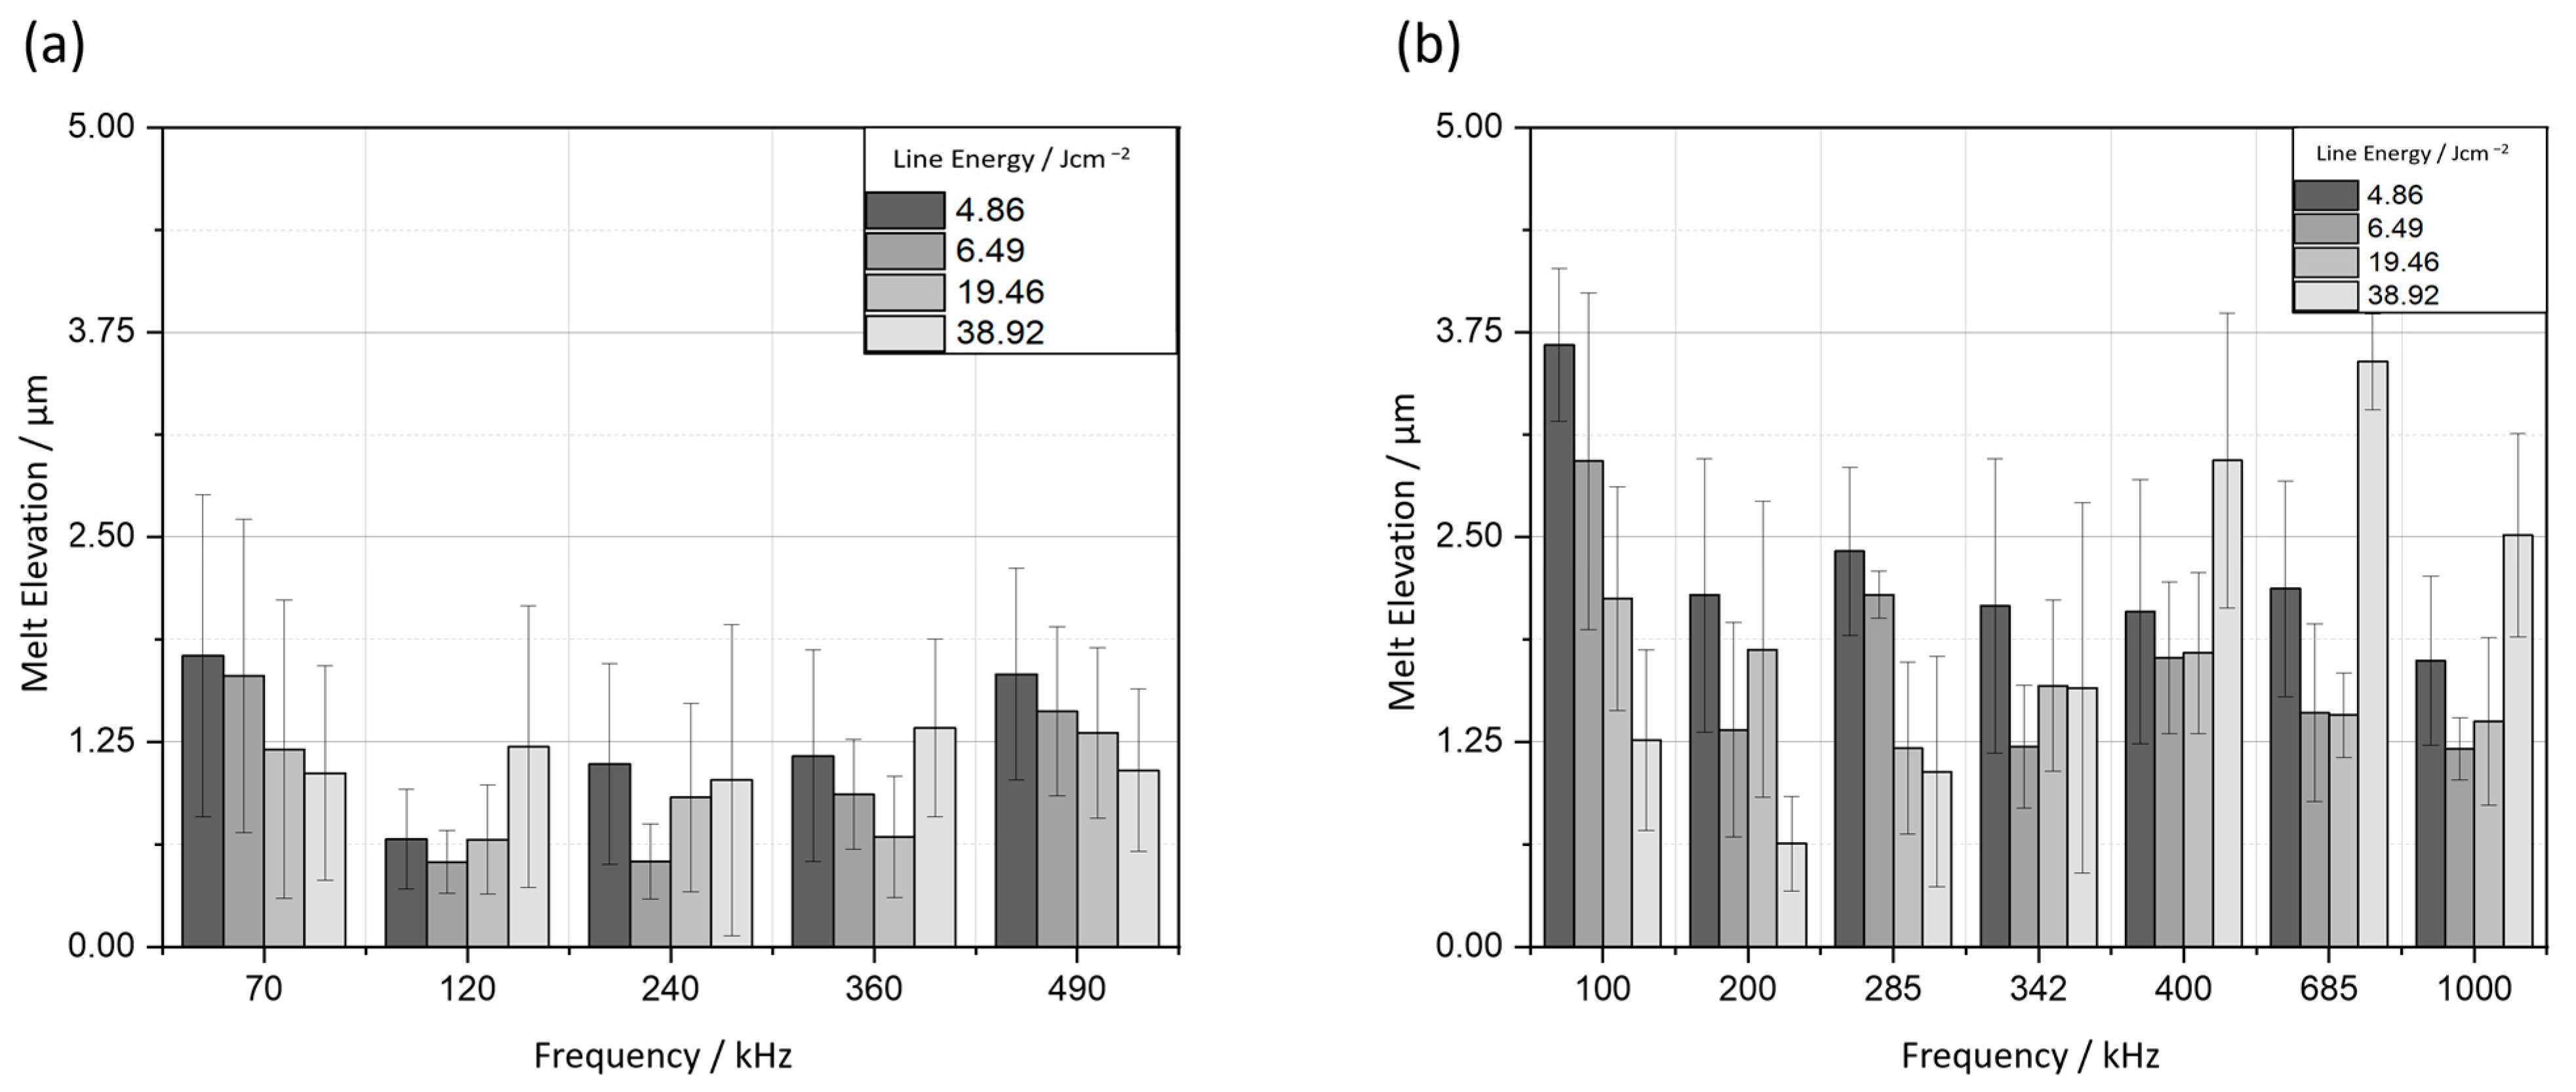
4.1.2. Melt Elevation

The melt elevation is the area in which the displaced melt from the cutting line is accumulated, a phenomenon that arises from the laser–material interaction. In this context, the maximum elevation of this accumulation is designated as the melt elevation. The alteration in topography gives rise to a modified surface area. The impact of the augmented surface area on electrical resistances has been the subject of prior investigation [42]. Elevated surface areas have been shown to result in increased resistances, which can potentially lead to diminished electrochemical performance. Consequently, the augmentation in melt elevation is a critical factor that must be considered.
As illustrated in Figure 5, the melt elevation is depicted as a function of the frequency, held constant at specific line energies, for both the nanosecond laser system and the picosecond laser system. For the nanosecond laser, it is evident that the melt elevation increases. When the standard deviation is taken into account, the melt formation is found to be within a range of 0.5 and 1.5 µm for all frequencies. Within the frequency range designated as (I), which is primarily characterized by vaporization, the lowest observed melt formation is evident. Conversely, in ranges II and III, an increase in melt elevation is observed. In comparison, a general statement cannot be made for the picosecond laser. The high intensity of the picosecond laser, ranging from 0.5 × 10⁻¹² to 6 × 10⁻¹² Wcm−2, results in significantly larger melt buildups in the edge areas of the kerf than those for the nanosecond laser. Consequently, higher melt formations are generated between 0.75 and 3.6 µm. The impact of pulse duration and the assumed cold ablation process for the picosecond laser cannot be discerned with respect to melt formation. Two explanations can be postulated for this observation. In the case of the nanosecond laser, significantly lower melt formations are generated due to the lower intensity levels observed. The Gaussian intensity distribution of the laser beam gives rise to significantly higher-intensity gradients at the beam periphery, where the phenomenon of localized melting of the material becomes particularly evident [12]. The impact of pulse duration and the assumed cold ablation process for the picosecond laser cannot be directly correlated with the observed melt elevation. It is assumed that two complementary mechanisms may provide a satisfactory explanation for the phenomenon under investigation. Firstly, there is the possibility of localized melting at the beam periphery due to residual thermal gradients within the Gaussian intensity distribution. Secondly, there is the possibility of re-deposition of ablated material, a phenomenon that has been frequently reported in ultrafast laser processing [43]. Despite the prevailing consensus that picosecond laser ablation is generally associated with reduced thermal effects and a smaller heat-affected zone, it is important to note that these secondary effects can occur even in regimes dominated by non-thermal ablation mechanisms. In order to provide further clarification regarding the contribution of each mechanism, high-speed imaging of the cutting process is planned in future investigations.

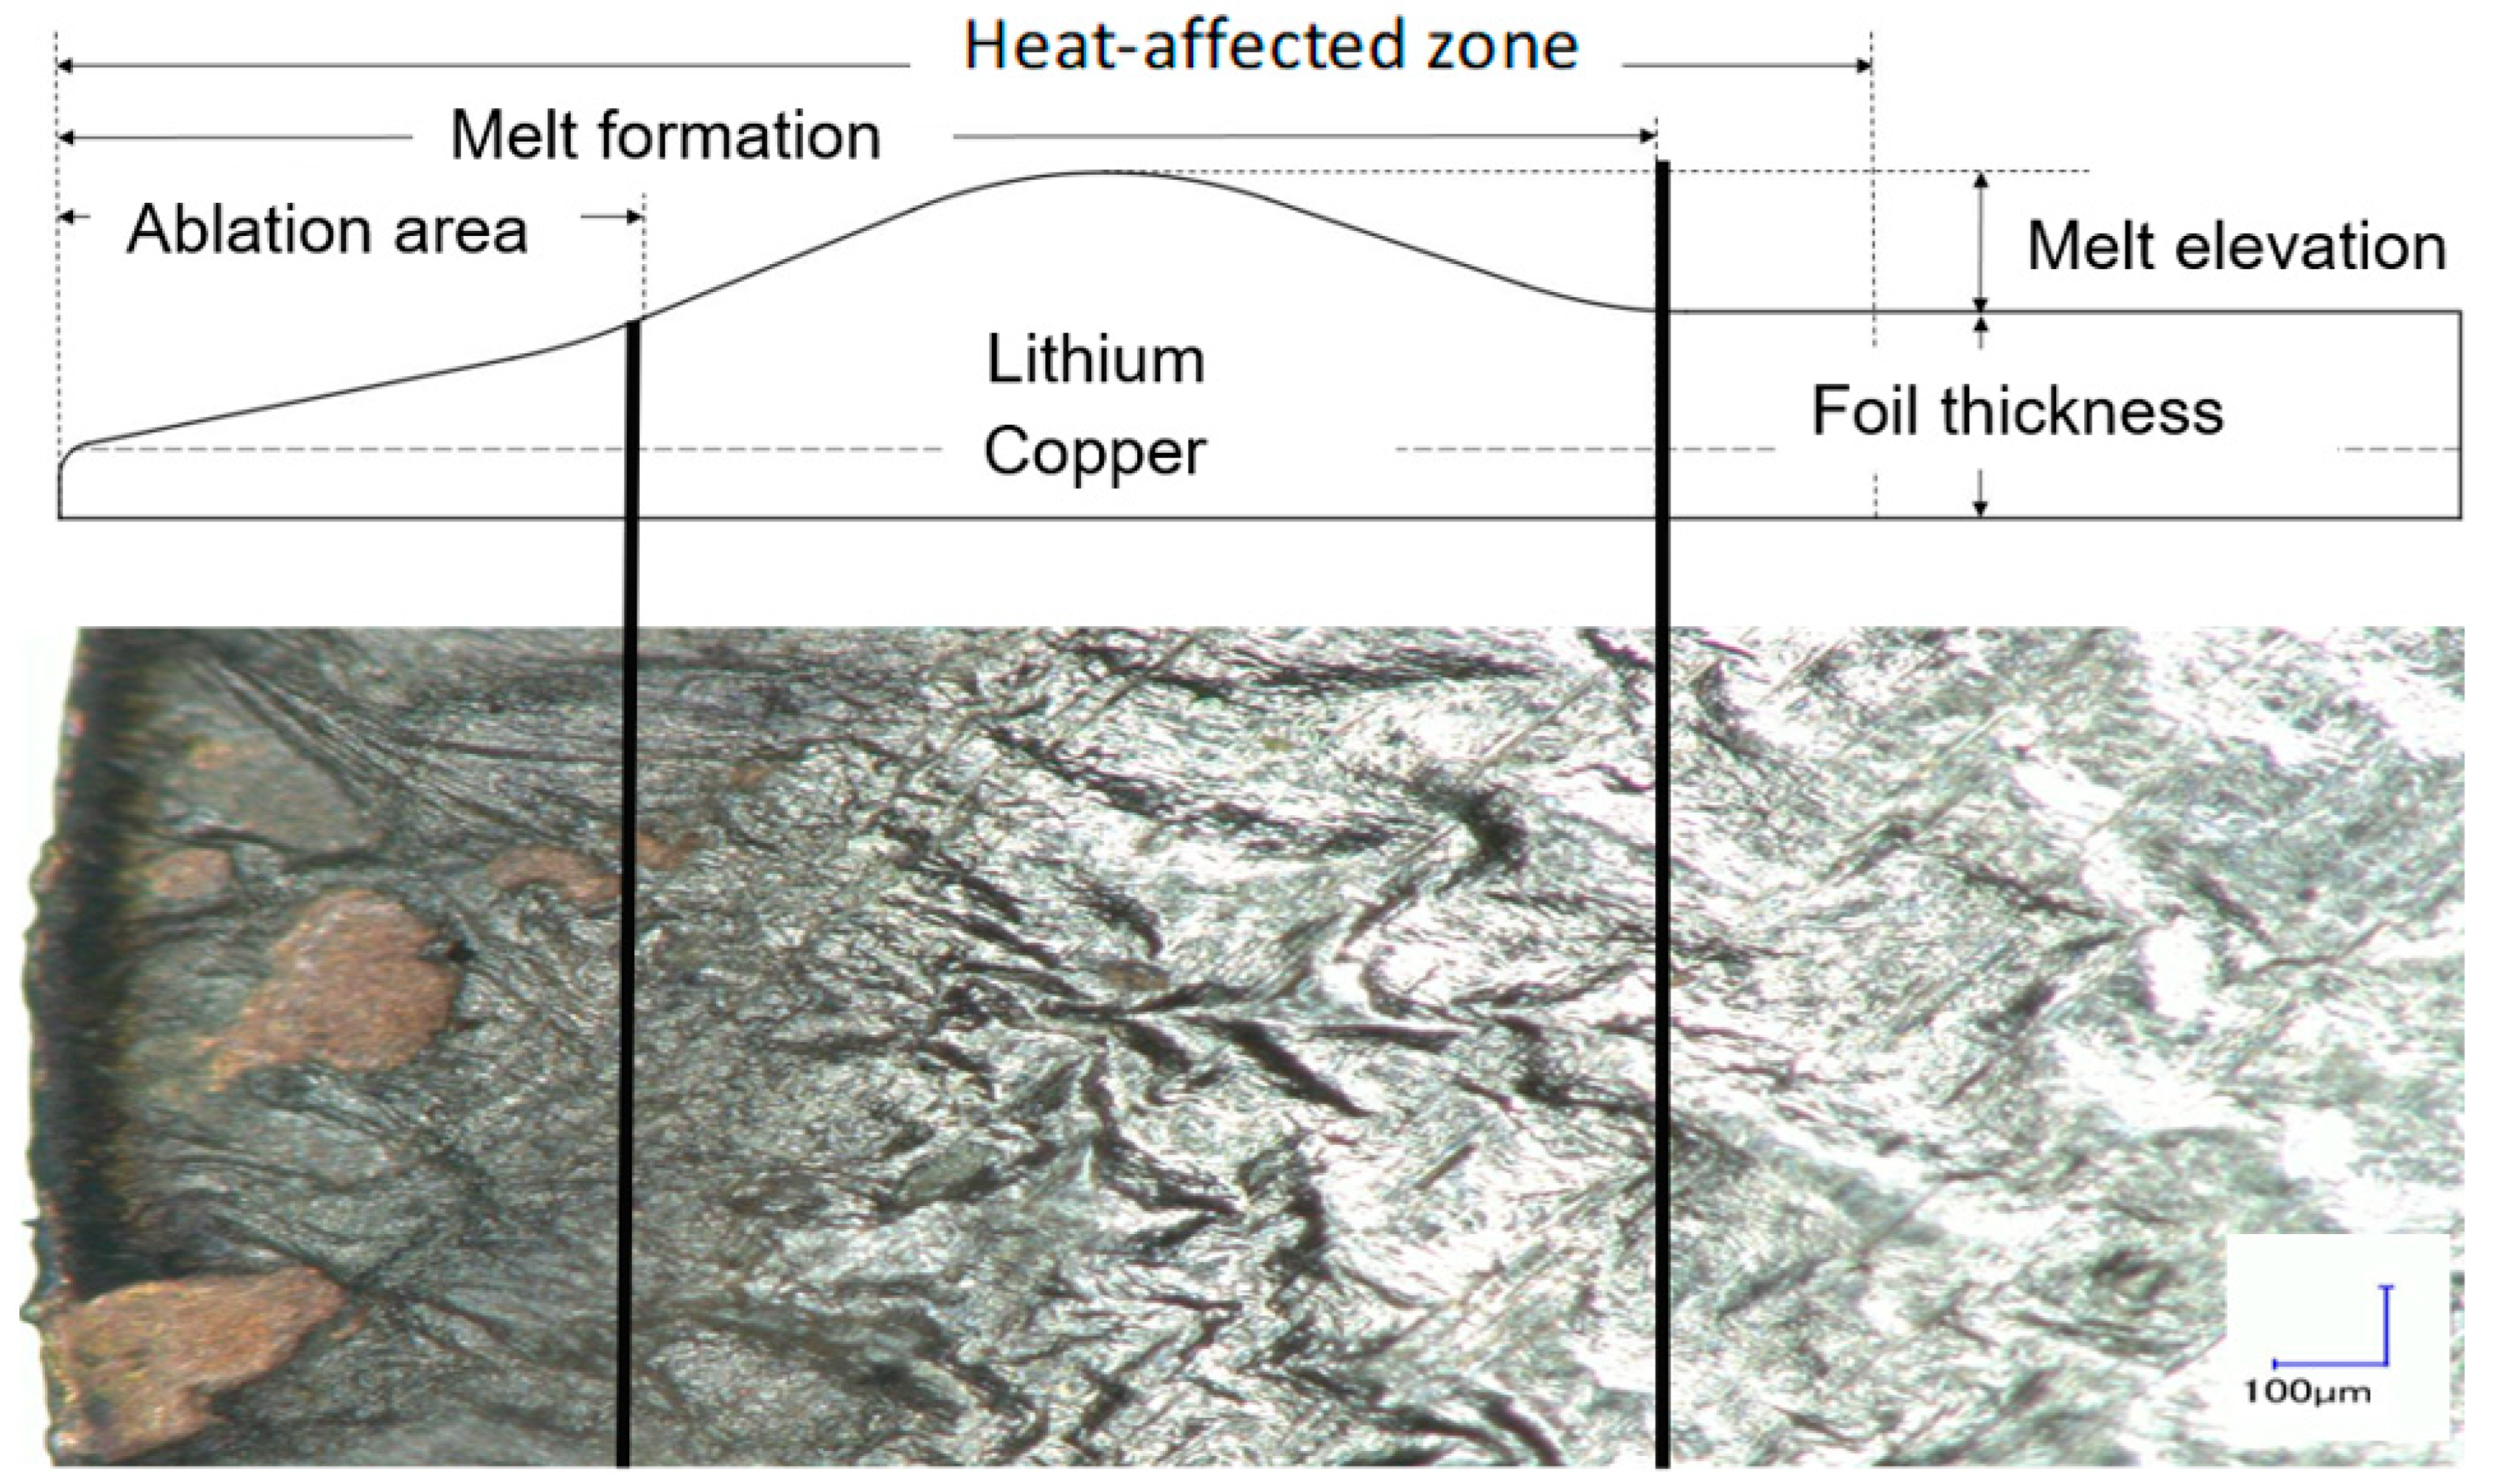
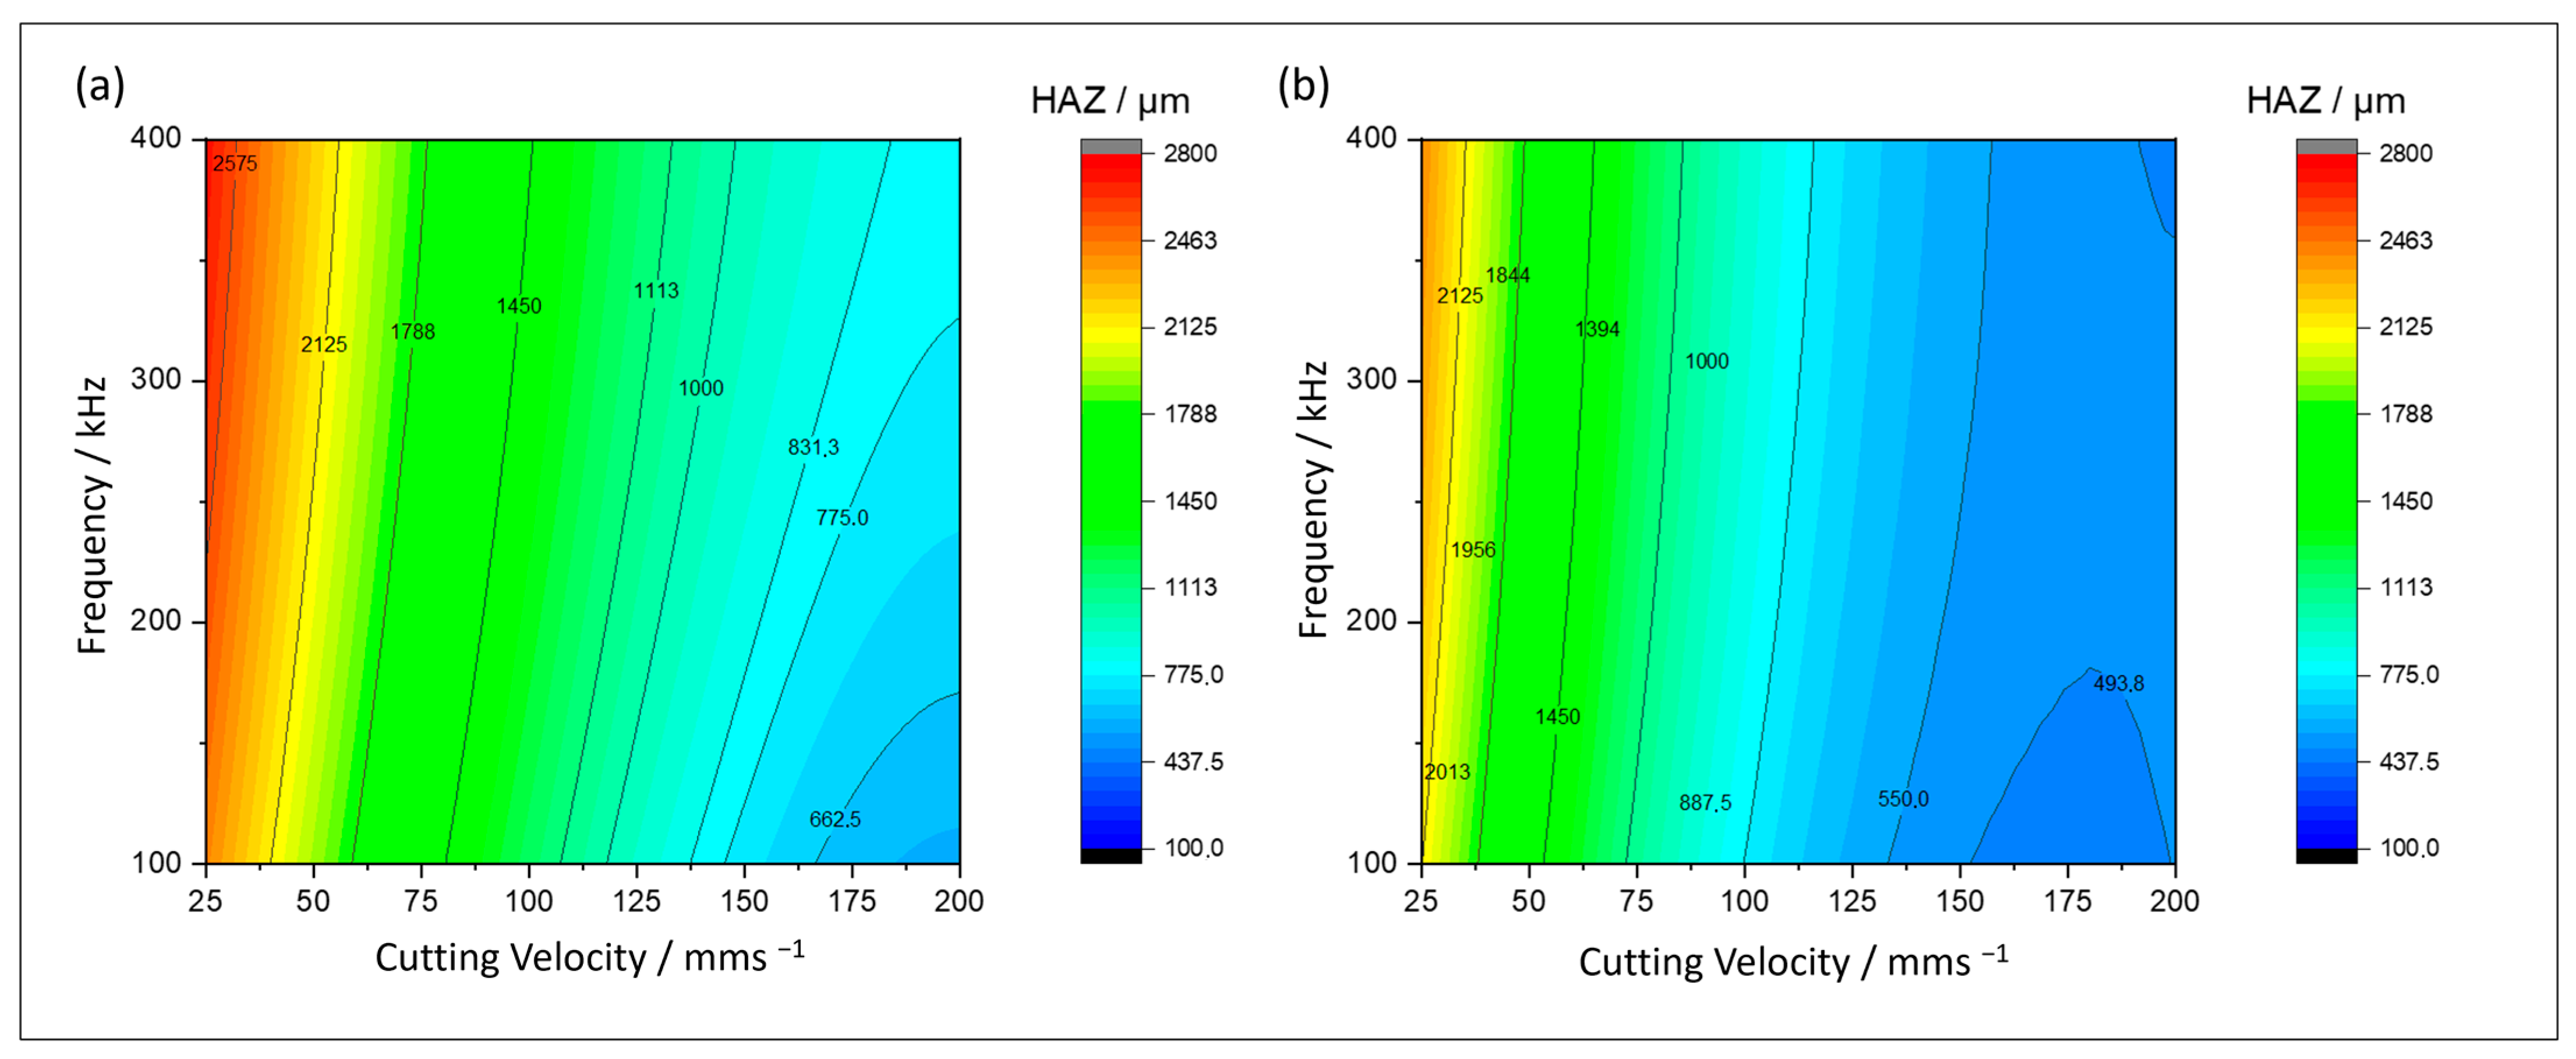
4.1.3. Heat-Affected Zone

The heat-affected zone (HAZ) is the area that was entirely affected by the thermal energy of the laser beam. Given that the surface has undergone a transformation due to the interaction between the laser and the material, this may also have implications for the electrochemical performance. It has previously been demonstrated that, for composite-based electrodes, no discernible influence of the heat-affected zone on the electrochemistry exists [6]. However, in this study, the focus is on lithium metal. The reactive nature of lithium, an alkali metal, leads to its interaction with the surrounding medium during the laser cutting process. This process may result in the formation of various lithium compounds, including lithium oxides, lithium hydroxides, and lithium nitrides. The resulting compounds exhibit varying degrees of ionic resistance, thereby resulting in a shift in the electrochemical performance, contingent upon the extent of the heat-affected zone [44,45]. However, in the present study, laser processing was carried out under defined dry room conditions (dew point −30 °C), thereby minimizing the likelihood of uncontrolled surface reactions with ambient gases. An investigation was previously conducted into the potential influence of atmospheric conditions on lithium compound formation [46]. Therefore, it is concluded that the presence of surface compounds within the controlled conditions defined in this particular context does not have a significant influence on the electrochemical behavior investigated.
The influence of the pulse-repetition frequency and the cutting velocity for the nanosecond- and picosecond-pulsed laser is demonstrated in Figure 6. For the nanosecond laser system, the model for the description of the heat-affected zone could be fitted with an adjusted R2 = 0.96. The findings of this study indicate that the heat-affected zone decreases with increasing cutting velocity. The model indicates that the heat-affected zone is smallest (636 µm) at a velocity of 187.5 mms−1 and 100 kHz. The minimum measured heat-affected zone was obtained at the maximum velocity of 200 mms−1 and a pulse-repetition frequency of 120 kHz. The secondary laser parameters were configured to 200 mms−1 and 120 kHz, resulting in the lowest line energy of 4.86 Jcm−2 and the lowest pulse overlap of 97.75%. A low line energy and a low pulse overlap result in a low energy input per surface increment and, consequently, a small heat-affected zone [47].
For the picosecond laser, a model for the description of the heat-affected zone could be fitted with an adjusted R2 = 0.98. This model demonstrates that lower heat-affected zones are obtained at higher cutting velocities. The influence of the frequency is nearly negligible at this juncture. With increasing frequencies, the heat-affected zone increases only marginally. This phenomenon can be attributed to the picosecond laser’s rapid excitation of lithium metal electrons, which results in minimal energy transfer to the solid-state lattice. Consequently, at elevated frequencies, there is no observable accumulation of heat, resulting in a heat-affected zone of reduced dimensions.

4.2. Electrochemical Performance of Laser-Cut Lithium Metal Anodes

In this investigation, the laser–material interaction leads to an oxidation process of the surface of the lithium metal. Consequently, this may have resulted in altered surface chemistry along the heat-affected zone.
Furthermore, the increase in melt elevation signifies the minimum diffusion distance. In accordance with the Le Chatelier principle, lithium ions will take the shortest path [48], thereby influencing the melt elevation as part of the lithium metal. This phenomenon is known to promote the growth of dendrites.
The subsequent subsections will delve into the influence of the cutting edge on the electrochemical performance of laser-generated anodes. The focus will be on two categories: laser-generated anodes with the lowest detectable thermal influence due to the laser cutting process (Section 4.2.1) and laser-generated anodes with the most distinctive cutting-edge characteristics in terms of the heat-affected zone and the melt elevation (Section 4.2.2).

4.2.1. Melt Formation

To facilitate a comparison of the cutting edges with the lowest thermal influence with a mechanically separated electrode, anodes with the following characteristics were the focus of electrochemical investigation (see Table 2).
As illustrated in Figure 7, the various cyclic voltammograms for the symmetric half cells are presented. At the onset of cell cycling at a capacity of 0 mAhg−1 (Figure 6a), the highest cell voltage is observed for all electrodes. This indicates that the presence of a high resistance is attributable to the smooth electrode surface area and the formed SEI [17].
It is noteworthy that the cell voltage undergoes a decline only when lithium separates from the lithium bulk of the counter electrode. For the lithium anodes under investigation, the cell voltage ranges from 0.09 to 0.12 V, exhibiting a modest slope. The mechanical reference shows the highest cell voltage, while the nanosecond anode exhibits the lowest. The voltage gradient is nearly linear, as lithium is present here unobstructed, having first overcome the resistance on the pre-existing lithium [17,49].
At a capacity of 4.2 mAh, the distinct separated anodes attain varying end voltages: 0.14 V for mechanical, 0.11 V for ns-laser, and 0.09 V for ps-laser.
After reaching the final capacity of 4.2 V, a change of polarity takes place towards the discharge phase [50]. In this phase, the working electrode, the laser-separated electrode, is discharged. A local minimum of the cell voltage may be identified during this period, as the ionic resistance must be surmounted to facilitate the formation of the SEI. However, the voltage extremum is lower than that in the charging phase (0.06 V vs. 0.35 V), as the lithium surface becomes uneven due to the deposition of lithium from the counter electrode onto the working electrode. The deposition of lithium leads to an expansion of the specific surface area of the working electrode, thereby increasing the contact points with the liquid electrolyte [51]. The voltage curve, ranging from 4.2 mAh to 1.2 mAh, exhibits a low gradient due to the unobstructed deposition of lithium by the formed dendrites. Subsequent to the removal and degradation of a substantial proportion of the lithium dendrites, a concomitant rise in both the ionic resistance and the cell voltage becomes evident, as evidenced by the 1.2 V observed for all anodes. Subsequently, lithium deposition from the bulk lithium commences. The observed rise in voltage can be attributed to the presence of dendrites at the surface of the working electrode, which impede lithium diffusion and augment ionic resistance. At this juncture, the distinct influences and characteristics of the laser separation become discernible. The highest voltage of 0.22 V is observed for the ns-laser-cut anodes, while the lowest voltage of 0.19 V is recorded for mechanically separated electrodes.
In the second cycle (Figure 7b), it is evident that the initial local maximum at a capacity of 0.0 mAh has diminished by approximately 50% on average compared with that in the first charged cycle (Figure 7a). The onset of dendrite growth on the surface of the counter electrode is also observed, resulting in an increase in surface area. In comparison to the initial cycle, the cell voltage curve exhibits a reduced slope and a substantially lower minimum cell voltage (0.04 V vs. 0.09 V). The enhanced contact points with the liquid electrolyte facilitate the facile diffusion of lithium ions to the working electrode. Analogous to the discharge phase, a second local minimum occurring there in the initial cycle (Figure 7a, at 4.2 V) is now accompanied by a second local maximum (Figure 7b, at 4.2 V). In this region, the deposition of lithium and its subsequent diffusion to the working electrode are impeded by the growth of lithium dendrites, which generate a substantially extended lithium-ion diffusion path. This, in turn, leads to an increase in both the ionic resistance and the cell voltage [21,52].
The cell voltage curves of the 10th and 15th cycle demonstrate a comparable range. During the charging phase from the counter electrode to the working electrode, the influences of the cutting edges become apparent in the second local maximum. This observation underscores the significance of distinguishing between the diffusion process to the working electrode and the cell voltage curves during the charging phase. For mechanically separated electrodes, a higher cell voltage is required to overcome the ionic resistance, which peaks at 0.3 V during the 15th cycle. In contrast, for laser-generated electrodes, the cell voltage remains in a similar range, peaking at around 0.25 V. This observation indicates that the mechanically separated electrodes undergo a more pronounced aging phenomenon than the laser-generated electrodes. This observation is further substantiated by examining the post-mortem recordings of the cyclized working electrodes depicted in Figure 8.
As illustrated in Figure 8, post-mortem images of the cyclized lithium anodes are presented. For the mechanically separated anodes, an accumulation of a black surface can be seen after the second cycle. Subsequent to 15 cycles, a transition from a silvery appearance to a darker hue is evident, accompanied by the aggregation of the black areas into darker clusters. This phenomenon is indicative of lithium degradation. This lithium is present on the surface and is no longer capable of participating in further reactions. The presence of dead lithium has been shown to extend lithium-ion diffusion paths, leading to an increase in both ionic resistance and cell voltage [31,33]. This phenomenon is exemplified by the observation of a maximum peak at 0.3 V during the 15th cycle, as depicted in Figure 7d.
In the context of the nanosecond-pulsed laser system, the electrode edge adopts a predominant secondary position. In contrast to the mechanically separated electrode, fewer dark accumulations are visible on the surface. Following 15 cycles, the dark edge exhibits a further darkening, and accumulations become discernible. This area, exposed to the thermal energy of the laser, is known to be particularly vulnerable. As illustrated in Figure 8, the presence of a heat-affected zone is particularly evident in the area most susceptible to the formation of dead lithium. This phenomenon can be attributed, at least in part, to the increased surface roughness at the edge region, resulting from the melting and solidification of lithium. This leads to an augmented surface area, which may enhance the process of dendrite formation. The enhanced contact points with the liquid electrolyte facilitate the diffusion of lithium ions to the working electrode, leading to the formation of dendrites. This phenomenon, consequent to enhanced contact with the liquid electrolyte, culminates in the formation of dead lithium at the periphery during the cyclization process. In the case of the picosecond laser, a dark border becomes apparent around the anode after the second cycle. Subsequent to 15 cycles, this edge exhibits a heightened degree of darkness, while the area itself appears to remain unaltered in size. Furthermore, the number of dark clusters on the surface is comparatively minimal after two and fifteen cycles, respectively, in contrast to the mechanical and nanosecond laser cases. Given the relatively minor heat-affected zone, which measures 511 µm and is smaller than that of the nanosecond laser system (636 µm), it can be posited that a reduction in the heat-affected zone leads to a diminished interactive surface for lithium ions. It appears that the heat-affected zone and the associated increase in surface roughness led to a reduction in the spread of dead lithium at the edges. Alternatively, the augmented melt elevation resulting from the energy deposition of the picosecond laser (2.08 µm) in comparison to the nanosecond laser (1.21 µm) might have diminished the lithium conduction pathways, thereby facilitating preferential accumulation of lithium ions in these regions. With respect to the cell voltage, no discernible difference between the nanosecond and the picosecond lasers can be found, despite the optically strongly different post-mortem images.

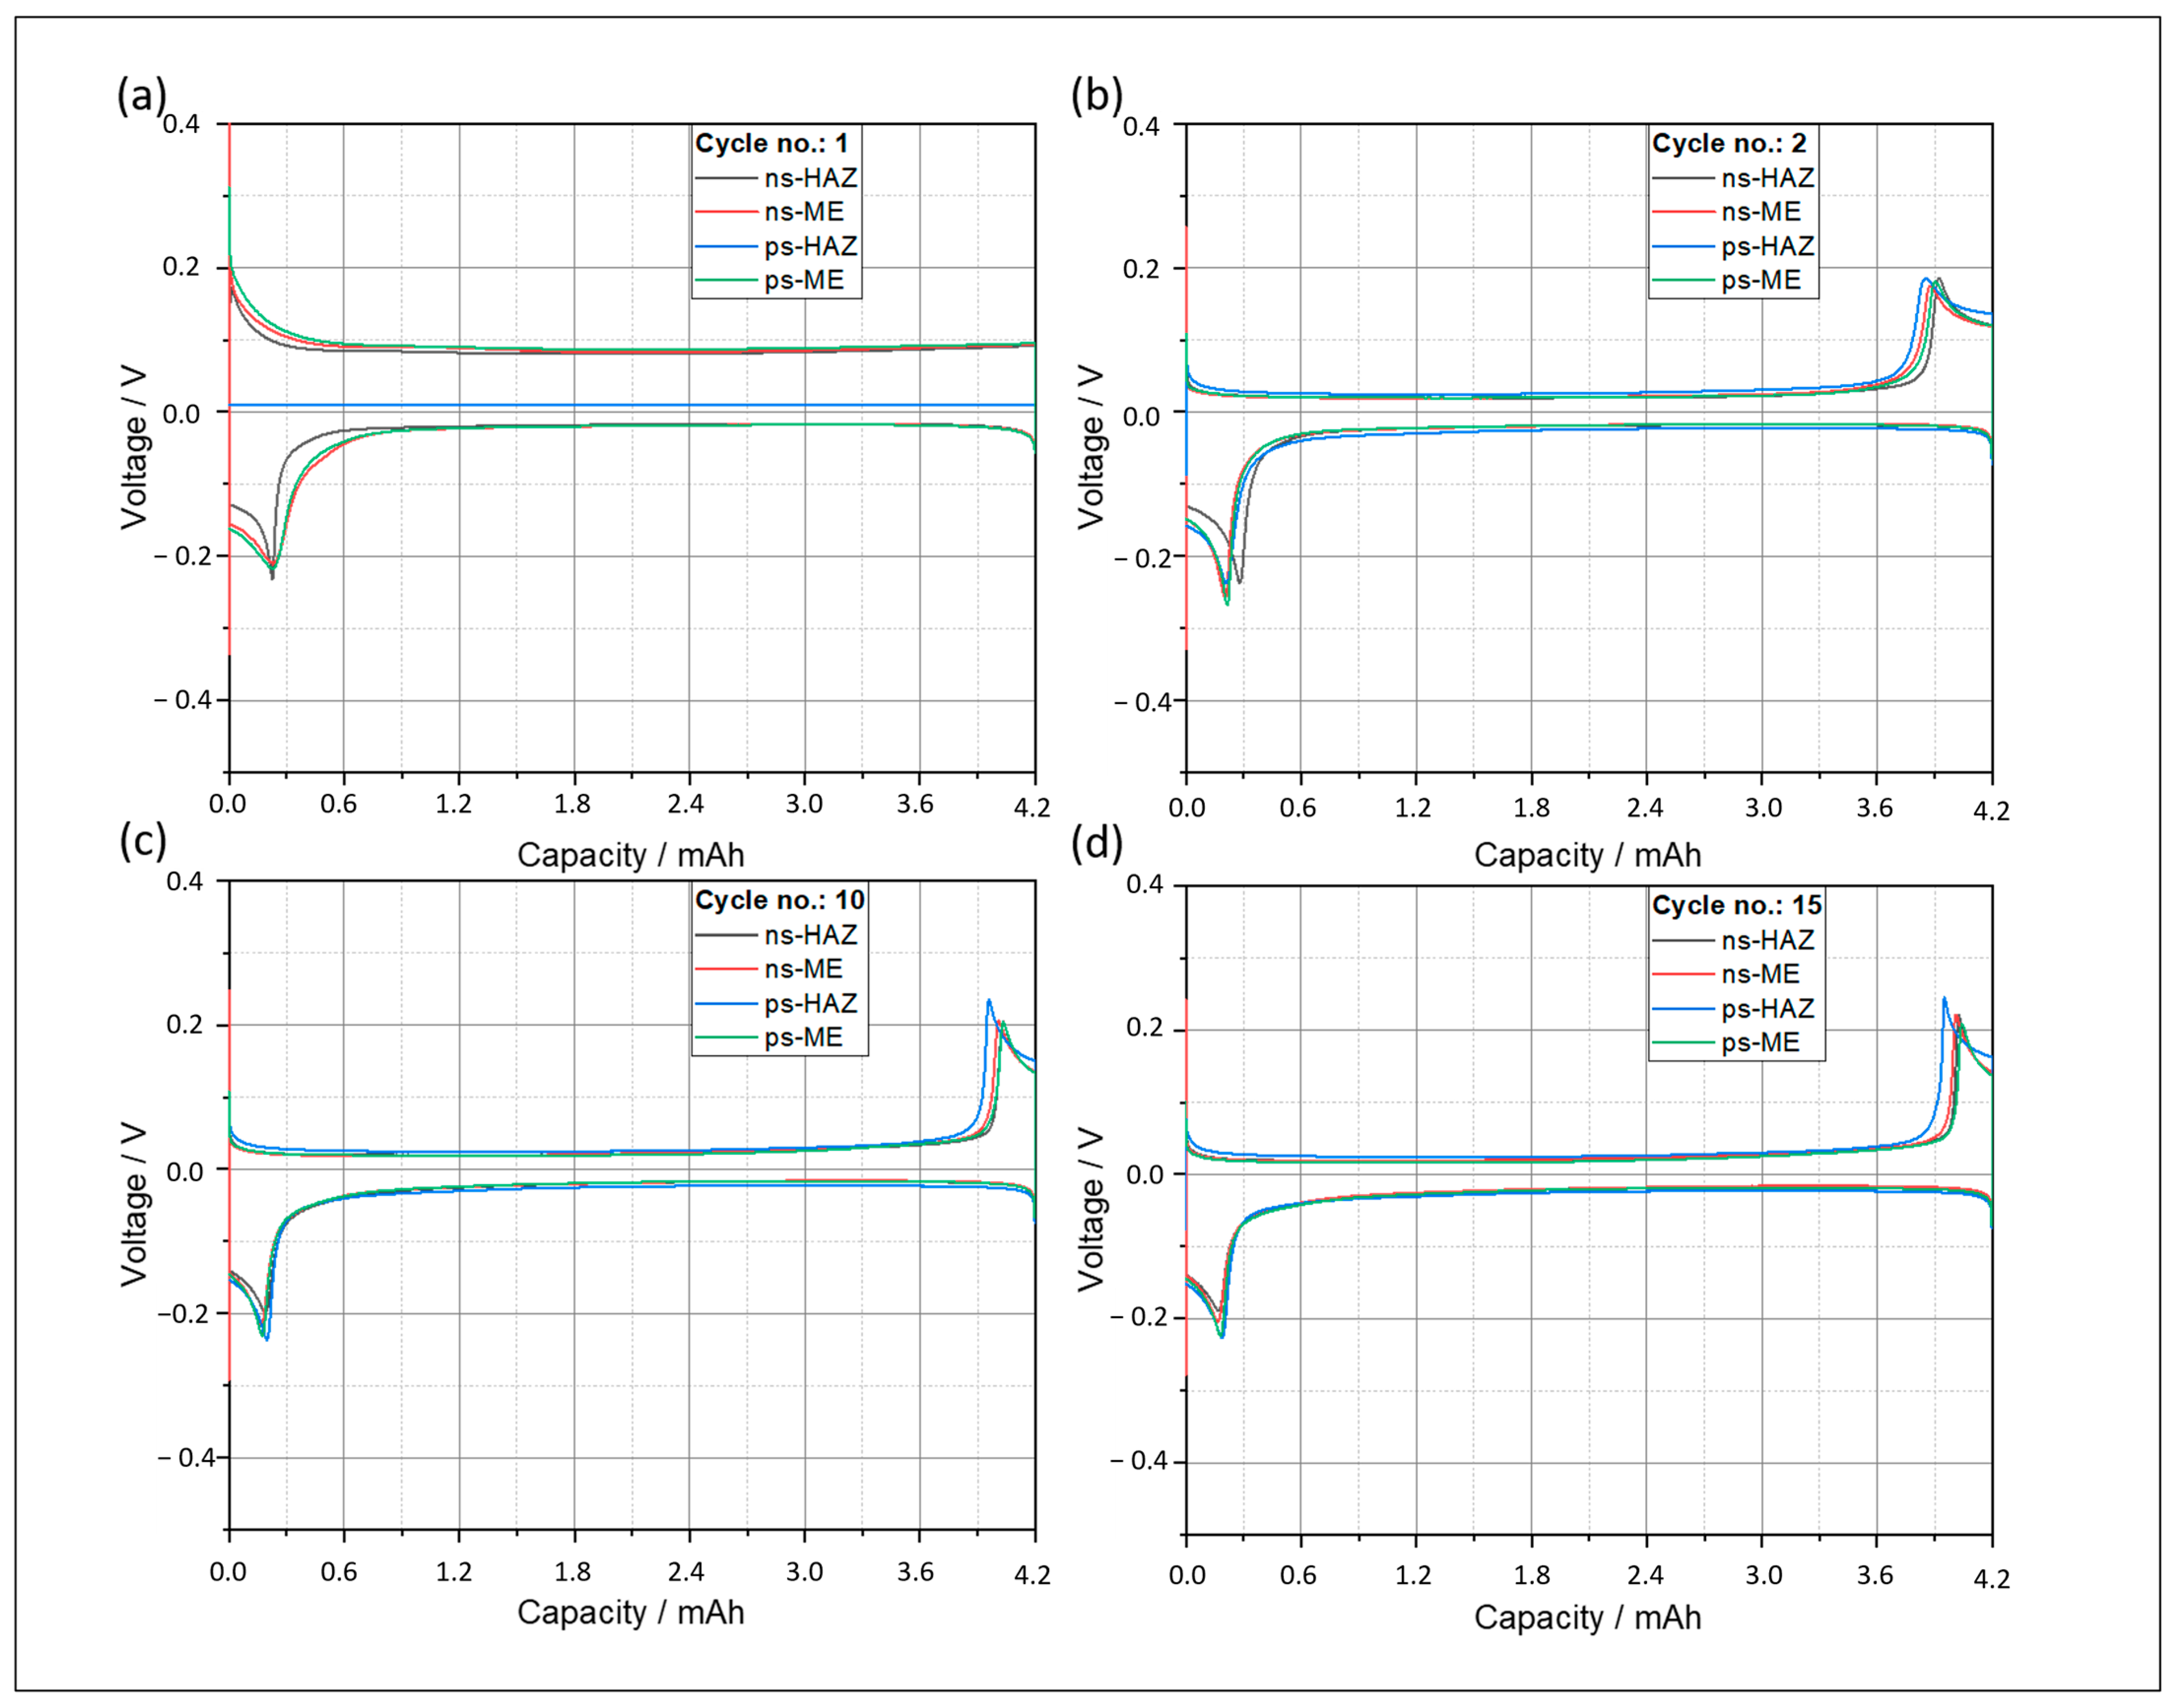
4.2.2. Influence of Cutting-Edge Characteristics on Electrochemical Performance

In this subsection, the influence of extreme cutting-edge characteristics on the electrochemical performance is investigated. Particular attention is paid either to a large heat-affected zone (HAZ) or to a large melt elevation (ME) (Table 3), while trying to keep the respective other characteristic as low as possible.
As illustrated in Figure 9, the initial cycle (a) demonstrates that the impact of the cutting-edge characteristics on the heat-affected zone and melt elevation does not exhibit any substantial variation with cell voltage. The cell voltage curves are found to be almost indistinguishable within the same range. However, subsequent to the initial charging and discharging cycles, discernible disparities emerge in the respective second local maxima and minima. Notably, after the 15th cycle, the greatest influences of the cutting-edge characteristics become evident for all the investigated anodes. The ps-HAZ anode exhibited the highest cell voltage, reaching 0.24 V, while the ps-ME anode demonstrated the lowest voltage of 0.21 V. The peaks for the ns-samples were observed at a similar level, with a maximum of 0.22 V. These findings underscore the pivotal role of the heat-affected zone in dictating the cell voltage and, by extension, the electrode’s lifespan. Conversely, the melt elevation does not appear to have a discernible effect on the cell voltage, as the curves of the nanosecond laser samples do not show any difference despite having different characteristics. While melt elevation may influence the effective surface area and thereby indirectly affect SEI formation, no significant differences in electrochemical performance were observed under the tested conditions. This observation indicates that melt elevation may not be the primary contributing factor in this scenario. Instead, other factors such as the extent of the heat-affected zone or the surface chemistry may play a more significant role.

5. Conclusions

The present study investigated the influence of pulse duration on laser-based cutting of lithium metal anodes and its implications for battery applications. The findings indicate that the duration of the pulse has a discernible effect on various elements of the cutting process.
In terms of cutting-edge characteristics, it was found that a reduction in pulse duration from the nanosecond to the picosecond range results in a significantly smaller heat-affected zone reduced by nearly 25% under identical primary processing parameters. This finding serves to substantiate the hypothesis that a reduction in pulse duration engenders a decrease in photothermal energy input. The rationale for this phenomenon pertains to the fact that a limited proportion of laser energy is transferred into the solid-state lattice, a consequence of the brief excitation time of the electrons. Consequently, thermal diffusion is minimized, thereby reducing the lateral and vertical thermal impact on the lithium substrate.
In the context of electrochemical performance, laser-generated electrodes demonstrated superior longevity when compared with mechanically separated anodes (0.25 V vs. 0.3 V). This finding was supported by the voltage curves obtained during testing. The thermal energy input appears to create localized “reservoirs” of inactive lithium at the edge of the anode. These reservoirs provide lithium ions with improved access to fresh lithium during cycling, thereby stabilizing cell behavior over time.
While a substantial HAZ was found to exert a discernible influence on electrochemical performance, the presence of melt formations did not appear to compromise the ionic resistance of the electrode. It is interesting to note that, despite the considerable difference in thermal impact between nanosecond and picosecond lasers, the pulse duration alone did not lead to a strong variation in electrochemical behavior within the tested energy range.
For the purpose of further investigation, the focus is on the cutting of anodes with a picosecond laser that operates at a line energy lower than 4.86 Jcm−2. Due to the high intensity of the picosecond laser, the cutting velocity is increased, and the line energy is reduced. This allows for the elicitation of the influence of the pulse duration in the picosecond range.
While the present work correlates edge characteristics with electrochemical behavior, further spatially resolved studies such as cross-sectional SEI or EDX analysis are necessary to fully separate edge-related from bulk degradation mechanisms.
Subsequent to the cutting process, a more thorough examination of the surface chemistry of the lithium anodes is conducted under varying process gases. This is due to the rapid reaction of lithium, an alkali metal, with the components of the surrounding atmosphere. This behavior can be further intensified by the thermal energy input of the laser.

Author Contributions

Conceptualization, L.O.S. and H.W.; methodology, L.O.S.; software, L.O.S.; validation, L.O.S., formal analysis, L.O.S.; investigation, L.O.S., resources, M.W.K.; data curation, L.O.S.; writing—original draft preparation, L.O.S.; writing—review and editing, H.W., S.H., and M.W.K.; visualization, L.O.S.; supervision, M.W.K. All authors have read and agreed to the published version of the manuscript.

Funding

This research received no external funding.

Data Availability Statement

The original contributions presented in this study are included in the article, and further inquiries can be directed to the corresponding author.

Conflicts of Interest

The authors declare no conflicts of interest.

References

  1. Qian, J.; Henderson, W.A.; Xu, W.; Bhattacharya, P.; Engelhard, M.; Borodin, O.; Zhang, J.-G. High rate and stable cycling of lithium metal anode. Nat. Commun. 2015, 6, 6362. [Google Scholar] [CrossRef]
  2. Cheng, X.-B.; Zhang, R.; Zhao, C.-Z.; Wei, F.; Zhang, J.-G.; Zhang, Q. A Review of Solid Electrolyte Interphases on Lithium Metal Anode. Adv. Sci. 2016, 3, 1500213. [Google Scholar] [CrossRef]
  3. Hong, H.; Che Mohamad, N.A.R.; Chae, K.; Marques Mota, F.; Kim, D.H. The lithium metal anode in Li–S batteries: Challenges and recent progress. J. Mater. Chem. A 2021, 9, 10012–10038. [Google Scholar] [CrossRef]
  4. Chen, Q.; Geng, K.; Sieradzki, K. Prospects for Dendrite-Free Cycling of Li Metal Batteries. J. Electrochem. Soc. 2015, 162, A2004–A2007. [Google Scholar] [CrossRef]
  5. Jansen, T.; Blass, D.; Hartwig, S.; Dilger, K. Processing of Advanced Battery Materials—Laser Cutting of Pure Lithium Metal Foils. Batteries 2018, 4, 37. [Google Scholar] [CrossRef]
  6. Jansen, T.; Kandula, M.; Hartwig, S.; Hoffmann, L.; Haselrieder, W.; Dilger, K. Influence of Laser-Generated Cutting Edges on the Electrical Performance of Large Lithium-Ion Pouch Cells. Batteries 2019, 5, 73. [Google Scholar] [CrossRef]
  7. Sundaram, S.K.; Mazur, E. Inducing and probing non-thermal transitions in semiconductors using femtosecond laser pulses. Nat. Mater. 2003, 70, 691–697. [Google Scholar] [CrossRef]
  8. Schmidt, L.O.; Wehbe, H.; Kandula, M.W.; Dilger, K. (Eds.) Laserstrahlschneiden von Lithium-Metall Folien für den Gebrauch in All-Solid-State Batterie Systemen. In Proceedings of the 4th Symposium Materialtechnik, Clausthal, Germany, 25–26 February 2021; Shaker Verlag: Düren, Germany, 2021. [Google Scholar]
  9. Chichkov, B.N.; Momma, C.; Nolte, S.; Alvensleben, F.; Tünnermann, A. Femtosecond, picosecond and nanosecond laser ablation of solids. Appl. Phys. A 1996, 63, 109–115. [Google Scholar] [CrossRef]
  10. Liu, X.; Du, D.; Mourou, G. Laser Ablation and Micromachining with Ultrashort Laser Pulses. IEEE J. Quantum Electron. 1997, 33, 1706–1716. [Google Scholar] [CrossRef]
  11. Leitz, K.-H.; Redlingshöfer, B.; Reg, Y.; Otto, A.; Schmidt, M. Metal Ablation with Short and Ultrashort Laser Pulses. Phys. Procedia 2011, 12, 230–238. [Google Scholar] [CrossRef]
  12. Bliedtner, J.; Müller, H.; Barz, A. (Eds.) Lasermaterialbearbeitung: Grundlagen—Verfahren—Anwendungen—Beispiele; Carl Hanser Verlag: Munich, Germany, 2013; ISBN 978-3-446-42168-4. [Google Scholar]
  13. Miotello, A.; Kelly, R. Laser-induced phase explosion: New physical problems when a condensed phase approaches the thermodynamic critical temperature. Appl. Phys. A 1999, 69, S67–S73. [Google Scholar] [CrossRef]
  14. Lu, Q.; Mao, S.S.; Mao, X.; Russo, R.E. Delayed phase explosion during high-power nanosecond laser ablation of silicon. Appl. Phys. Lett. 2002, 80, 3072–3074. [Google Scholar] [CrossRef]
  15. Mannion, P.; Magee, J.; Coyne, E.; O’Connor, G.; Glynn, T. The effect of damage accumulation behaviour on ablation thresholds and damage morphology in ultrafast laser micro-machining of common metals in air. Appl. Surf. Sci. 2004, 233, 275–287. [Google Scholar] [CrossRef]
  16. Orojloo, P.H.; Dib, S.A.; Kriegler, J.; Ballmes, H.; Zaeh, M.F.; Demir, A.G. Nanosecond- and picosecond-pulsed laser cutting of lithium metal anodes with copper current collector. Int. J. Adv. Manuf. Technol. 2025, 139, 657–671. [Google Scholar] [CrossRef]
  17. Chen, K.-H.; Wood, K.N.; Kazyak, E.; LePage, W.S.; Davis, A.L.; Sanchez, A.J.; Dasgupta, N.P. Dead lithium: Mass transport effects on voltage, capacity, and failure of lithium metal anodes. J. Mater. Chem. A 2017, 5, 11671–11681. [Google Scholar] [CrossRef]
  18. Bieker, G.; Winter, M.; Bieker, P. Electrochemical in situ investigations of SEI and dendrite formation on the lithium metal anode. Phys. Chem. Chem. Phys. 2015, 17, 8670–8679. [Google Scholar] [CrossRef]
  19. Liang, Z.; Lin, D.; Zhao, J.; Lu, Z.; Liu, Y.; Liu, C.; Lu, Y.; Wang, H.; Yan, K.; Tao, X.; et al. Composite lithium metal anode by melt infusion of lithium into a 3D conducting scaffold with lithiophilic coating. Proc. Natl. Acad. Sci. USA 2016, 113, 2862–2867. [Google Scholar] [CrossRef]
  20. Lin, D.; Liu, Y.; Liang, Z.; Lee, H.-W.; Sun, J.; Wang, H.; Yan, K.; Xie, J.; Cui, Y. Layered reduced graphene oxide with nanoscale interlayer gaps as a stable host for lithium metal anodes. Nat. Nanotechnol. 2016, 11, 626–632. [Google Scholar] [CrossRef]
  21. Wood, K.N.; Kazyak, E.; Chadwick, A.F.; Chen, K.-H.; Zhang, J.-G.; Thornton, K.; Dasgupta, N.P. Dendrites and Pits: Untangling the Complex Behavior of Lithium Metal Anodes through Operando Video Microscopy. ACS Cent. Sci. 2016, 2, 790–801. [Google Scholar] [CrossRef]
  22. Aurbach, D.; Zinigrad, E.; Cohen, Y.; Teller, H. A short review of failure mechanism of lithium metal and lithiated graphite anodes in liquid electrolyte solutions. Solid State Ionics 2002, 148, 405–416. [Google Scholar] [CrossRef]
  23. Rosso, M.; Brissot, C.; Teyssot, A.; Dollé, M.; Sannier, L.; Tarascon, J.-M.; Bouchet, R.; Lascaud, S. Dendrite short-circuit and fuse effect on Li/polymer/Li cells. Electrochim. Acta 2006, 51, 5334–5340. [Google Scholar] [CrossRef]
  24. Ding, F.; Xu, W.; Graff, G.L.; Zhang, J.; Sushko, M.L.; Chen, X.; Shao, Y.; Engelhard, M.H.; Nie, Z.; Xiao, J.; et al. Dendrite-free lithium deposition via self-healing electrostatic shield mechanism. J. Am. Chem. Soc. 2013, 135, 4450–4456. [Google Scholar] [CrossRef]
  25. Stark, J.K.; Ding, Y.; Kohl, P.A. Dendrite-Free Electrodeposition and Reoxidation of Lithium-Sodium Alloy for Metal-Anode Battery. J. Electrochem. Soc. 2011, 158, A1100. [Google Scholar] [CrossRef]
  26. Howlett, P.C.; Brack, N.; Hollenkamp, A.F.; Forsyth, M.; MacFarlane, D.R. Characterization of the Lithium Surface in N-Methyl-N-alkylpyrrolidinium Bis(trifluoromethanesulfonyl)amide Room-Temperature Ionic Liquid Electrolytes. J. Electrochem. Soc. 2006, 153, A595–A606. [Google Scholar] [CrossRef]
  27. Sano, H.; Sakaebe, H.; Matsumoto, H. Observation of electrodeposited lithium by optical microscope in room temperature ionic liquid-based electrolyte. J. Power Sources 2011, 196, 6663–6669. [Google Scholar] [CrossRef]
  28. Sano, H.; Sakaebe, H.; Senoh, H.; Matsumoto, H. Effect of Current Density on Morphology of Lithium Electrodeposited in Ionic Liquid-Based Electrolytes. J. Electrochem. Soc. 2014, 161, A1236–A1240. [Google Scholar] [CrossRef]
  29. Fang, C.; Li, J.; Zhang, M.; Zhang, Y.; Yang, F.; Lee, J.Z.; Lee, M.-H.; Alvarado, J.; Schroeder, M.A.; Yang, Y.; et al. Quantifying inactive lithium in lithium metal batteries. Nature 2019, 572, 511–515. [Google Scholar] [CrossRef]
  30. Li, Z.; Huang, J.; Yann Liaw, B.; Metzler, V.; Zhang, J. A review of lithium deposition in lithium-ion and lithium metal secondary batteries. J. Power Sources 2014, 254, 168–182. [Google Scholar] [CrossRef]
  31. Steiger, J.; Kramer, D.; Mönig, R. Mechanisms of dendritic growth investigated by in situ light microscopy during electrodeposition and dissolution of lithium. J. Power Sources 2014, 261, 112–119. [Google Scholar] [CrossRef]
  32. Steiger, J.; Richter, G.; Wenk, M.; Kramer, D.; Mönig, R. Comparison of the growth of lithium filaments and dendrites under different conditions. Electrochem. Commun. 2015, 50, 11–14. [Google Scholar] [CrossRef]
  33. Yoshimatsu, I.; Hirai, T.; Yamaki, J. Lithium Electrode Morphology during Cycling in Lithium Cells. J. Electrochem. Soc. 1988, 135, 2422–2427. [Google Scholar] [CrossRef]
  34. Aurbach, D.; Zinigrad, E.; Teller, H.; Dan, P. Factors Which Limit the Cycle Life of Rechargeable Lithium (Metal) Batteries. J. Electrochem. Soc. 2000, 147, 1274. [Google Scholar] [CrossRef]
  35. Liu, H.; Jiang, W.; Chen, W.; Lin, Q.; Ren, S.; Su, Y.; Tong, R.; Zhang, Y. Dendrite growth and inhibition in all-solid-state lithium metal batteries: In situ optical observation. J. Mater. Chem. A 2024, 12, 3575–3579. [Google Scholar] [CrossRef]
  36. Lyu, S.; Zhang, X.; Huang, S.; Wang, S.; Xiao, M.; Han, D.; Meng, Y. Long-Term Stable Cycling of Dendrite-Free Lithium Metal Batteries Using ZIF-90@PP Composite Separator. Nanomaterials 2024, 14, 975. [Google Scholar] [CrossRef]
  37. Oh, H.-S.; Lee, R.-H.; Lee, J.-K.; Yoon, J.-R.; Kim, H.-K.; Lee, S.-H. Attaining improved cycling durability and engineering a dendrite-free lithium metal anode. Mater. Adv. 2024, 5, 8294–8303. [Google Scholar] [CrossRef]
  38. Jansen, T.; Kandula, M.W.; Blass, D.; Hartwig, S.; Haselrieder, W.; Dilger, K. Evaluation of the Separation Process for the Production of Electrode Sheets. Energy Technol. 2020, 8, 1900519. [Google Scholar] [CrossRef]
  39. Hügel, H. Strahlwerkzeug Laser: Eine Einführung: Teubner-Studienbücher: Maschinenbau; Springer Fachmedien Wiesbaden GmbH: Wiesbaden, Germany, 1992; ISBN 978-3-519-06134-2. [Google Scholar]
  40. Marla, D.; Bhandarkar, U.V.; Joshi, S.S. A model of laser ablation with temperature-dependent material properties, vaporization, phase explosion and plasma shielding. Appl. Phys. A 2014, 116, 273–285. [Google Scholar] [CrossRef]
  41. Schnell, G.; Duenow, U.; Seitz, H. Effect of Laser Pulse Overlap and Scanning Line Overlap on Femtosecond Laser-Structured Ti6Al4V Surfaces. Materials 2020, 13, 969. [Google Scholar] [CrossRef]
  42. de Levie, R. The influence of surface roughness of solid electrodes on electrochemical measurements. Electrochim. Acta 1965, 10, 113–130. [Google Scholar] [CrossRef]
  43. Lorenz, P.; Ehrhardt, M.; Lotnyk, A.; Griebel, J.; Zimmer, K.; Zajadacz, J.; Himmerlich, M.; Bez, E.; Taborelli, M.; Rosenow, S.; et al. Cleaning of laser-induced periodic surface structures on copper by gentle wet chemical processing. Appl. Surf. Sci. 2025, 679, 161115. [Google Scholar] [CrossRef]
  44. Jeppson, D.W.; Ballif, J.L.; Yuan, W.W.; Chou, B.E. Lithium Literature Review: Lithium’s Properties and Interactions; Hanford Engineering Development Lab.: Richland, WA, USA, 1978. [Google Scholar]
  45. Irvine, W.R. The Reactions of Lithium with Nitrogen and Water Vapour; University of British Columbia: Vancouver, BC, Canada, 1961. [Google Scholar]
  46. Schmidt, L.O.; Wehbe, H.; Hartwig, S.; Kandula, M.W. Investigation of the Laser Material Interaction of Lithium Copper Foils Under Different Process Gases for All-Solid-State Batteries. Batteries 2025, 11, 195. [Google Scholar] [CrossRef]
  47. Lutey, A.H.; Fortunato, A.; Carmignato, S.; Ascari, A.; Liverani, E.; Guerrini, G. Quality and Productivity Considerations for Laser Cutting of LiFePO4 and LiNiMnCoO2 Battery Electrodes. Procedia CIRP 2016, 42, 433–438. [Google Scholar] [CrossRef]
  48. Marcicki, J.; Conlisk, A.T.; Rizzoni, G. A lithium-ion battery model including electrical double layer effects. J. Power Sources 2014, 251, 157–169. [Google Scholar] [CrossRef]
  49. Chang, H.J.; Ilott, A.J.; Trease, N.M.; Mohammadi, M.; Jerschow, A.; Grey, C.P. Correlating Microstructural Lithium Metal Growth with Electrolyte Salt Depletion in Lithium Batteries Using 7Li MRI. J. Am. Chem. Soc. 2015, 137, 15209–15216. [Google Scholar] [CrossRef]
  50. Weppner, W.; Huggins, R.A. Determination of the Kinetic Parameters of Mixed-Conduction Electrodes and Application to the System Li3Sb. J. Electrochem. Soc. 1977, 124, 1569–1578. [Google Scholar] [CrossRef]
  51. Wood, K.N.; Noked, M.; Dasgupta, N.P. Lithium Metal Anodes: Toward an Improved Understanding of Coupled Morphological, Electrochemical, and Mechanical Behavior. ACS Energy Lett. 2017, 2, 664–672. [Google Scholar] [CrossRef]
  52. Zheng, J.; Yan, P.; Mei, D.; Engelhard, M.H.; Cartmell, S.S.; Polzin, B.J.; Wang, C.; Zhang, J.-G.; Xu, W. Highly Stable Operation of Lithium Metal Batteries Enabled by the Formation of a Transient High-Concentration Electrolyte Layer. Adv. Energy Mater. 2016, 6, 1502151. [Google Scholar] [CrossRef]
Figure 1. (a) Example of a digital light microscope image of a laser-generated lithium anode, (b) melt elevation high profile using LSM, (c) 3D image of a laser-generated lithium cutting edge.
Batteries 11 00286 g001
Figure 2. Schematic cutting-edge characteristics of lithium metal foils and a real lithium metal foil cutting edge.
Batteries 11 00286 g002
Figure 3. (a) Melt formation for different frequencies for the nanosecond-pulsed laser system. (b) Schematic laser–material interaction of metals in dependency of the intensity (based on [39]). (c) Pulse overlap over frequencies for different line energies. (d) Intensity of the used nanosecond laser system over different frequencies.
Batteries 11 00286 g003
Figure 4. (a) Melt formation for different frequencies for the picosecond-pulsed laser system. (b) Intensity of the used picosecond laser system over different frequencies. (c) Pulse overlap over frequencies for different line energies.
Batteries 11 00286 g004
Figure 5. (a) Melt elevation over frequencies for different line energies for the used nanosecond-pulsed laser system. (b) Melt elevation over frequencies for different line energies for the used picosecond-pulsed laser system.
Batteries 11 00286 g005
Figure 6. Influence of the pulse-repetition frequency and the cutting velocity on the heat-affected zone for (a) the nanosecond pulse duration, R2 = 0.96, and (b) the picosecond pulse duration, R2 = 0.98.
Batteries 11 00286 g006
Figure 7. Cyclic voltammogram of symmetric Li|Li half cells after (a) first cycle, (b) second cycle, (c) 10th cycle, (d) 15th cycle for different cut lithium anodes.
Batteries 11 00286 g007
Figure 8. Post-mortem images of mechanically and laser cut anodes after the 2nd and 15th cycle.
Batteries 11 00286 g008
Figure 9. Cyclic voltammogram of symmetric Li|Li half cells after (a) first cycle, (b) second cycle, (c) 10th cycle, (d) 15th cycle for nano- (ns) and picosecond (ps) laser-generated lithium anodes with focus on different cutting-edge characteristics in terms of heat-affected zone (HAZ) and melt elevation (ME).
Batteries 11 00286 g009
Table 1. Laser system and laser parameters.
Nanosecond Laser SystemPicosecond Laser System
ModelG4 Pulsed Fiber Laser, SPI Lasers Coherent HyperRapid 50, Coherent
Wavelength [nm]1062 ± 21062 ± 2
Pulse duration [s]240 × 10−98.6 × 10−12
Average power Pavg [W]72 ± 260 ± 2
Spot diameter dspot [µm]74 ± 344 ± 1
Frequencies PRF [kHz]70–490100–1000
Cutting velocities vc [mms−1]25–20039–308
Table 2. Cutting-edge characteristics with the lowest detectable thermal influence.
Cutting SystemHeat-Affected Zone [µm]Melt Elevation [µm]
Nanosecond636 ± 481.21 ± 0.21
Picosecond511 ± 322.08 ± 0.25
Mechanical00
Table 3. Cutting-edge characteristics with the highest detectable thermal influence.
Laser SystemSampleHeat-Affected Zone [µm]Melt Elevation [µm]
Nanosecondns-HAZ2028 ± 480.87 ± 0.05
Nanosecondns-ME511 ± 344.02 ± 0.51
Picosecondps-HAZ2222 ± 610.66 ± 0.20
Picosecondps-ME457 ± 123.67 ± 0.43
Disclaimer/Publisher’s Note: The statements, opinions and data contained in all publications are solely those of the individual author(s) and contributor(s) and not of MDPI and/or the editor(s). MDPI and/or the editor(s) disclaim responsibility for any injury to people or property resulting from any ideas, methods, instructions or products referred to in the content.

