1. Introduction
As the demand for high-power lithium-ion batteries (LIBs) intensifies—particularly for electric vehicles (EVs), portable electronics, and grid storage—fast-charging capabilities have become a pivotal performance metric [
1,
2,
3,
4,
5]. However, increasing the charge rate introduces severe challenges, chief among them the risk of lithium (Li) plating on the graphite anode [
6]. Li plating occurs when Li-ion intercalation becomes kinetically or thermodynamically hindered, especially under high C-rates and low-temperature conditions, resulting in metallic Li deposition on the anode surface [
7,
8,
9]. This process not only reduces reversible capacity but also poses safety risks such as dendrite formation, short circuits, and thermal runaway [
10,
11].
Understanding and quantifying the onset and severity of Li plating remains an ongoing research challenge. Although tools like EIS and X-ray tomography have advanced plating diagnostics, their time-resolution and predictive power remain limited [
12,
13,
14,
15,
16]. These methods enable post-mortem and, to some extent, in situ characterization of Li deposition and anode degradation. However, real-time detection and preventive strategies are still limited by the complexity of multi-scale interactions within the cell, such as local current density variations, temperature gradients, and interfacial chemistry. Furthermore, distinguishing between reversible and irreversible Li deposition remains difficult, particularly under practical cycling conditions. As a complementary tool, computational modeling offers a powerful means to systematically explore the effects of charging conditions, material properties, and operating environments on plating behavior [
17,
18,
19,
20,
21,
22]. Multi-physics and multi-scale models [
23,
24]—ranging from continuum-level approaches like the Newman model to atomistic simulations such as density functional theory (DFT)—have been developed to predict lithium-ion transport, electrochemical kinetics, and morphological evolution during plating [
25,
26]. These models help identify critical thresholds, such as local over-potentials and Li saturation points, that precede the onset of metal deposition. In recent years, data-driven methods and machine learning have further expanded the modeling landscape, enabling real-time prediction and optimization of charging protocols to mitigate plating [
27,
28]. Despite these advances, bridging the gap between model predictions and experimental observations remains a key objective for improving the safety and longevity of fast-charging lithium-ion batteries.
In this work, we present a simplified yet robust computational framework that models Li plating behavior under fast-charging scenarios. Our approach integrates an empirical expression for the state-of-charge (SOC) threshold at which plating initiates as a function of temperature, charge rate, and energy density. Time-dependent simulations of plating dynamics allow us to resolve reversible versus irreversible fractions and quantify the associated energy losses. Additionally, we perform Arrhenius analysis to capture the thermally activated nature of the process. The framework is visualized using contour maps and threshold-based risk segmentation to guide safe operating limits. This modeling strategy provides mechanistic insights and system-level diagnostics that can inform battery management systems (BMSs) for adaptive charging protocols. Our findings aim to contribute to the growing efforts toward the development of safer, faster, and more efficient LIBs suitable for next-generation applications. While previous studies have employed rigorous, physics-based models—such as the Newman-type continuum models and DFT simulations—to explore lithium plating behaviour, these approaches often require extensive parameterization, high computational cost, and are not easily adaptable for real-time application in BMSs. In contrast, the framework presented here prioritizes simplicity and computational efficiency, relying on empirically grounded threshold models and first-order kinetics to provide rapid assessments of plating risk across a range of operating conditions. This enables seamless integration into system-level simulations and early-stage design workflows. Although less detailed than high-fidelity models, our approach offers a practical trade-off between accuracy and scalability, filling a gap between data-heavy predictive tools and first-principles simulations.
2. Computational Methodology
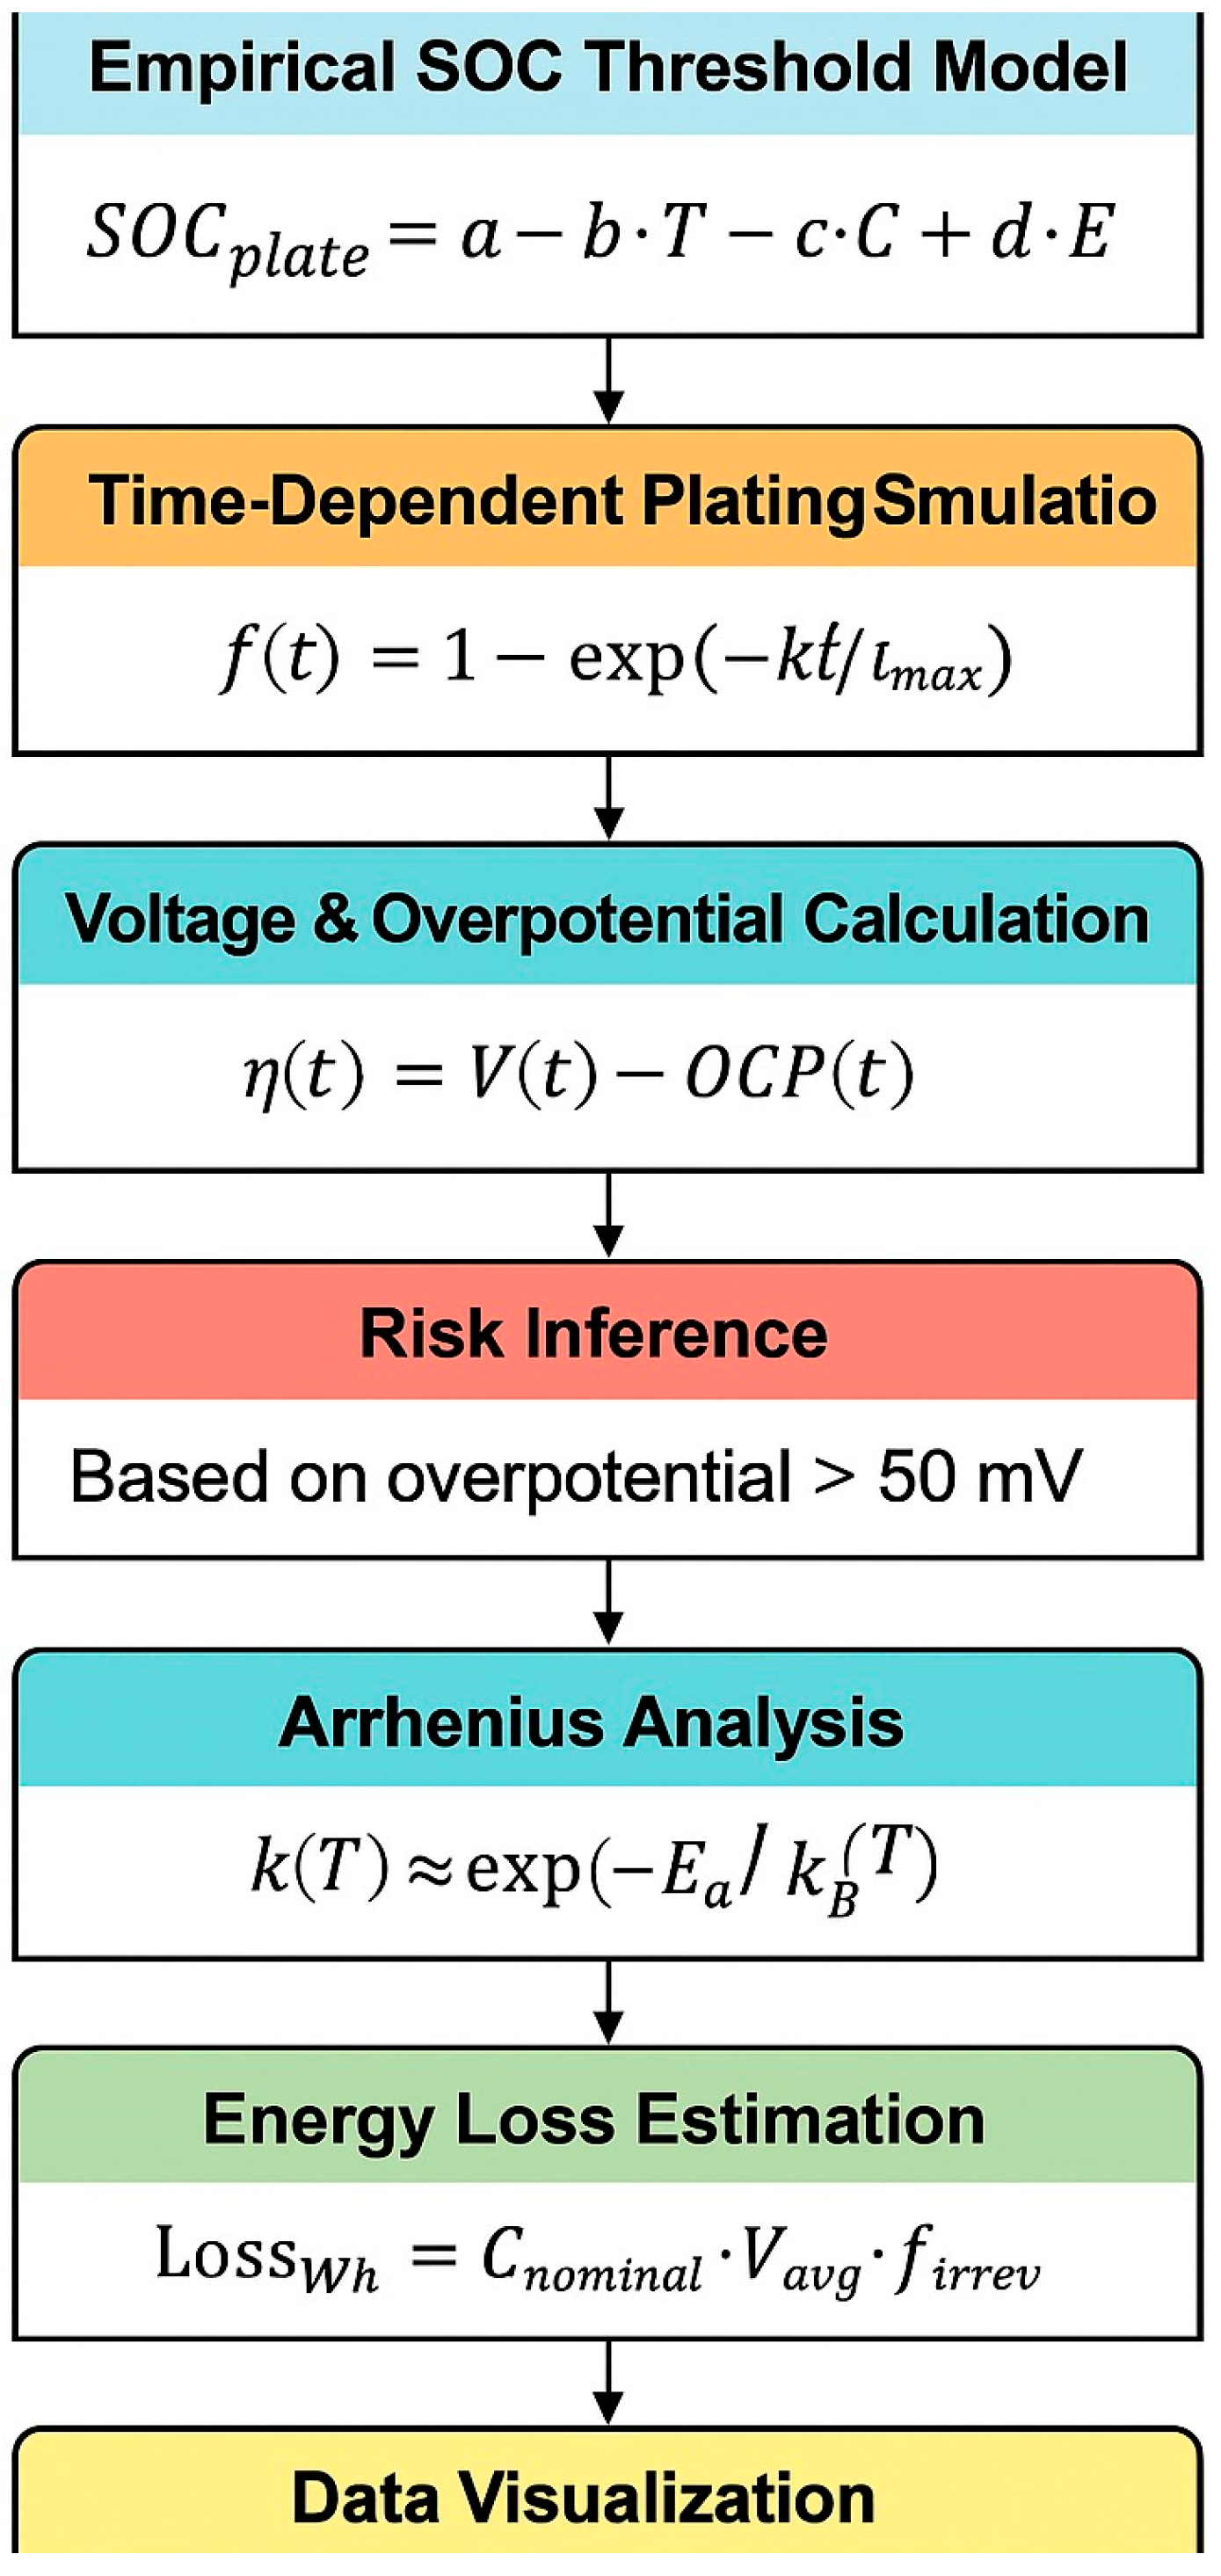
To elucidate the mechanisms and thresholds governing Li plating during fast charging, we implemented a combination of empirical modeling, kinetic simulation, and data-driven visualization techniques. Simulation workflows (see
Figure 1) were scripted to mimic realistic charge protocols and capture the temporal and parametric evolution of electrochemical variables. To estimate the onset of Li plating under fast-charging conditions, we employed a simplified empirical model that relates the plating onset state-of-charge (SOC
plate) to operating temperature, C-rate, and cell-level specific energy: SOC
plate =
a −
b ·
T −
b ·
C +
d ·
E, where
T is the cell temperature (K),
C is the applied charge rate (C-rate), and
E is the specific energy of the battery (Wh/kg).
This formulation is intended as a design-level screening tool rather than a mechanistic model. The coefficients (
a = 1.05,
b = 0.001,
c = 0.02, and
d = 0.001) were selected based on observed trends from prior study [
29], reflecting that plating risk increases at low temperature, high C-rate, and low energy density. The model provides a fast, interpretable approximation of plating onset for high-throughput design evaluations or thermal-constrained system-level simulations. The evolution of Li plating over time was modeled using an exponential function based on a normalized first-order kinetic assumption:
where
f(
t) is the cumulative plated fraction,
k is the effective rate constant, and
tmax represents the full charge duration. Reversible and irreversible fractions were distinguished by applying separate time constants to reflect differences in reversibility kinetics [
30]. This choice was made to balance computational simplicity with physical relevance. The exponential form captures the general accumulation trend of lithium plating observed in prior experimental and empirical studies [
30,
31,
32]. Additionally, its minimal parameter requirements and fast evaluation make it particularly suitable for real-time simulations and potential integration into battery management systems. Although alternative models—such as variable-order kinetics or multicomponent reaction schemes—may offer higher fidelity, they typically require detailed system-specific inputs that may not be readily available under fast-charging conditions. Future work will consider extending this framework to include more complex kinetic representations when appropriate. The open circuit potential (OCP) was simulated as a time-varying sinusoid to reflect internal chemical shifts, while the applied voltage followed an exponential decay profile consistent with constant current charging. The overpotential
η(
t) was then computed as the instantaneous difference between voltage and OCP:
OCP was approximated using a sinusoidal time-dependent function designed to reflect internal chemical potential changes during charging. This empirical approach was chosen to simplify simulation and allow generalization across cell chemistries without relying on detailed electrode material data. While this approximation captures the broad dynamics of potential shifts, it does not explicitly account for thermodynamic equilibrium potentials derived from specific electrode compositions. As such, the resulting overpotential (η(t) = V(t) − OCP(t)) should be interpreted as a first-order estimate. Future implementations of this framework will integrate either experimentally measured OCP curves or material-specific analytical models to improve accuracy and predictive fidelity.
Plating risk was inferred by comparing
η(
t) to a pre-defined threshold (∼50 mV) beyond which metallic Li nucleation becomes favorable [
33]. To quantify the thermal activation of plating rate, we evaluated an Arrhenius relationship:
with
Ea the activation energy,
kB Boltzmann’s constant, and
T temperature in Kelvin. A linear fit of ln
k versus 1/
T yielded
Ea ≈ 0.25 eV, consistent with reported values for interfacial diffusion-limited Li deposition [
34,
35]. The irreversible plating loss was translated into energy terms using the expression:
where
Cnominal is the nominal capacity (Ah),
Vavg is the average voltage (V), and
firrev is the irreversible fraction. The reversibility ratio was computed as
frev/(
frev +
firrev), enabling evaluation of energy retention under varying kinetic conditions [
31].
Finally, we integrate the outputs into 2D contour and heatmap visualizations that encode risk zones based on SOC, temperature, and C-rate. These maps connect back to the initial SOC model and bridge to the voltage profiles simulated earlier. The resulting severity index supports informed decisions within battery management systems, completing the workflow from modeling to mitigation. All simulations were performed using Python 3.12 with scientific computing libraries including NumPy [
36], Matplotlib [
37], and pandas [
38].
It is important to note that the present framework does not explicitly account for the chemical composition of the electrolyte or the specific anode material. These factors can influence key aspects of lithium plating behavior, including the onset potential, kinetic rate constants, and reversibility. The current model uses generalized empirical coefficients to maintain broad applicability and computational efficiency across a range of battery chemistries. Future versions of the model will incorporate chemistry-specific parameters—such as electrolyte conductivity, Li-ion diffusion coefficients, and electrode surface properties—to improve material fidelity and enable more accurate tailoring to specific battery systems.
3. Results and Discussion
To contextualize the following simulation results, it is important to clarify how they are derived from the empirical model introduced earlier (
Figure 1). The state-of-charge threshold for lithium plating (SOC
plate), defined as a function of temperature, charge rate, and specific energy, serves as the initial condition across all simulations. This threshold identifies the point during charging when lithium plating is likely to initiate. Building on this, the subsequent figures (Figures 3–10) illustrate the evolution of plating dynamics—including plating fraction, reversibility, energy loss, thermal activation, and severity index—using a set of time-dependent kinetic models and electrochemical assumptions described in the Computational Methodology. Thus, the simple empirical model acts as the entry point to a more comprehensive simulation framework used to quantify the severity and consequences of lithium plating under fast-charging conditions.
Figure 2 presents a conceptual model capturing the electrochemical evolution of Li plating during high-rate charging. As Li ions approach the anode, they initially contribute to the formation and growth of the solid electrolyte interphase (SEI), a critical passivation layer that stabilizes the electrode–electrolyte interface. Under aggressive charging protocols, the Li flux may exceed the insertion capacity of the anode, leading to the nucleation of metallic Li on the surface. This deposition behavior can be partitioned into two regimes: reversible plating, wherein deposited Li remains electrochemically active and is reoxidized during discharge, and irreversible plating, wherein Li becomes electronically isolated, forming inactive or “dead” Li. The latter significantly impairs capacity retention and enhances cell impedance. The schematic emphasizes that the onset of irreversible plating is a key degradation mechanism under fast-charging conditions. Therefore, controlling the overpotential, electrolyte composition, and temperature are essential strategies to enhance charge acceptance while minimizing irreversible Li loss and ensuring long-term cycling stability. Several factors can exacerbate lithium plating during fast charging. Low temperatures significantly reduce lithium-ion diffusion and intercalation rates within the graphite anode, making it more likely for lithium to deposit as metallic Li on the surface. Additionally, insufficient active material in the negative electrode—whether due to electrode design constraints or prior capacity loss—limits the availability of intercalation sites. These conditions hinder the competing intercalation process, increase the local overpotential, and elevate the risk of plating. Incorporating these parameters into predictive models is essential for accurately identifying high-risk operating regimes and designing robust charging protocols.
In this conceptual framework, the cathode is assumed to be a layered transition metal oxide, such as lithium nickel manganese cobalt oxide (NMC), which is widely used in high-energy lithium-ion cells. This layered structure facilitates rapid lithium intercalation during fast charging and is representative of typical commercial systems to which the model is intended to apply. In addition to SEI evolution on the anode, degradation processes at the cathode also influence plating behavior. During repeated cycling, transition metal dissolution, surface reconstruction, and electrolyte oxidation at high voltages contribute to the formation of the cathode electrolyte interphase (CEI) layer. This interphase can increase cell impedance and alter ion transport kinetics, indirectly exacerbating lithium plating by shifting local current densities and thermal gradients. Long-term CEI growth may thus reduce charging efficiency and compromise the predictive reliability of plating thresholds if not properly accounted for in the system-level design.
To visualize the onset of lithium plating under varying fast-charging conditions, we applied the empirical model SOC
plate = a − b · T − c · C + d · E, as detailed in the Computational Methodology section. A data matrix was generated over a temperature range of 280–320 K and C-rates from 1 to 5 C, with the specific energy fixed at 250 Wh/kg.
Figure 3 displays the resulting contour map, showing how the plating onset SOC shifts to lower values as the charge rate increases and temperature decreases. These trends are consistent with known kinetic limitations and overpotential-driven effects that elevate plating risk. The contour map serves as a practical diagnostic tool to quickly evaluate and avoid critical operating conditions during fast charging. At lower temperatures (e.g., 280–290 K) and high C-rates (>3 C), the plating onset occurs as early as SOC ≈ 0.92, indicating a narrower safe operating window during fast charging. Conversely, at elevated temperatures and modest charge rates (<1.5 C), the system tolerates SOC values up to 1.0 before plating onset is predicted. This contour map offers valuable insights into safe design limits, guiding BMSs to avoid critical regimes prone to Li deposition. The observed gradient further supports previous reports that low-temperature/high-rate charging disproportionately accelerates plating due to slower Li-ion diffusion and increased overpotential [
39,
40]. These results underpin the necessity of thermal regulation and adaptive current control in fast-charging scenarios to prevent irreversible Li accumulation and ensure long-term cell stability.
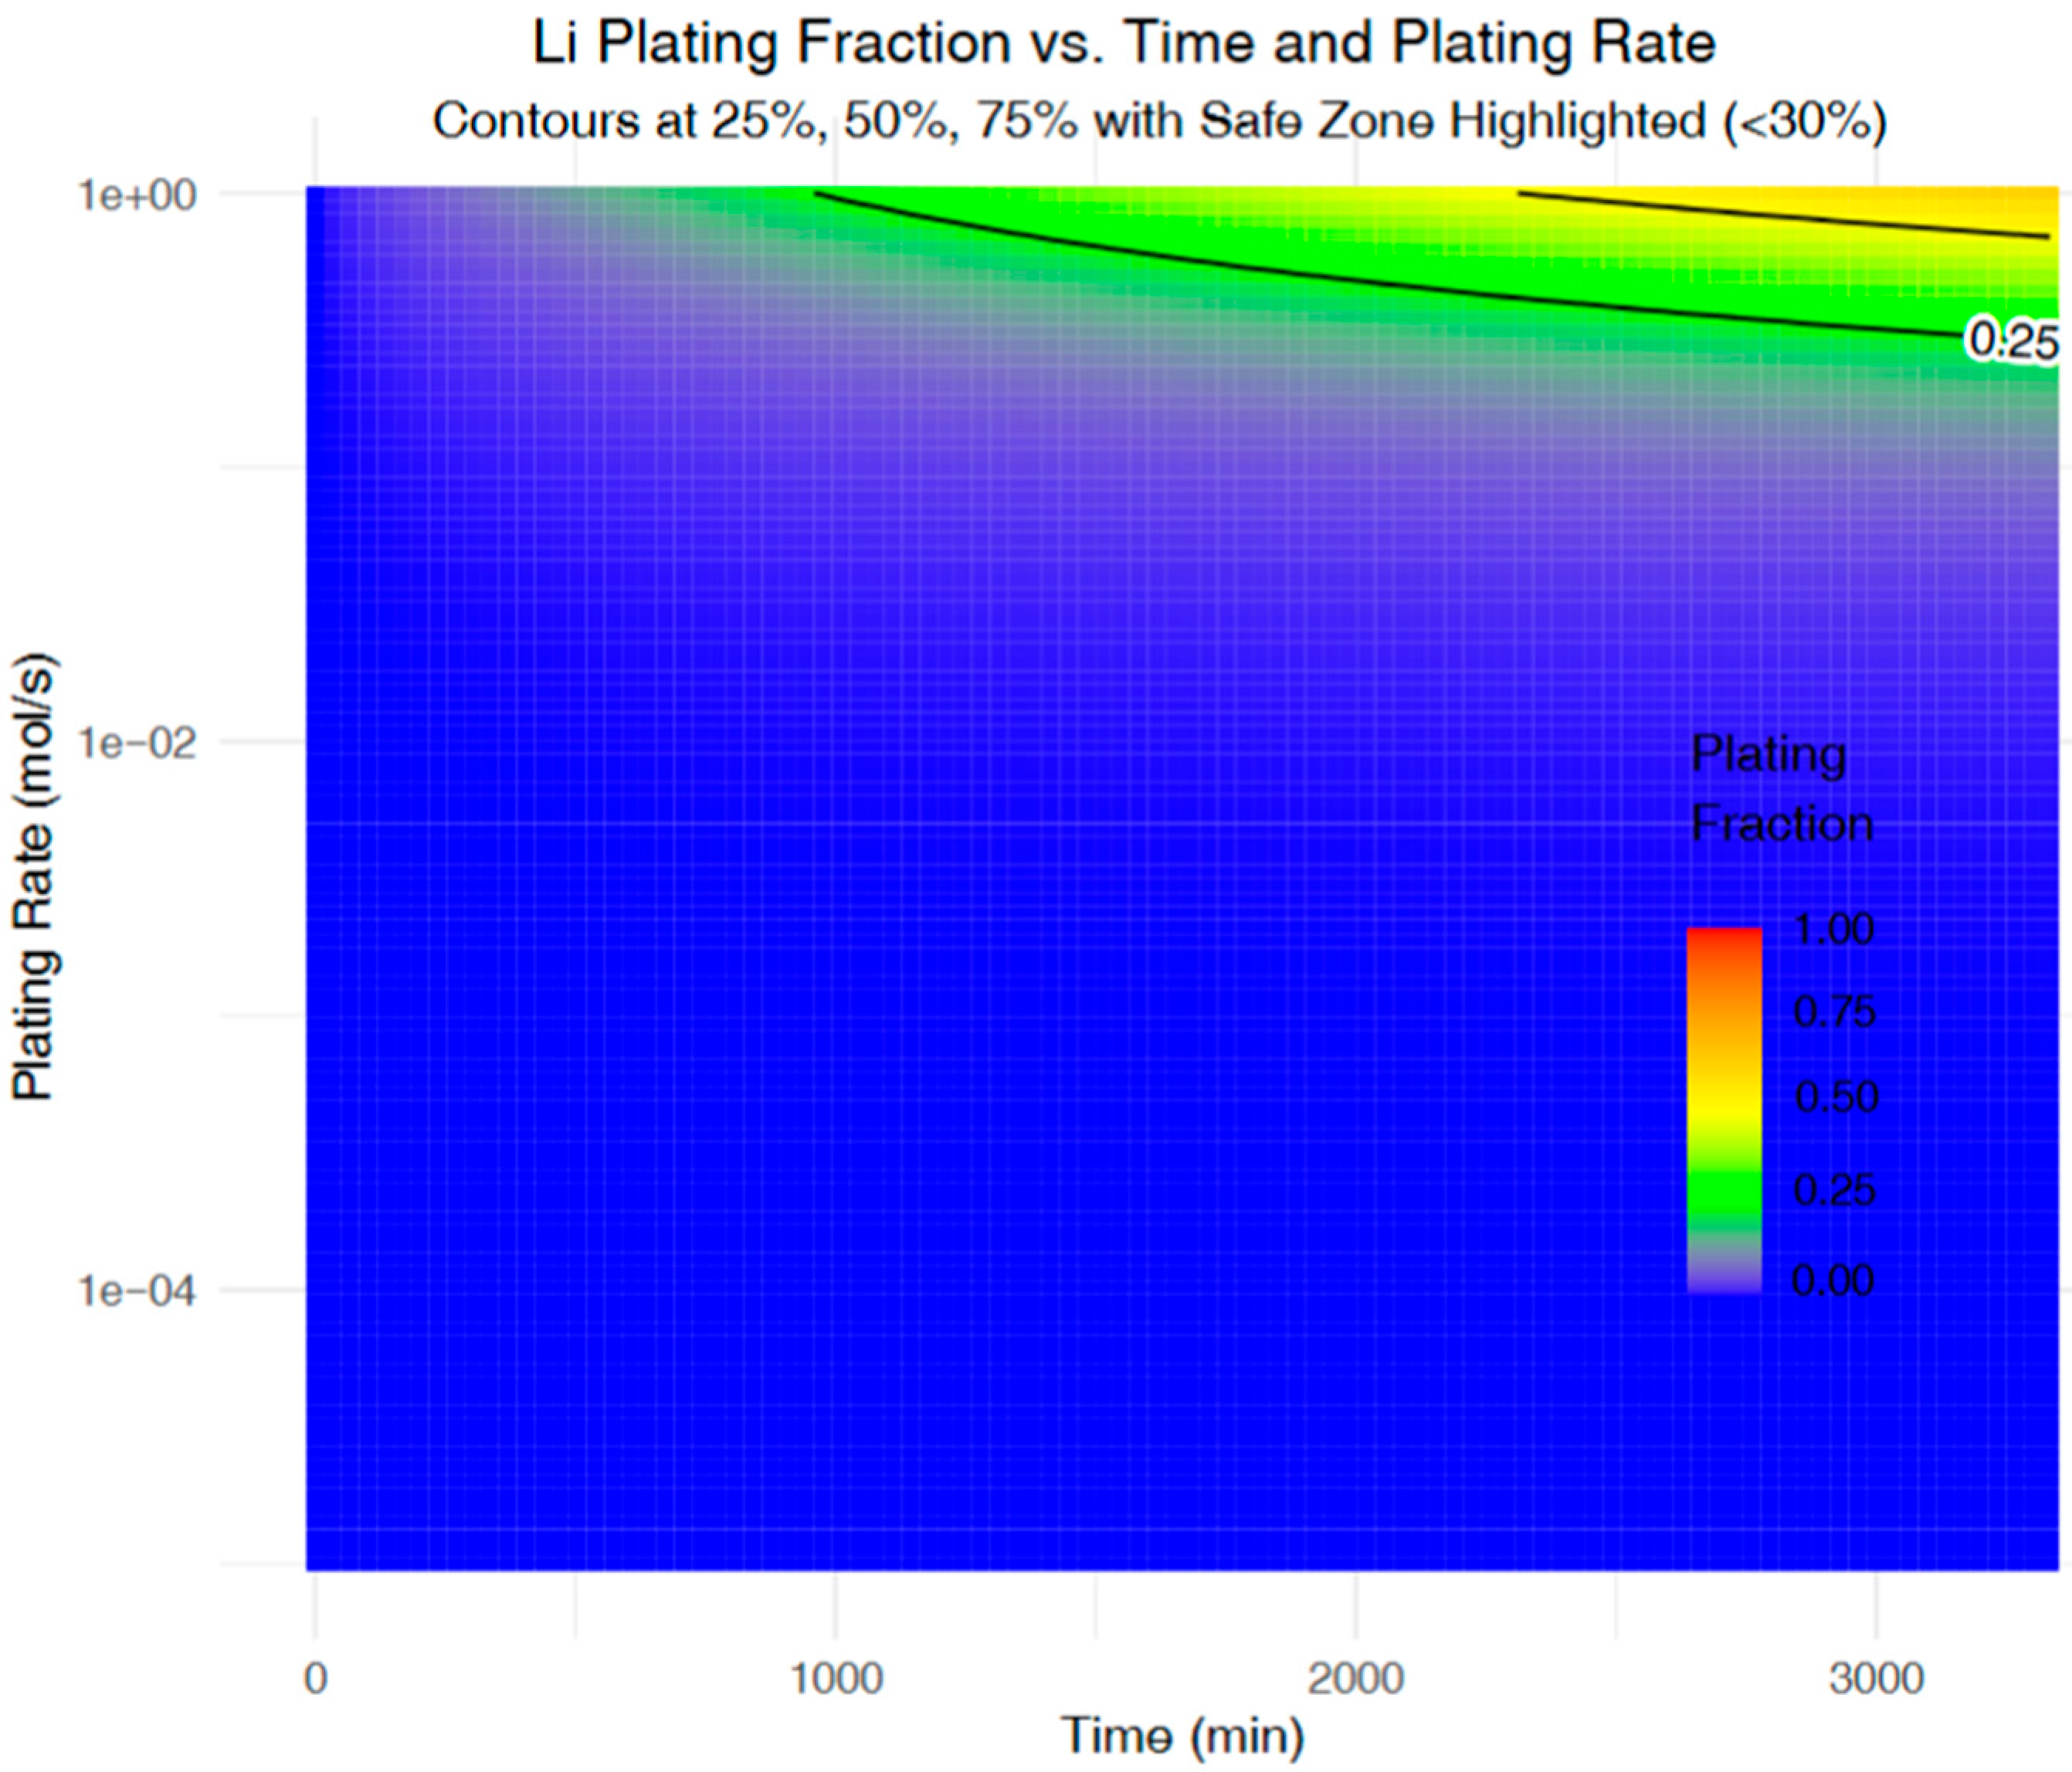
Figure 4 presents a heatmap illustrating the simulated lithium plating fraction as a function of time and plating rate. The contour lines delineate critical risk zones, with the green boundary marking a plating fraction of 25%, below which the system is considered to operate safely. This threshold aligns with the literature suggesting that plating fractions exceeding 25% substantially increase the likelihood of irreversible lithium accumulation and dendritic growth. This observation supports prior experimental studies that have emphasized the exponential sensitivity of lithium plating to both current density and overpotential [
32]. From a battery management perspective, this map serves as a valuable guide: charging strategies can be tuned to keep operating conditions within the low-risk region. Specifically, battery management systems (BMSs) can leverage such modelling to dynamically adjust current density or interrupt fast charging when approaching higher-risk zones—thus minimizing irreversible plating. By pre-emptively identifying high-severity trajectories, the model supports real-time charge control to extend battery lifespan and maintain safety.
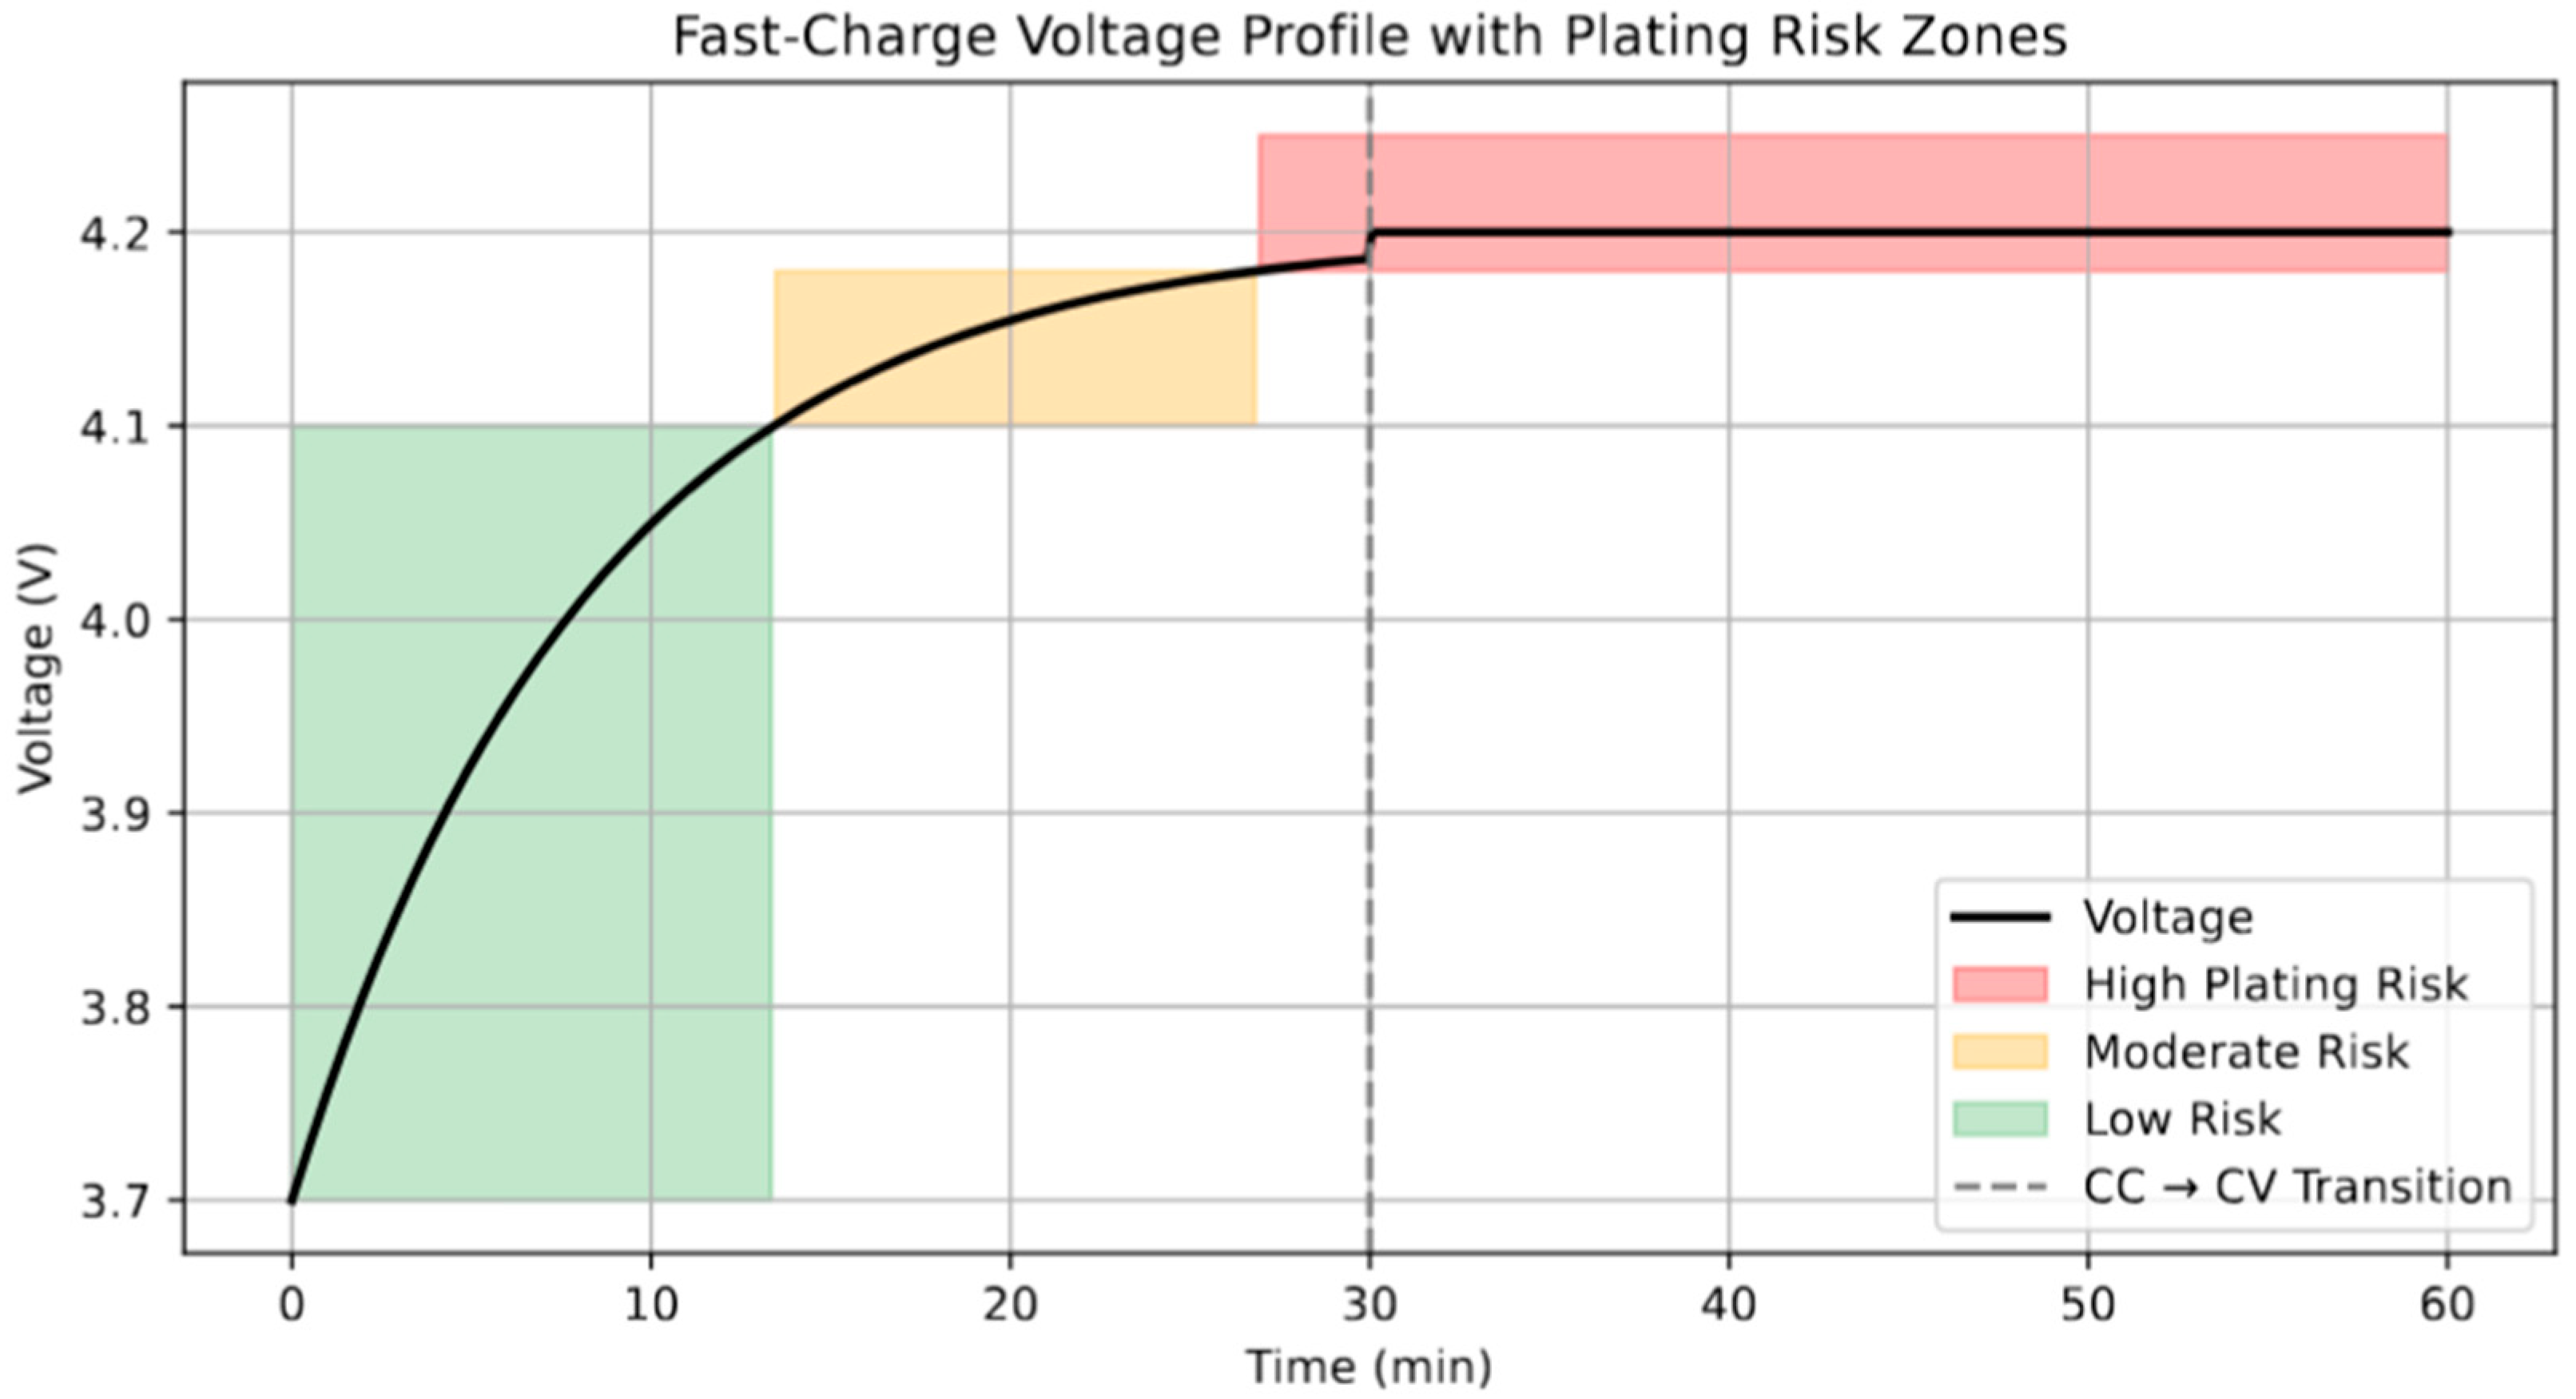
Figure 5 presents a simulated voltage profile during a fast-charging event, segmented by empirically defined Li plating risk zones. The initial low-voltage region (up to ∼4.1 V) is identified as low risk (green), corresponding to stages where overpotentials are insufficient to drive significant Li deposition. As the voltage enters the range of 4.1–4.18 V, the plating probability increases (orange), consistent with earlier impedance spectroscopy studies showing the onset of interfacial instability at elevated states of charge [
41]. Beyond 4.18 V (red region), the high overpotential in the constant-voltage (CV) phase facilitates Li deposition on the anode surface. The CC→CV transition, shown by the dashed line, marks a critical inflection point where the current begins to drop but the voltage is held constant—an operational condition known to exacerbate plating under high charge rates. Recent studies emphasize that the risk in this CV regime is compounded by low temperature or degraded SEI properties, both of which reduce Li
+ diffusivity [
42]. Consequently, the voltage-guided zoning presented here can serve as a practical tool for BMSs to implement adaptive charging protocols and avoid hazardous Li accumulation. While the 2D heatmaps and contour-based risk visualizations are generated offline, their primary purpose is to inform the design of simplified threshold maps or lookup tables that can be embedded within a BMS. Rather than relying on real-time simulation, the BMS can reference precomputed decision boundaries (e.g., safe operating SOC at a given C-rate and temperature) that are derived from these risk zones. This enables rapid, resource-efficient decision-making even within the computational constraints of embedded battery control units.
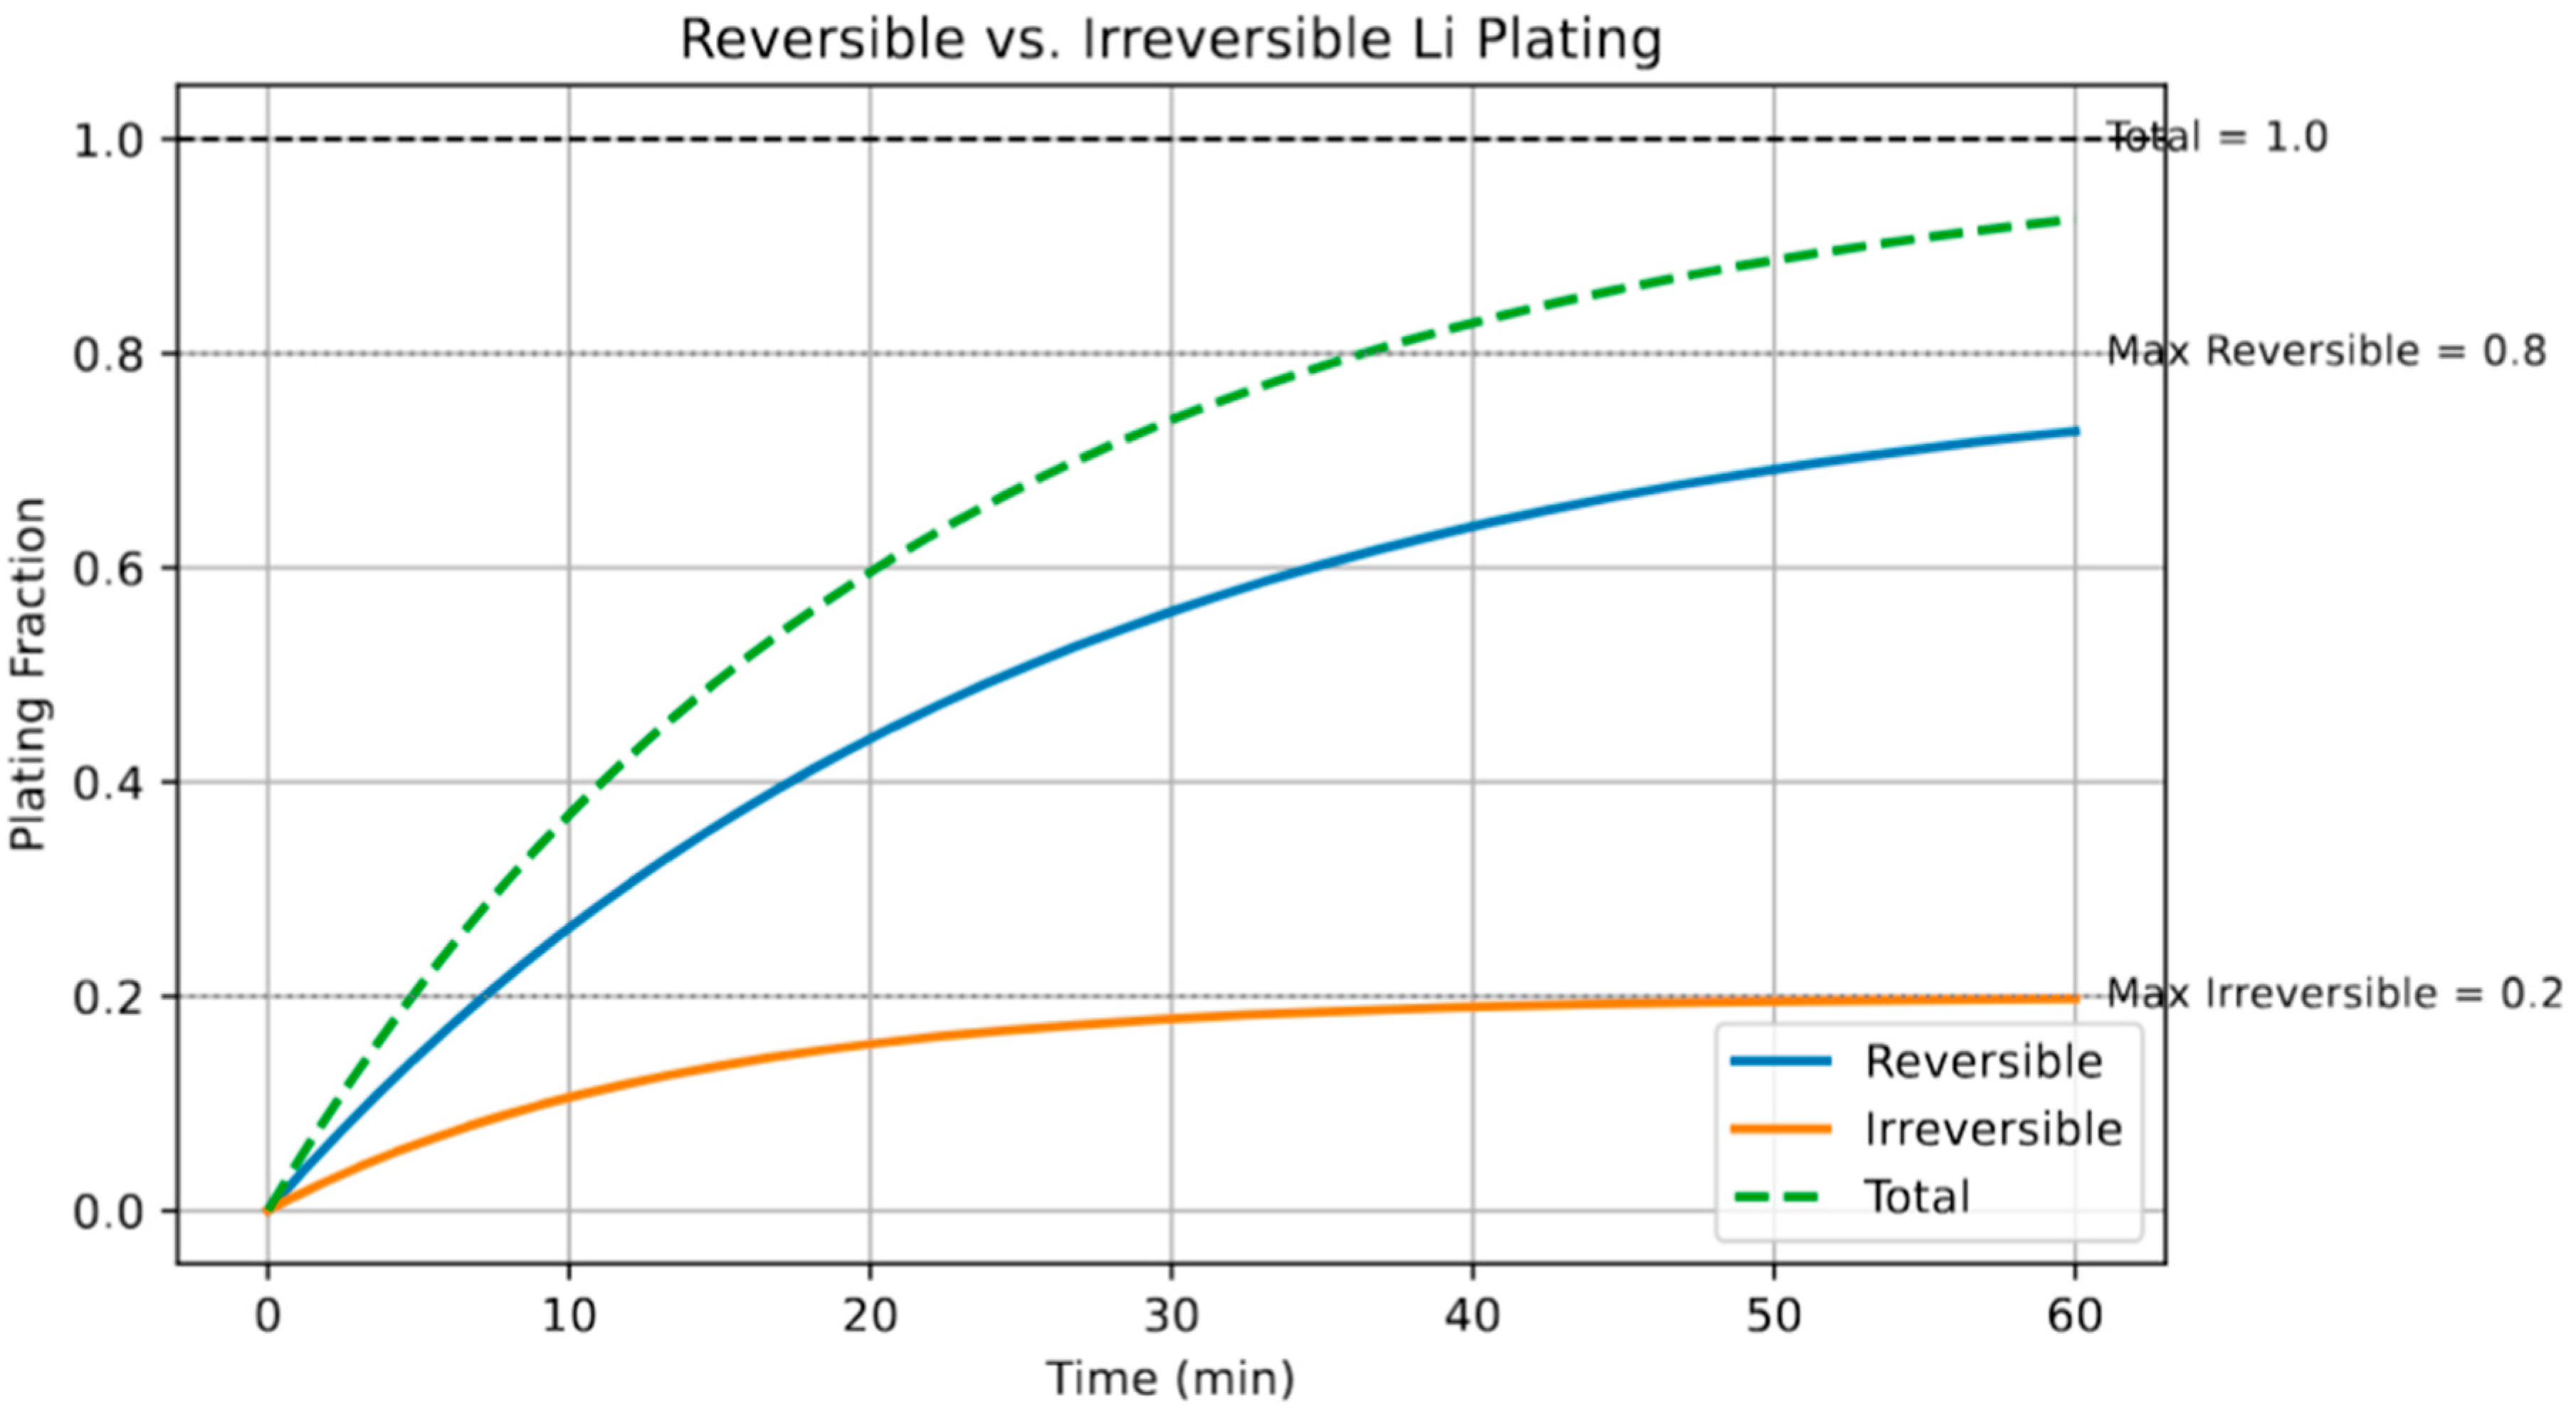
Figure 6 illustrates the comparative dynamics of reversible and irreversible Li plating during a fast-charging protocol. The reversible fraction increases sharply during the initial stages of charging, stabilizing at approximately 80% of the total deposited Li. In contrast, the irreversible fraction accumulates more gradually and saturates near 20%, consistent with prior experimental observations of lithium becoming electronically or physically isolated due to SEI entrapment or void formation [
43,
44]. The clear separation in growth kinetics between the two fractions underscores the time-sensitive nature of plating reversibility. Fast early stage diffusion and exchange kinetics favor reversible deposition; however, once critical nucleation thresholds are crossed—often exacerbated by elevated current densities or reduced temperature—irreversible loss becomes predominant. This distinction is particularly relevant for battery life and efficiency, as irreversible plating contributes to both active Li loss and impedance growth.
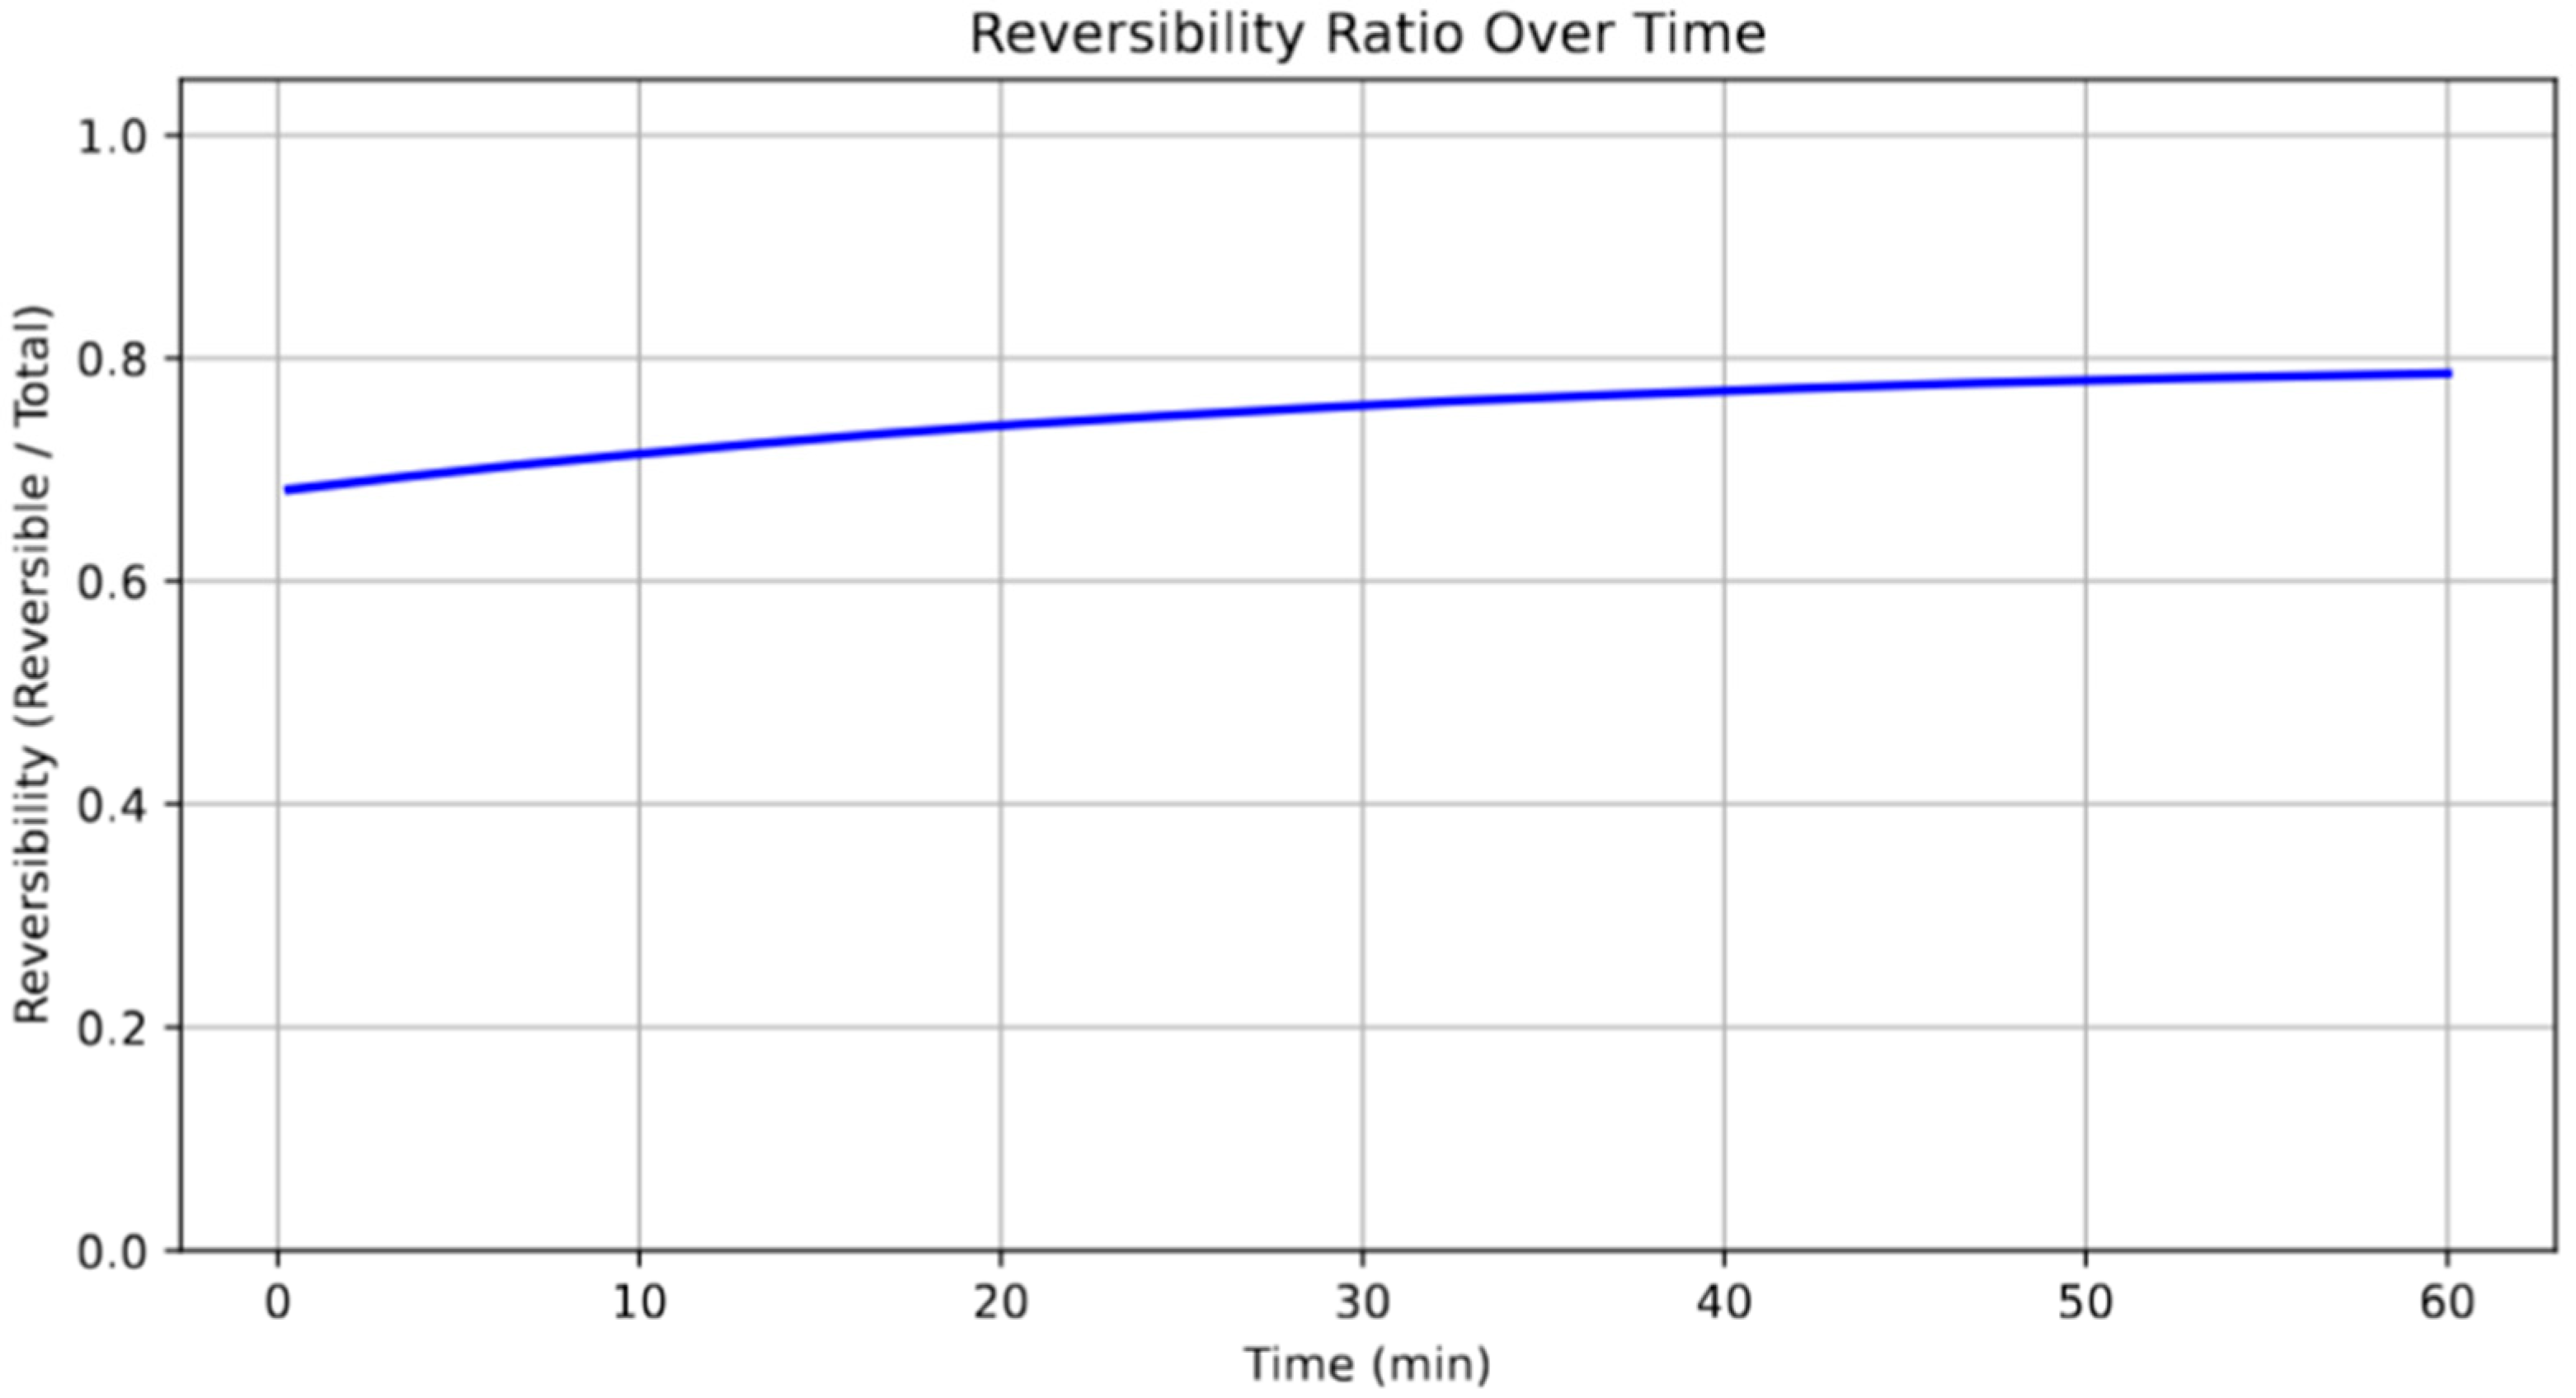
Figure 7 presents the evolution of the reversibility ratio of lithium plating during fast charging, highlighting the proportion of lithium that remains electrochemically accessible. The data reveal a monotonic increase in reversibility over time, asymptotically approaching a maximum of approximately 79% by the end of the simulated charge period. This trend reflects the initial dominance of kinetic limitations that promote irreversible plating, such as dendrite entrapment or SEI-enclosed lithium. As the system approaches equilibrium, favorable thermodynamic conditions and surface saturation limit additional irreversible accumulation, allowing the relative proportion of reversible lithium to increase. Such behavior underscores the critical importance of charging protocols that minimize the early onset of plating to preserve long-term capacity and coulombic efficiency. Moreover, maximizing the reversibility ratio is essential for extending cycle life and reducing inactive Li accumulation [
45]. It should be noted that the simulated reversibility ratio (~0.79) corresponds to an idealized scenario without prior cycling or SEI degradation. In real-world applications, factors such as electrolyte decomposition, SEI layer growth, and repeated cycling can lead to higher irreversibility and lower lithium recovery. As such, the reported value reflects a best-case, early-cycle condition. Future work will extend the model to account for cycle-dependent degradation and history effects to better match long-term battery performance in practical applications.
Having distinguished between reversible and irreversible plating fractions (
Figure 6 and
Figure 7), we quantify their temporal evolution and effect on energy retention (
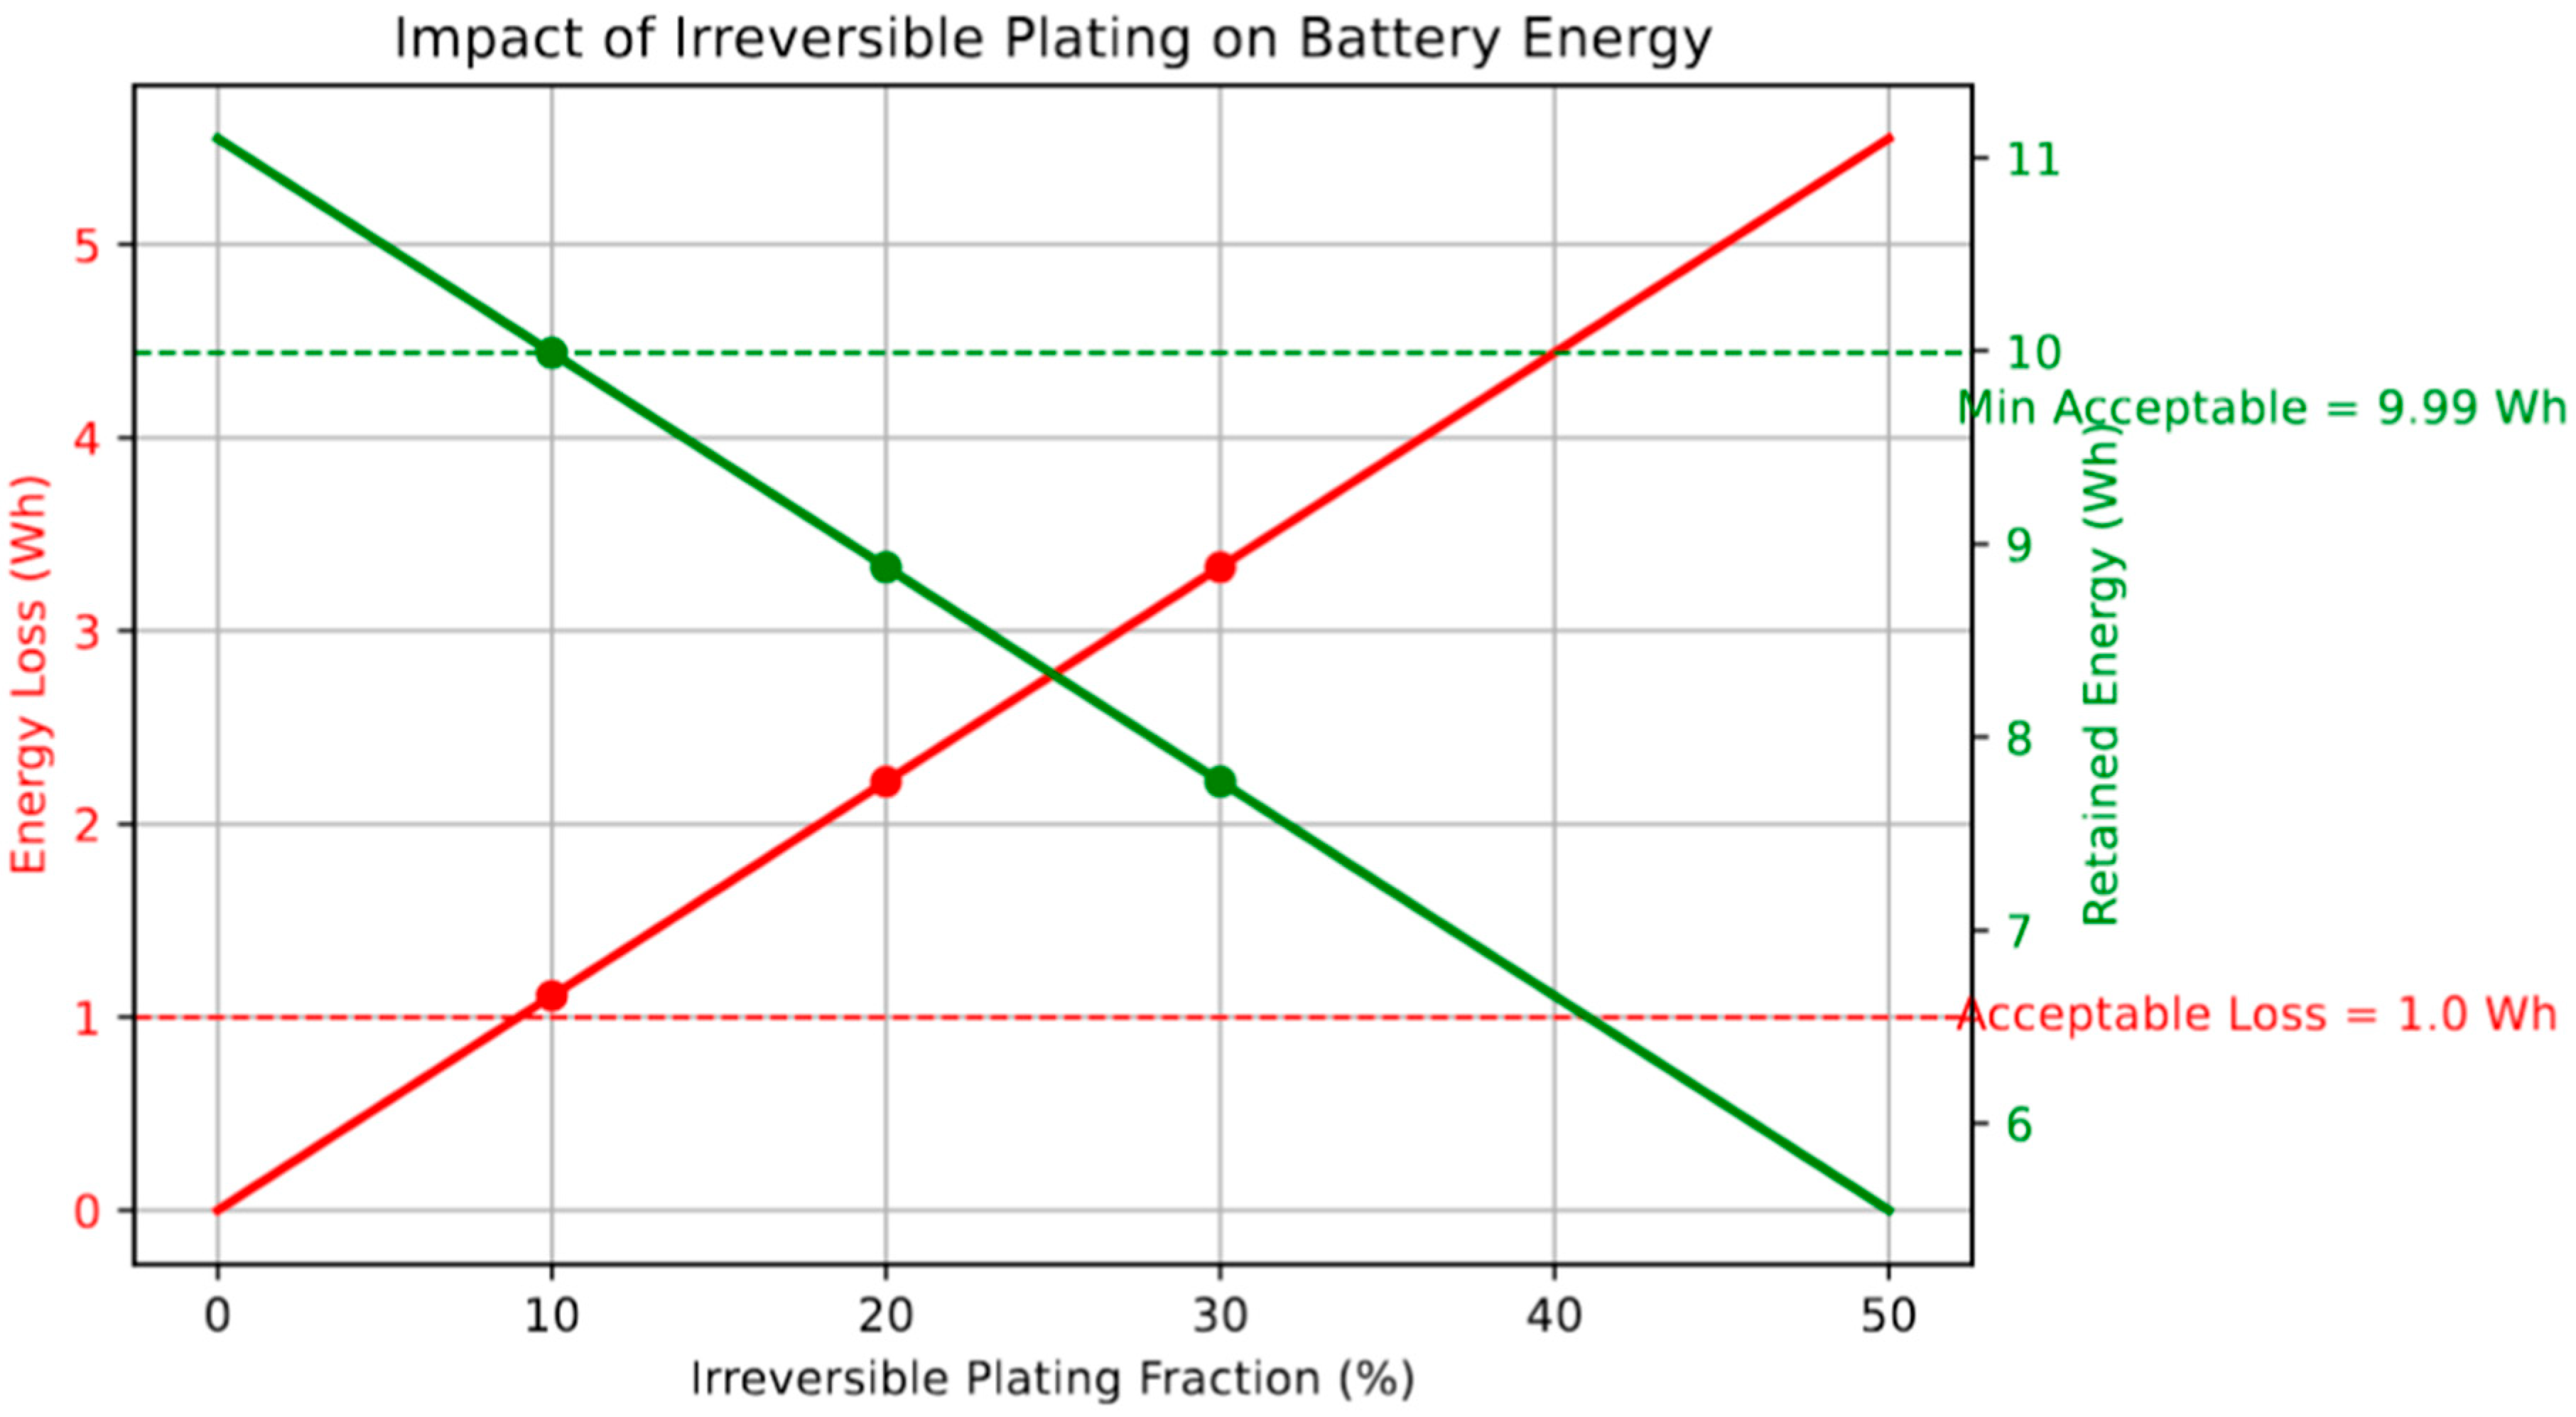
Figure 8), linking electrochemical degradation to practical energy loss. More specifically,
Figure 8 quantifies the energetic consequences of irreversible Li plating by relating the fraction of plated Li that becomes electrochemically inaccessible to the corresponding energy loss in a representative 3 Ah, 3.7 V Li-ion cell. As the irreversible plating fraction increases from 0% to 50%, the energy loss rises linearly from 0 Wh to 5.55 Wh, directly reducing the amount of usable energy from 11.1 Wh to 5.55 Wh. A critical threshold for acceptable degradation can be drawn at an energy loss of 1 Wh, which corresponds to an irreversible fraction of just under 10%. This analysis emphasizes the disproportionate impact of early-stage plating on cell performance and underscores the importance of maintaining high reversibility during fast charging. Such irreversible processes not only lead to capacity fade but also result in active lithium loss, increased cell impedance, and accelerated aging. Therefore, the suppression of irreversible lithium deposition is not only a challenge of efficiency but a prerequisite for reliable long-term energy storage in high-rate applications [
46].
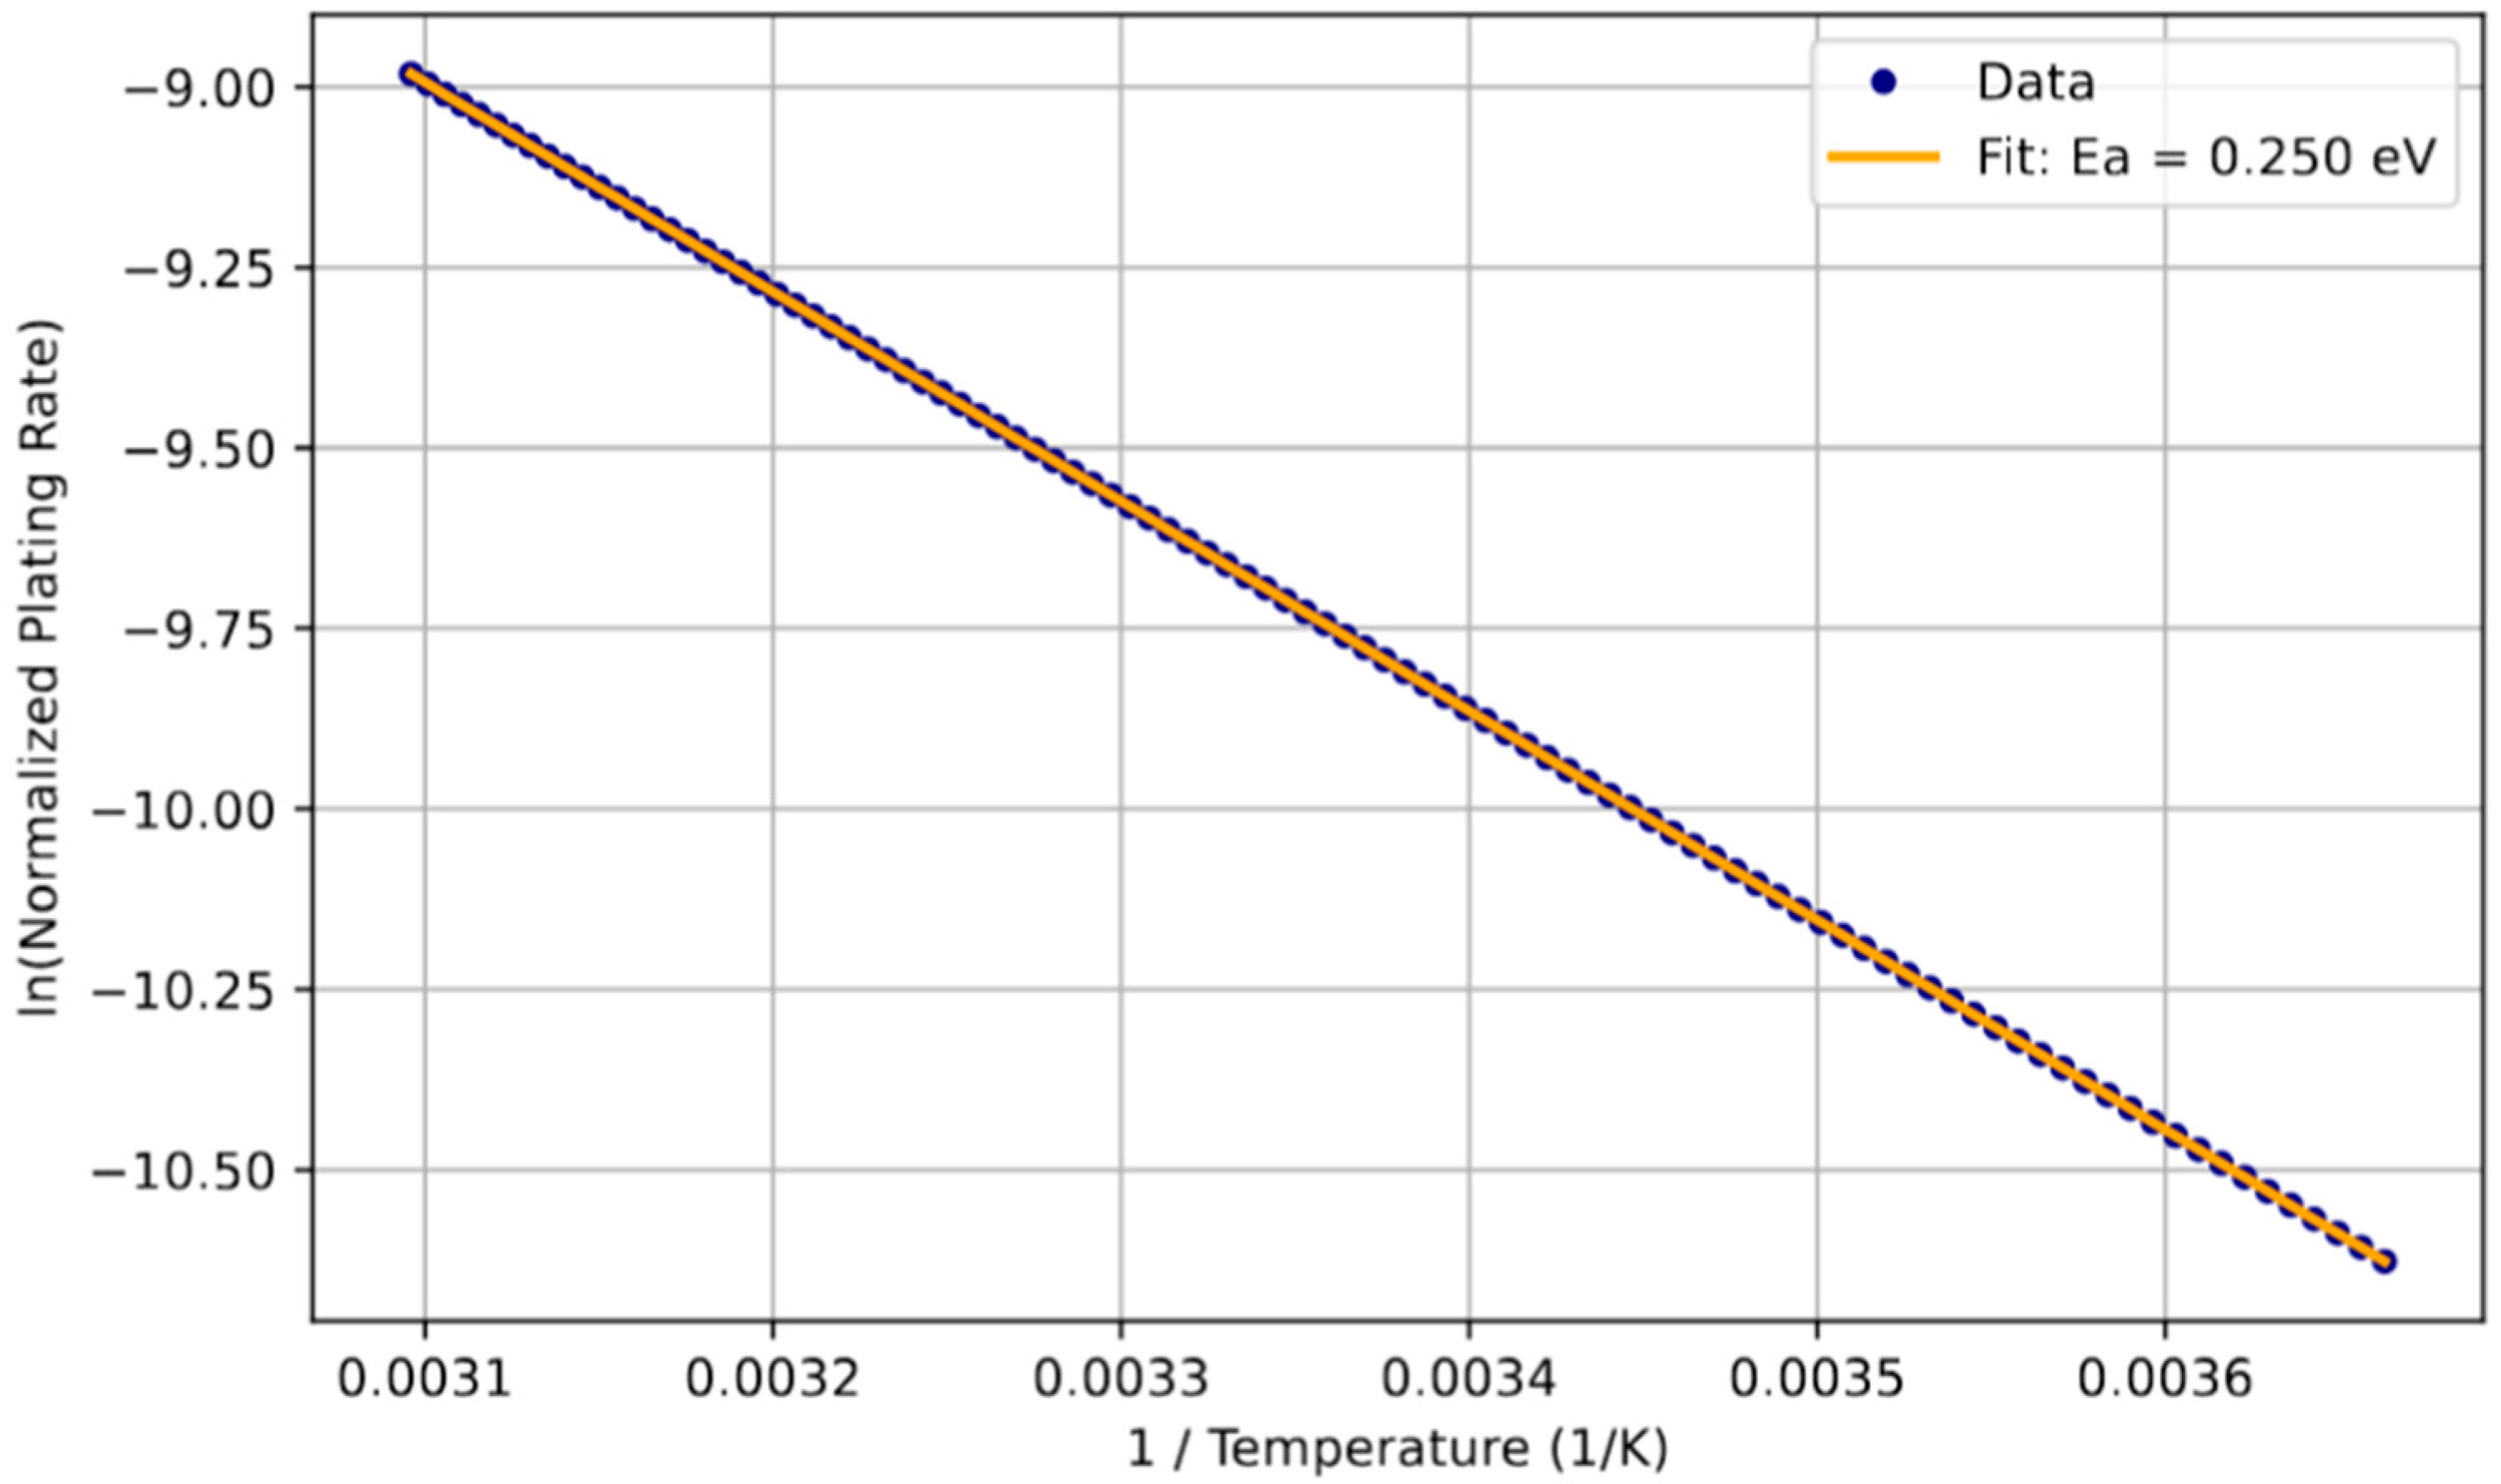
To validate the thermal activation of Li plating dynamics, we analyzed the temperature dependence of the Li plating rate using Arrhenius scaling, see
Figure 9. The linearity of the data confirms that Li plating is a thermally activated process, consistent with an Arrhenius type dependence. Our fit yields an activation energy (
Ea) of approximately 0.25 eV, aligning with values reported for diffusion-limited Li transport. This consistency supports the model’s applicability across thermally constrained regimes. The activation barrier offers critical insight into the thermal sensitivity of plating onset, suggesting that lower temperatures not only exacerbate plating severity but fundamentally hinder the reversibility of deposited Li [
47]. Understanding this dependence is crucial for developing predictive models for BMSs that aim to avoid low-temperature fast charging, where plating risk becomes more pronounced [
48].
It is essential to emphasize the role of internal heat generation (IHG) during fast charging. IHG results from a combination of electrochemical overpotentials, resistive (Joule) heating, and side reactions such as SEI or CEI growth. These thermal effects can lead to localized hotspots that accelerate lithium plating, particularly when heat dissipation is insufficient. Prior studies have shown that temperature non-uniformity within the cell can shift local reaction kinetics, increasing the risk of uneven Li deposition and dendrite formation [
2,
4]. BMSs must therefore integrate thermal sensors and predictive models to dynamically adjust current and cooling strategies during fast charging. Incorporating thermal feedback is essential for preventing plating onset and maintaining long-term safety and efficiency in high-rate applications.
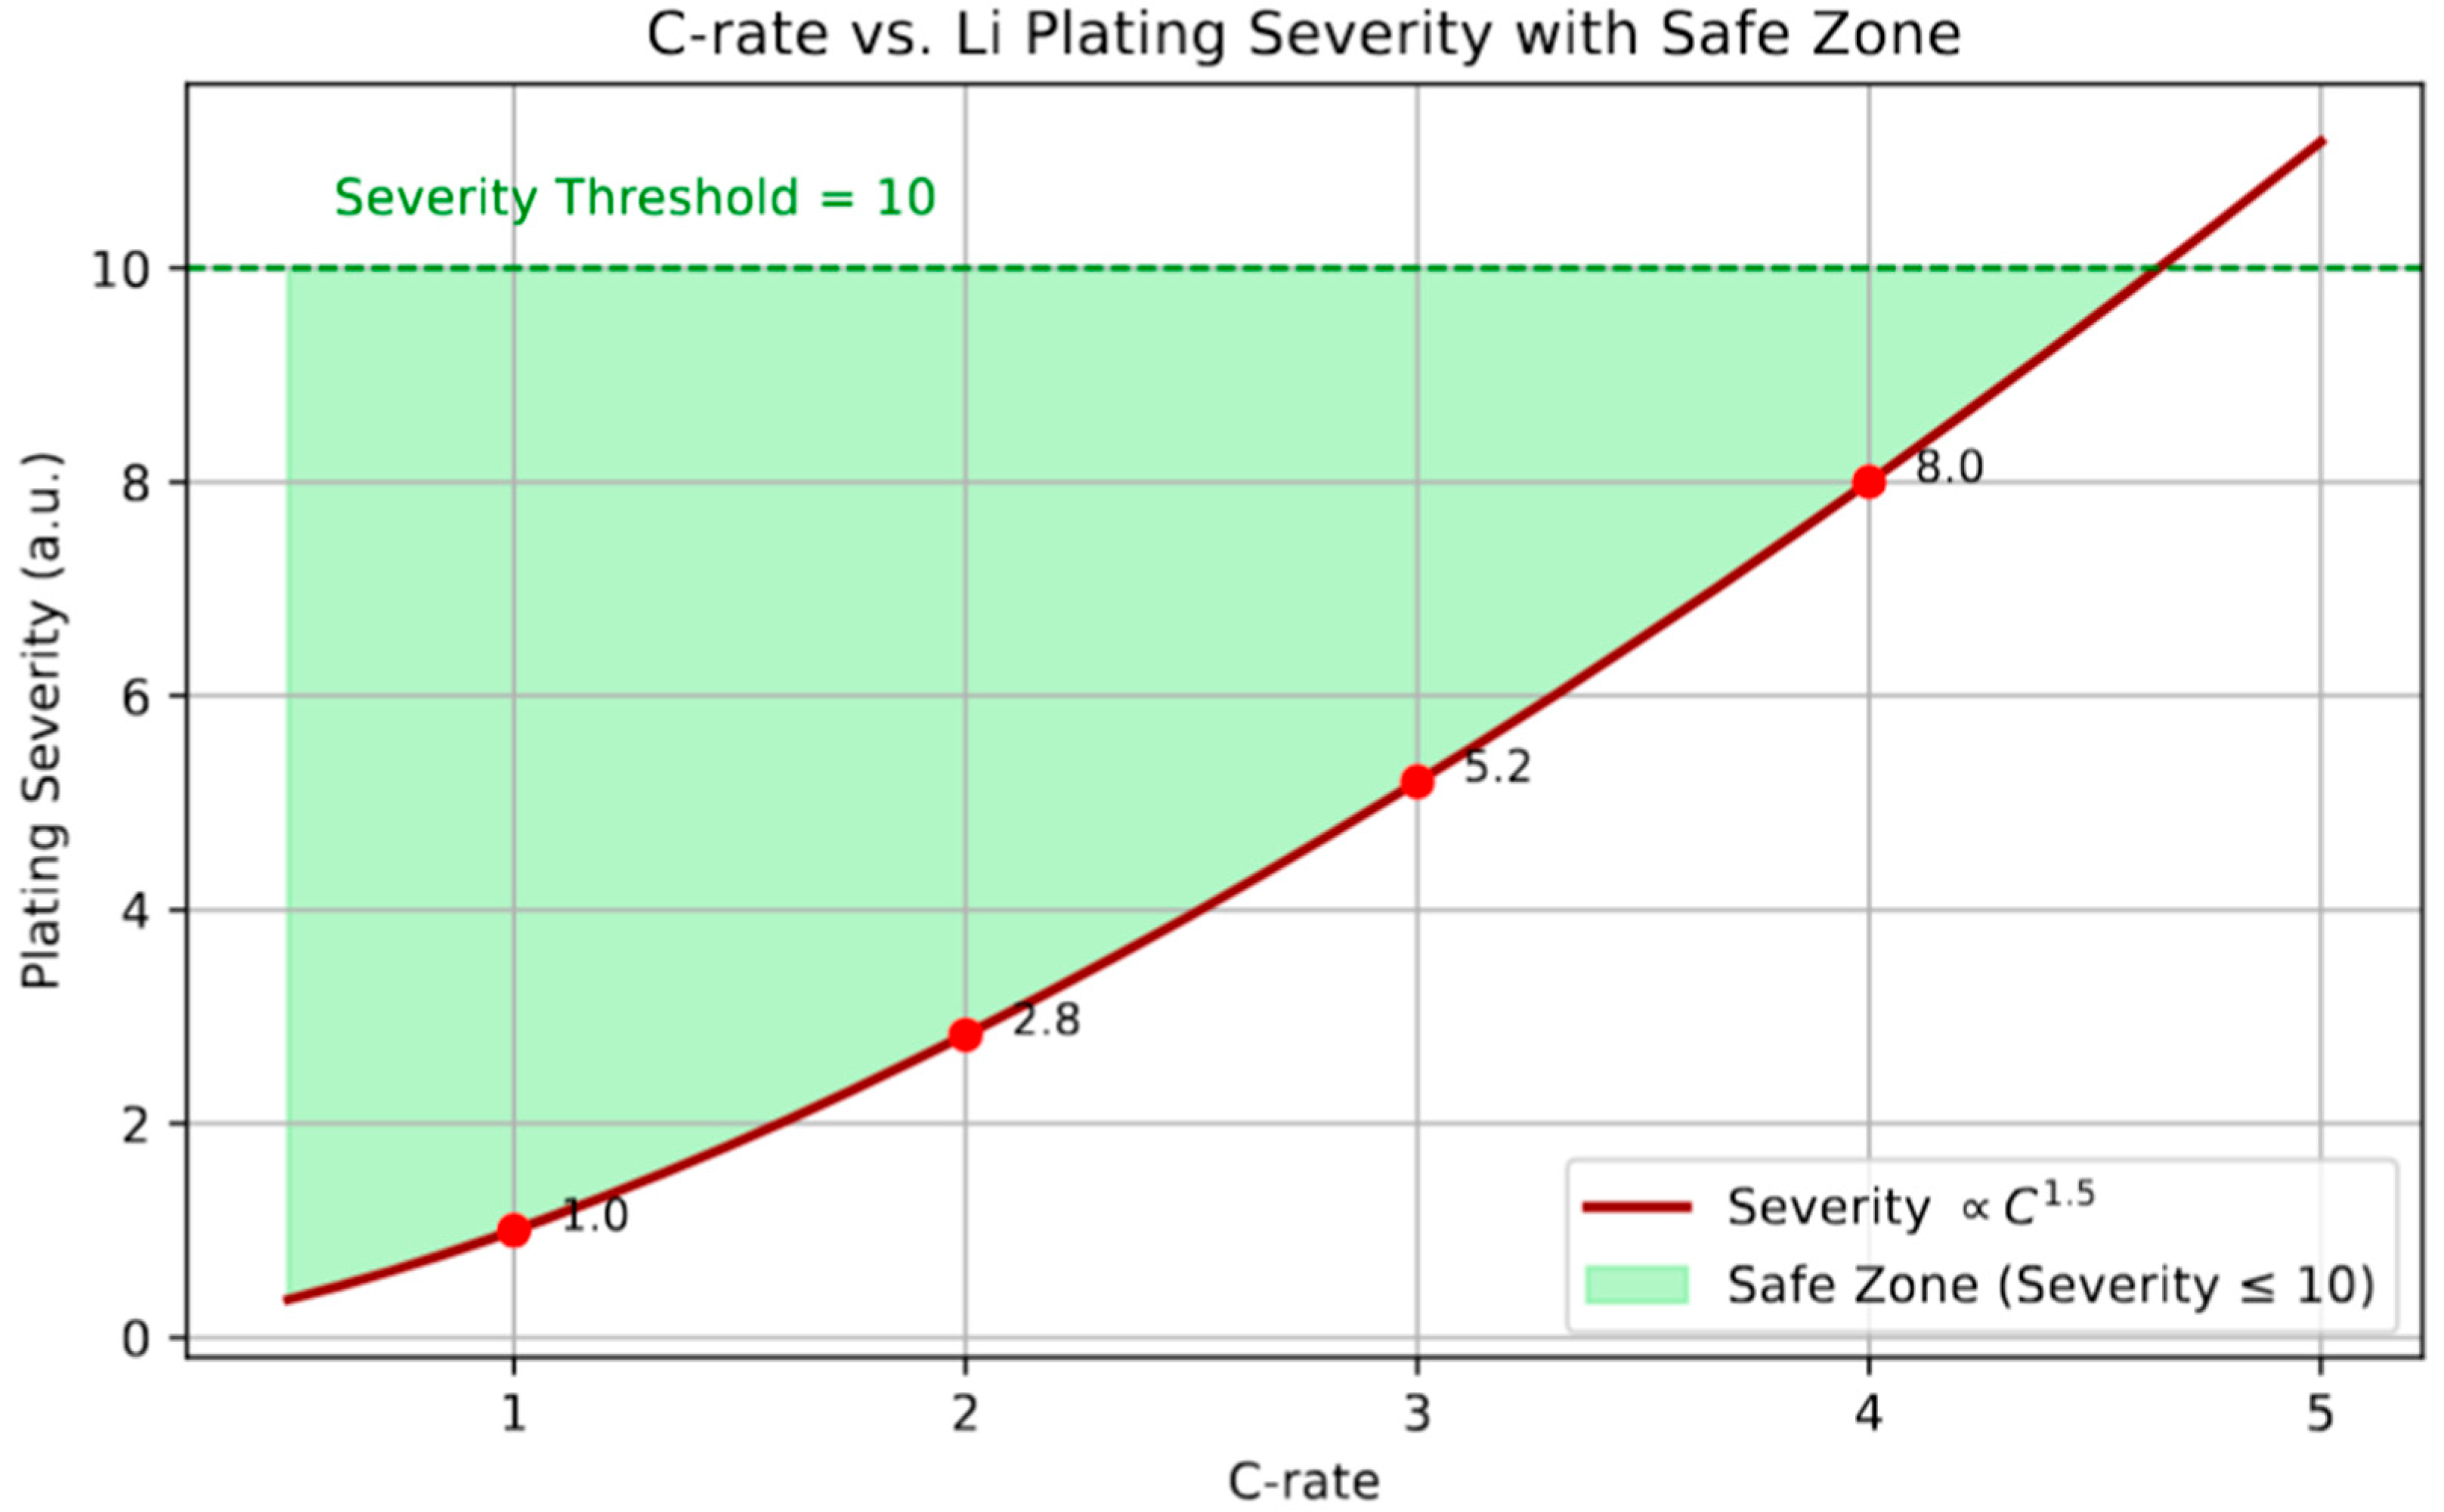
Finally, we assess the empirical relationship between charging rate (C-rate) and Li plating severity, modeled as a power-law dependence (Severity ∝
C1.5), see
Figure 10. This nonlinear escalation reflects the compounded kinetic and diffusion constraints during high-rate charging, where accelerated lithium intercalation leads to local supersaturation and surface deposition. The severity index serves as a surrogate for plating risk and its potential to transition from reversible to irreversible accumulation. A safe operating window is delineated by the severity threshold of 10, beyond which the likelihood of significant lithium metal formation increases markedly. This threshold aligns with experimental findings suggesting that plating-related degradation and safety hazards become pronounced at C-rates exceeding 3C in standard graphite-based systems. Accordingly, identifying and adhering to this safe C-rate limit is vital in the development of fast-charging protocols that avoid irreversible capacity loss while maintaining high charging efficiency. Although the effects of temperature, voltage, and C-rate are explored through parametric simulations across the results (e.g.,
Figure 3,
Figure 4 and
Figure 10), a formal sensitivity analysis was not performed in this study. However, the strong observed gradients—such as the non-linear dependence of plating severity on C-rate (
Figure 10) and the shift in onset SOC with temperature (
Figure 3)—suggest that the model is responsive to key input variables. Future work will include a structured sensitivity analysis using variance-based or perturbation methods to evaluate the robustness of predictions and inform parameter prioritization for practical implementation in battery management systems.
Although the modelling framework employed in this study is based on simplified empirical and kinetic formulations, the simulation results presented in
Figure 3,
Figure 4,
Figure 5,
Figure 6,
Figure 7,
Figure 8,
Figure 9 and
Figure 10 align with experimentally observed trends in lithium plating behaviour under fast-charging conditions. For instance, the predicted onset of plating at lower temperatures and higher C-rates is consistent with data reported in references [
30,
31,
32,
33,
34,
35,
36,
37,
38,
39,
40,
41,
42,
43,
44,
45,
46,
47,
49]. The Arrhenius-derived activation energy (~0.25 eV) also falls within the expected range for diffusion-limited interfacial processes. Moreover, the observed trends in plating severity and reversibility mirror prior findings from post-mortem and in situ diagnostics. These comparisons reinforce the practical validity of the model despite its reduced complexity. Nonetheless, the assumptions made in the empirical SOC threshold and kinetic rate expressions are acknowledged and will be further refined in future work.
While the simulation framework is based on simplified empirical and kinetic formulations, the results closely track key experimental observations. For example, the predicted plating onset at low temperatures and high C-rates (
Figure 3), the reversibility ratio (~0.79), and the derived activation energy (~0.25 eV) all align with values reported in the literature [
30,
39,
47]. Additionally, trends in energy loss and severity as a function of C-rate mirror degradation behavior are seen in diagnostic studies. Although this model does not replace high-fidelity simulations, its agreement with experimental benchmarks supports its use as a practical, predictive tool—particularly in design screening and BMS integration contexts.


