1. Introduction
Global energy concerns and environmental pollution have driven the development of low-carbon technologies. Lithium-ion batteries play a key role in this transition, particularly in electric vehicles [
1]. Meanwhile, lithium-ion batteries, with a high energy density of 250–300 Wh/kg and an energy conversion efficiency exceeding 80%, are widely used in electric vehicle power batteries. However, during high-rate discharge processes, lithium-ion batteries could generate significant heat, rapidly accelerating the rate of internal electrochemical reactions. This would lead to localized overheating [
2]. Additionally, batteries operating in harsh environments may experience extreme temperatures that are either excessively high or low [
3]. When ambient temperatures are too high, not only does battery performance degrade, but it can also trigger thermal runaway. Conversely, in low-temperature environments, the diffusion of lithium ions plummets, similarly causing a decline in battery performance [
4,
5].
Thermal analysis of lithium-ion batteries relies on accurate thermal models. However, the electrochemical, electric, and temperature fields interact with each other, forming a complex coupling effect during the charge/discharge process [
6]. In current research, lithium-ion battery models are primarily categorized into three types: electrical–thermal coupling models, data-driven models, and electrochemical models. Among them, electrical–thermal coupling models are always based on equivalent circuit models (ECMs), such as the Rint model [
7], Thevenin model [
8], and dual polarization (DP) model [
9]. These models are composed of components like capacitors, resistors, and ideal voltage sources. These models are commonly used to describe the dynamic response relationship between battery input and output [
10]. Overall, electrical–thermal coupling models offer advantages such as fewer system parameters, low computational complexity, and easy parameter identification [
11]. However, they lack the capability to characterize the internal mechanisms of lithium-ion batteries. On the other hand, data-driven models do not consider the internal electrochemical reaction mechanisms and processes of batteries but directly establish a mapping mechanism between input and output [
12]. In general, such models rely on extensive measured data for training to improve accuracy and adaptability to various operating conditions. Consequently, their reliability in practical applications remains limited.
In comparison, electrochemical–thermal coupling models use partial differential equations to precisely capture the ion migration and diffusion mechanisms within batteries [
13]. The electrochemical–thermal coupling model combines the lithium-ion concentration, current density, and potential distribution, with the help of the law of energy conservation, to determine the heat generation rate at different locations and times. Subsequently, the temperature field is obtained through thermal boundary conditions. The electrochemical–thermal coupling model fully accounts for all heat generation aspects involved in electrochemical reactions [
14]. It is primarily based on the porous electrode theory proposed by Newman et al. [
15].
The electrochemical–thermal coupling model improves the accuracy of heat generation analysis in lithium-ion batteries. It captures non-uniform and transient heat processes by examining reactant concentration gradients and current density distribution inside the cell. This approach enhances temperature field simulation reliability. Jeon D [
16] investigated the thermal behavior of 18,650 cylindrical batteries during charge/discharge processes at various rates based on the pseudo-two-dimensions (P2D) model. The results indicated that the presence of entropic heat caused distinct thermal behaviors between the charge and discharge processes. Specifically, the battery exhibited higher surface temperatures during discharge compared to charge, while irreversible heat contribution rose progressively with increasing C-rates. Shi Y et al. [
17] focused on 18,650 lithium manganese oxide (LMO) batteries and established a single-cell electrochemical–thermal coupling model based on electrochemical modeling and heat transfer theory. They analyzed heat generation patterns during charge/discharge and the cooling effects of air convection. The study found that high-rate charge/discharge significantly shortened the voltage plateau duration and reduced capacity, while air cooling effectively suppressed temperature rise. Chiew J et al. [
18] incorporated thermodynamic analysis into the P2D model framework and developed a electrochemical–thermal coupling model using the finite element method. Through battery disassembly and internal component characterization to acquire essential parameters, their investigation of lithium iron phosphate (LFP) batteries revealed rate-dependent voltage dynamics and thermal profiles, highlighting the powerful capability of electrochemical–thermal coupling models in lithium-ion battery thermal characteristics analysis. Huang W et al. [
19] constructed an electrochemical–thermal coupling model based on the COMSOL simulation software V5.4. By integrating thermal runaway equations, they analyzed the reaction mechanisms under high-temperature, short-circuit, and overcharge and derived an analytical expression for puncture-induced short-circuit temperature. The results indicated that high temperatures, side reactions, and short-circuit location directly influenced the thermal runaway speed and peak temperature. Overcharge duration and tab position affected voltage surges and temperature distribution. Lin H et al. [
20] developed a three-dimensional electrochemical–thermal coupling model for LFP batteries to simulate temperature field distributions under different discharge rates. The results showed that non-uniformity of the internal temperature intensified during high-rate discharge, with the geometric center reaching the highest temperature (while the terminal tabs remained the coolest). Both temperature differences and heating rates increased significantly with higher discharge rates. Mei W et al. [
21] established a three-dimensional (3D) lumped thermal model for 26,650 cylindrical batteries, and conducted a comparative analysis of the thermal characteristics during the charge and discharge processes. They also investigated the influence of electrode design parameters in pouch cells, such as electrode thickness, particle radius, and porosity, on battery performance and internal distribution. Kuang K et al. [
22] proposed an efficient electrochemical–thermal coupling modeling method by classifying parameters and calibrating key parameters (e.g.,
Ds,
k) through pulse experiments. The model was validated using a heat generation model, achieving voltage errors <10 mV and temperature errors <1.1 °C. Sensitivity analysis revealed that
Ds and
k affected capacity and impedance. This modeling approach balanced high accuracy with low computational cost. Lu H et al. [
23] established a 1D electrochemical and 3D thermal coupling model for blade batteries to investigate the effects of three key variables (including ambient temperature, charging rate, and a heat transfer coefficient) on the temperature rise process of long/short blade batteries and the maximum temperature difference at the end of charging. Through heat production decomposition (HPD), they further revealed the heat generation contributions from different battery components. Li W et al. [
24] developed an electrochemical–thermal coupling model based on the OpenFOAM open-source platform for large-scale thermal management system simulations. Using this model, they investigated the impedance variations during battery operation, heat generation mechanisms, and the impact of cell inconsistency on the temperature distribution within the module.
However, most existing models are based on the simplified 1D and 2D Newman framework, which overlooks variations in battery density distribution. These models are suitable for small-scale cells. They exhibit significant thermal prediction errors in power or energy storage batteries due to pronounced 3D effects. To address these limitations, this study develops a fully coupled 3D electrochemical–thermal model. The model uniquely integrates a complete 3D coupling of electrochemical and thermal dynamics, and the impact of structural parameter analysis (thickness, conductivity) on thermal behavior is analyzed based on the electrochemical–thermal coupling model. Moreover, extreme operating conditions (up to 10C discharge) are also studied.
This approach enables precise prediction of battery thermal behavior while providing practical design insights unavailable in conventional 1D/2D models. Through simulation analysis of discharge characteristics, key factors affecting heat generation are identified, and the methods to enhance battery safety are then proposed.
2. Model
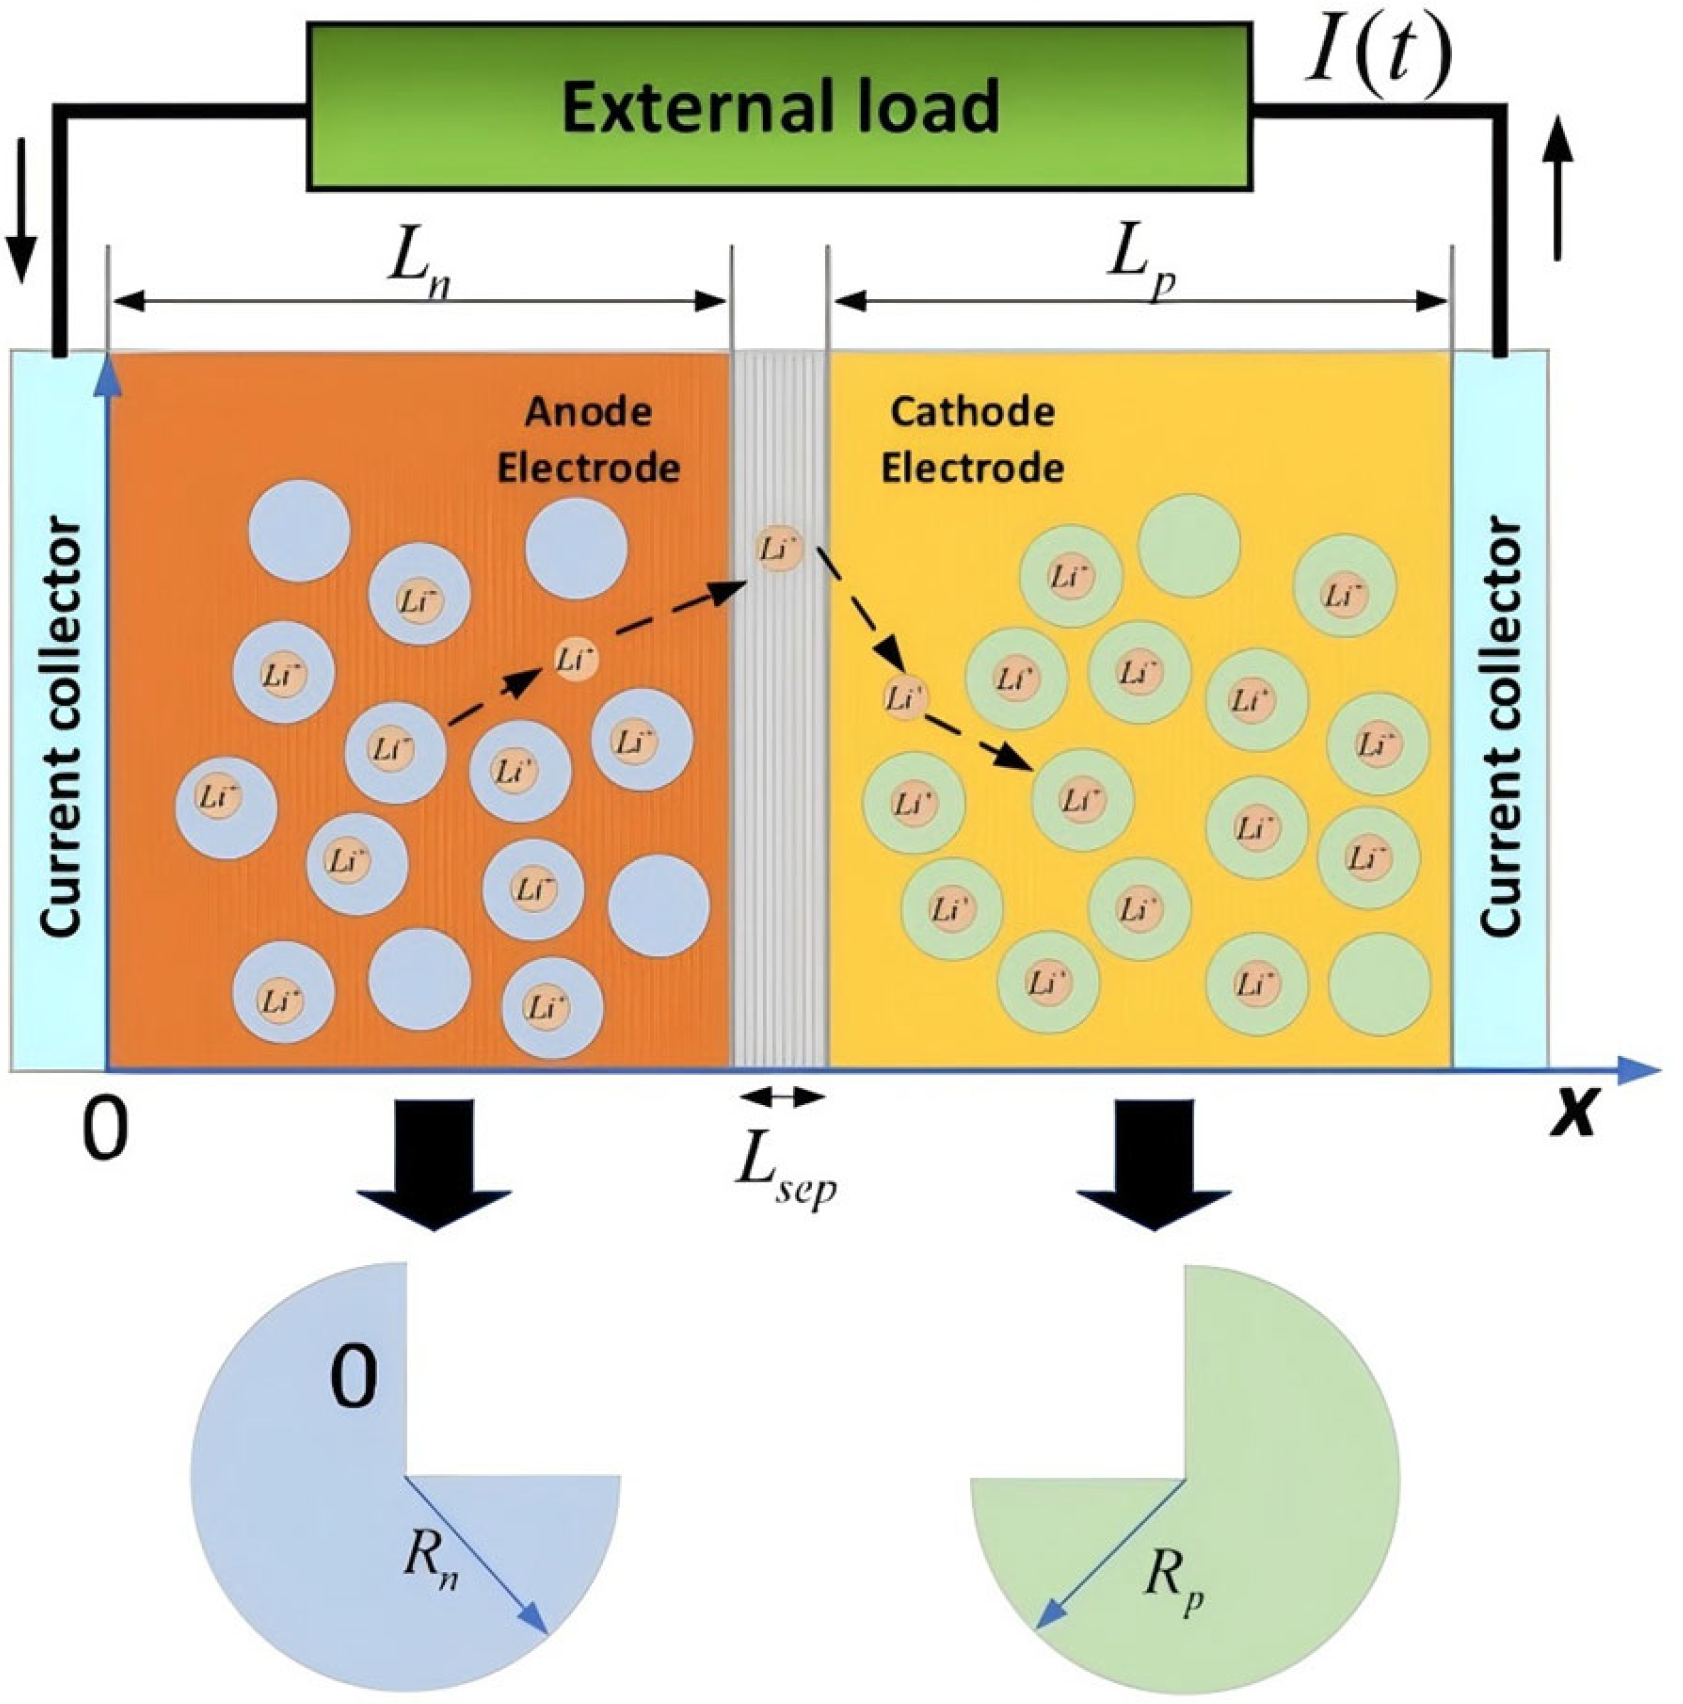
The electrochemical–thermal coupling model describes how electrochemical reactions interact with heat transfer in lithium-ion batteries. During operation, lithium ions move through the electrolyte between the cathode and anode, enabling charge transfer and energy storage (
Figure 1).
Reaction and diffusion rates depend on temperature, charge transfer resistance, and concentration gradients. Heat is generated as these reactions release or absorb energy. This heat distribution and conduction critically affect the battery’s stability and lifespan. By combining electrochemical and thermal dynamics, the model analyzes key performance metrics: efficiency, temperature profiles, and heat dissipation.
2.1. Electrochemical Model
The electrochemical behavior of lithium-ion batteries is modeled through coupled multi-physics equations under porous electrode theory, comprising five governing partial differential equation systems: solid/liquid phase lithium-ion diffusion equations (Fick’s law), solid/liquid phase charge conservation equations (Ohm’s law), and an electrode reaction kinetics equation (Butler–Volmer equation).
- (1)
Solid-phase lithium-ion diffusion equation
The solid-phase lithium-ion diffusion equation describes the lithium-ion diffusion process within electrode active material particles, governed by Fick’s second law.
where
cₛ is the solid Li
+ concentration,
Dₛ is the solid diffusion coefficient,
r is the particle radius, and
t is time.
Assuming the lithium-ion concentration at the center of the active material particles remains constant, and does not change over time, then the boundary condition is as follows:
If the ion flux passing through the particle surface equals the ion flux produced by the electrochemical reaction, then
where
j is the local current density due to electrochemical reactions.
- (2)
Solid-phase charge conservation equation
According to Ohm’s law, the solid-phase potential in the electrode region could be expressed as follows:
where
σseff is the effective solid-phase conductivity,
ϕₛ is the solid-phase potential,
εs is the solid-phase volume fraction, and
σs is solid-phase conductivity.
The solid-phase potentials on both sides of the separator are the same, and the solid-phase potentials of the two electrodes are also the same, which can be expressed as follows:
- (3)
Liquid-phase lithium-ion diffusion equation
The liquid-phase lithium-ion diffusion equation describes the diffusion process of lithium ions in the electrolyte. It is typically formulated by the Nernst–Planck equation.
where
ce is the Li
+ concentration in the electrolyte,
εe is volume fraction occupied by the electrolyte,
Deeff is the effective diffusion coefficient of Li
+ in the electrolyte,
t+ is the transference number of Li
+, and
F is the Faraday constant.
- (4)
Liquid-phase charge conservation equation
The current density in the electrolyte phase consists of two components, including the migration current and the diffusion current, which satisfies
where
jl is the liquid-phase current density,
κeeff is the effective ionic conductivity of electrolyte,
Φe is the liquid-phase potential, and
T is the thermodynamic temperature.
- (5)
Electrode reaction kinetics equation
The electrochemical reaction process of lithium ions at the electrode–electrolyte interface is typically described by the Butler–Volmer equation:
where
j0 is the exchange current density,
αa is the anode transfer coefficient,
αc is the cathode transfer coefficient,
K is the reaction rate coefficient,
cs,max is the maximum intercalation concentration in solid particles,
cs,surf is the surface concentration of solid particles, and
η is the overpotential.
η and
j0 are the key parameters determining the progress of the electrochemical reaction, where η is defined as follows:
where
Ueq is the thermodynamic equilibrium potential.
2.2. Thermal Model
To quantitatively analyze the thermal characteristics of lithium-ion batteries, understanding the fundamental principles of heat generation is necessary. The total heat generated (
Q) by a lithium-ion battery consists of four components, including electrochemical reaction heat (
Qr), polarization internal resistance heat (
Qp), Ohmic internal resistance heat (
Qj), and side reaction heat (
Qs). Thus, the total heat generation of the battery can be expressed as follows:
- (1)
Electrochemical reaction heat (Qr)
Electrochemical heat (
Qr) results from entropy changes during lithium-ion battery reactions. It is negative during discharge (heat release) and positive during charge (heat absorption). The heat is calculated as follows:
where
I is the current during the charge/discharge operation.
- (2)
Polarization internal resistance heat (Qp)
Qp represents the heat generated by polarization resistance during lithium-ion battery operation. This heat is always positive, as polarization releases energy during charge/discharge. The heat generation is calculated as follows:
where
Rp is the polarization resistance.
- (3)
Ohmic internal resistance heat (Qj)
Qj is the irreversible heat generated by internal resistance in lithium-ion batteries. It occurs in conductive layers during operation, which is calculated as follows:
where
Rj is the Ohmic resistance.
- (4)
Side reaction heat (Qs)
Qₛ refers to heat generated during abnormal charge/discharge conditions. It is typically negligible in total heat calculations.
The total internal heat generation (
Q) is then given by
2.3. Electrochemical–Thermal Coupling Model
Lithium-ion batteries exhibit coupling between electrochemical reactions and thermal effects during operation. First, the heat generated by electrochemical reactions induces temperature variations. Conversely, these temperature changes significantly influence electrochemical parameters and reaction kinetics. To accurately characterize this interaction, a coupling framework integrating electrochemical and thermal models must be established.
- (1)
Temperature dependent parameter modeling
To account for the temperature sensitivity of electrochemical parameters, we establish temperature-dependent relationships using the Arrhenius equation
where
X(T) is the temperature-dependent parameter, like the solid-phase diffusion coefficient
Ds, reaction rate coefficient
K, etc.;
Tref is the reference temperature;
Xref is the reference value at
Tref; and
Ea is the activation energy.
Electrolyte properties (e.g., the liquid-phase diffusion coefficient De, ionic conductivity κe) follow analogous temperature-correction rules. These relationships enable bidirectional coupling between electrochemical and thermal models.
- (2)
Electrochemical–thermal model coupling mechanism
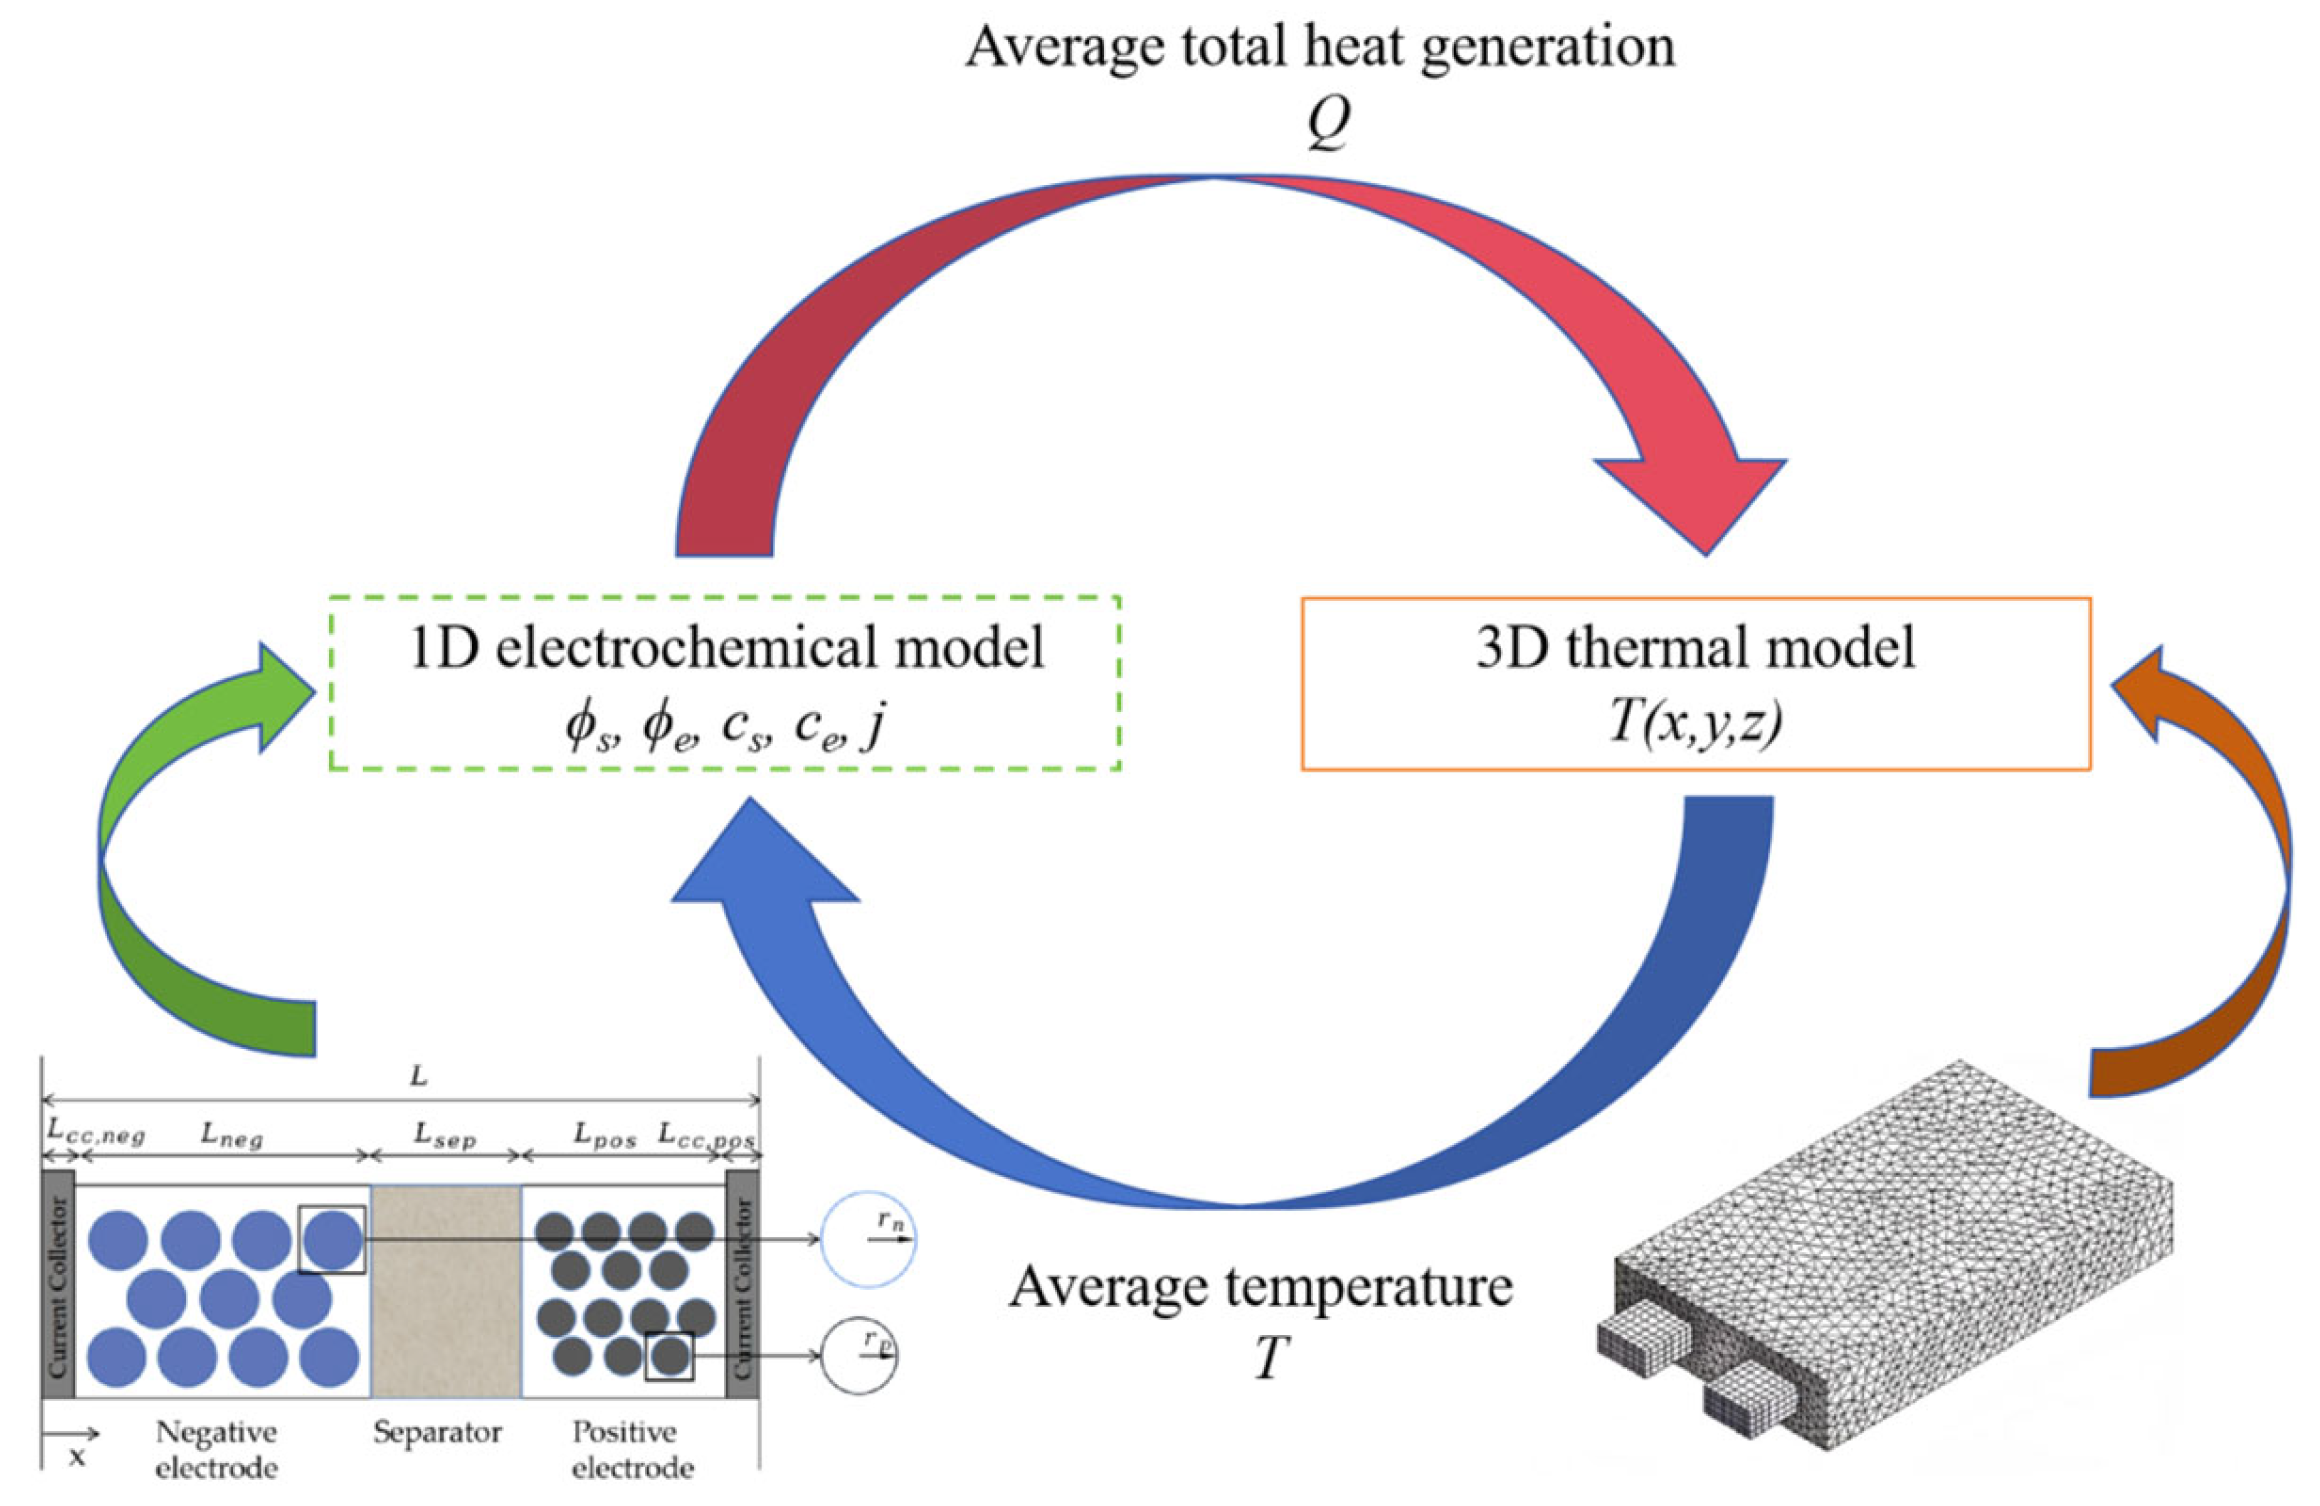
The coupling between electrochemical and thermal models is achieved through temperature-dependent parameter interactions, as illustrated in
Figure 2.
By solving a 1D electrochemical model, the solid/liquid phase potentials (
ϕs,
ϕe), lithium-ion concentrations (
cs,
ce), and current density (
j) could be obtained. The average total heat generation
Q, which includes contributions from Ohmic, polarization, and electrochemical reaction heating, is then calculated. The total heat generation
Q is transferred to the 3D thermal model. The energy conservation equation is expressed as follows:
where
ρ is the bulk density of the battery,
Cp is the bulk specific heat capacity, and
λ is the bulk thermal conductivity. ∇
2T represents the three-dimensional Laplacian operator of the temperature field, which can be explicitly expanded as follows:
According to Newton’s law of cooling, ignoring the radiative heat transfer, the relationship between the battery temperature and the ambient temperature is expressed as follows:
where
Tamb is the ambient temperature and
h is the convective heat transfer coefficient.
The temperature field T(x,y,z) is solved using the thermal model. The resulting 3D temperature distribution is fed back to the electrochemical model to determine the average temperature. This temperature-dependent feedback updates critical parameters (e.g., the solid-phase diffusion coefficient Ds, reaction rate coefficient K) in the 1D electrochemical model, thereby establishing bidirectional coupling between the electrochemical and thermal frameworks.
2.4. Electrochemical–Thermal Coupling Parameters
The battery studied in this study is a prismatic single-cell battery used in a certain model of the Toyota Prius. Its specification parameters are listed in
Table 1 below.
The positive and negative active electrode materials are LiFePO
4 and graphite, respectively. The current collector materials for the positive and negative electrodes are aluminum and copper, and the electrolyte is LiPF
6. The temperature dependence of key electrochemical parameters, including the solid-phase diffusion coefficient
Ds [
25], liquid-phase diffusion coefficient
De [
26], liquid-phase conductivity
κe [
27], and Li
+ transference number
t+ [
28], during battery operation is governed by the following equations:
The electrochemical–thermal coupling parameters are listed in
Table 2.
A 3D model of the battery is developed based on a simplified geometric configuration. Due to the complexity of the original battery model, features such as bosses, fillets, and grooves—which exhibit negligible effects on discharge-induced thermal behavior—are eliminated to enhance computational efficiency. The simplified model retained critical dimensions with a cell body measuring 91 mm (length) × 26 mm (width) × 148 mm (height) and positive/negative tabs with dimensions of 15 mm (length) × 10 mm (width) × 15 mm (height). The tabs and cell body are subsequently defined as independent geometric entities.
Given the simplified cuboid geometry, hexahedral elements are adopted for meshing in the finite element analysis, employing a minimum element size of 3 mm while retaining default settings for other meshing parameters (
Figure 3). The resulting mesh achieved an average quality metric of 0.97831 with 21,809 elements, ensuring accurate temperature field predictions without geometric distortion while balancing computational precision and simulation time.
3. Results and Discussion
3.1. Model Validation
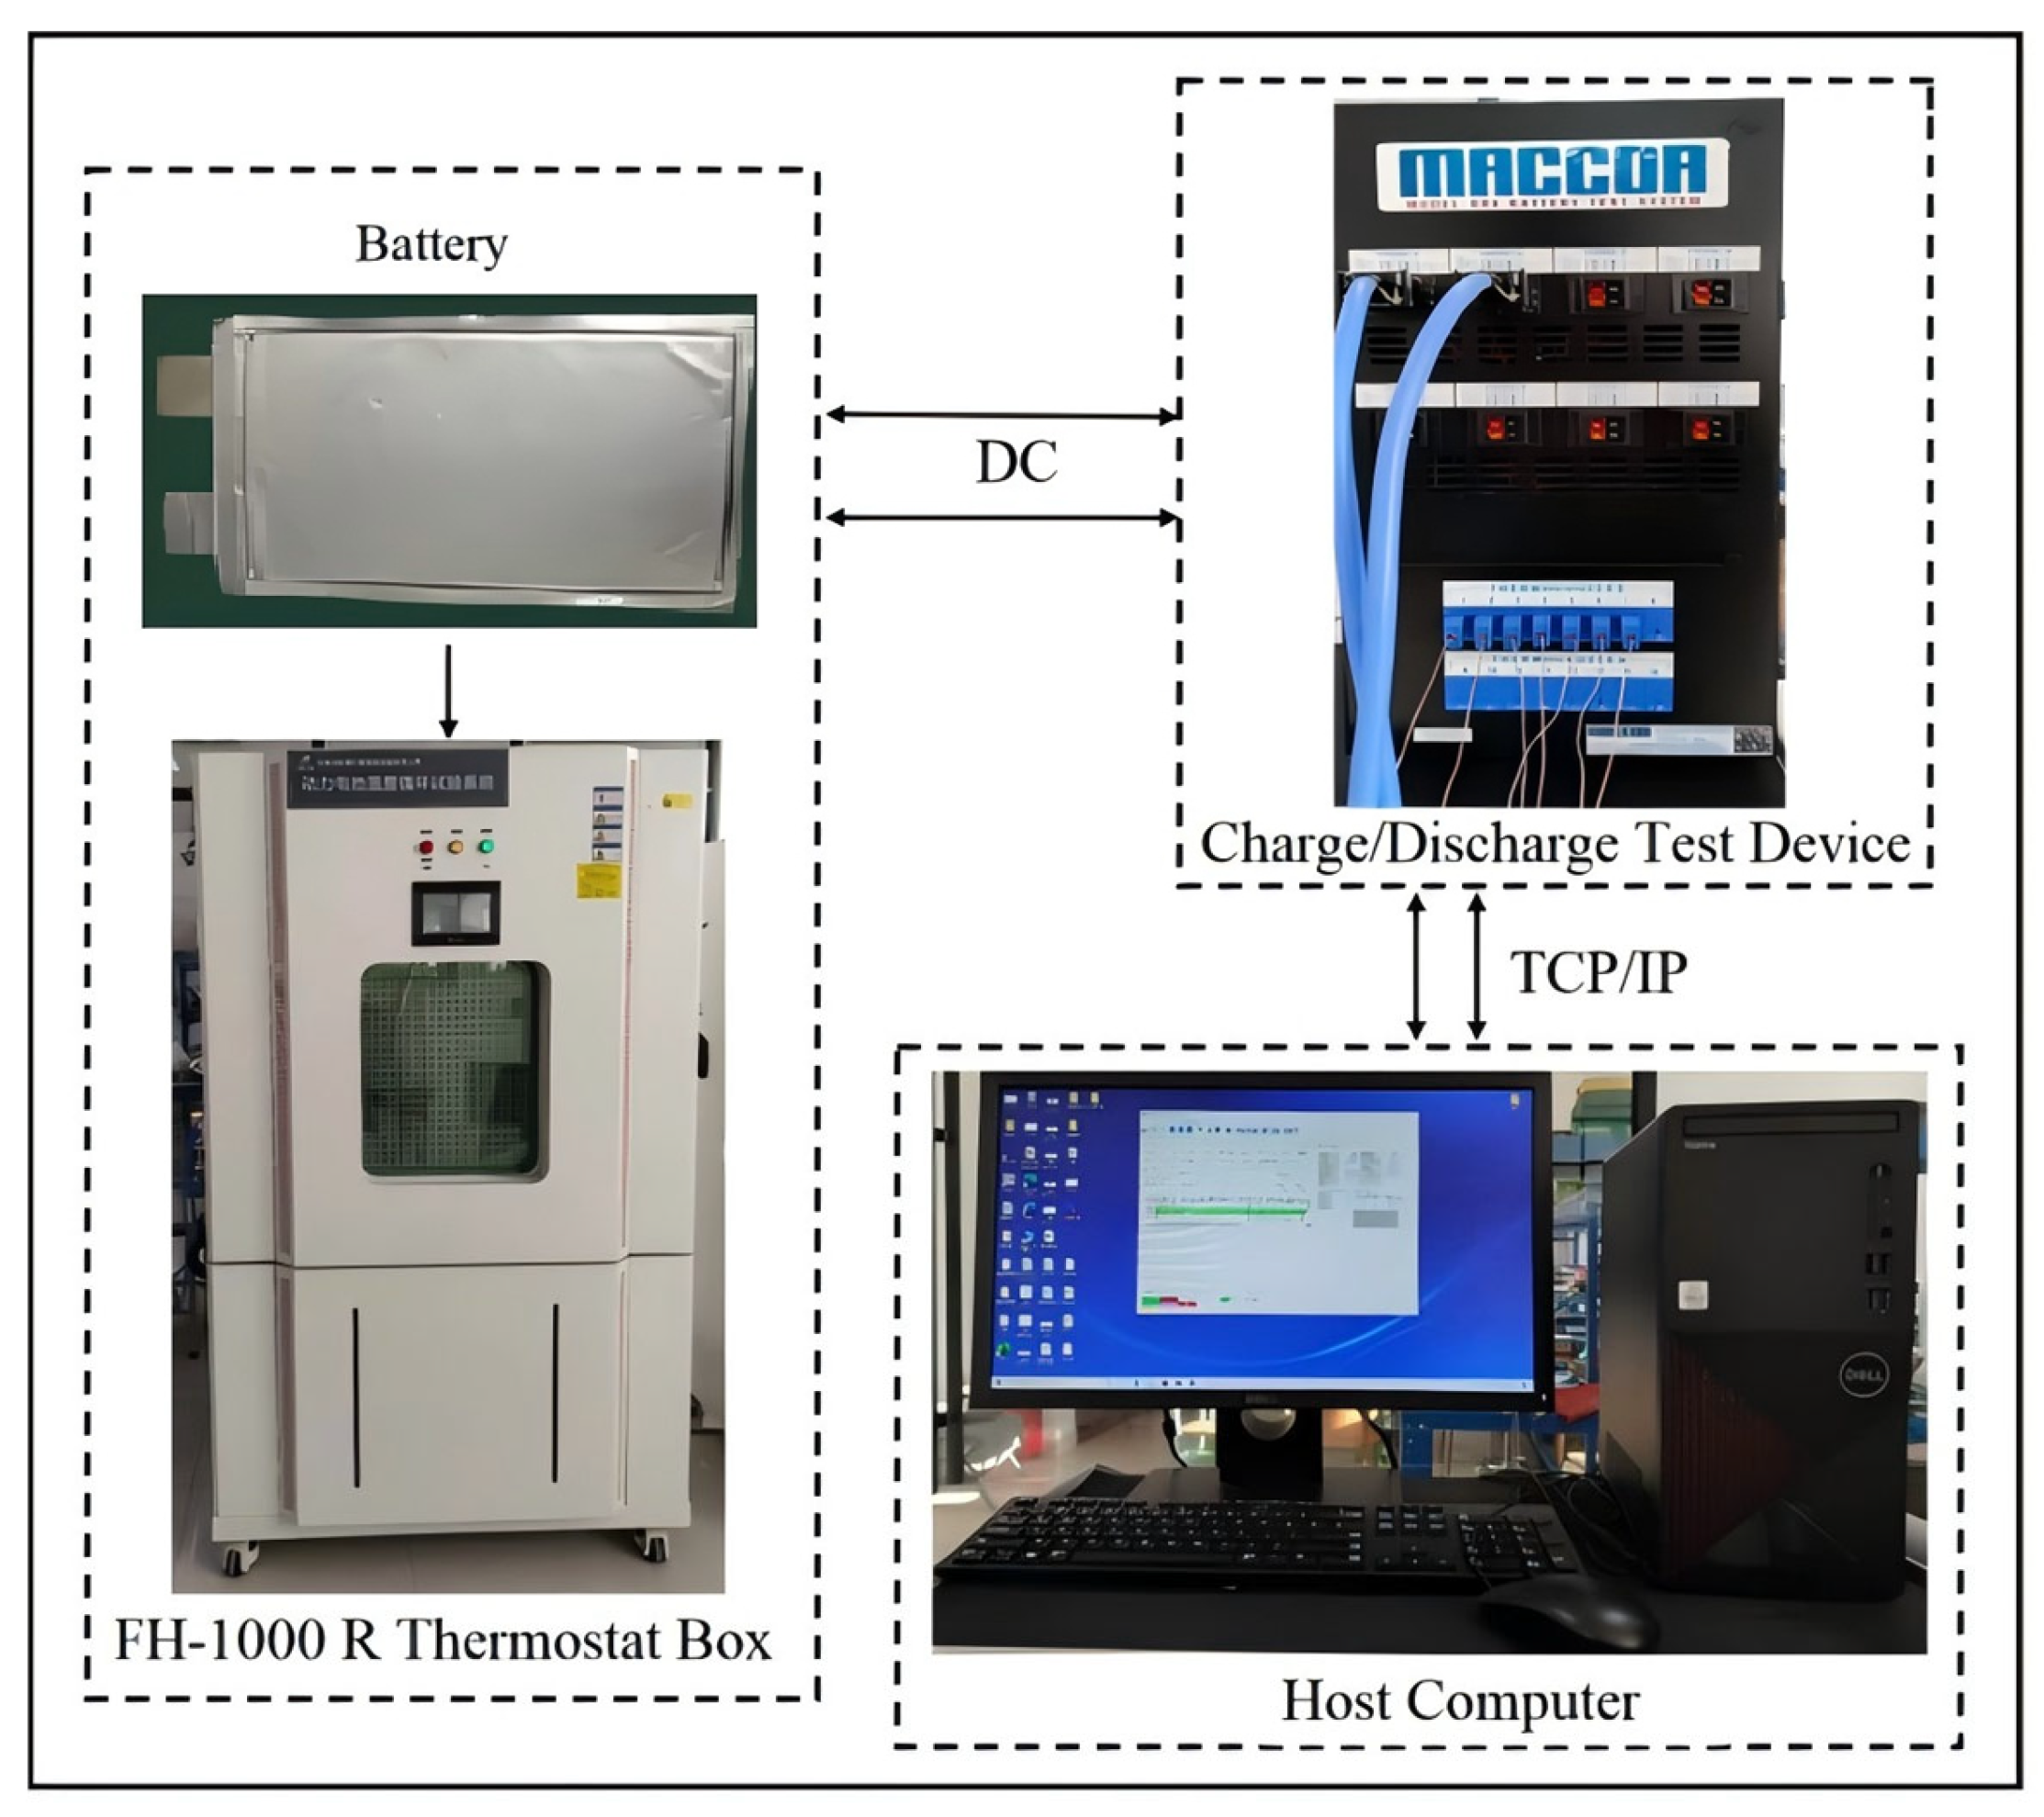
Validation of the electrochemical–thermal coupling model for power batteries necessitates experimental verification based on charge–discharge test data. An experimental platform is constructed, comprising a lithium-ion battery, charge/discharge test device (MACCOR series), a thermostat box, and a host computer, as illustrated in
Figure 4.
The MACCOR test system is employed to perform controlled charge/discharge cycling. Upon interfacing with the host computer, programmable control software is utilized to design test protocols and define operational conditions, enabling real-time acquisition of battery voltage, temperature, and capacity data during testing. Environmental temperature regulation is achieved using an FH-1000R environmental thermostat box with a controllable range of −40 to 150 °C. The integrated touchscreen interface facilitated real-time monitoring of the environmental temperature.
To validate the electrochemical–thermal coupling model’s accuracy, a comparison is performed between simulation results and experimental data. The validation procedure consisted of the following steps:
- (1)
Thermal Equilibrium Stabilization
The test battery is placed in an environmental chamber maintained at 25 ± 0.3 °C for 30 min to ensure thermal equilibrium, eliminating initial temperature deviations.
- (2)
Initial State Calibration
The battery undergoes a 1C constant-current discharge to a 2.75 V cutoff voltage, followed by a 30-min rest period to allow sufficient polarization decay.
- (3)
Standardized Charge Procedure
A constant current constant voltage (CCCV) charge procedure is implemented: The battery is under constant current (1C) charge to 4.2 V. Then the battery undergoes constant voltage charge until the current decays to 0.05C. This procedure strictly adheres to industrial charge standards to prevent overcharge effects.
- (4)
Electrochemical Relaxation
The battery is rested for 30 min to equilibrate internal temperature and chemical states.
- (5)
Discharge Characterization
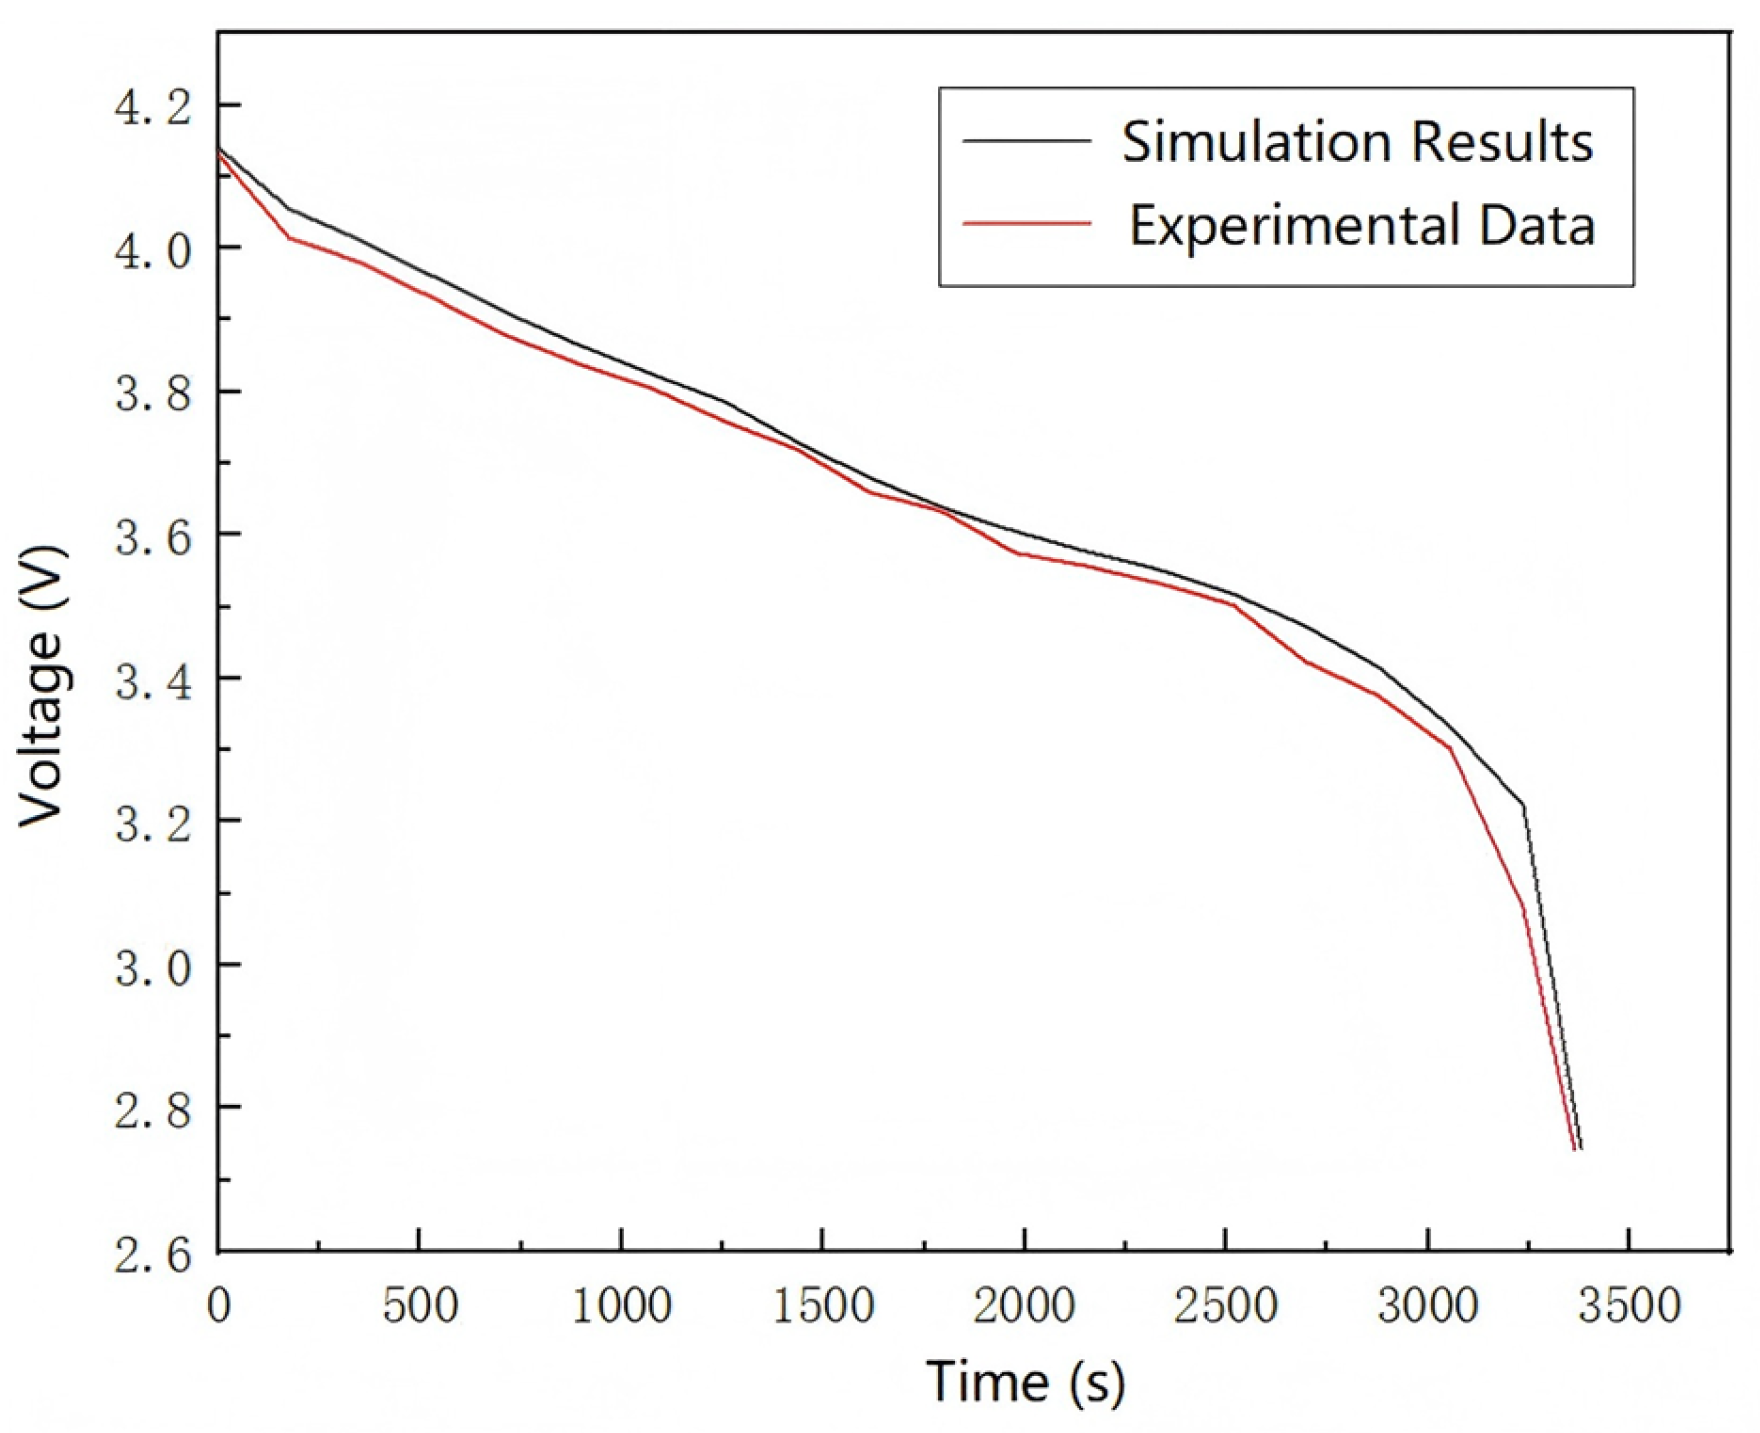
Final 1C constant current discharge is performed with continuous voltage time monitoring until reaching a 2.75 V cutoff (
Figure 5). The complete discharge profile provides critical validation data for the thermal–electrochemical model.
The experimental data curve exhibits a consistent declining trend with the simulation results. Upon reaching the voltage range of 3.7 V, the rate of voltage decline decelerates significantly, indicating the battery has entered its discharge plateau. The experimental data demonstrate a high degree of fitting with the simulation results, with only minor discrepancies. The complete discharge duration of the experimental battery slightly exceeds that of the simulated model, which can be attributed to inherent variations in battery quality control and inconsistent internal polarization reactions. These findings collectively demonstrate that the electrochemical–thermal coupling model developed in this study could effectively predict the thermal performance of the experimental lithium-ion batteries with satisfactory accuracy.
3.2. Thermal Characteristics Under Different Discharge Conditions
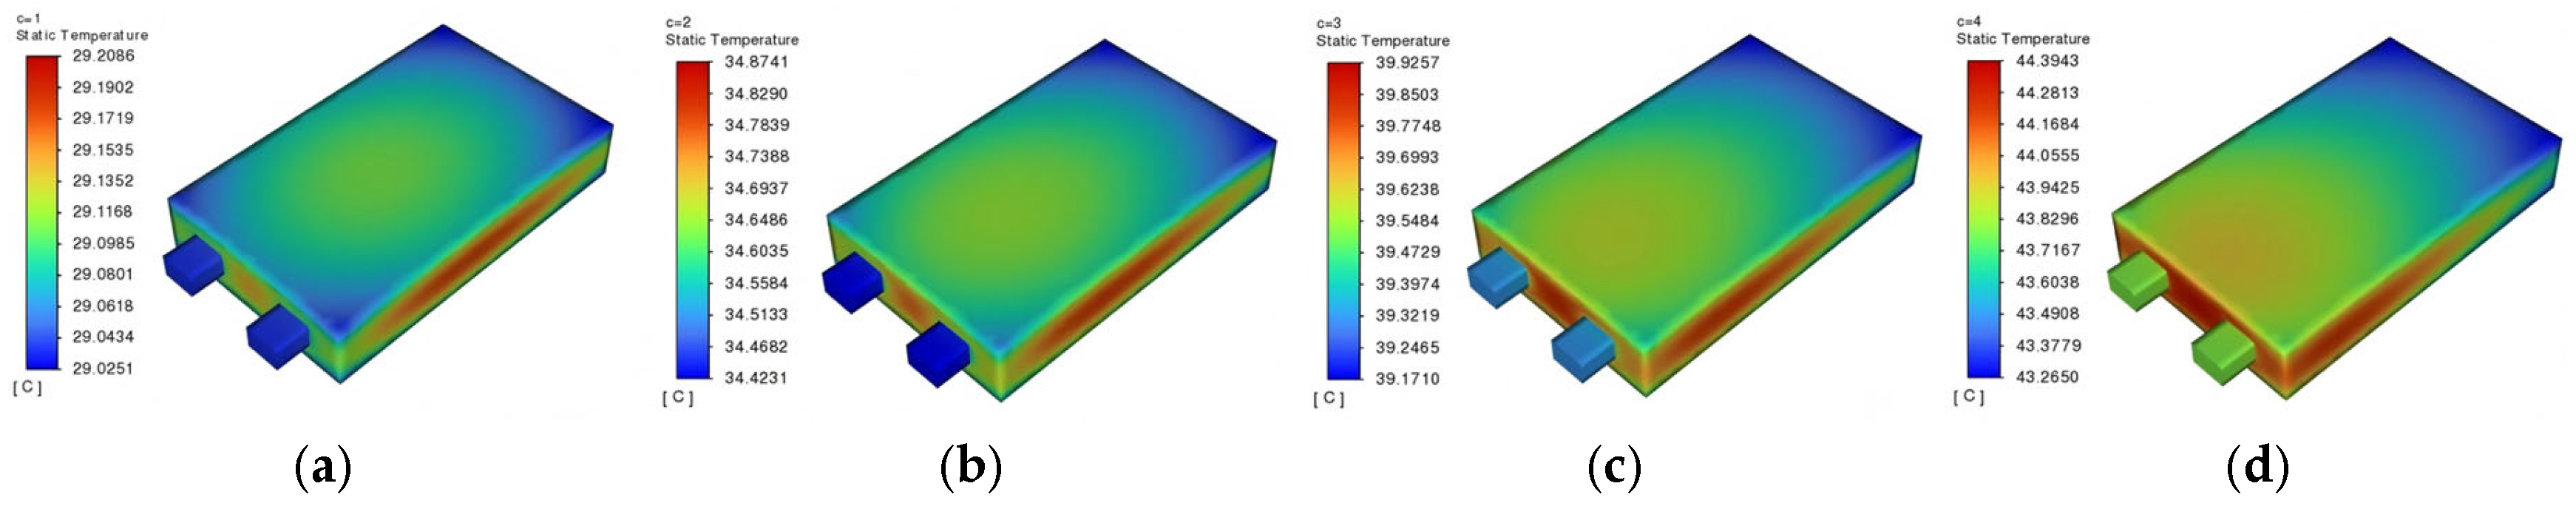
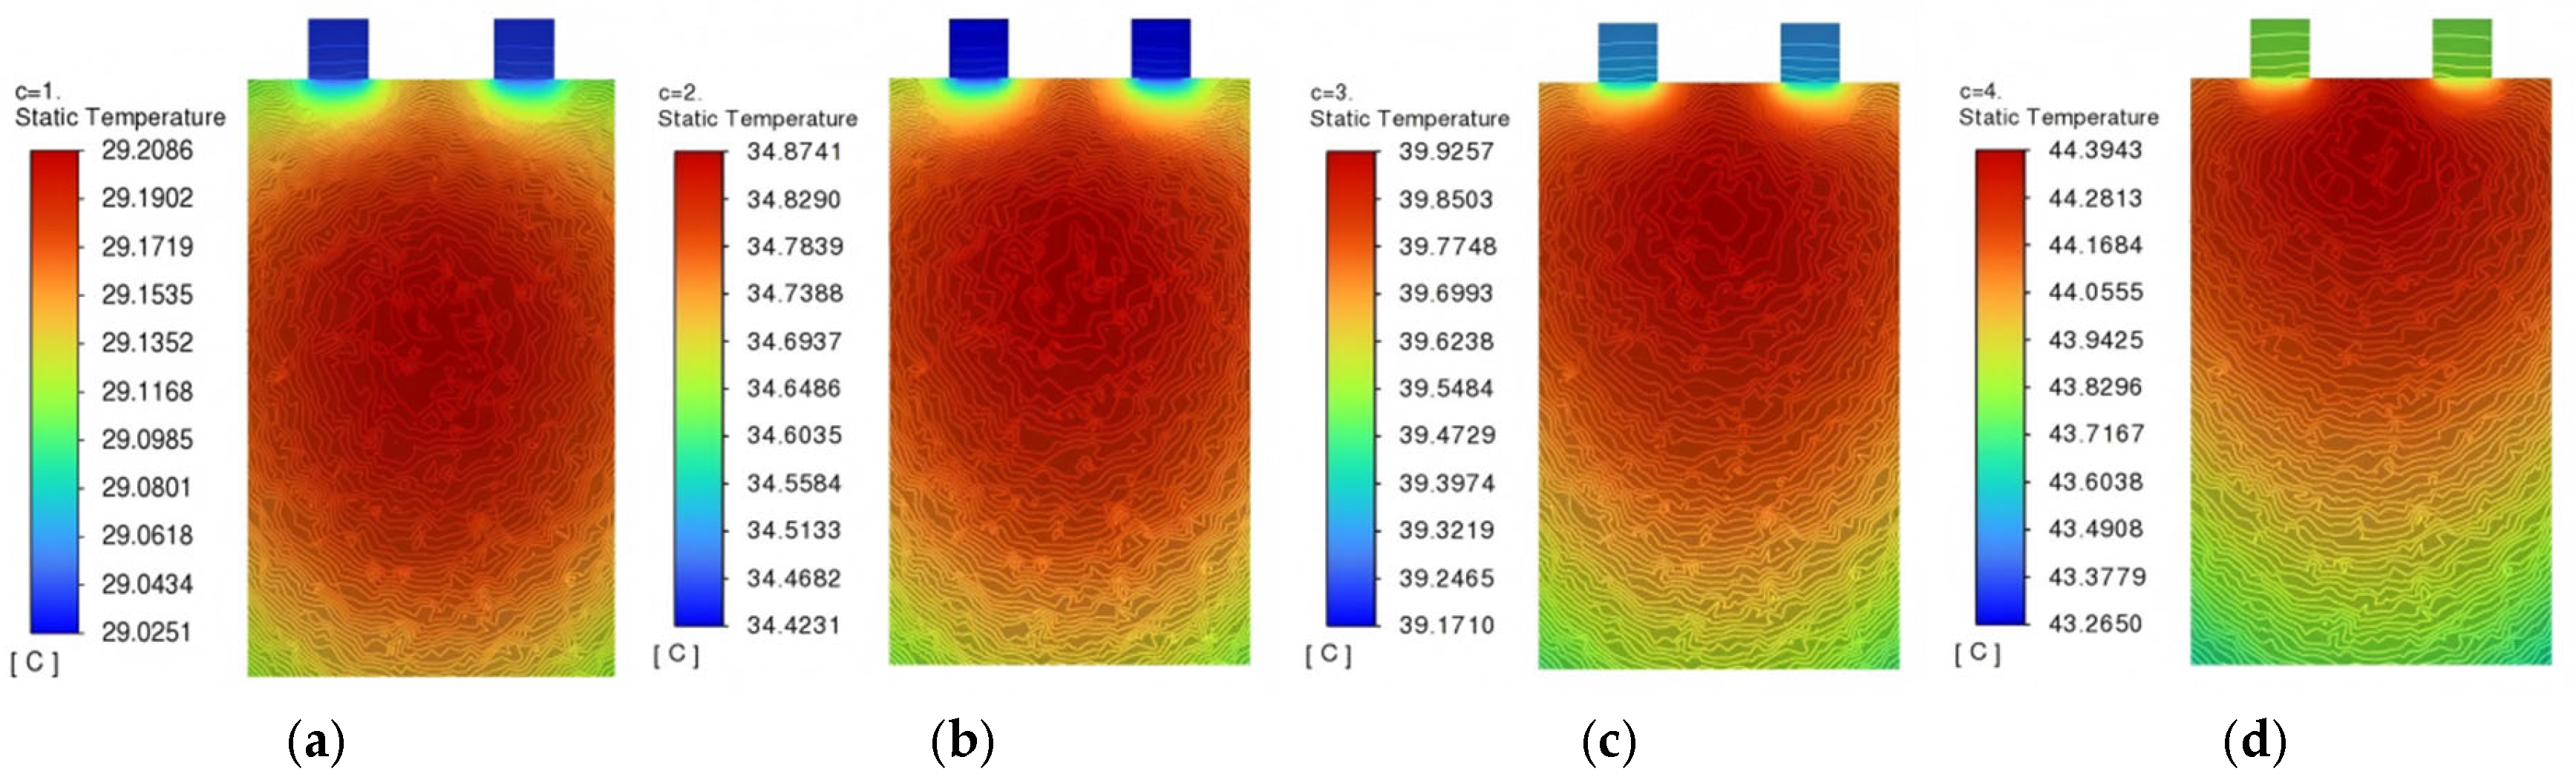
3.2.1. Discharge Rate
To investigate the thermal behavior of lithium-ion batteries during operation, the initial state of charge (SOC) of the battery is set to be 1. Discharge tests are performed at constant rates of 1C, 2C, 3C, and 4C until the terminal voltage dropped to 3 V. Both the initial battery temperature and ambient temperature are set to 25 °C, with a convection heat transfer coefficient of 5 W/(m
2·K). The surface temperature distribution at the end of discharge is shown in
Figure 6, while the internal temperature distribution from the sectional view of the battery at the mid-plane is illustrated in
Figure 7.
The maximum and minimum temperatures and the temperature differences at different discharge rates are extracted from
Figure 6 and
Figure 7, and are presented in
Table 3.
During battery discharge, thermal generation is primarily attributed to the electrochemical reaction, with internal resistance heat constituting a secondary heat source. The anisotropic thermal conductivity of cell components induces non-uniform temperature distribution, where peak temperatures are consistently observed in the central region, while minimum temperatures occur near the current collector tabs. Temperature data (
Table 3) demonstrate a discharge-rate-dependent increase, while both maximum and minimum temperatures increase monotonically from 1C to 4C, accompanied by a corresponding rise in temperature differences. Notably, the maximum temperature difference of 1.1293 °C is recorded at 4C discharge, representing the highest thermal gradient.
As the number of battery cycles increases, the capacity gradually degrades (i.e., SoH decreases), and the actual available capacity may become lower than the nominal capacity. Consequently, even during 1C discharge, capacity loss may lead to premature termination of the discharge process, resulting in a discharge duration shorter than 3600 s. This phenomenon is particularly evident in aged lithium-ion batteries, where capacity fade and impedance rise reduce discharge efficiency.
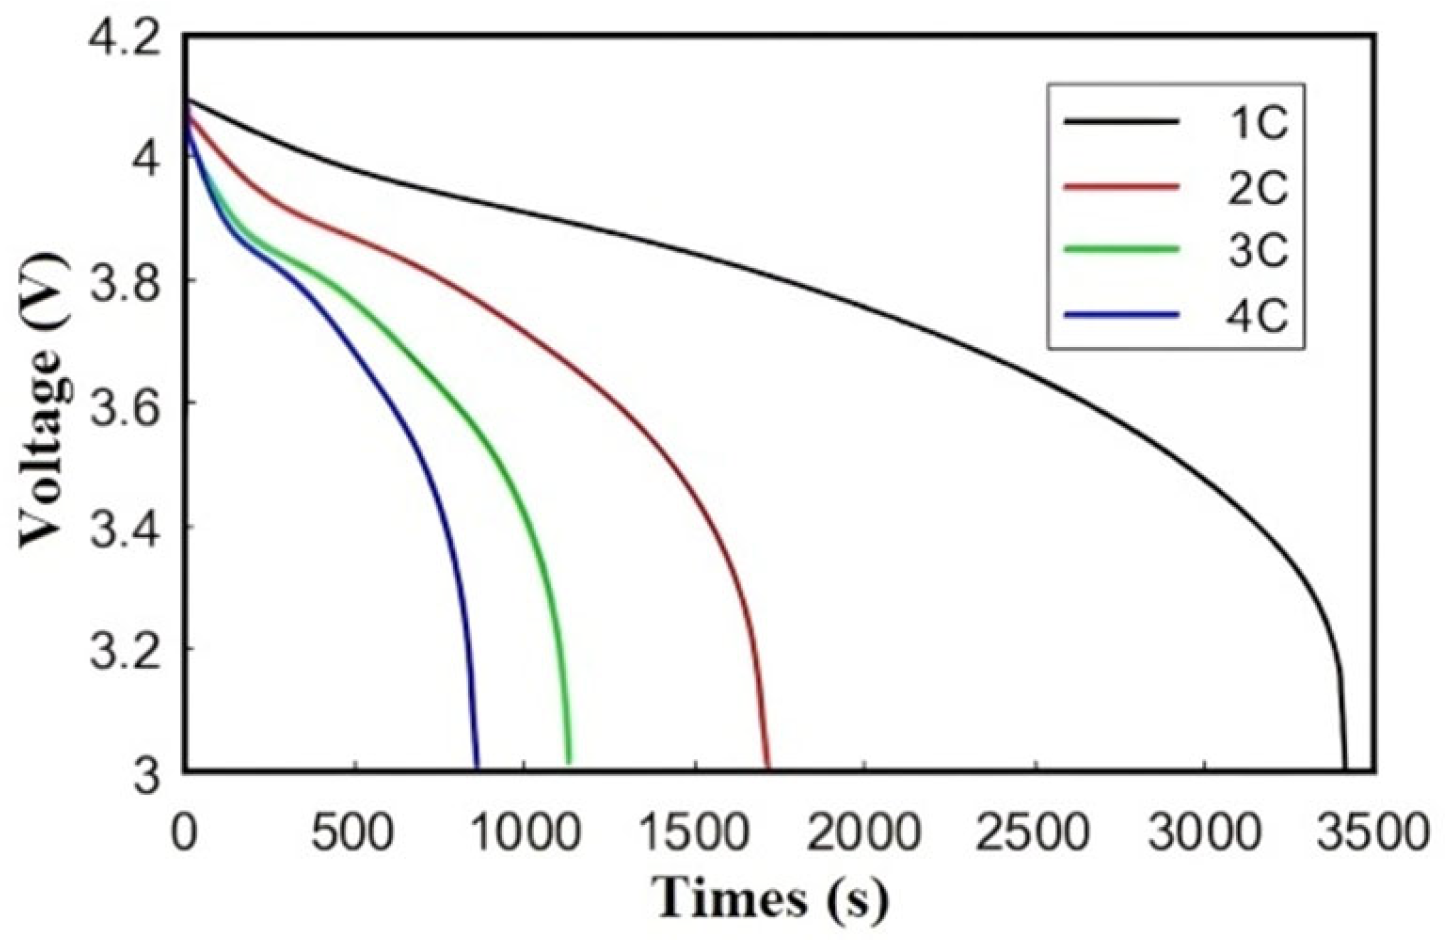
Figure 8 illustrates the voltage–time profiles during discharge at rates of 1C to 4C. From the figure, it can be observed that as the discharge rate progressively increases, the battery’s termination voltage exhibits a declining trend, which reflects Ohmic and polarization losses. In addition, the discharge termination time gradually shortens, and the slope of the discharge voltage curve continuously rises (e.g., 4C slope = 0.12 V/min vs. 1C = 0.03 V/min), due to accelerated internal resistance effects. The early termination at higher rates aligns with capacity fade under extreme discharge conditions.
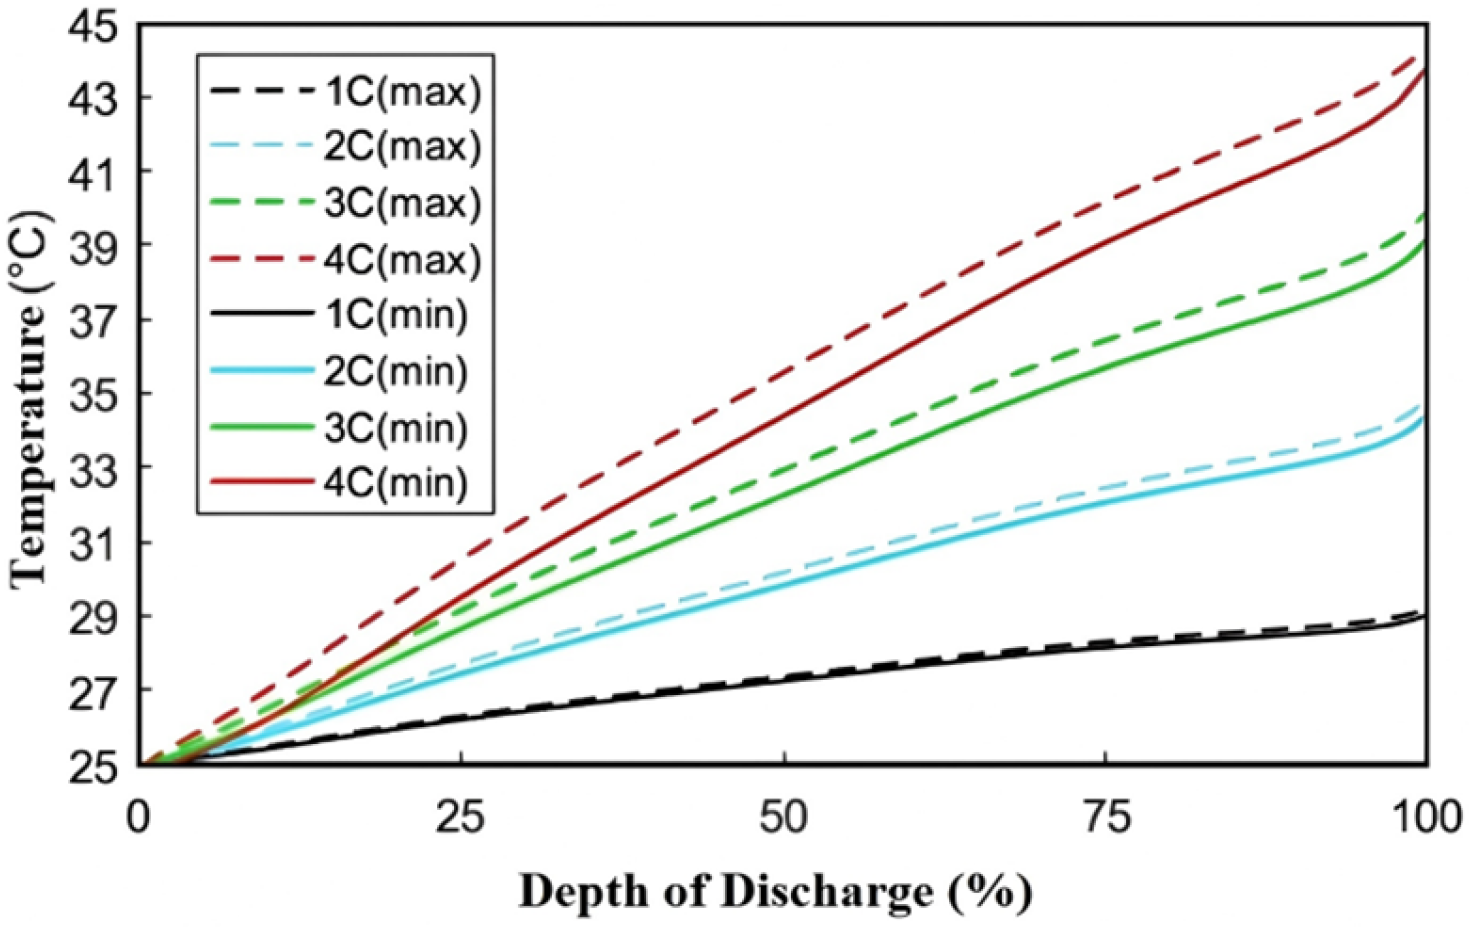
Figure 9 demonstrates that with the increase of the depth of discharge (DOD), the battery’s termination temperature shows a gradual upward trend. The temperature evolution during discharge shows rate-dependent heating, where 4C discharge reaches 44.4 °C (vs. 29.2 °C at 1C). A significant increase in the slope of the temperature curve (1C slope = 0.07 °C/min vs. 4C slope = 1.2 °C/min) happens, revealing that the battery’s heating rate accelerates with higher discharge rates. The slope increase also quantifies the thermal inertia imbalance between heat generation and dissipation.
Simulation analysis of heat generation in lithium-ion batteries under different discharge rates reveals that as the discharge rate increases, the termination voltage decreases, the voltage drop accelerates, and the internal resistance rises, leading to increased heat generation. This results in a significant temperature rise and larger internal temperature gradients. If the battery is discharged at higher rates or during series-connected battery pack operation, the temperature may exceed the safe operating range. Without effective thermal management, this can impair discharge performance, degrade battery lifespan, and potentially trigger thermal runaway, posing safety risks.
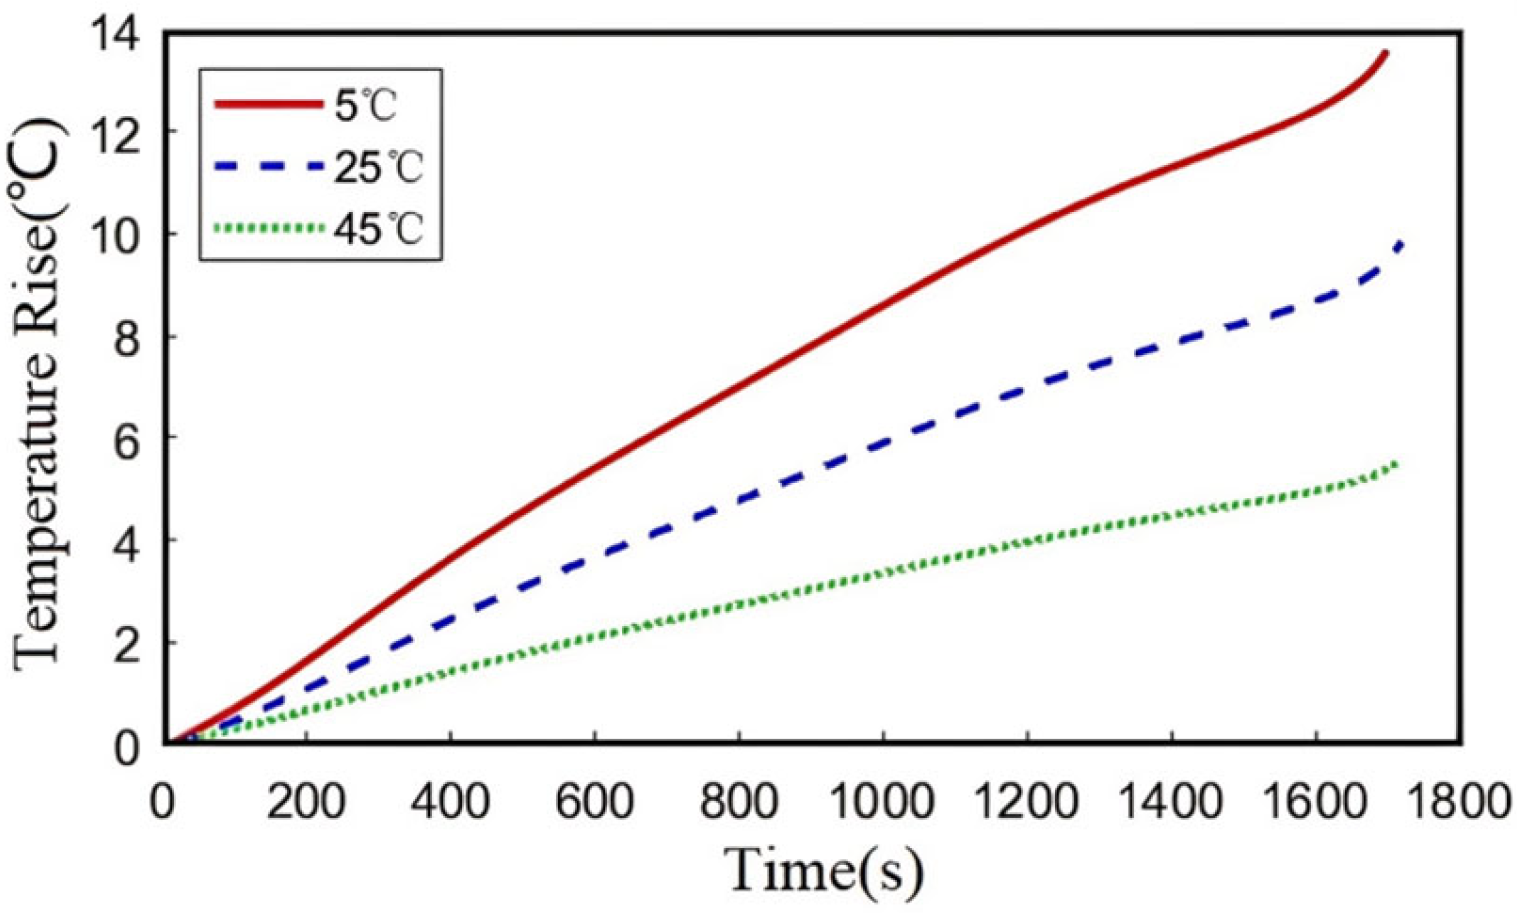
3.2.2. Ambient Temperature
Figure 10 presents the evolution of the average internal temperature during 2C discharge under different ambient temperatures (5 °C, 25 °C, and 45 °C). When the ambient temperature decreases from 25 °C to 5 °C, the terminal temperature rise increases from 9.8 °C to 13.6 °C. Conversely, increasing the ambient temperature to 45 °C reduces the terminal temperature rise to 5.2 °C. Compared with
Figure 7 (with a maximum temperature rise of 19.39 °C), and ambient temperature exhibits a relatively weaker influence (with a maximum temperature rise of 13.6 °C) on heat generation, though the overall trends of temperature remain consistent between different ambient temperatures and discharge rates. These results also demonstrate that lithium-ion batteries are more significantly affected by ambient temperature under low temperature conditions (temperature rise of 13.6 °C at ambient temperature of 5 °C vs. temperature rise of 5.2 °C at ambient temperature of 45 °C). This phenomenon can be attributed to increased internal impedance and enhanced polarization effects at lower temperatures, which collectively contribute to greater temperature rise during discharge. The elevated impedance under cold conditions leads to more pronounced joule heating, resulting in higher temperature increases despite reduced ambient temperatures.
3.3. Effects of Other Factors on Temperature Uniformity
3.3.1. The Convective Heat Transfer Coefficient
The cooling performance can be quantified by the convective heat transfer coefficient (h) at the battery surface, which includes both natural and forced convection modes. Typical values of h range from 5–25 W/(m2·K) for natural air convection, 20–300 W/(m2·K) for forced air convection, 200–1000 W/(m2·K) for natural water convection, and 1000–1500 W/(m2·K) for forced water convection. In this study, we specifically investigate forced air convection conditions with three different convective heat transfer coefficients: 50, 100, and 200 W/(m2·K). This selection allows for a systematic examination of cooling effectiveness under representative forced convection scenarios while maintaining relevance to practical battery thermal management applications.
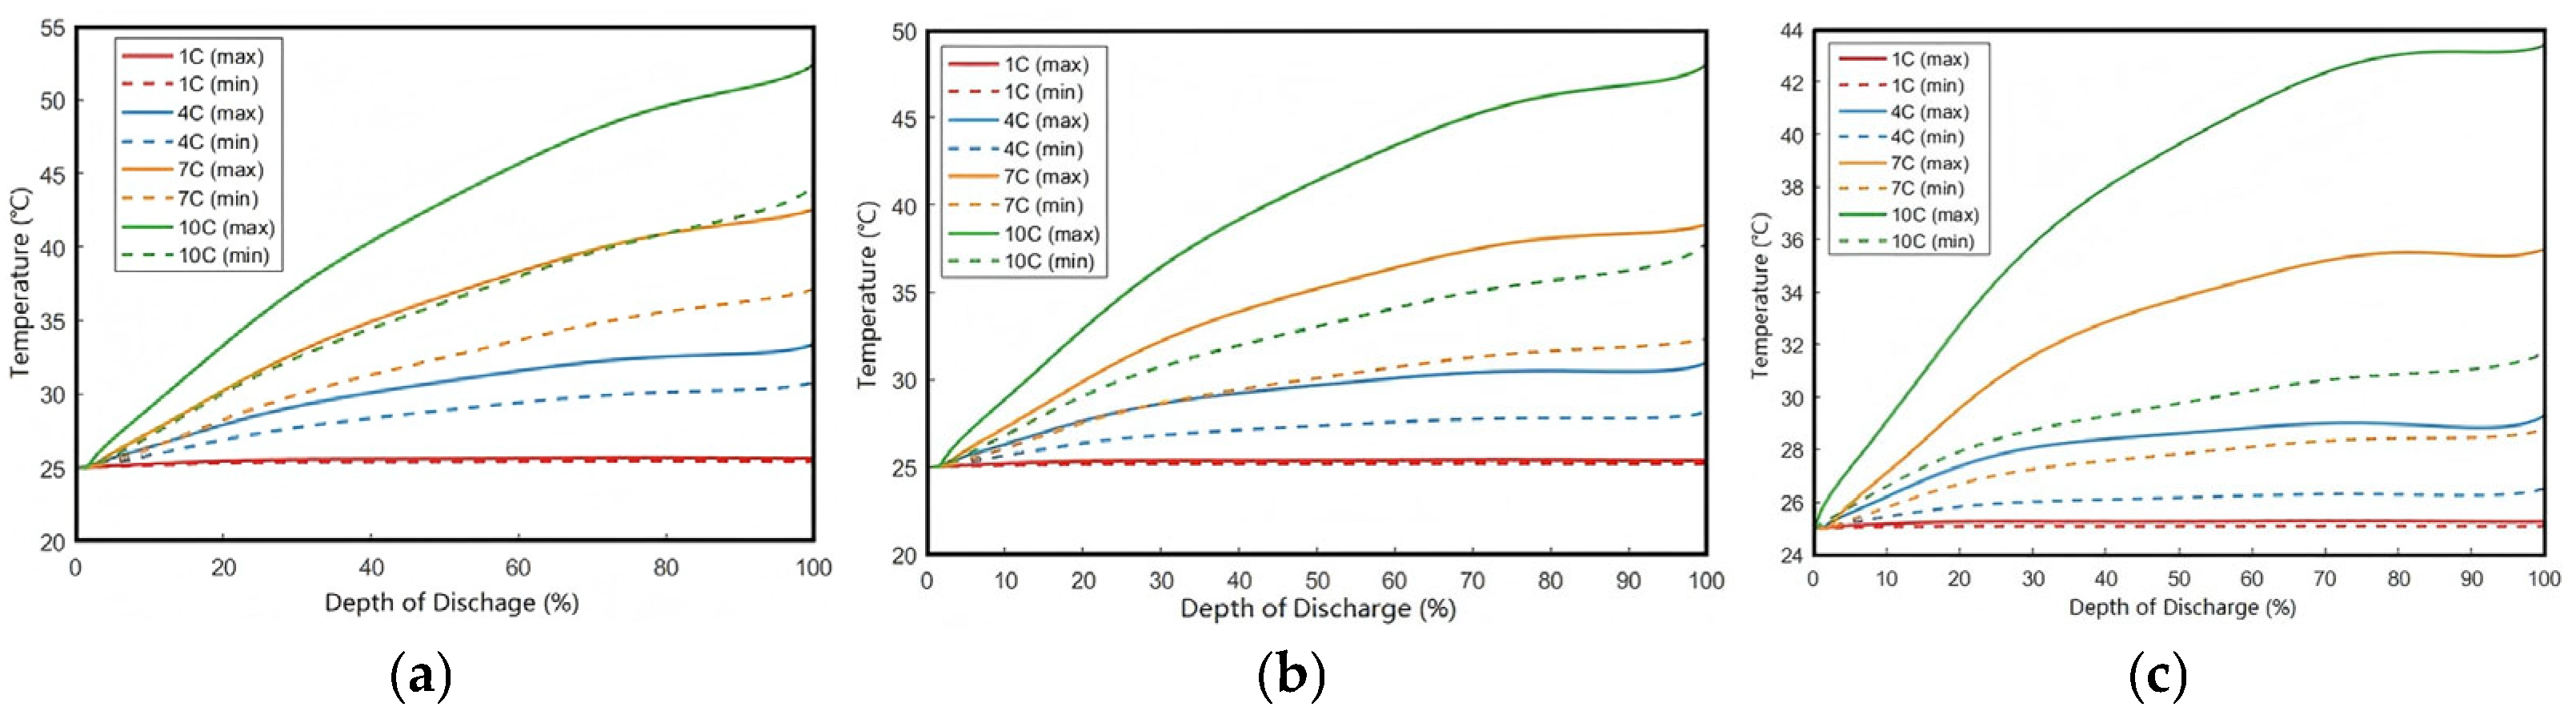
As shown in
Figure 11, the maximum temperature rises to 25.62 °C and 33.38 °C at the end of 1C and 4C discharge, respectively. Under higher discharge rates of 7C and 10C, the maximum temperature further increases to 42.53 °C and 52.37 °C. This temperature escalation results from substantially enhanced heat generation rates during high-rate discharges. To ensure safe operation and prolong battery lifespan under high-rate conditions, appropriate cooling measures must be implemented on the battery surface.
The three comparative cases in
Figure 11 demonstrate that under forced convection with
h = 200 W/(m
2·K), the surface temperature during 10C discharge (40.5 °C) decreases by 22.6% compared to
h = 50 W/(m
2·K) (52.37 °C), while the core-to-surface temperature difference increases by 42% (see
Figure 12). This validates the coupled effect of Newton’s law of cooling (Equation (21)) and anisotropic thermal conductivity within the battery system. The results in
Figure 11 demonstrate that increasing the convective heat transfer coefficient effectively reduces battery temperature.
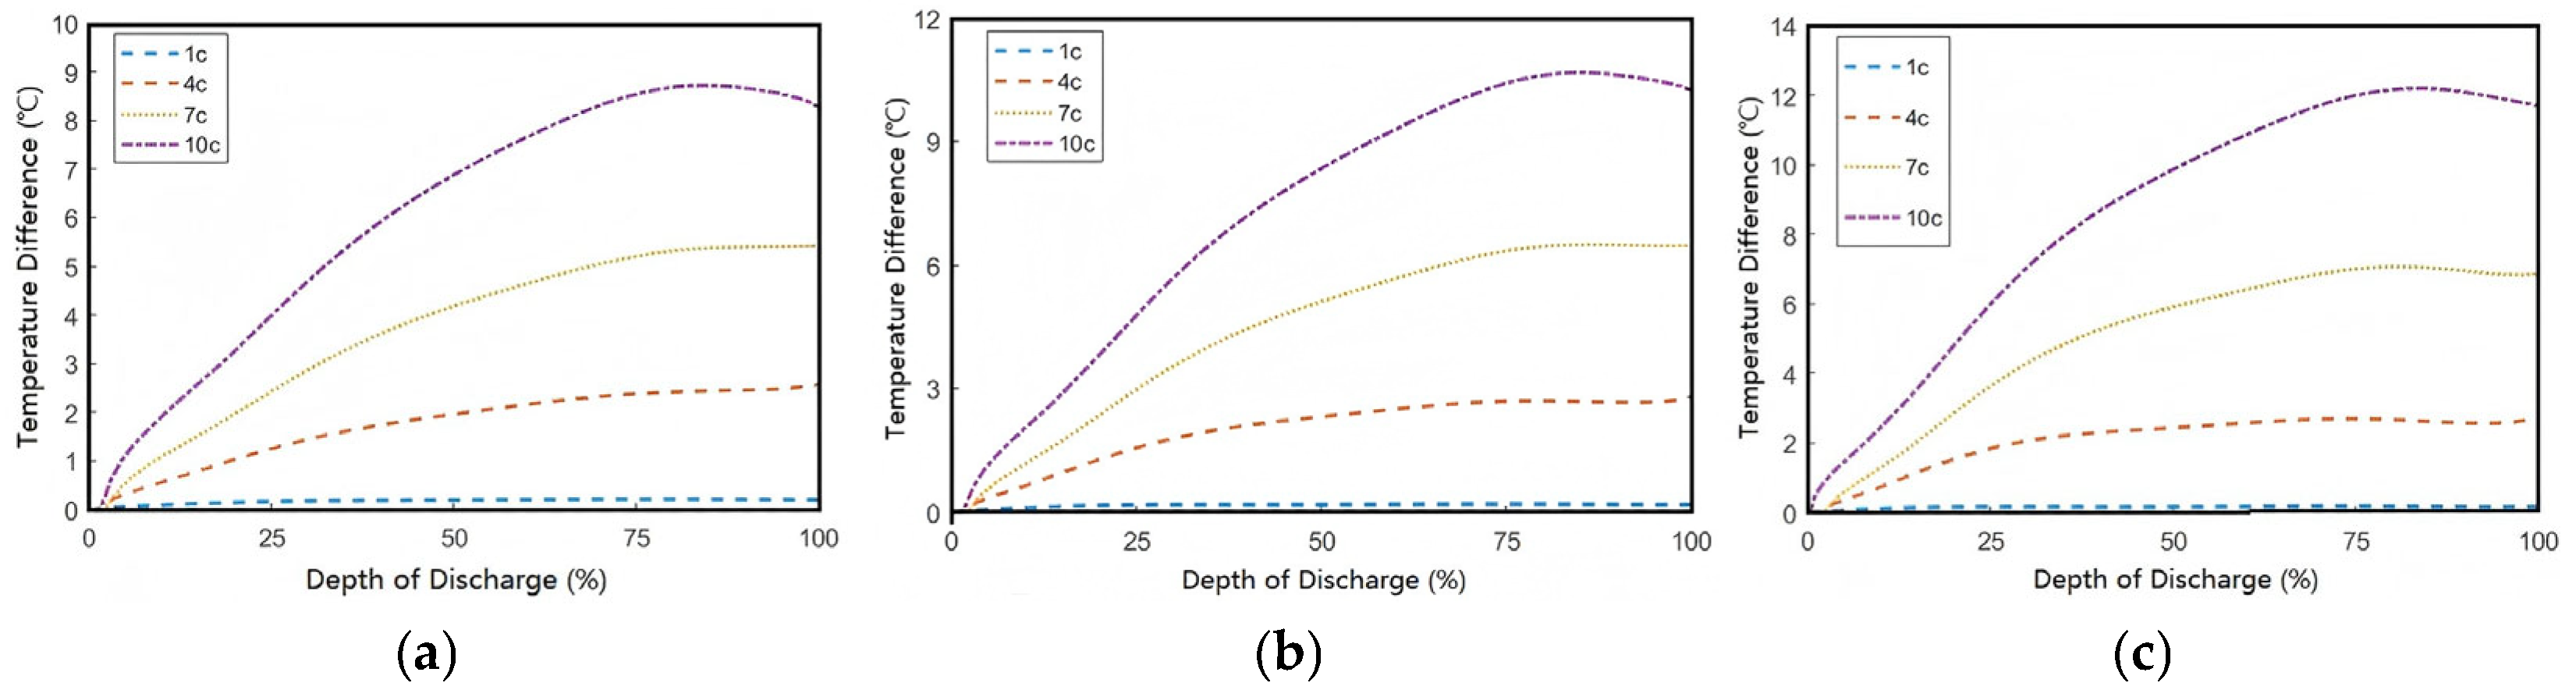
By calculating the difference between the core (maximum) and surface (minimum) temperatures of the battery in
Figure 11, the results shown in
Figure 12 are obtained. The data indicate that as the convective heat transfer coefficient
h increases, the temperature difference exhibits an upward trend, that is, the more favorable the surface cooling conditions, the more pronounced the temperature difference becomes. When
h is 50 W/(m
2·K), the maximum temperature difference at the end of a 10C discharge is approximately 8.3 °C. However, when
h increases to 200 W/(m
2·K), the maximum temperature difference rises to 11.8 °C. This occurs because convective heat transfer only acts on the battery surface. Anisotropic thermal conductivity limits through-thickness heat dissipation. Then, the improved surface cooling conditions cause the surface temperature to drop faster than the through-thickness temperature, creating a steeper thermal gradient as internal heat cannot dissipate as rapidly as surface heat. This trade-off suggests that convective cooling alone cannot simultaneously optimize both absolute temperature and uniformity, which is a fundamental constraint in battery thermal management design.
Therefore, in order to improve the non-uniformity of internal temperature distribution in batteries, optimized thermal management solutions must be developed according to different convective heat transfer coefficients. Further analysis demonstrates that under identical cooling conditions, the discharge rate critically influences the battery’s thermal behavior: higher discharge rates disrupt the dynamic equilibrium between internal heat generation and external heat dissipation, exacerbating the core-to-surface temperature gradient and consequently deteriorating thermal uniformity.
3.3.2. Through-Thickness Thermal Conductivity of the Battery
The studies above have analyzed the effects of different heat transfer coefficients on the battery temperature difference. The research demonstrates that under forced convection conditions, while higher heat transfer coefficients significantly enhance surface cooling efficiency, their effect on improving internal heat dissipation remains limited. Although optimizing surface cooling can maintain the battery within an appropriate operating temperature range, it simultaneously increases the temperature gradient along the thickness direction. To mitigate this issue, enhancing the thermal conductivity of internal battery materials can effectively improve heat transfer capability.
Thermal performance is then investigated by increasing the through-thickness thermal conductivity from 1.3 W/(m·K) to 3 W/(m·K) under convective cooling conditions of
h = 100 W/(m
2·K) and 200 W/(m
2·K). The core and surface temperatures at various discharge rates are recorded (see
Figure 13). The results show that at the end of 10C discharge, the temperature differences under these two cooling conditions are 7.48 °C and 8.18 °C, respectively, representing reductions of 2.77 °C and 3.62 °C compared to the baseline case, providing a materials-based solution to the cooling trade-off identified in
Figure 12. These findings demonstrate that enhancing the through-thickness thermal conductivity can effectively mitigate internal temperature gradients, establishing it as a crucial approach for improving battery thermal uniformity.
3.4. The Influence of Battery Structural Parameters on Heat Generation
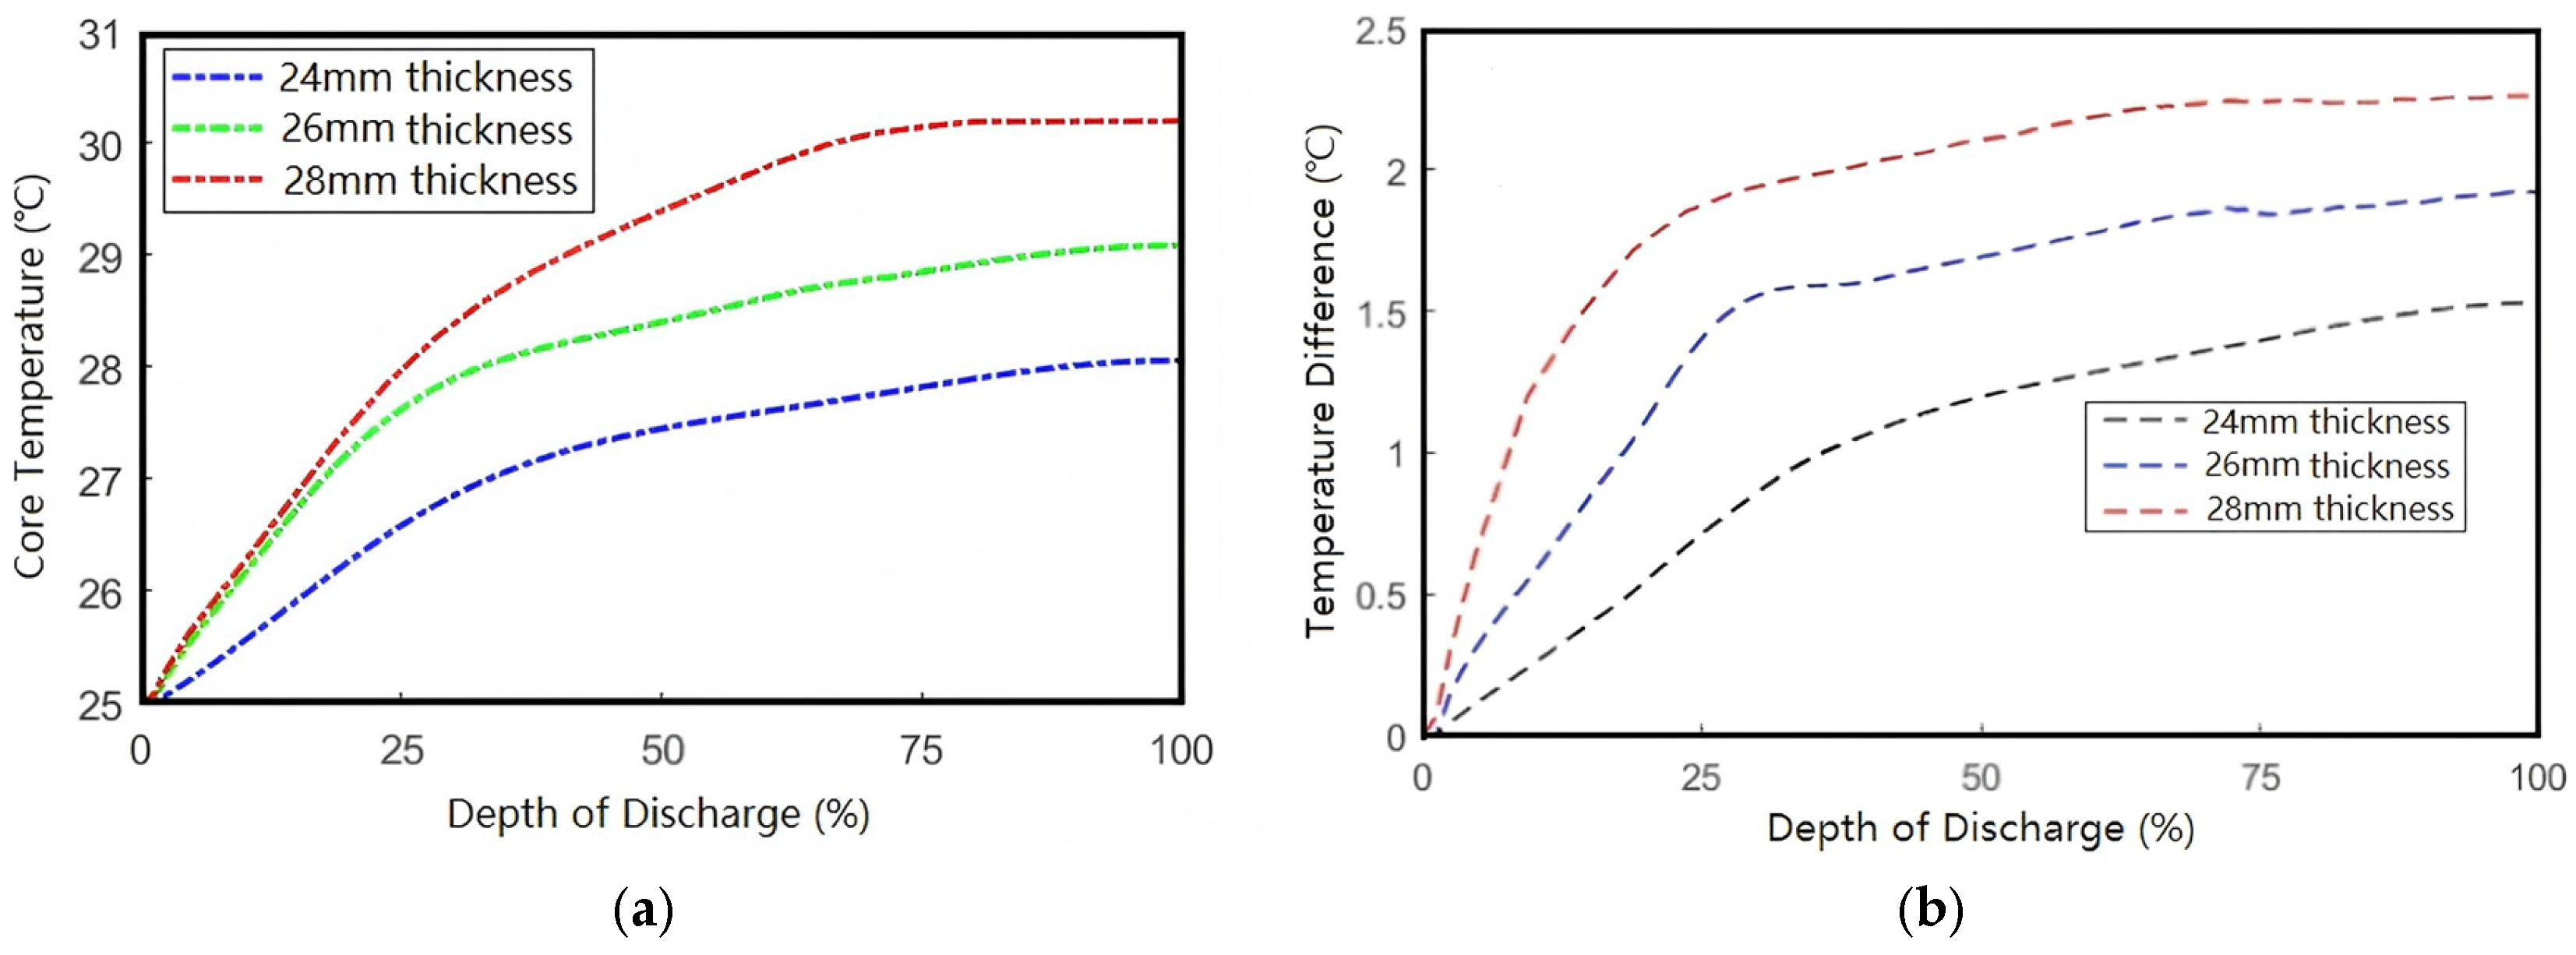
Battery Thickness
The influence of battery thickness on temperature uniformity is fundamentally related to the length of the heat conduction paths and internal thermal resistance. Thinner batteries, due to their shorter conduction paths, can improve temperature uniformity in specific scenarios. Under the premise of maintaining a constant overall battery volume, an increase in thickness inevitably leads to a reduction in width, which results in a decreased surface-area-to-volume ratio, and consequently affects surface heat dissipation efficiency. Therefore, in this section, when investigating the influence of thickness, the battery length is held constant while only adjusting the thickness and corresponding width dimensions.
As
Figure 14 demonstrates, increasing cell thickness from 24 mm to 28 mm elevates the peak temperature by 2.38 °C. This thickness-dependent thermal accumulation follows the quadratic relationship predicted by Equation (19), where the ∂
2T/∂
y2 term dominates heat conduction resistance. This demonstrates an increasing trend in the internal peak temperature of batteries with greater thickness.
Figure 15 presents the curves of the core temperature and temperature difference as functions of depth of discharge. The results demonstrate positive correlations between both the core temperature/temperature difference and the battery thickness. For every 2 mm increase in battery thickness, the peak temperature rises by 1 °C, while the temperature difference increases by approximately 0.3 °C.
Therefore, to ensure efficient operation under extreme working conditions and prevent performance degradation caused by temperature non-uniformity, rational design of battery thickness is of significant importance.
3.5. Limitations of the Simulations
While the present 3D electrochemical–thermal coupling model successfully characterizes thermal behavior under normal operating conditions, several limitations should be acknowledged:
- (1)
Aging Effects Exclusion
The simulations assume invariant material properties, neglecting capacity fade and impedance growth caused by aging and degradation. This may lead to underestimated temperature rise in long-term operation.
- (2)
Simplified Thermal Runaway Modeling
The current framework focuses on safe operating ranges (5 °C to 45 °C) and does not incorporate exothermic side reactions or venting dynamics critical for runaway prediction.
- (3)
Mechanical–Chemical Coupling
Stress–strain effects from electrode expansion/contraction are not yet integrated. This omission may affect heat generation accuracy at high C-rates where structural deformation becomes significant.
5. Future Research Prospects
The current model has several limitations that require future improvements. Future research should address the current model limitations by integrating battery aging, degradation mechanisms, or full-pack dynamics.
A comprehensive mechano-electro-thermal coupling framework should be developed to address these limitations. The framework could incorporate cyclic degradation mechanisms like SEI growth and particle cracking to predict long term thermal performance. Expanding the model to include thermal runaway dynamics would enhance safety analysis, particularly for extreme conditions. Adding stress–strain relationships would capture electrode expansion effects during high-rate operations.
Future work could also focus on experimental validation, real-time temperature feedback, and scaling the model to battery modules or systems with varying cell configurations.
These improvements would provide more comprehensive insights for battery design and thermal management. The proposed extensions align with practical needs for reliable and safe energy storage systems. This research would not only deepen the understanding of multi-physics coupling mechanisms in batteries, but also provide more comprehensive theoretical guidance for the structural optimization of power batteries.
Acronyms and symbols are standardized in Abbreviation.


