1. Introduction
Battery electric vehicles (BEVs) have emerged as a viable alternative to light-duty vehicles powered by internal combustion (IC) engines, which contribute approximately 16% of anthropogenic greenhouse gas (GHG) emissions and pose a significant challenge to achieving the 1.5 °C global warming target [
1]. Despite their environmental benefits, BEVs present critical challenges, particularly in terms of electricity supply and charging infrastructure. The intermittent availability of renewable energy sources (RESs) and the relatively long charging times (approximately one hour at 1 C) hinder the scalability of BEVs across diverse transportation sectors [
2].
The integration of BEVs into the energy ecosystem introduces new opportunities for energy storage and grid optimization. When charging operations are effectively synchronized with user demand, BEVs can be incorporated into smart grids to leverage periods of high renewable energy availability and redistribute energy during peak pricing intervals. In [
3], an overview of the latest research on EV charging stations is given. The article analyzes the main issues and challenges in power architecture design, energy storage techniques, control strategies for the micro-grid, and energy management optimization. Managing large-scale BEV fleets introduces significant complexity, prompting the application of mean field game (MFG) theory to model system dynamics and optimize electricity costs, as suggested by R. Couillet et al. in [
4].
Although the energy management of a given fleet is well suited for optimal problem formulation, the consideration of every vehicle as an independent state complicates the use of many optimization methods. For example, dynamic programming (DP) offers a global optimal solution, but its computational burden precludes its implementation if the number of states is above two or three. Looking for a simplified version of the system, Branimir Škugor and Joško Deur used an aggregate battery model to reduce the state-of-charge (SOC) dynamics of a truck fleet to a single representative state, enabling the application of DP for cost minimization while utilizing RESs [
5]. A subsequent study by the same authors introduced a second-layer control mechanism for individual SOC trajectories using a multi-objective genetic algorithm [
6]. Recognizing the practical limitations of centralized fleet control, other researchers have proposed constrained problem formulations. For instance, Lin et al. [
7] investigated a specific BEV parking facility and applied a linear quadratic MFG framework to develop a decentralized charging policy that maximizes operational profit.
Note that charging optimization techniques depend on user vehicle demands to identify the optimal charging policy, but many case studies only consider an expected average demand, with its instantaneous value unknown and evaluated as an statistical problem. Some authors considered different indicators to contemplate the urgency of charging for the energy optimization system. In [
8], a fuzzy logic-based charging policy was developed for an e-bike station, incorporating urgency and difficulty indices as decision variables. Similarly, Wu et al. [
9] considered the stochastic nature of the demand with a Markov decision process (MDP) for the optimal control of a photovoltaic-assisted charging station on a university campus.
Battery-swapping stations (BSSs) offer a promising alternative by enabling immediate battery replacement, thereby decoupling charging time from vehicle downtime. These stations maintain a buffer of batteries that can be recharged using grid electricity or RESs, such as solar panels [
10]. Unlike smart grid applications, where charging schedules are aligned with parking durations, BSS operations are driven by battery demand. Charging policies are thus designed to ensure battery availability while minimizing electricity costs by exploiting low-price periods.
In [
11], a data-driven approach utilizing machine learning algorithms was proposed to optimize BSS operations in Beijing, focusing on demand forecasting to enhance charging and swapping efficiency. In [
12], BSS operations were structured into hierarchical levels, where a deep reinforcement learning (DRL) framework allocates power among chargers while a secondary level addresses intra-charger battery dispatching.
Demand prediction was approached with activity-based travel chain simulation in [
13] in a multi-objective optimization framework for delivery electric vehicles. Here, the swapping demand is forecast with chain theory, and a multi-objective stochastic programming model deals with the planning and allocation of the BSSs. Sensitivity analysis provides actionable insights on the optimization of BSS infrastructure.
The authors of [
14] addressed the uncertainty of the BSS demand using a deep reinforcement learning (DRL) approach. The layout-dispatching-scheduling of BSSs and Super BSSs dealt with centralized stations, managing the optimal route to the BSSs, estimating the demand and scheduling the charging according to the electricity cost, reducing the operational cost from 4.8% to up to 35.3%.
A multi-objective optimization method considering an energy generation mix was investigated by Muhammad et al. [
15], where the goal was to operate with the lowest energy cost within the energy grid, e.g., a normal grid, solar and biogas. The demand forecast is predicted using a probability distribution gathered from a directly measured dataset. The results show that revenue could improve by up to 18%, while the total cost to operate BSSs was reduced by 34%.
Bo Sun et al. [
16,
17] proposed a simplified three-state flow model for BSS dynamics, applying optimization techniques such as dynamic programming and Pontryagin’s minimum principle to derive optimal charging policies under exogenous demand distributions and known electricity prices. The user demands are satisfied by considering the number of users awaiting a battery and setting a maximum value as a restriction on the optimal control problem formulation.
This study investigates the application of dynamic programming to determine optimal charging policies for BSSs using a simplified two-state model. The algorithm uses queuing theory to identify the desirable optimal number of batteries available in the station throughout the day, combining statistical analysis with the deterministic optimization of the DP. The DP framework is evaluated with a realistic simulation environment that incorporates individual SOC levels, battery demand and charging time uncertainties and user waiting times, enabling a comprehensive evaluation of system performance. The remainder of this paper is structured as follows.
Section 2 presents the case study, including the key assumptions, data analyzed and experimental tests performed.
Section 3 details the optimal problem formulation, explaining the simplified model, the optimization constraints and the evaluated cost.
Section 4 discusses the simulation results, showing the potential of BSS optimization throughout the day. Finally,
Section 5 summarizes the main conclusions and outlines directions for future research.
3. Optimal Problem Formulation
The default BSS strategy consists of charging the batteries when they are replaced with an as-soon-as-possible (ASAP) strategy. This strategy ensures battery availability but does not optimize the electricity cost or the associated .
The optimal strategy aims to charge the batteries where the cost of electricity is low but ensure the availability of charged batteries at peak times. To define the optimal control problem, a reduced-order model of the station is needed.
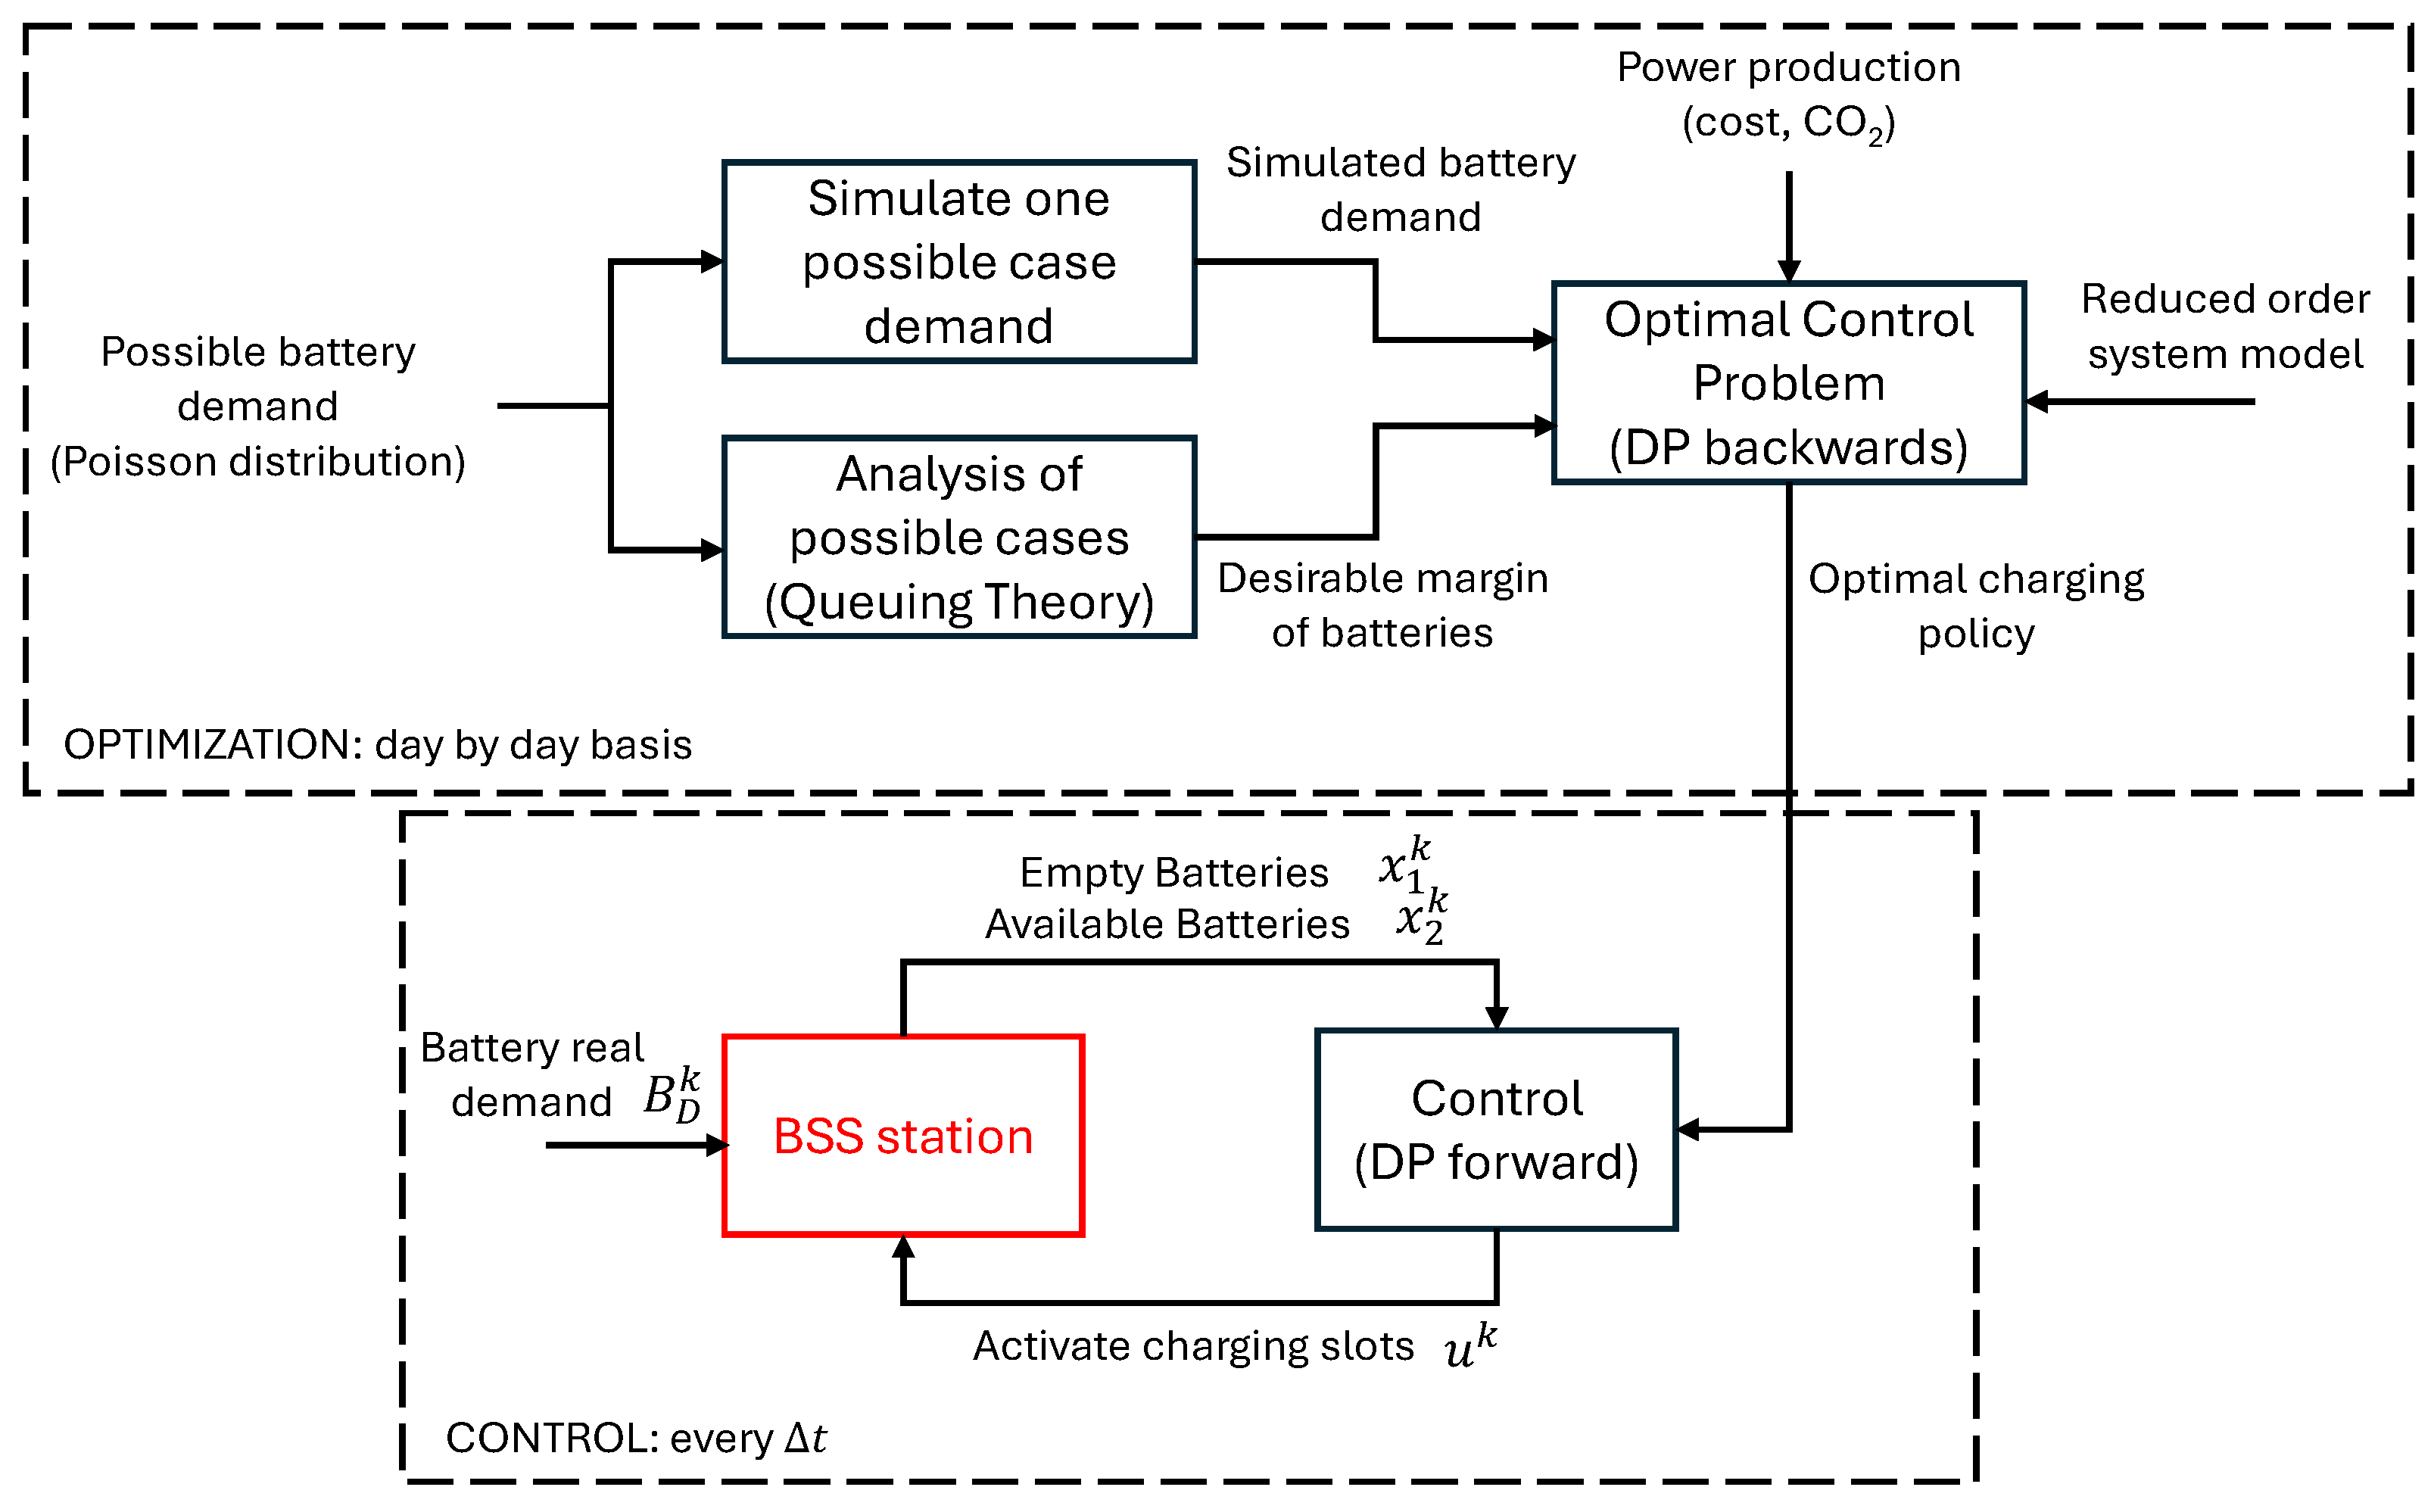
The proposed strategy uses dynamic programming to determine an optimal control policy by using a reduced-order model and a demand case simulation. Once the optimal charge policy is obtained, the concrete control actions are given by the control charging policy in a closed-loop framework with certain feedback as batteries are replaced and charged.
Figure 7 shows a scheme of the methodology.
Note that the optimization is performed on a day-by-day basis and can be executed at the end of the day when no traffic is expected, e.g., at 3:00 a.m. The computational burden of the DP optimization is bounded between 1 and 3 min if the number of states is low (one or two system states), while the execution of the control loop (every ) is based on a 2D look-up table and only requires a few milliseconds in a normal computer.
3.1. BSS Simplified Model
The model simplifies the discrete system with N battery slots by considering only two states: the batteries recently replaced (), i.e., to be charged, and the batteries available for swapping (), i.e., totally charged.
The model is designed in discrete form with a time step of 90 s, as this is the average time required to replace a battery in a station slot. The control action (u) is the number of batteries that are activated for charging at each time step, while the number of batteries replaced at each time step () depends on the battery demand, which is an input of the model.
The model is therefore defined as follows:
where
is the number of batteries that have been fully charged in the last time step. The main hypothesis of the model is considering that the number of batteries that have been fully charged in the current time step is a function of the current charging power (
):
where
is the number of batteries being charged and
is the power used in a charging slot (800 W in the case at hand). Note that this assumption considers the fully charged batteries (
) as a fraction. For example, having 1 battery being charged at 0.2 C implies that the number of batteries charged at each time step (
h) will be 0.005.
The number of batteries being charged increased as some batteries were activated and decreased when a battery was replaced, but as there was a limited number of battery slots (
N), the number of batteries being charged was not an independent state. The number of batteries being charged (
) depends on the empty batteries (
) and full batteries (
):
3.2. Dynamic Programming (DP) Optimization
The optimized strategy relies on the evolution of electricity prices, the availability of solar energy, and the anticipated traffic demand throughout the day to formulate a daily charging policy. DP is employed to determine the optimal control actions as a function of the current system states, denoted as and .
DP is a well-established optimization technique that has been widely used for decades to design optimal controllers. The method involves decomposing a finite-horizon problem into a series of simpler sub-problems. By discretizing the state space, time horizon and control actions, constraints can be explicitly incorporated, and the problem can be solved iteratively in a backwards fashion from a predefined terminal condition. The algorithm stores the optimal control action at each time step that minimizes the cost-to-go (CTG) function for all possible state configurations. The CTG function is recursively defined based on the operating cost at each time step and a user opportunity penalization if no batteries are available.
The operating cost function can be defined as the electric power consumption and the associated
emissions as follows:
where
is a tunable parameter that prioritizes the emission criteria over the economical optimization (
will make the algorithm minimize the
emissions, while
will minimize the operation cost),
is the cost of the electricity in EUR per Wh and
is the associated
emissions in t
per Wh. The
from a given moment of the day (
n) to a final state definition (
and
) is defined as follows:
where
is the terminal cost,
is a penalization cost for user satisfaction capacity and
is an additional term used to penalize restriction violations.
This OCP can be directly solved via DP by discretizing the state and input values in a set of , and possibilities. The optimal problem is solved backwards by obtaining the optimal charging policy input at each time step depending on the states, i.e., the actual empty and full batteries in the station.
The current work used a state discretization of 1 battery, which is the number of battery slots for the number of possible values for the states. Note that such a criterion maintains the precision of the method but implies a higher computational burden for larger BSSs, i.e., it requires 113.7 s for optimizing a station of 60 slots and 27.37 s for a BSS with 36 slots in an Intel (R) Core (TM) Ultra 7 155H with 32 Gb of RAM. Nonetheless, as the number of states does not depend on the size of the BSS, the optimization is bounded to few minutes, even in the case of a large BSS.
Extreme events, such as meteorological events or car accidents, might alter the traffic, leading to suboptimal operation. However, note that the optimization can be recomputed at any moment of the day in case of substantial deviations from the predicted demand.
3.3. BSS Design and Battery Margin Definition
The main problem of a BSS optimization is the prediction of battery demand. The real demand cannot be predicted beforehand, and even the charging time is also dependent on the starting state of charge and the state of the battery, which also has high variability [
11].
This problem lies in the field of queuing theory, which determines the likelihood of adequate service (with all users satisfied in time), and some characteristic parameters of the queue, such as the expected number of users awaiting service or the average waiting time [
18]. Concretely, the problem at hand with the default control procedure (ASAP), where there is variable demand exponentially distributed with an average arrival rate
, and a variable service time with an average service rate
(described in the literature as the M/M/m problem), can be solved with the Erlang C formula, which defines the probability that an arriving customer has to wait in a queue:
where
m is the number of charging slots and
is defined as follows:
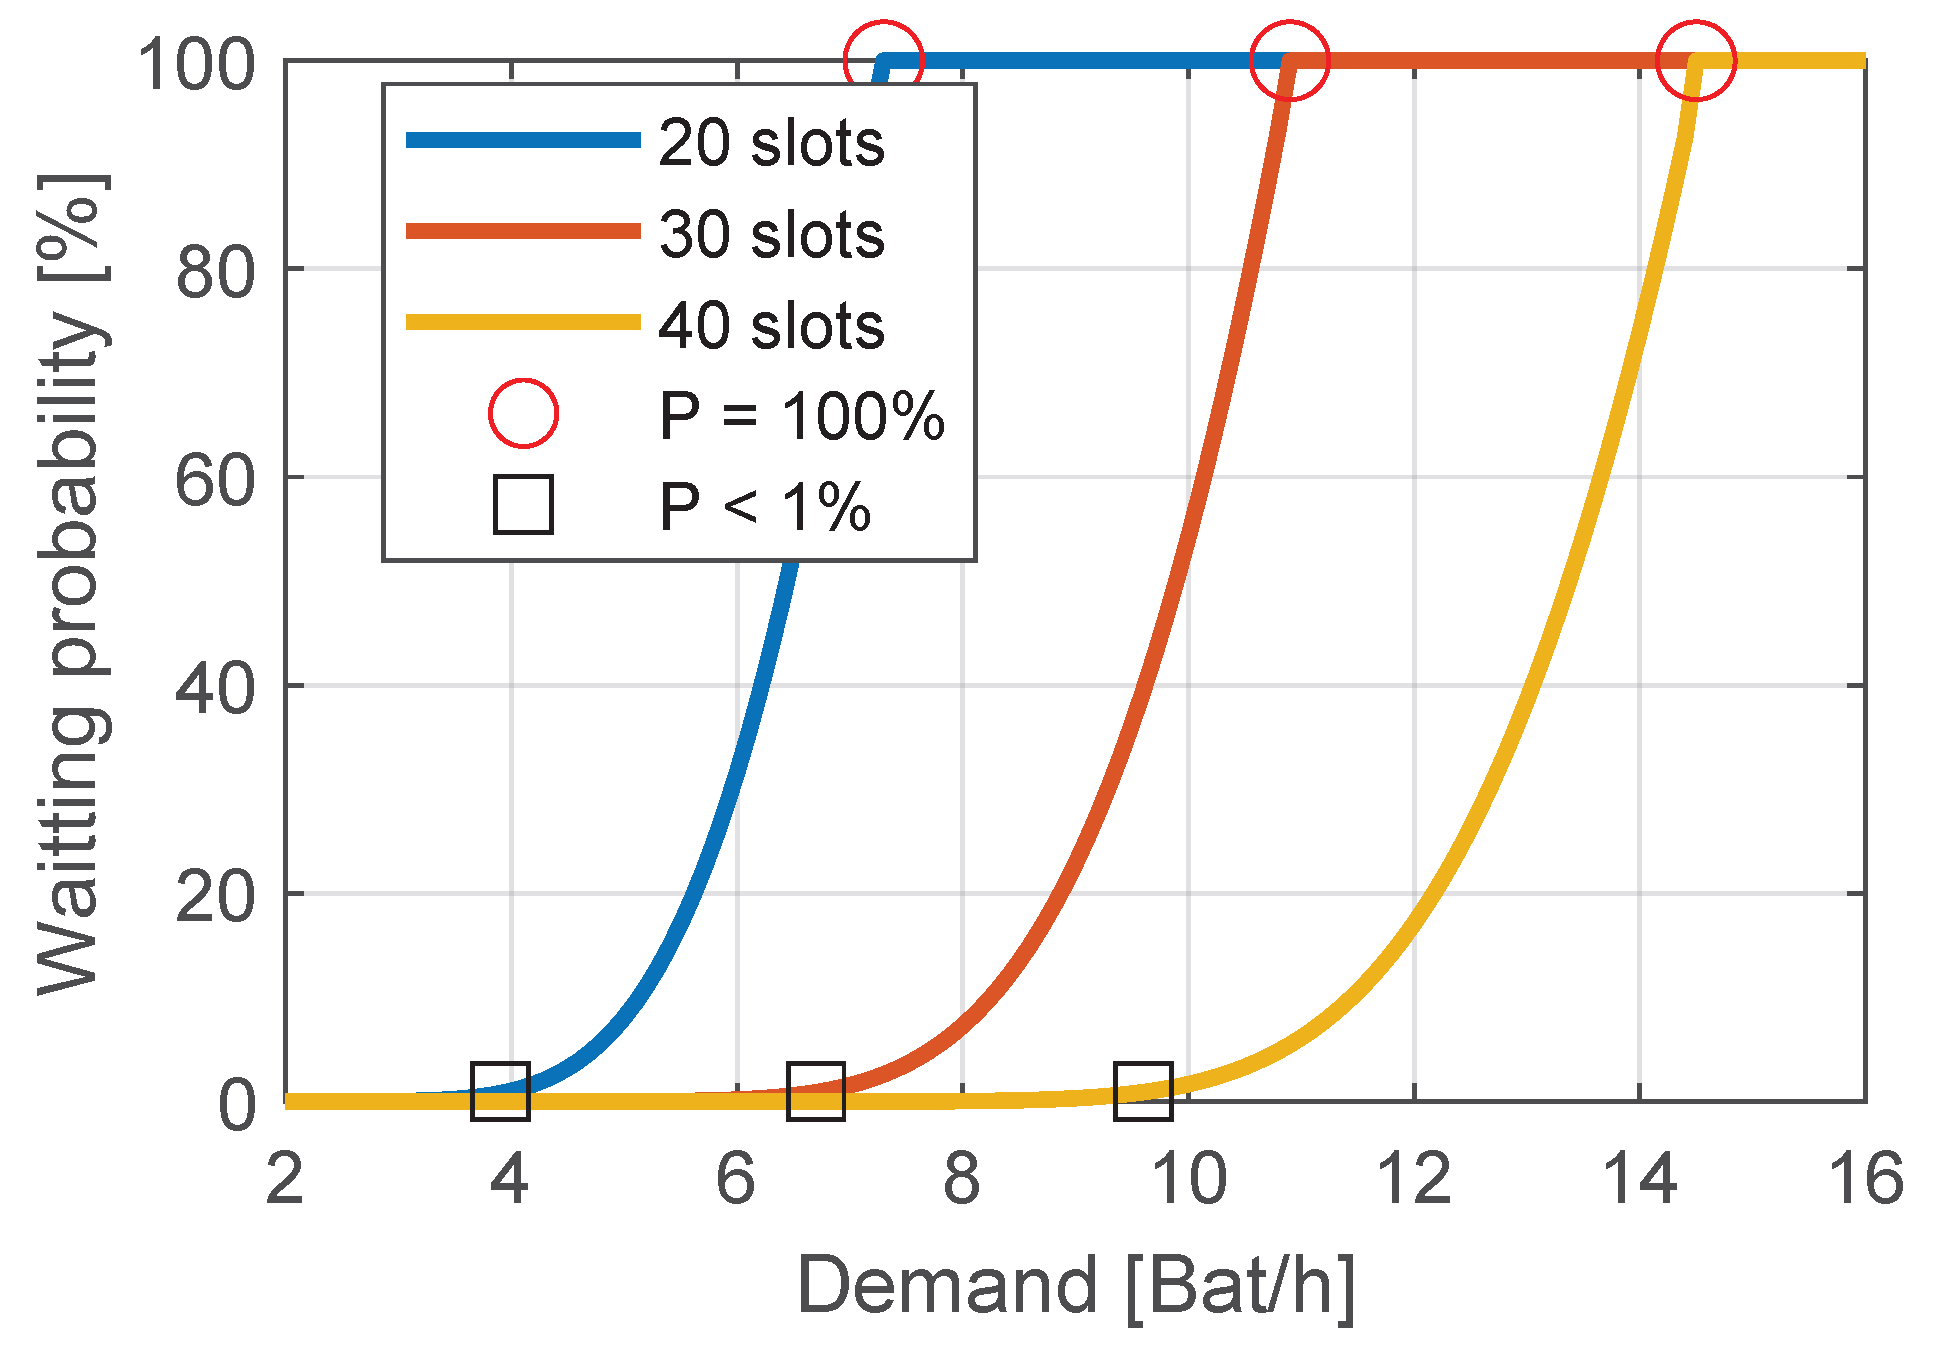
Figure 8 shows the probability of the users to wait for a battery as a function of the number of charging slots of the stations and the demand rate. Here, the service rate was calculated with an average starting SOC of 45% and a charging power of 800 W, which means that each charging slot was able to charge 1 battery every 3 h.
There is a limit where the demand rate is higher than the service rate, leading to an infinite queue. For example, the maximum demand rate that can afford a BSS with 20 slots is 7 bat/h, while with 40 slots, the BSS is able to give service to 14 bat/h. The point where the service rate is equal to the demand rate has been highlighted in
Figure 8 with red circles. On the one hand, this value would lead to minimizing the number of charging of slots, but the users will need to wait to receive their batteries as it is extremely unlikely that both probability distributions will be phased in time. On the other hand, designing the BSS with more charging slots would lower the probability of waiting, but oversizing the station would lead to unnecessary additional costs. The black squares in
Figure 8 mark the points where the probability of waiting for service is lower than 1%. Note that the design of the size of the station is a trade-off between service quality and size.
The optimization via DP is deterministic and assumes a predefined battery demand and also a constant service time, which is not strictly true. In most of the possible scenarios, the optimal charging policy would recommend keeping a buffer of batteries, but when the electricity is high, the optimization will lead to reducing the buffer of batteries to 0. Indeed, in such situations, the solution is similar to that of the previous case marked with red circles, where the service rate and the demand rate were matched in a deterministic manner.
The difference between the saturated case (red circles in
Figure 8) and the safe scenario (black squares in
Figure 8) is named the battery margin buffer (BMB) and determines the additional slots required to ensure adequate service to cope with unknowns in service and demand evolution. This paper suggests forcing DP optimization with a BMB to lower the possibility of having no batteries when there is an actual demand. The BMB aims to ensure that the probability of providing an adequate service in the DP-optimized policy is above 99%.
Figure 9 shows the BMB as a function of the expected demand rate.
4. Results and Discussion
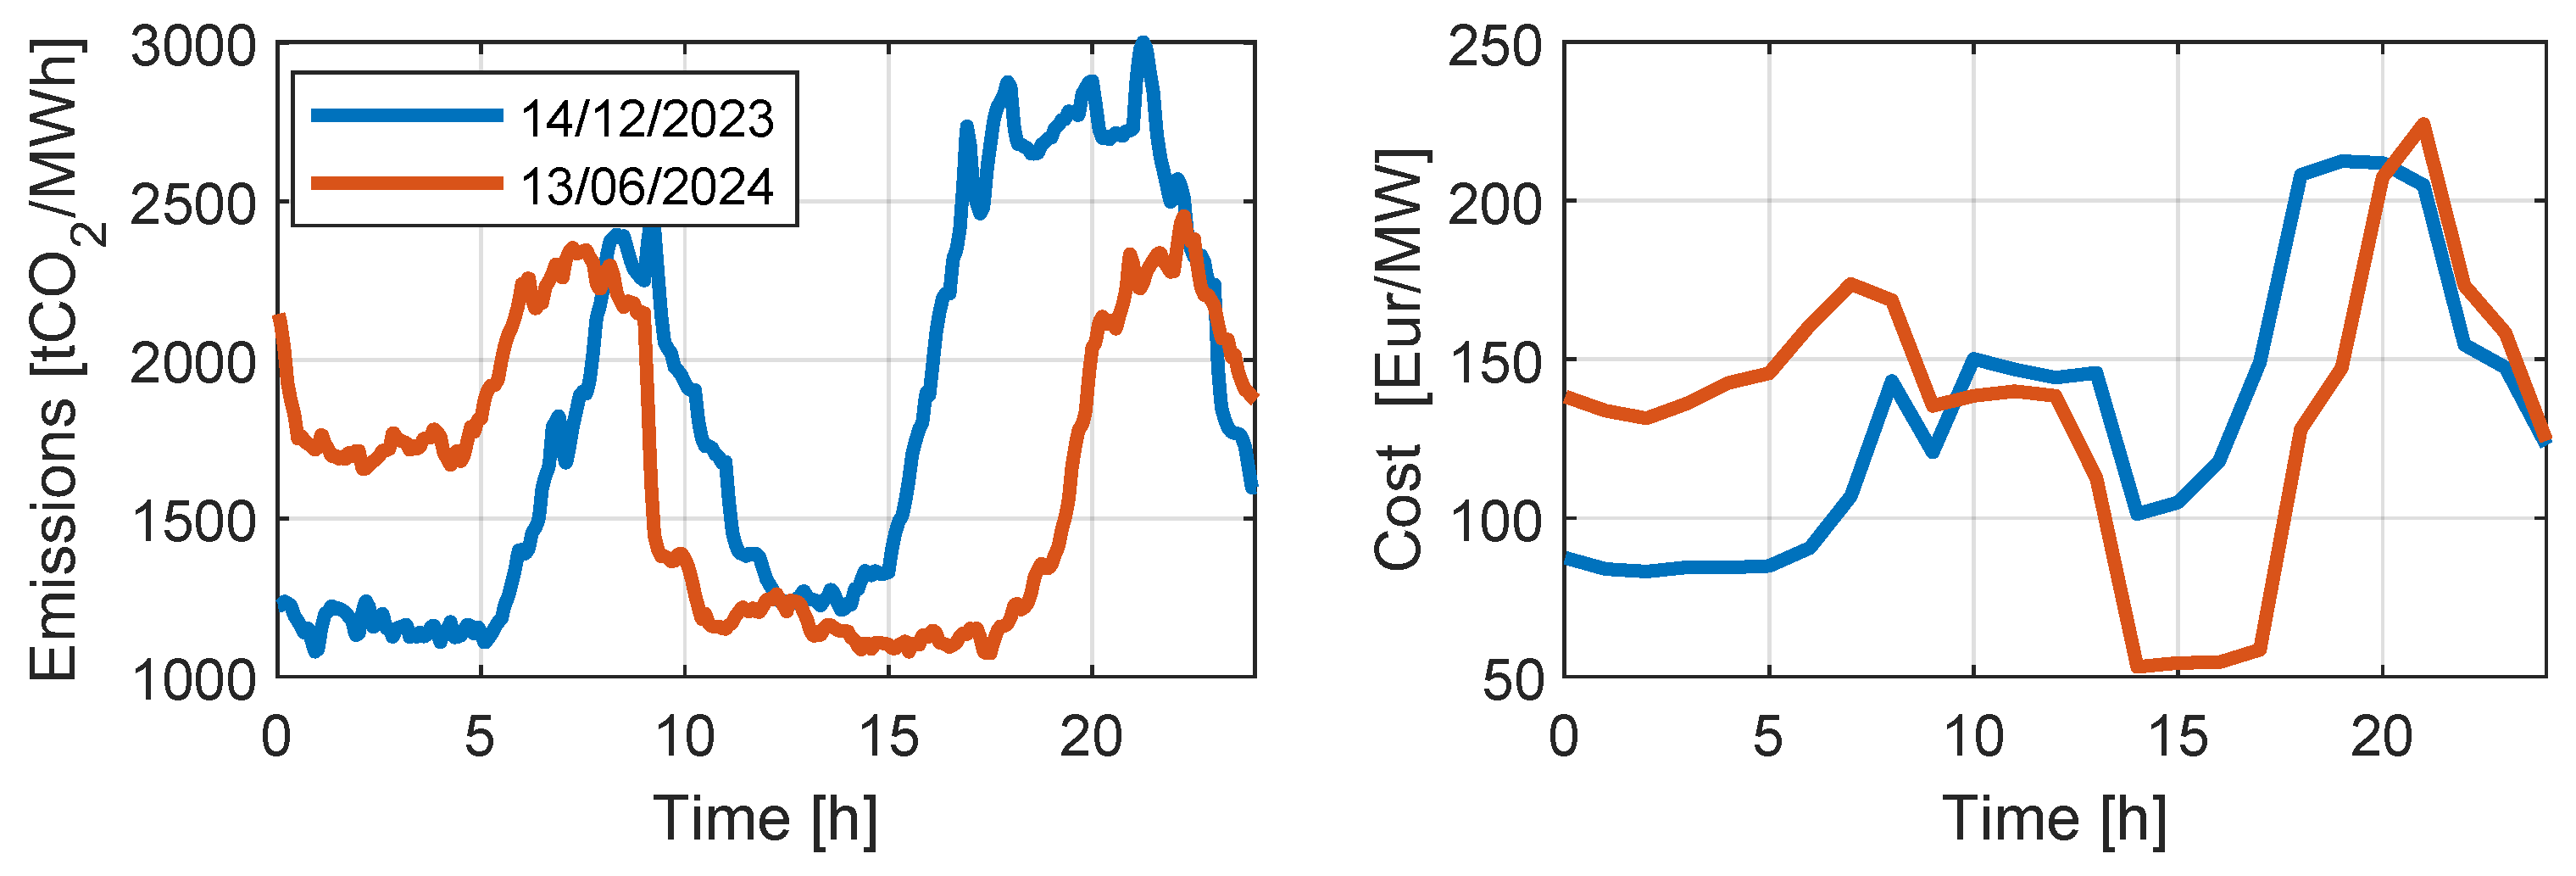
The proposed algorithm was tested in the two scenarios shown in
Figure 6: a characteristic day in June and a characteristic day in December. A simulation environment was created with Matlab (R 2024b) which recreated the operating conditions in an actual BSS. Some of the characteristics of the simulation are the following:
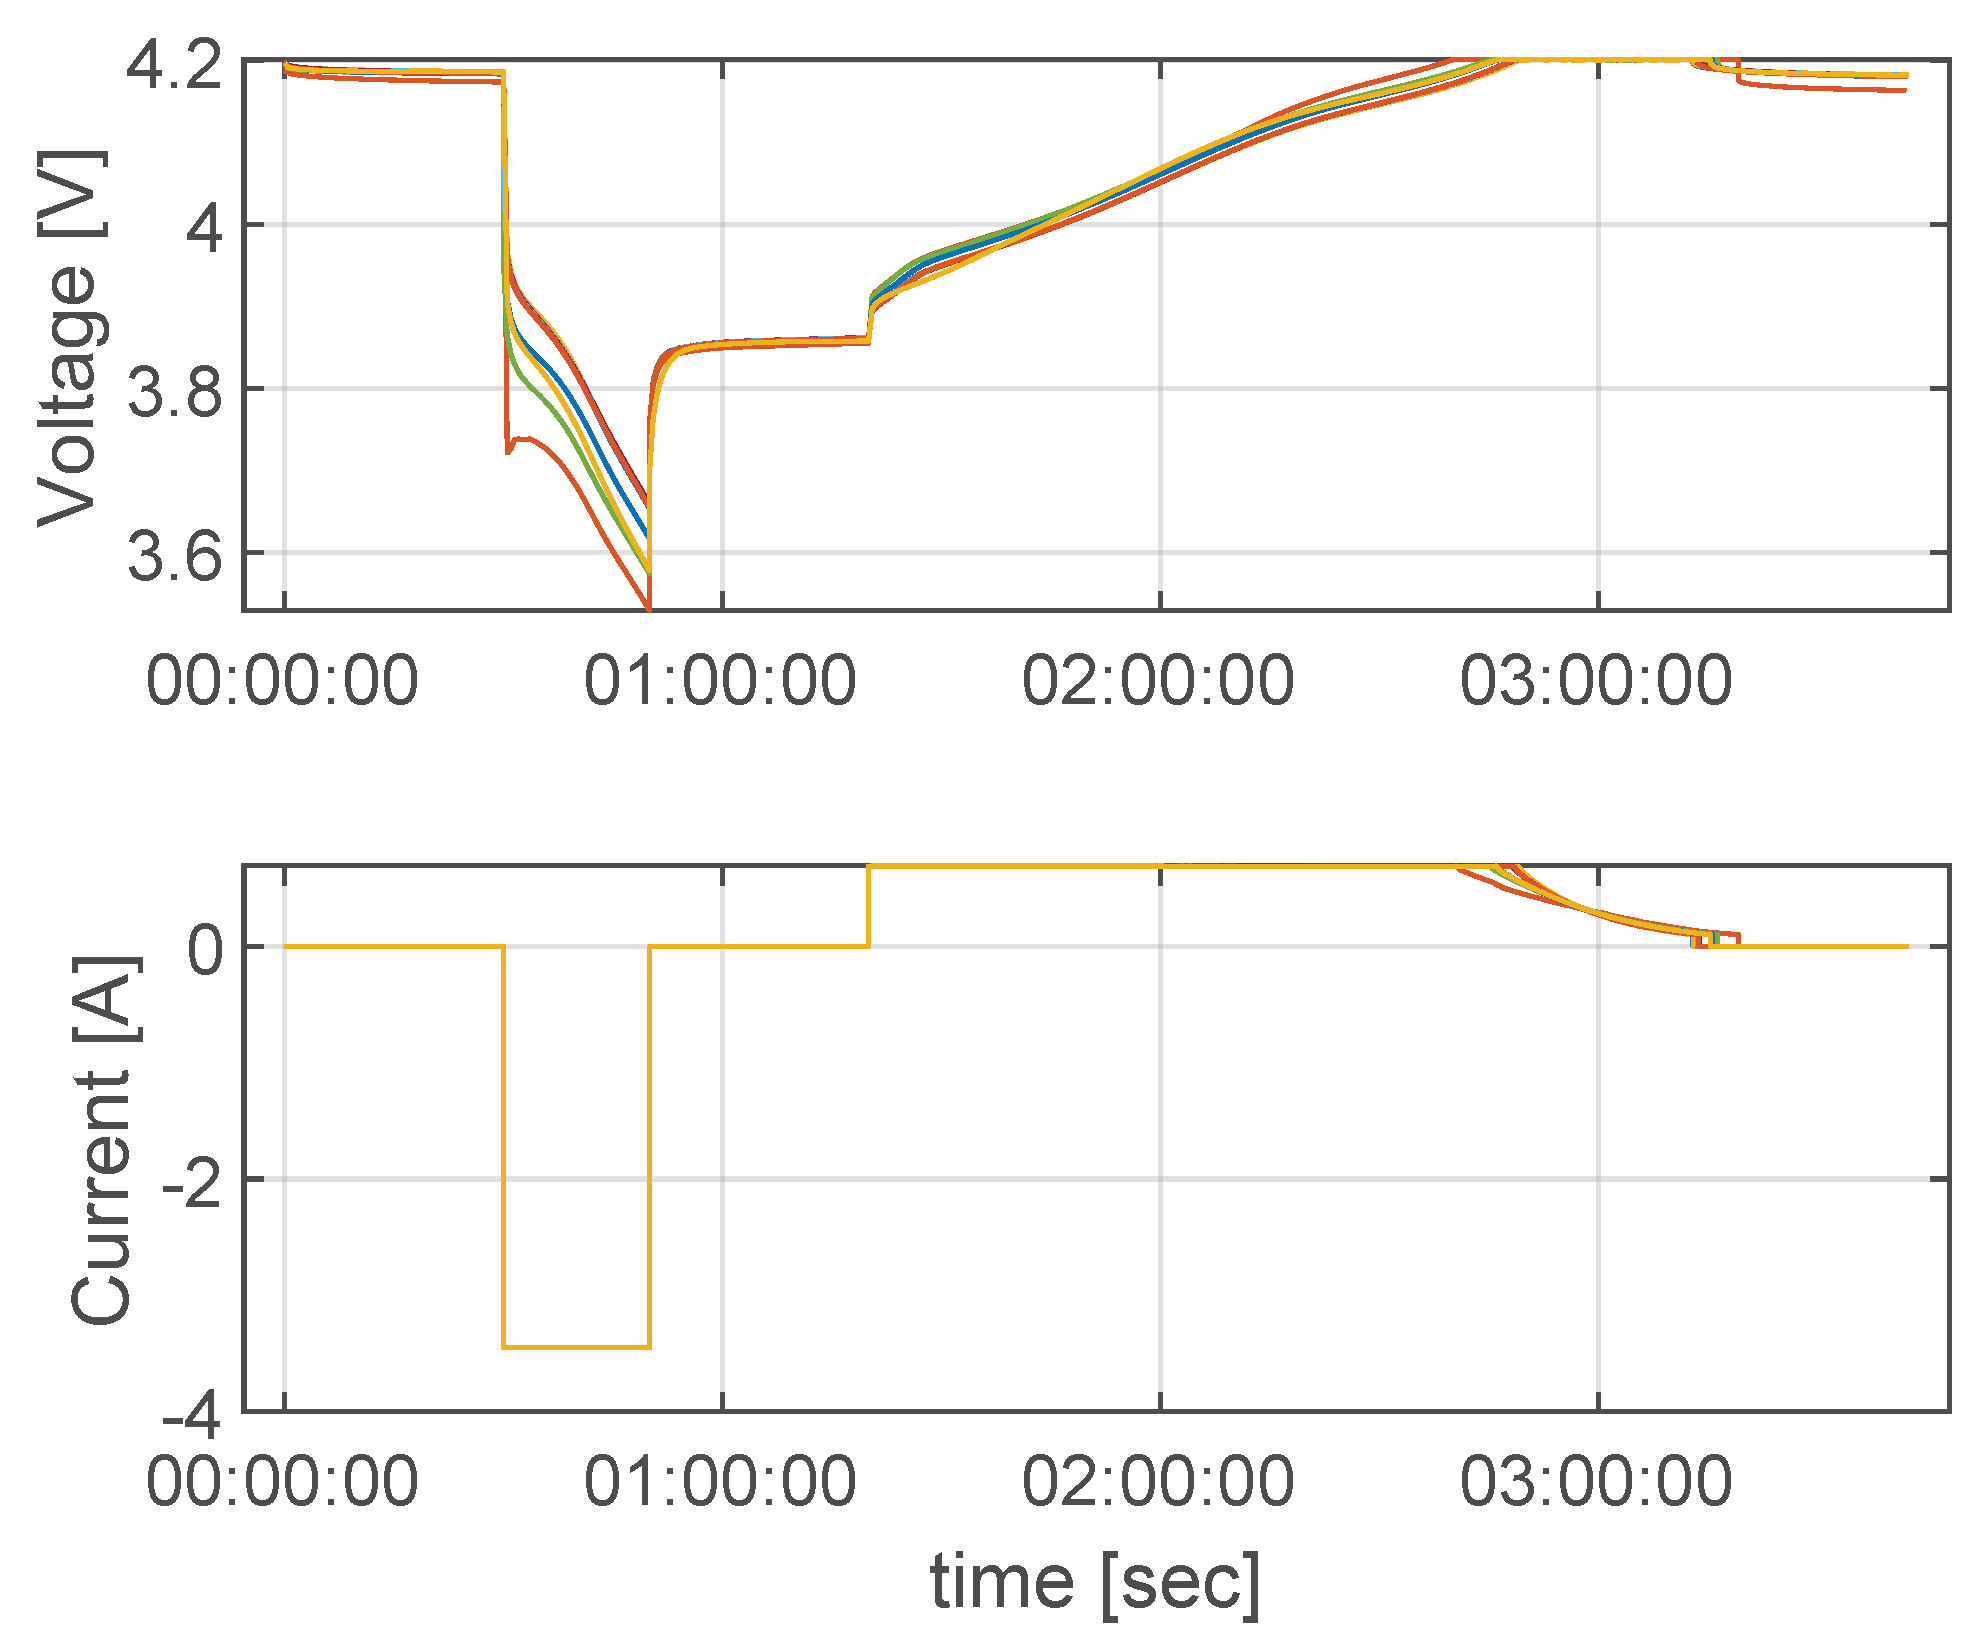
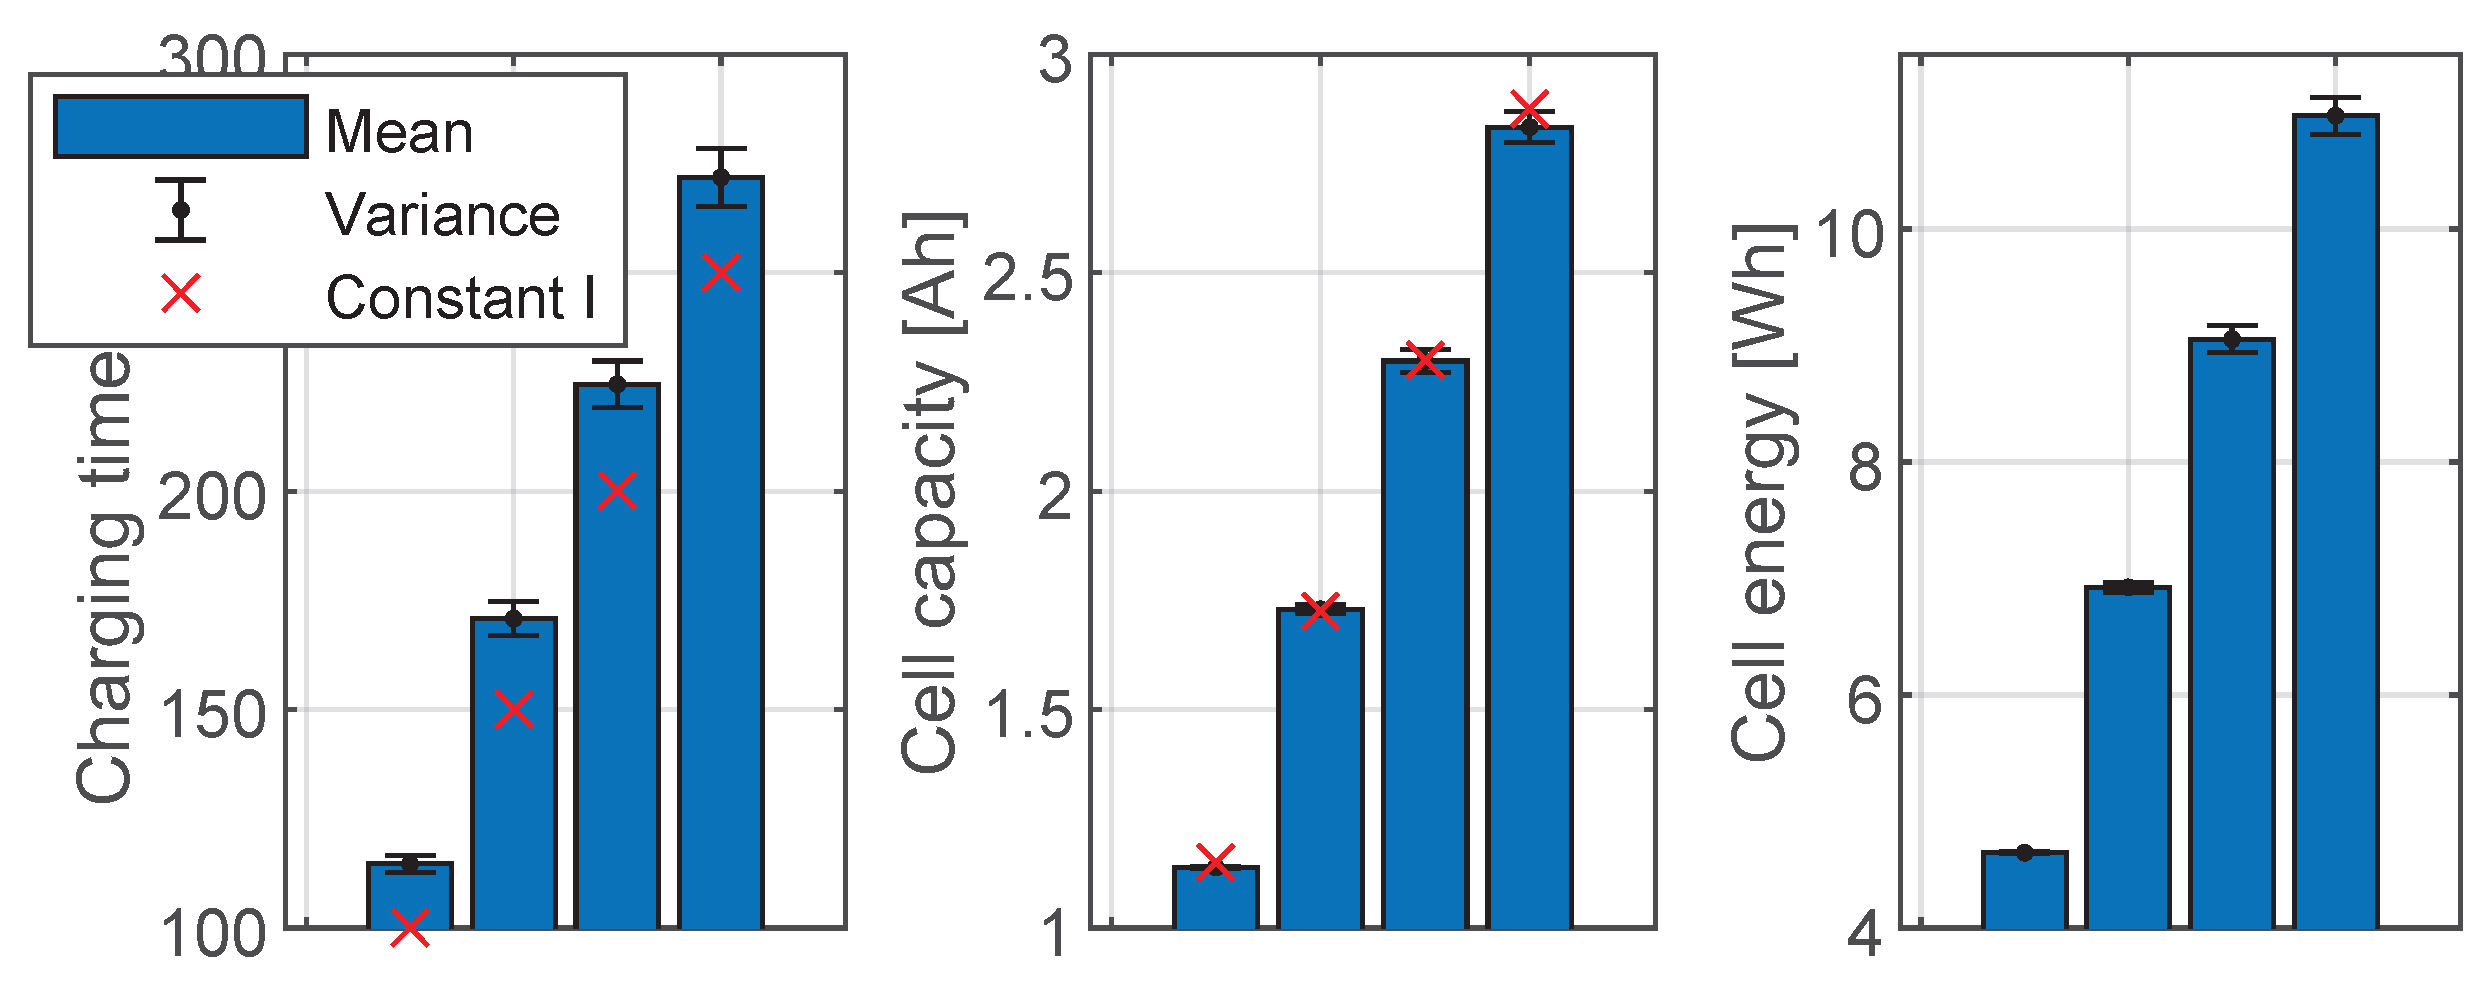
Each slot was simulated independently. The SOC of a battery that was activated for charging was updated at an average rate of 0.2 C but with a variability of 2%, which corresponds to the values found in experimental tests. These values represent the tested set of cells with different ageing levels, and they would be used for the case study.
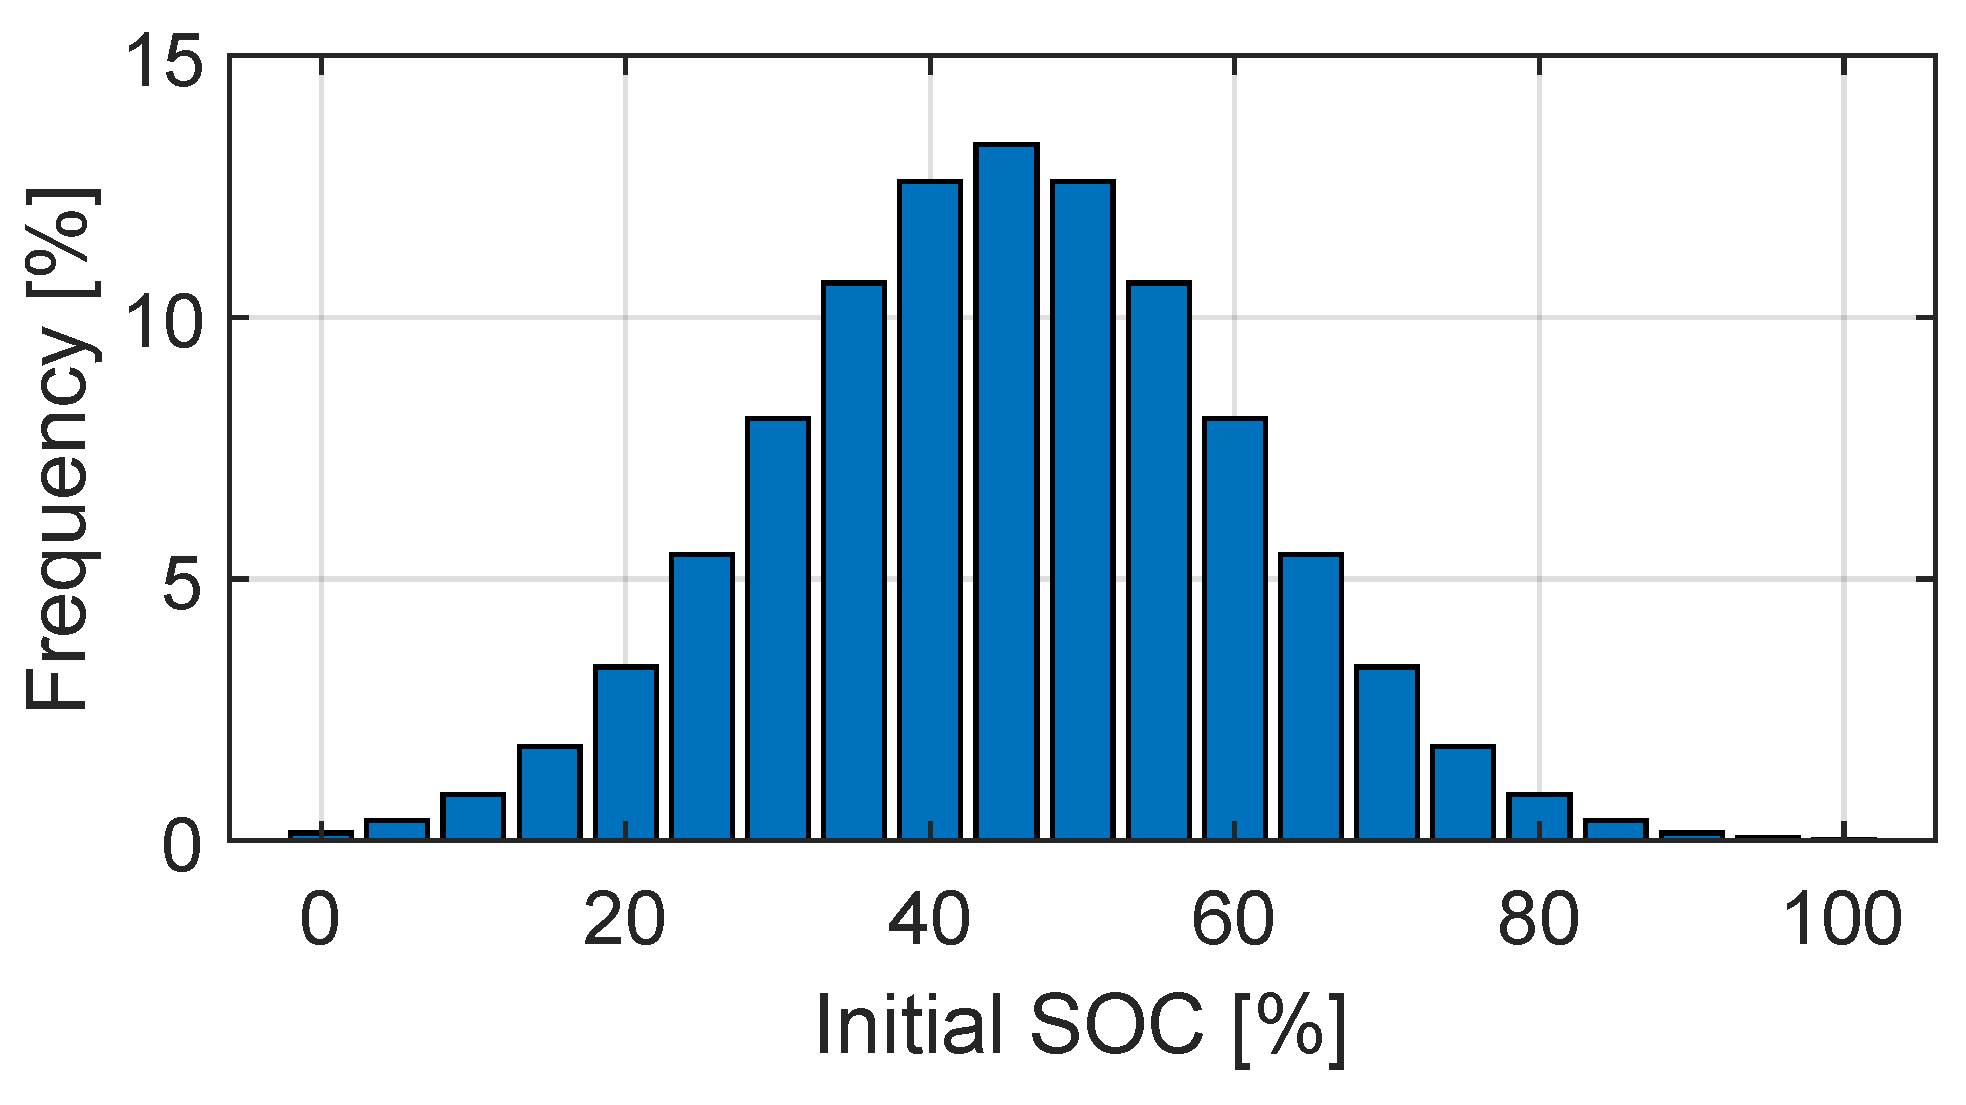
When a vehicle arrived at the station, a charged battery was replaced with an empty one. The starting charge of the empty battery was obtained though a normal distribution with a 45% mean and a variance of 15%, following similar results found in the literature.
When the BSS decided to activate N slots in a time step, N of the empty batteries were randomly selected. The charging time depended on the initial SOC and the values found in experimental charging procedures (
Figure 2).
For comparison purposes, all validation simulations were performed with the same battery demand (day 2 in
Figure 4), but the optimization was performed with another battery demand with the same probability distribution (day 1 in
Figure 4). The model sampling was 90 s, considered the minimum time to swap a battery at the station.
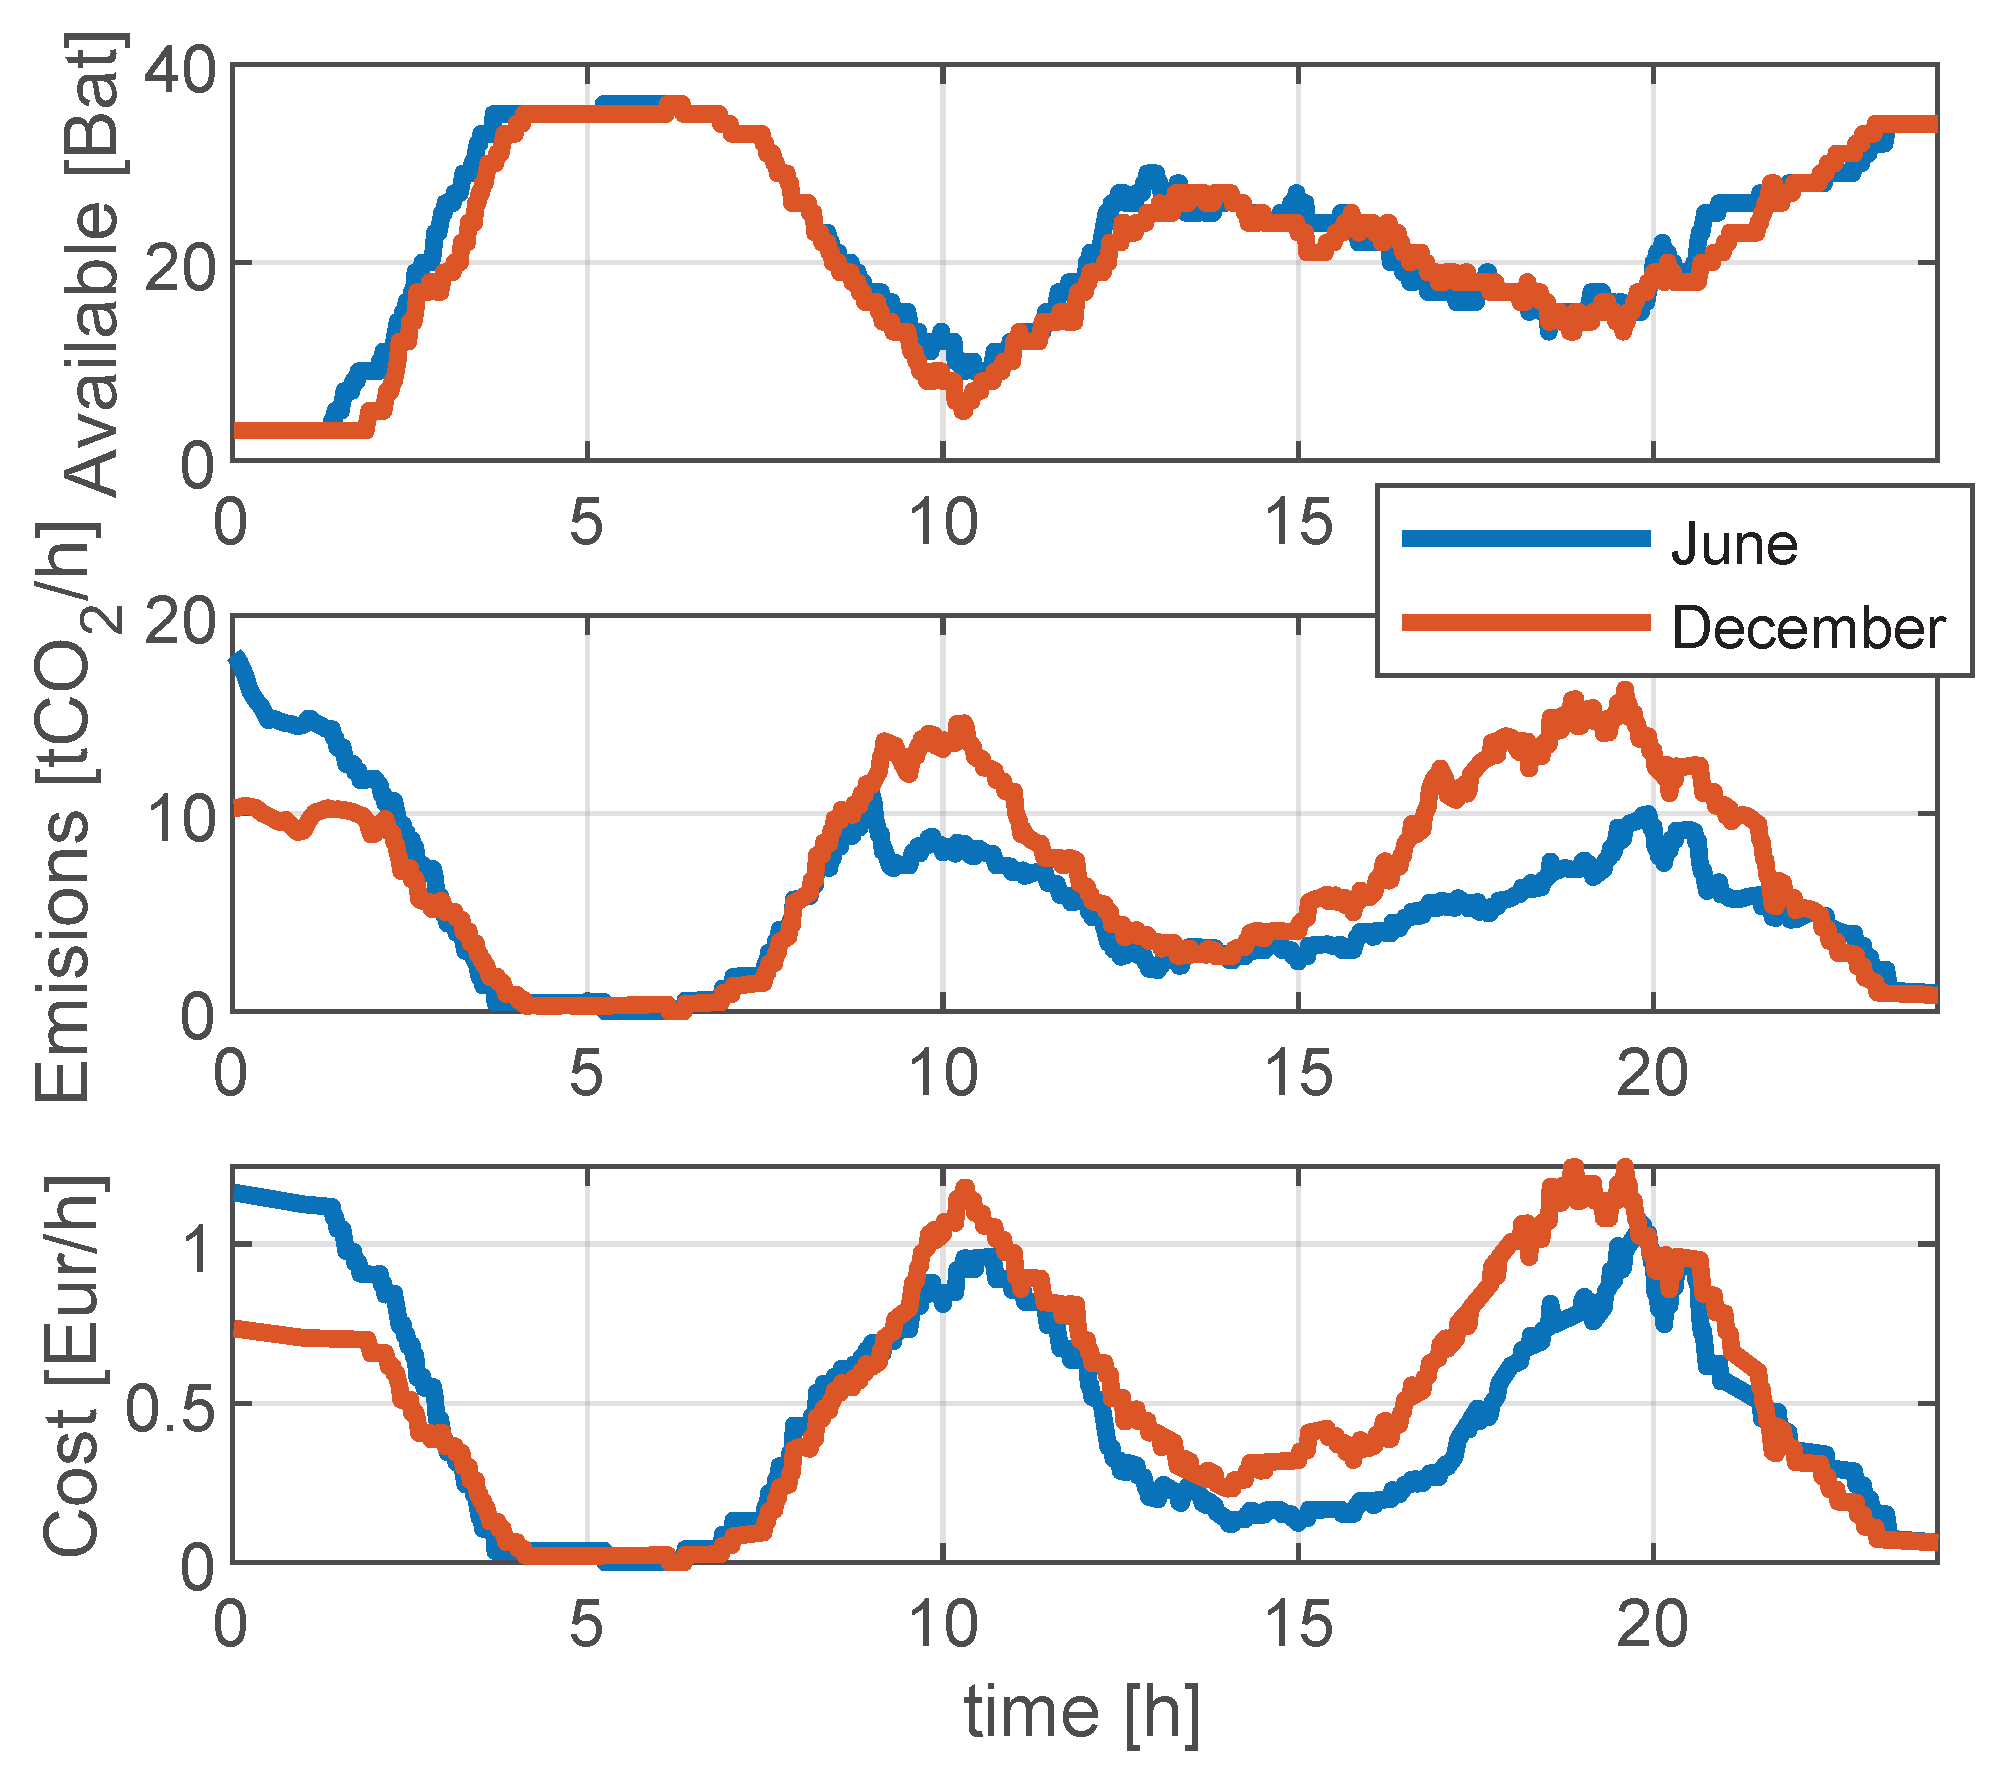
Figure 10 shows the operation of the standard control algorithm (ASAP) when operating on a normal day in June (blue) or on a normal day in December (orange). The upper plot shows the evolution of the available batteries, i.e., fully charged, the medium plot shows the corresponding emissions of
, and the bottom plot shows the cost of electricity. Both simulations started the day with 3 batteries available and started charging the other 33. The total operation cost was EUR 11.15 in June and EUR 12.38 in December, while emissions totaled 130 and 167 t
, respectively.
As expected, the default control strategy always maintained a certain number of fully charged batteries but did not contemplate the price of electricity or the
emissions. Even if the algorithm actuated in a similar manner (only small deviations were found because of the variability in the charging times), the cost and emissions in June were slightly higher in the early morning, while the cost at the end of the afternoon was lower (see
Figure 6).
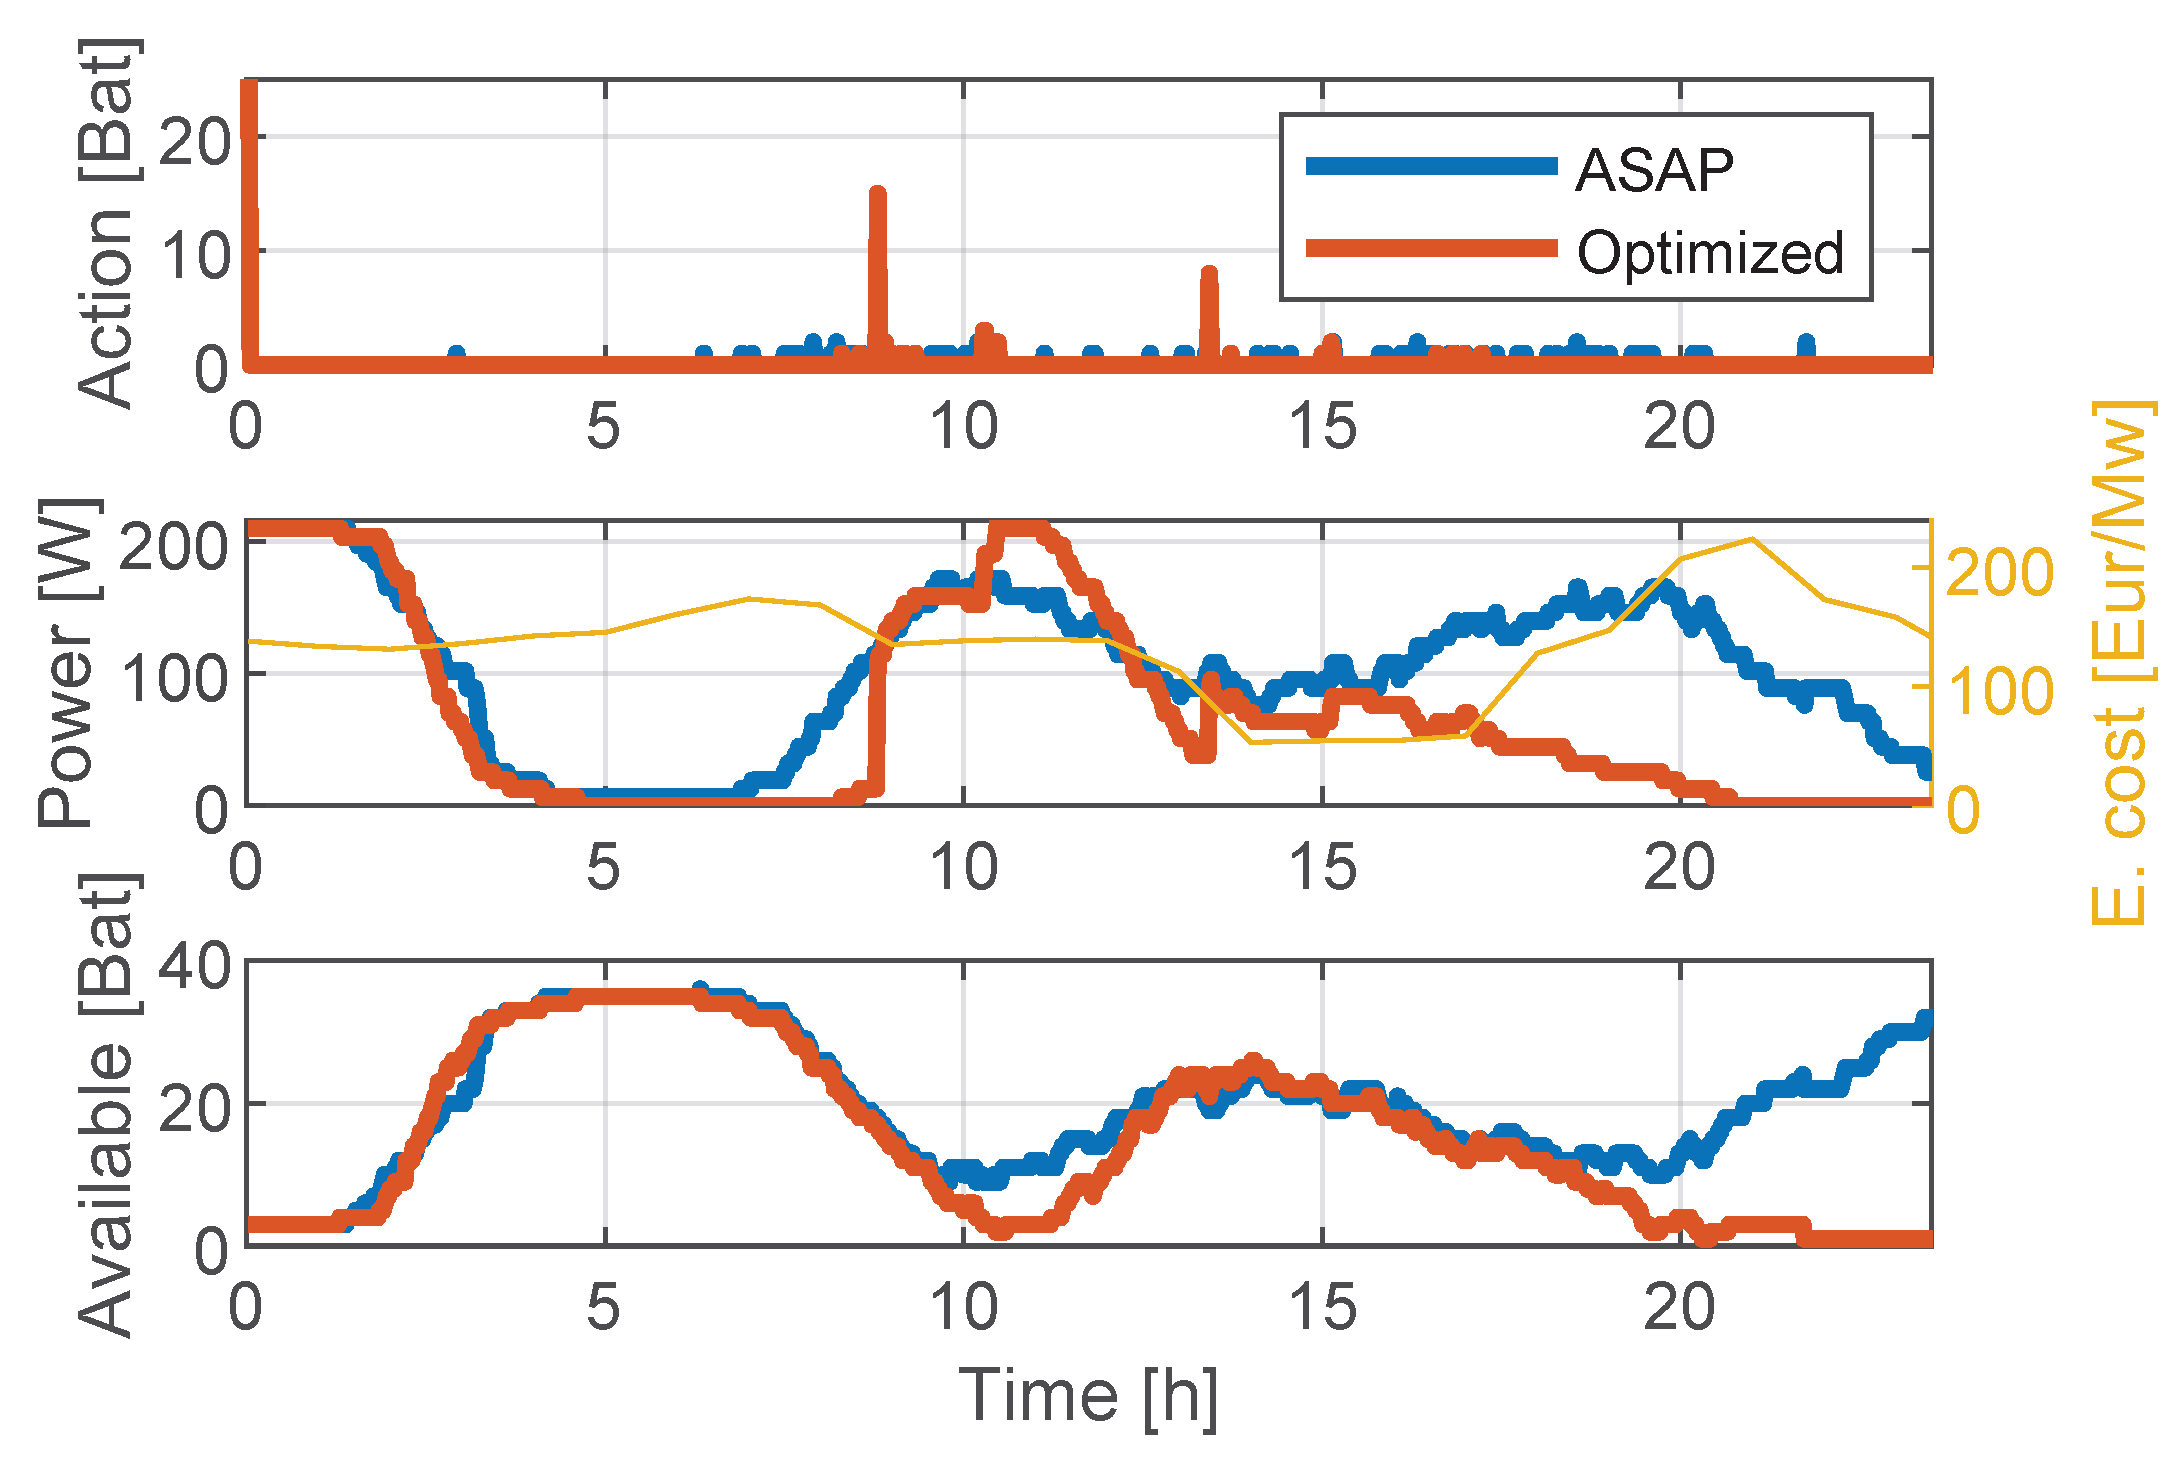
Figure 11 compares the default method (blue) and the optimized operation (orange) for a normal day in June when only the cost was considered (
). The action, i.e., activating charging slots (upper plot), the power consumption (medium plot), and the available batteries (lower plot), is shown to illustrate the method’s capabilities.
It can be observed that the optimization forced the BSS to operate between 9:00 a.m. and 5:00 p.m., when electricity price was lower, mainly because of solar energy in the Spanish national power grid. The BMB ensured adequate service and kept some margin between 8:00 a.m. and 11:00 a.m., when most of the vehicles demanded batteries.
With regard to the
optimization,
Figure 12 shows the results of the default control (blue), the optimization driven by the economical cost (orange) and the optimization focused on emissions (yellow) for the normal conditions found on a working day in December. Although the optimization trends were similar, the sharper expected evolution of the
emissions pushed the BSS control to make sharper actions and avoid the high emission rates between 8:00 p.m. and 12:00 p.m. and between 5:00 a.m. and 9:00 a.m.
To compare the results independent of the total batteries charged, the costs per kWh are summarized in
Table 2. The margin in June was slightly lower than that in December because of the high availability of solar energy during most of the day, which maintained a low price when the battery demand was high. Nonetheless, optimizing the charging policy allowed reducing the operational costs by 7.6%. In December, when the fluctuations in cost appeared before 6:00 p.m., the potential of optimization reached 10.71%. Moreover, if the emissions were optimized, then the algorithm was able to reduce the total emissions on a normal day in June by 16.9% and on a normal day in December by 26%.
Note that the algorithm minimize both the emissions and the economical cost, but the selection of the parameter determined a trade-off between lower cost and lower emissions. The selection of depends on the concrete objectives of the BSS. The study of adequate legislation to reduce emissions is out of the scope of the present work but represents a challenge to forcing BSS operation to be consistent with GHG climate goals.
5. Conclusions
An optimization framework for a battery-swapping station was presented and validated in a simulation environment that emulated the uncertainties found in real operation, namely variable charging times depending on each battery’s state of health, variable demand and a variable initial SOC when a battery is replaced.
The method proposed is based on pre-calculated demand obtained from a probability distribution and uses the expected cost of electricity throughout the day to optimize with DP the total cost of operation. The method was able to reduce the operational costs by 7.6 and 10.7% on two characteristics days for the power grid of Spain (June and December), while it was able to reduce the emissions by between 16.9 and 26%.
In the authors’ opinion, the most important contributions of this work are as follows:
The main uncertainties in a BSS’s operation have been studied. Various experimental tests on batteries explored the variability of charging times for various levels of discharge.
An optimization method was derived with DP by using a control-oriented model that reduced the BSS dynamics to two dynamic states.
A battery margin buffer, obtained though queuing theory, was proposed to cope with uncertainties and ensure adequate service.
The algorithm was validated in a simulation environment that simulated the evolution of a BSS with 36 charging slots. Uncertainties in the charging time, initial SOC and battery demand were included to emulate real-world operation.
Future work will be oriented toward studying disturbances and outliers in real operation and modifying the algorithm to improve the robustness of the method when facing more charging variability because of ageing or when facing extreme events that might distort traffic prediction.


