1. Introduction
The energy sector’s reliance on fossil fuels contributes significantly to global greenhouse gas emissions and air pollution annually [
1]. Rising demand, resource depletion, and geopolitical instability also induce a shift toward low-carbon energy sources such as wind and solar power. To balance the variability of renewable energy, efficient energy storage solutions like secondary (rechargeable) batteries and supercapacitors are critical. The ongoing transition to fully electric and hybrid vehicles to reduce transportation-related emissions already represents an example of this paradigm shift.
Li-ion batteries have become a cornerstone of low-carbon energy applications due to their high energy density and compact design, particularly in electric vehicles (EVs) and portable devices. However, their safety has gained attention due to the risks of catastrophic failures like thermal runaway [
2,
3,
4,
5]. Thermal runaway (TR) occurs when an uncontrollable rise in temperature leads to strongly exothermic side reactions, such as those associated with the decomposition of the solid electrolyte interface (SEI) of the anode, cathode, and electrolyte, which can result in fires or explosions [
6,
7,
8,
9].
Lithium-ion battery modeling has evolved significantly, beginning with the foundational work by Doyle and Newman [
10,
11]. Their “pseudo-2D” (P2D) model incorporates one-dimensional cell layers and solid lithium diffusion in electrode particles, which require about 40 parameters for accurate representation. While highly detailed, this complexity limits its practicality in engineering. For low to moderate currents, the model is often simplified using a single-particle (SP) approach, which assumes uniform conditions across porous electrodes and uses lumped resistance terms to enhance computational efficiency [
12]. Different studies have utilized the single-particle (SP) model and the more comprehensive pseudo-2D (P2D) model as foundational frameworks to investigate the thermal behavior of lithium-ion batteries. These models serve as critical tools in analyzing heat generation mechanisms, temperature distribution, and their effects on battery performance and safety [
13,
14,
15,
16,
17].
Thermal runaway in Li-ion cells involves a chain reaction mechanism triggered by abnormal temperature increases under abusive conditions. This process is fueled by the Heat–Temperature–Reaction (HTR) loop. Initially, abnormal heat generation raises the cell’s temperature, initiating side reactions like the decomposition of the solid electrolyte interface (SEI). These reactions release additional heat, perpetuating the HTR loop until the cell undergoes thermal runaway [
4]. There are three types of abuse that trigger thermal runaway: mechanical, electrical, and thermal abuse. Mechanical abuse refers to physical damage to the battery, such as crushing and penetration, which can compromise the battery’s structural integrity and lead to ignition. Examples of electrical abuse are high currents, overcharging, over-discharging, or short-circuiting. Thermal abuse occurs when a Li-ion battery is exposed to external temperatures outside its safe operating range, which can happen due to environmental conditions, poor thermal management, or external heat sources.
Modeling thermal runaways in lithium-ion batteries is a critical area of research aimed at understanding and mitigating safety risks associated with battery operation. One common strategy involves the development of electrochemical–thermal models, such as those based on the Newman framework [
10,
11], which integrate electrochemical reactions with heat generation and transport mechanisms within the battery cell. These models typically consider factors like heat generation from electrochemical reactions, ohmic heating due to internal resistance, and heat dissipation through conduction, convection, and radiation. Thermal runaway modeling has also advanced, with Hatchard et al. [
14] developing a model focusing on side reactions during runaway events, which are validated through oven tests. Kim et al. [
9] expanded this to a 3D framework, incorporating additional reactions, thus inspiring further research into the thermal behavior and safety of Li-ion batteries. Another significant aspect is the incorporation of thermal abuse models, which simulate extreme conditions such as overcharging or external heating to predict how these conditions can trigger thermal runaway [
15,
16,
17]. Talele et al. [
15] used a thermal runaway numerical model to study the trigger point evolution in prismatic cells with different cathode chemistries (NMC, LFP, and LCO) under varying ambient temperatures. They employed nail penetration-assisted thermal abuse testing and empirical correlations to simulate the source term. By ANOVA-based statistical evaluation, they found ambient temperature to be the most influential factor on trigger time for both natural and forced convection conditions. Jelly roll thickness and heat transfer coefficient (HTC) were identified as additional critical parameters. Azuaje–Berbecí et al. [
16] proposed a multilayered electrochemical–thermal model designed to predict heat generation, battery temperature, voltage, and the potential for thermal runaway during lithium-ion battery charge/discharge cycles under various operating conditions. Their findings revealed that cyclic charging and discharging can elevate the battery temperature to levels capable of triggering thermal runaway. Özdemir et al. [
17] investigated the thermal behavior of lithium-ion cells under both normal and abusive operating conditions through experimental and numerical approaches. They developed an electrochemical–thermal model to simulate temperature and voltage variations during discharge processes. The model was enhanced to incorporate the effects of temperature-dependent heat generation by utilizing Arrhenius equations.
Most battery modeling for thermal runaway focuses on a fresh battery and does not contain any aging-related mechanism, which is an important contributing factor that may heighten the risk [
18,
19]. Aging refers to the degradation of the cell over time, which is evidenced by battery performance. To understand the aging of a Li-ion battery, three main questions need to be answered: What factors cause battery aging? What happens to a battery during aging? And what are the consequences of the aging process?
There are two main categories of aging: cycling aging and calendar aging. During the operation of a battery in an electrical application such as in an electric vehicle, aging occurs primarily due to the repeated charging and discharging phases called “cycling aging”. This type of lithium-ion battery aging is significantly affected by key operating conditions such as temperature, charge/discharge current rates (C-rate), depth of discharge (DOD), and mechanical stress [
20]. Battery aging can also occur while the battery is at rest in a process known as calendar aging. During this period, the battery is exposed to ambient temperatures without active thermal management, potentially leading to more aggressive aging due to exposure to higher or lower ambient temperatures than those reached during cycling when the thermal management system can better control the temperature. This rate of degradation is influenced by factors such as the battery’s state of charge (SOC) and the duration of storage [
21]. Lithium-ion battery degradation typically follows four key modes: loss of Lithium inventory, loss of active material in the negative and positive electrodes [
22], and conductivity loss [
20]. Lithium ions can be consumed inside reactions such as solid electrolyte interface (SEI) layer growth, electrolyte decomposition, or lithium plating, causing lithium shortage for cycling. The active material in the anode and cathode becomes unavailable for lithium insertion due to mechanisms such as particle cracking, loss of electrical contact, or blockage by resistive surface layers. It is worth mentioning that these mechanisms have different paths and effects depending on battery chemistry, and they can affect the performance of the cell through three main factors—capacity, power, and internal resistance—which have been the preferred aging indicators of lithium-ion batteries. Structural disorder, loss of active material, crystal distortion, and mechanical stress contribute to capacity and power fading, while surface layer formation, such as in lithium plating and SEI layer growth, increases impedance and resistance [
21]. These aging effects alter the physical and chemical properties of cell components, significantly influencing the thermal behavior of lithium-ion batteries. However, there are fewer studies on the thermal safety of aged lithium-ion cells, especially those using numerical methods, compared to fresh cells.
In the study by Fleischhammer et al. [
23], the impact of cyclic aging on the thermal behavior of Li-ion cells was investigated, and the results revealed that cells subjected to high-rate cycling exhibited the same thermal behavior as fresh cells. In contrast, Wu et al. [
18] conducted an experimental study using ARC tests to investigate how low-temperature aging affects the thermal behavior of Li-ion batteries. The results showed that low-temperature cycling significantly influences TR performance, leading to a faster onset of thermal runaway and increased self-heating rates at the same temperature. Another study [
24], conducted to investigate the influence of calendar aging on the thermal stability of a commercial Li-ion cell, revealed that the self-heating onset temperature of aged cells was much lower than that of fresh cells. Garcia et al. [
19] examined the thermal runaway (TR) behavior of fresh and aged NMC 811 batteries using ARC testing at different SOCs. Their findings showed that higher SOC led to earlier exothermic reaction detection, highlighting the rapid escalation risk at high SOC conditions. Guo et al. [
25] investigated the effects of aging on the safety performance of commercial 18650 lithium-ion batteries by subjecting them to fast charge/discharge cycles and conducting thermal abuse tests. The results revealed that aged cells exhibited improved thermal stability compared to fresh cells and had significantly higher thermal runaway temperatures. This study suggests a greater likelihood of thermal runaway propagation in the module of aged cells used in applications such as electric vehicles due to the higher temperature of the thermal runaway. Zhang et al. [
26,
27] conducted a comprehensive investigation into the thermal safety evolution of lithium-ion batteries during high-temperature aging. Their study revealed that both high-temperature cyclic aging and calendar aging result in similar thermal hazard and degradation mechanisms. The findings showed that high-temperature aging significantly reduces the thermal stability of the cells. The study observed that the gas released during the aging process reduces the amount of gas available for release during a potential thermal runaway event. Although aging decreases the cells’ thermal stability, it also mitigates the overall thermal hazards posed by the batteries through this gas release.
Abada et al. [
28] developed a 3D model for an aged battery. They considered the SEI growth as the main cause of calendar aging in Li-ion cells and incorporated this concept into the 3D thermal model to investigate the thermal behavior of a cell subjected to external heating. The results showed that SEI growth hinders the anode decomposition and consequently increases the onset temperature of thermal runaway. However, their model did not consider the effects of SEI growth on the increase in the internal resistance of the cell. Grandjacques et al. [
29] developed a semi-empirical model for predicting the thermal behavior of an aged lithium-ion cell based on an Arrhenius kinetic equation. Zhao et al. [
30] developed a thermal runaway model for lithium-ion batteries subjected to low-temperature cycling. Their model incorporates an exothermic reaction between metallic lithium and the electrolyte to account for aging effects. The results indicated that aging slightly increases the total heat generated during thermal runaway, but the impact remains relatively small. In the study by Pastor et al. [
31], the impact of aging on thermal runaway behavior was experimentally investigated for lithium-ion batteries with NMC and LFP cathode chemistries using Accelerating Rate Calorimetry (ARC) tests. Aged batteries were subjected to external heating abuse to evaluate thermodynamic parameters related to thermal runaway. A computational model was also developed using GT-Autolion software for further analysis. Results indicated that aged batteries released less heat during thermal runaway when triggered by external heating. This reduced heat generation was attributed to SEI growth, a key aging mechanism causing capacity to fade, which decreases the availability of lithium and electrolyte in the anode, thus diminishing the exothermic reactions during thermal runaway. Kabra et al. [
32] utilized a combination of experimental and modeling approaches to explore the impact of aging mechanisms on the thermal stability of Li-ion cells. They developed a physics-based aging model to study degradation processes such as lithium plating, SEI layer growth, and active material loss during cycling. By integrating insights from this aging model with Accelerating Rate Calorimetry (ARC) experiments, they created a degradation-aware thermal stability model capable of predicting the onset and intensity of thermal runaway (TR) in Li-ion cells. The findings revealed that while SEI decomposition contributes to earlier TR onset, additional SEI growth can mitigate anode–electrolyte reactions, delaying TR. In contrast, for cells cycled at low temperatures, TR was predominantly driven by lithium plating and the subsequent reaction between plated lithium and the electrolyte. These studies mainly consider the external heat as a trigger for thermal runaway, but they did not consider the effect of high current or other electrical abuse conditions, possibly resulting in a thermal runaway.
This study focuses on developing an electrochemical–thermal coupled model that accounts for side reactions, which lead to thermal runaway, while also trying to include aging effects. The model is validated using experimental data for fresh NMC Li-ion batteries and for aged NCA Li-ion batteries [
33]. It aims to simulate the thermal behavior of aged cells and to explore the impact of external factors, such as high current rates, and internal factors, including impedance and capacity variations involved in aging effects, on thermal runaway initiation. Statistical analysis is used to evaluate the influence of these conditions on the thermal behavior of an NMC cell. The study focuses on cylindrical NMC and NCA Li-ion batteries due to their widespread applications, and it consists of three parts:
3. Results and Discussion
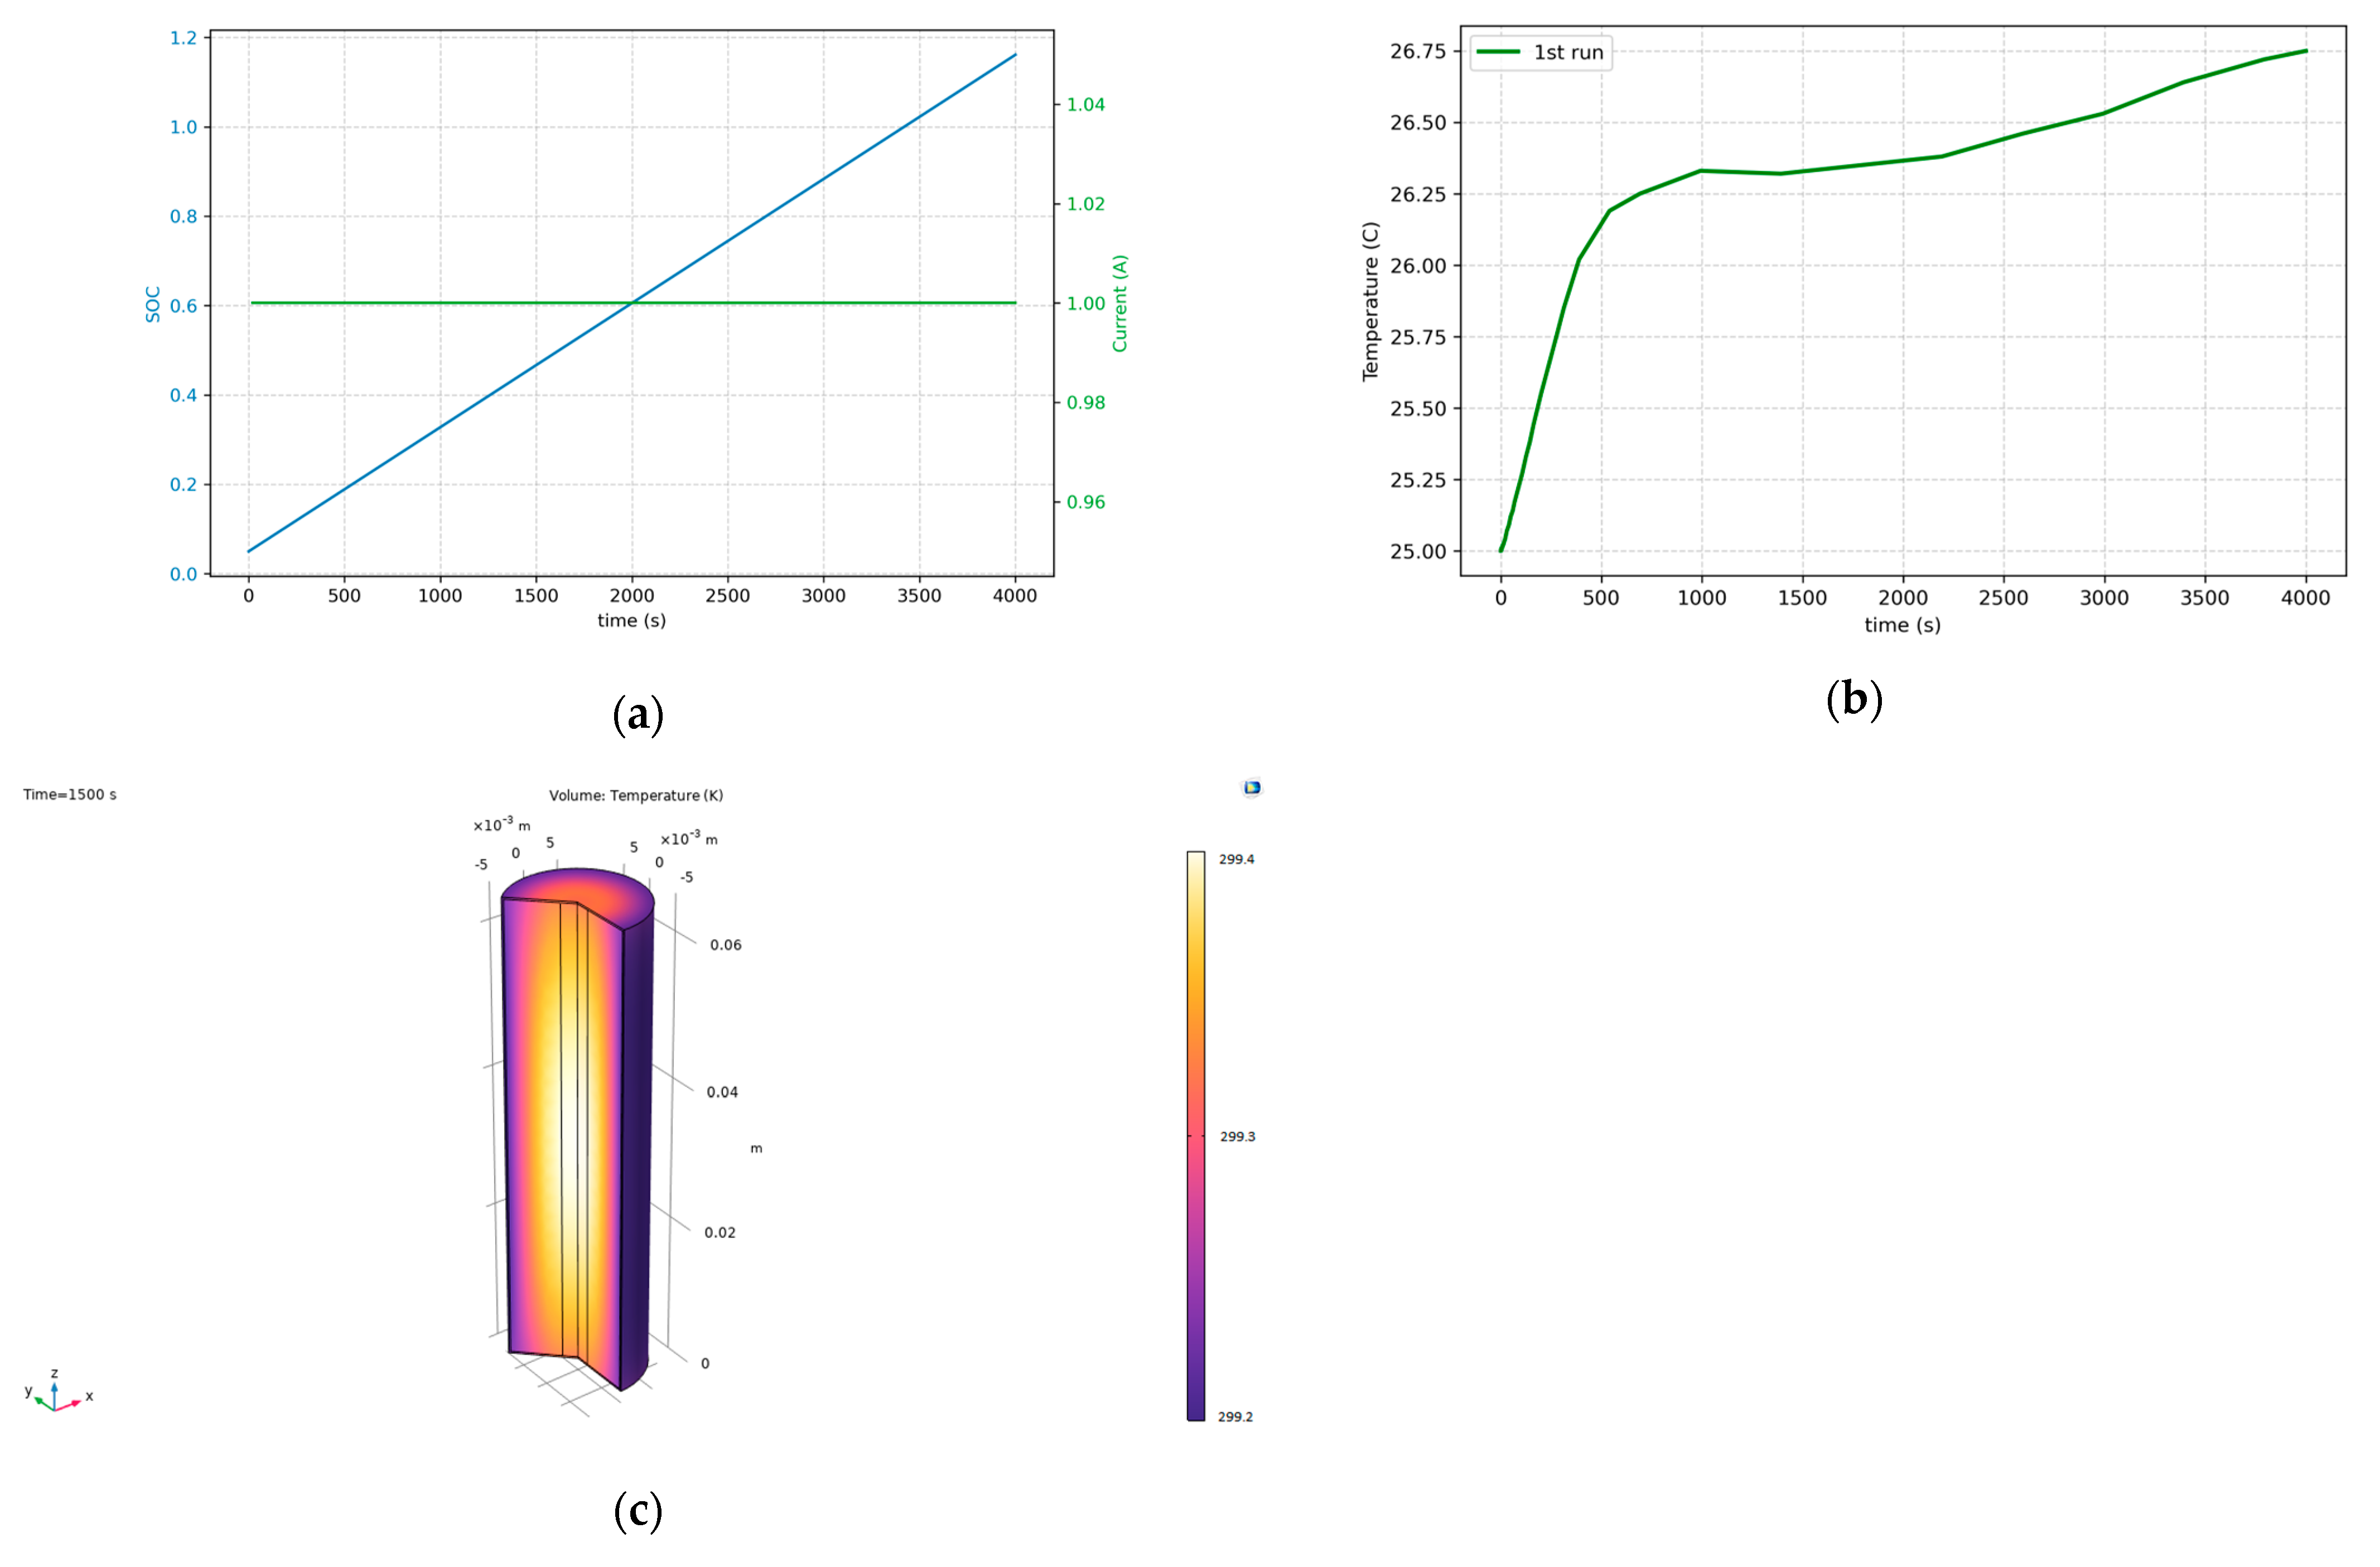
Figure 6 illustrates the results of the first simulation during charging. Initially, the cell’s state of charge (SOC) was near zero, and the cell was charged using a 1C current to reach a fully charged state (
Figure 6a). As shown in
Figure 6b, the cell temperature increases steadily due to the heat generated by electrochemical reactions. In
Figure 6b, at the start of the charging, heat dissipation to ambient is poor due to the fact that surface temperature is close to ambient temperature. After a while, the temperature increment reaches the surface of the cell, heat dissipation becomes larger, and the temperature almost reaches a steady state.
Figure 6c shows that the temperature in the middle of the cell is higher compared to other regions. This phenomenon is related to the geometry of the cell, as heat accumulates more at the core due to limited pathways for thermal dissipation in cylindrical battery designs.
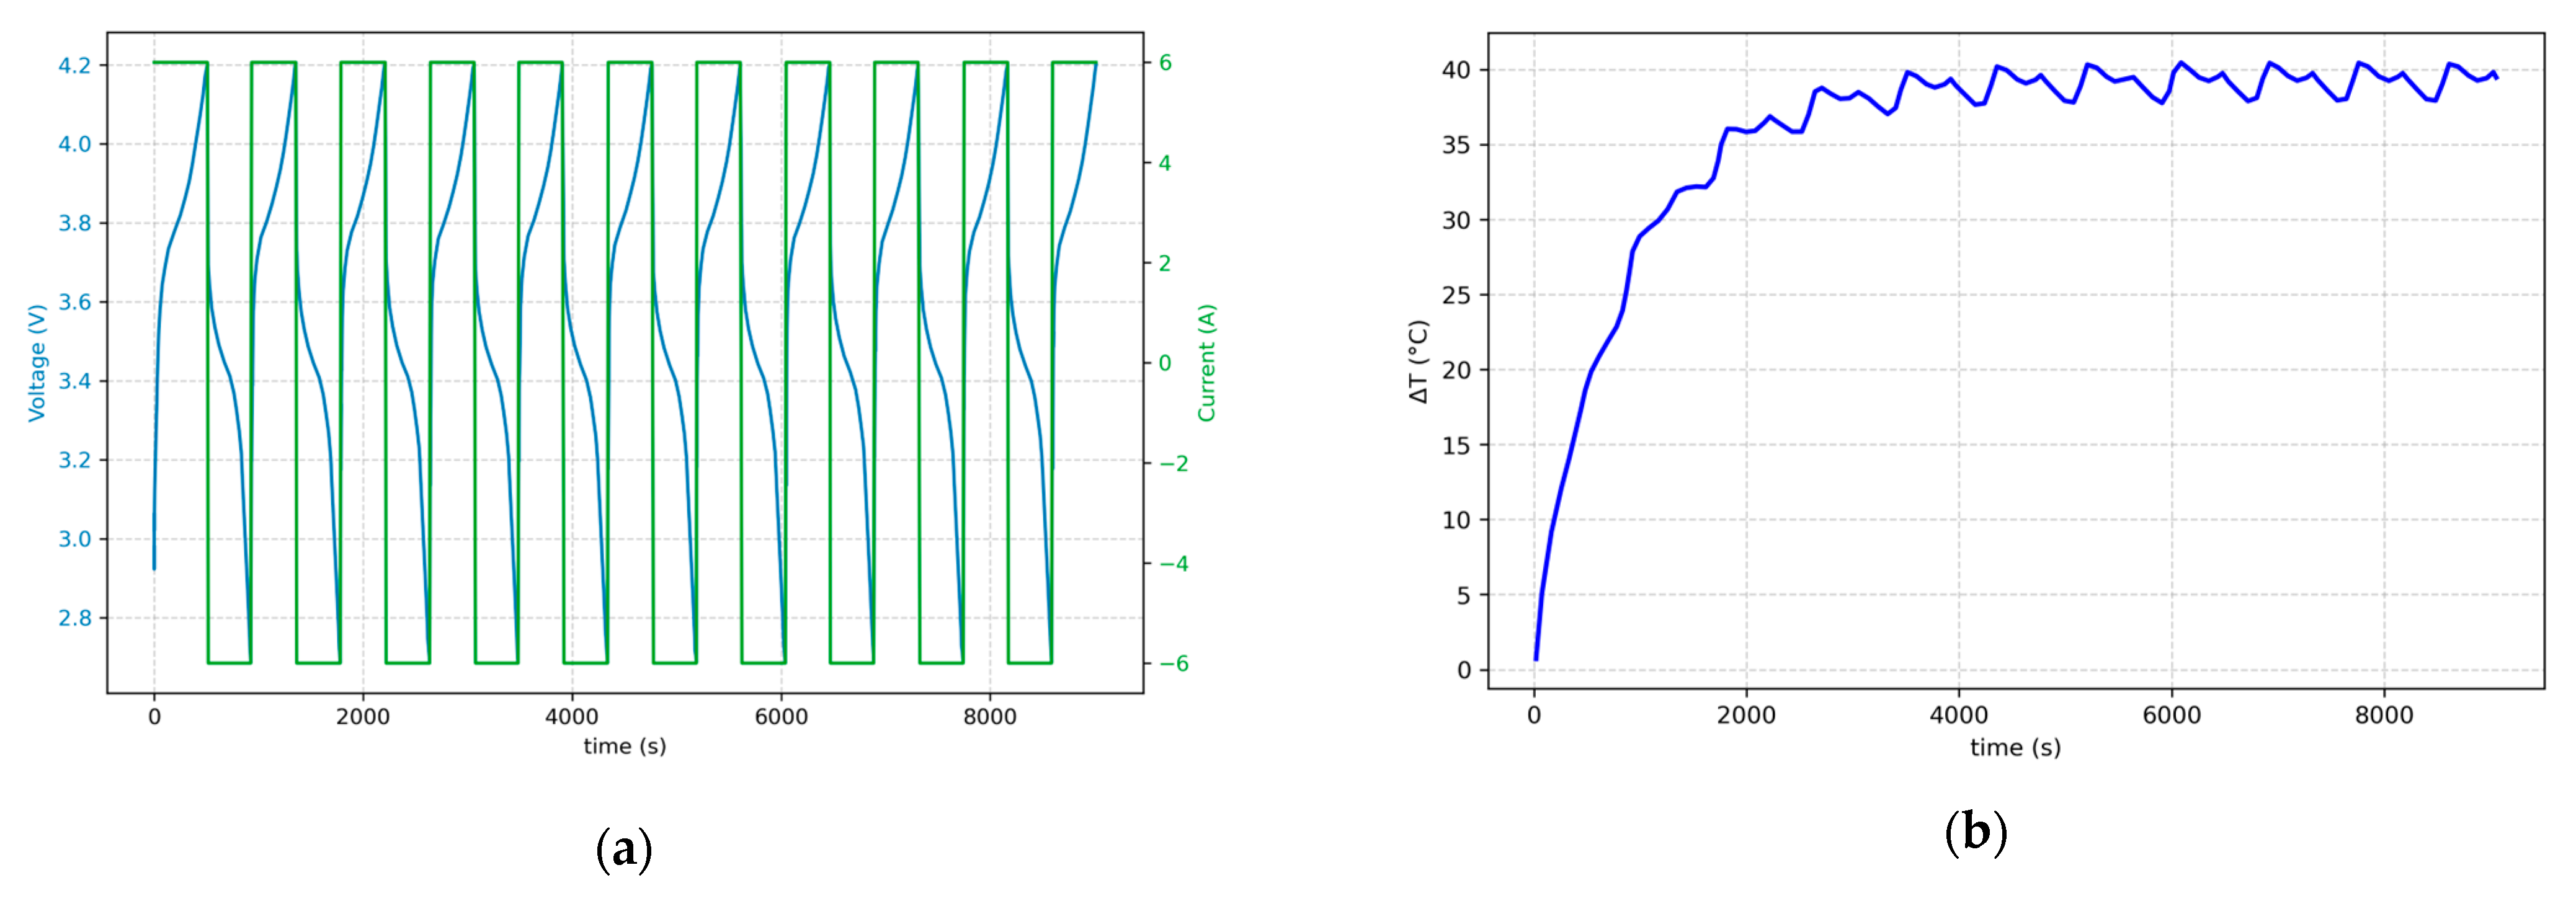
Figure 7 shows the results of the charging/discharging cycles of simulation no. 33 in which a cell with 1 Ah capacity and 10 mOhm internal resistance was charged/discharged using a constant current of 6C.
Figure 7a illustrates the voltage and current of the cell. In the charging and discharging phases, the current is positive and negative, respectively, and voltage increases from around 2.7 V to 4.2 V in charging and vice versa in discharging.
Figure 7b presents the thermal behavior of the cell during this process: at the beginning and after a few cycles, temperature increases due to heat generation by reversible entropy losses [
44]; after the temperature has reached a certain point, heat dissipation to the environment and heat generation within the cell due to charging/discharging almost balance each other and the temperature trend becomes nearly constant.
3.1. Influence of Charging Rate on Thermal Behavior
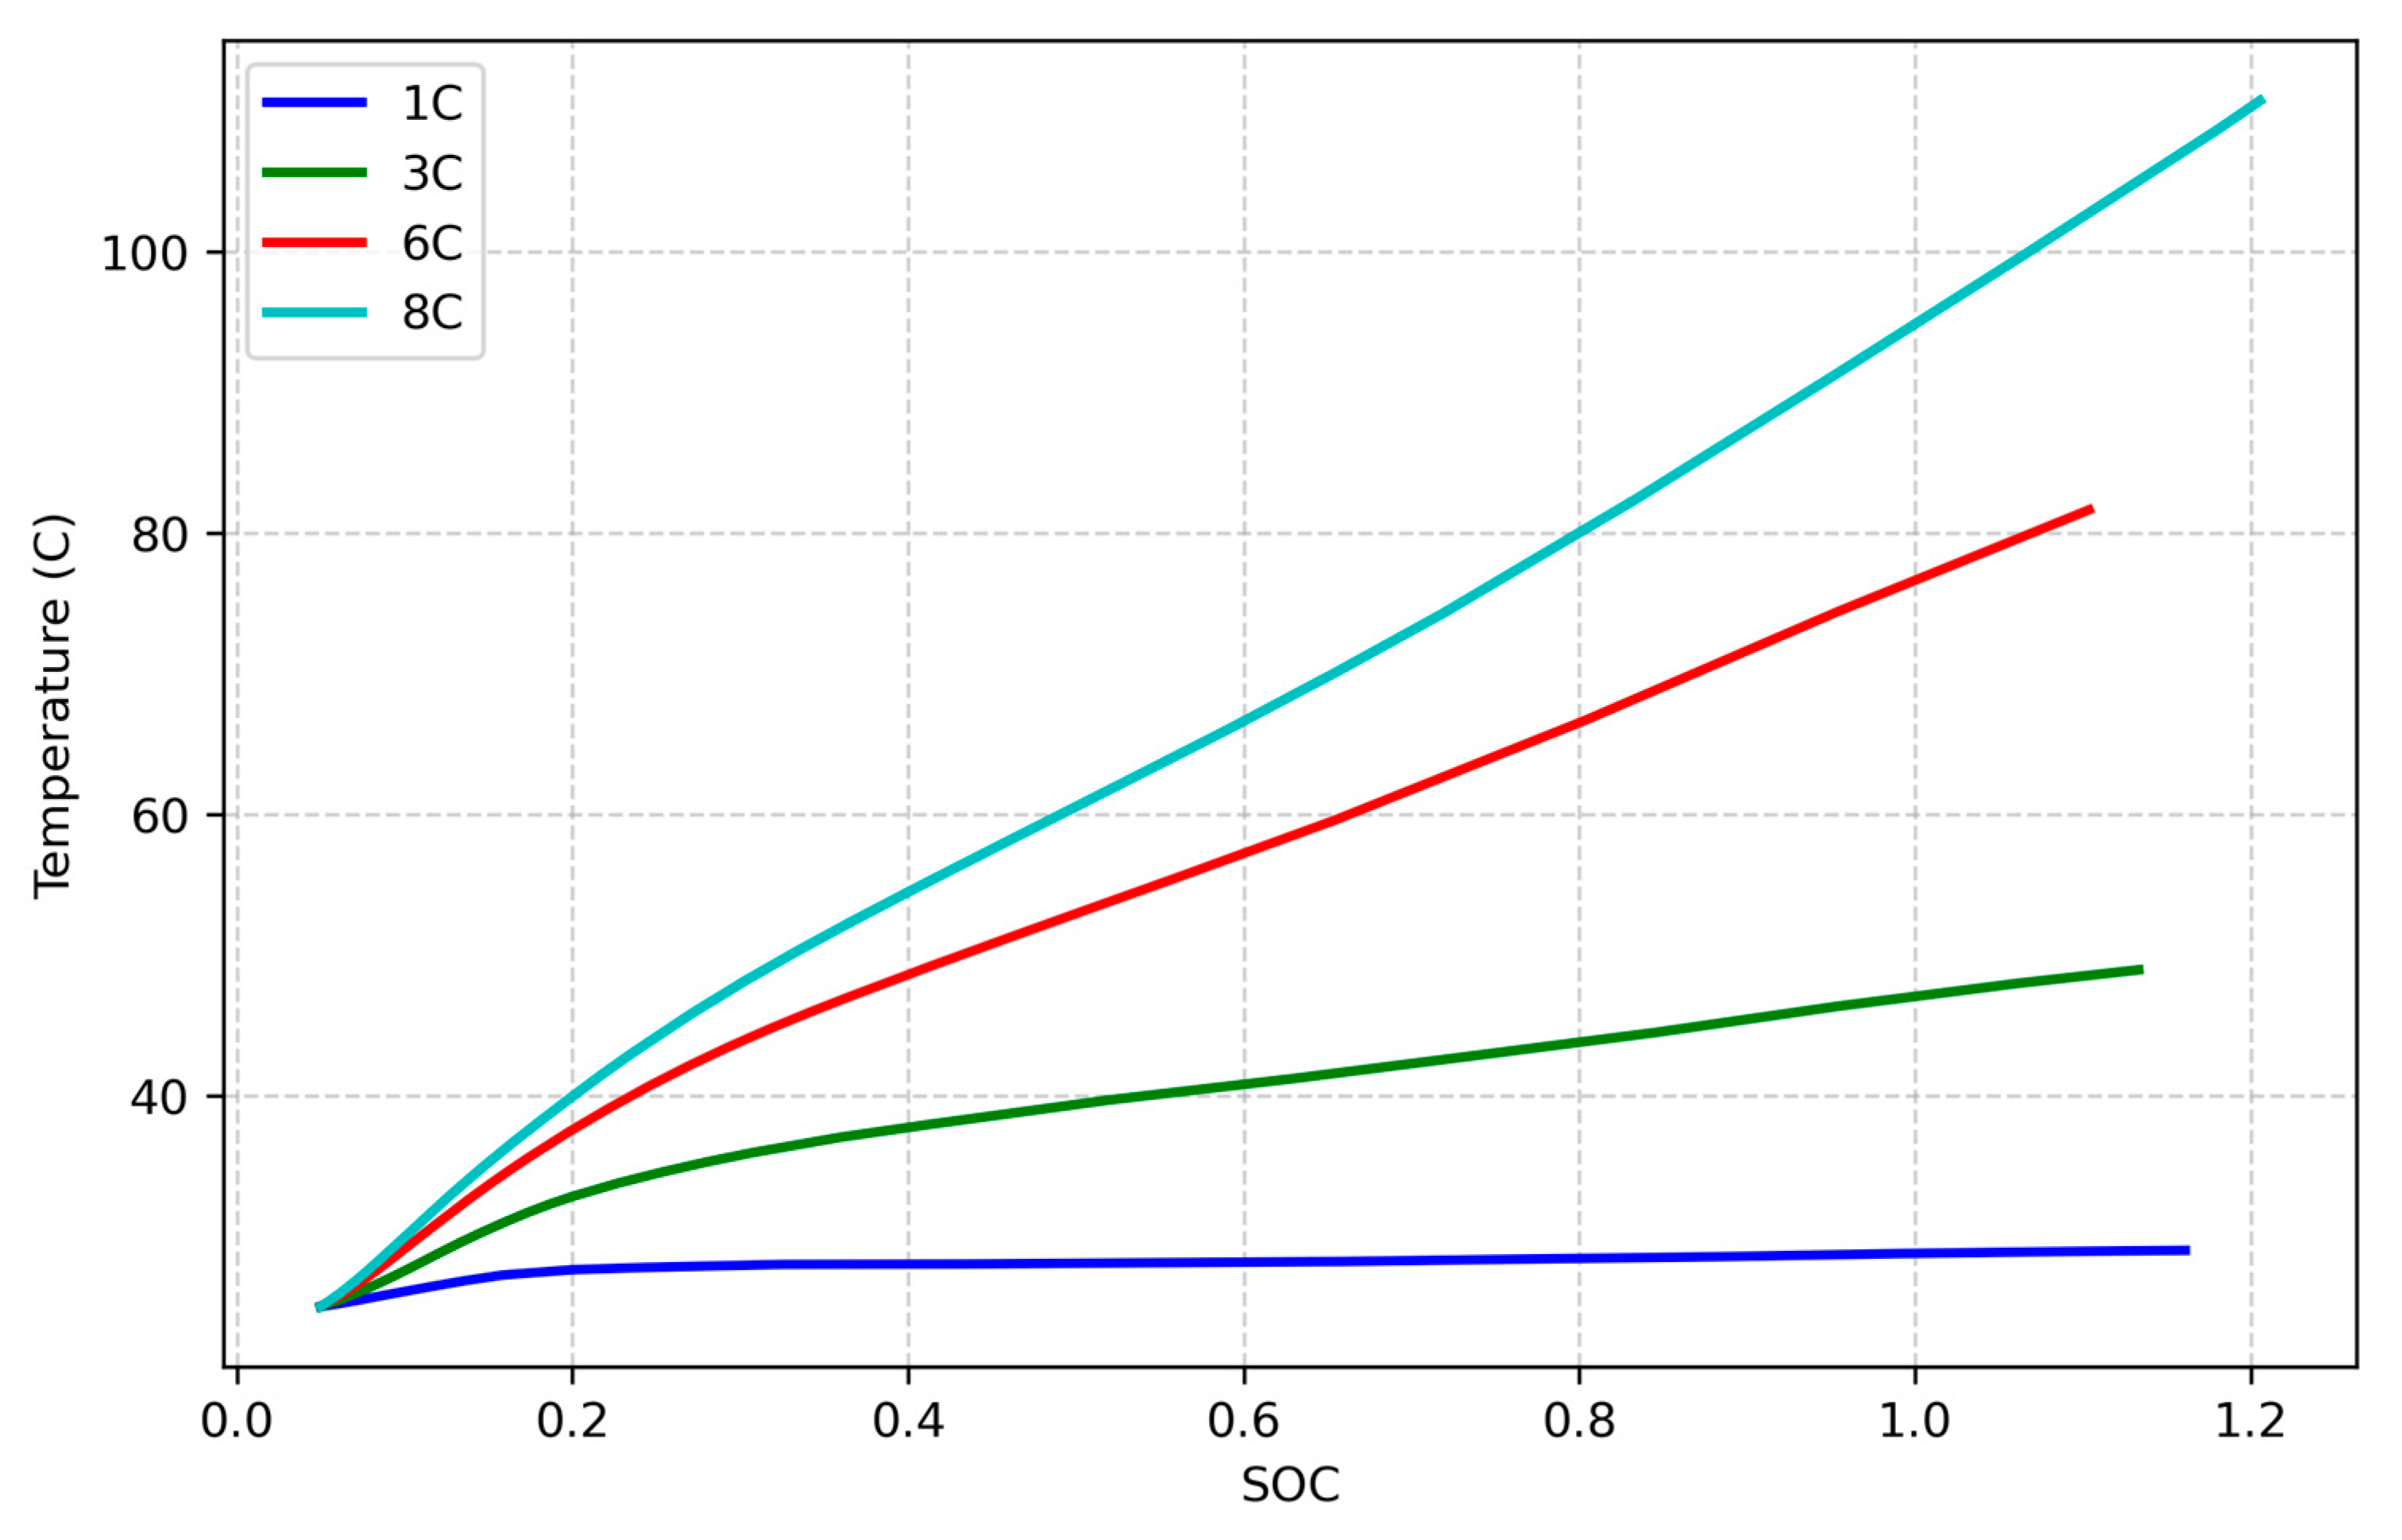
Figure 8 illustrates the temperature trends for four simulations with 1C, 3C, 6C, and 8C charging rates and fixed resistance and cell capacity. As shown, the charging rate has a significant impact on the temperature behavior of lithium-ion cells, with higher charging rates resulting in increased thermal effects. This trend is expected and aligns with the theoretical understanding of heat generation in electrochemical systems. As illustrated by Equation (13), the rate of heat generation is directly influenced by the charging current, which is multiplied by the internal overpotentials within the cell. These overpotentials, including both ohmic and reaction-related components, increase as the current rises, leading to greater irreversible heat production. Consequently, at higher charging rates, the cell experiences more intense thermal buildup, which can elevate the risk of thermal instability if not properly managed. This emphasizes the importance of thermal modeling and management, particularly in high-rate charging applications where temperature control is critical for both performance and safety.
3.2. Effect of Internal Resistance on Thermal Runaway
To examine the impact of internal resistance on thermal behavior, simulations were conducted on NMC cells with identical capacities (5 Ah) and charging rates (3C) and different internal resistances (10, 20, 30, and 40 mΩ).
Figure 9 shows the mean cell temperature (Average Cell Temperature) over time. The results reveal that a higher internal resistance correlates with increased cell temperature over the same time frame, leading to a higher likelihood of thermal runaway. This effect can be attributed to the additional heat generated by ohmic losses in the cell, and these findings agree with the results of Yoo et al. [
45]. Since the internal resistance increase is often associated with battery aging, this means that aged cells are progressively more prone to thermal runaway events due to their increased thermal sensitivity, which is opposite of the study of Fleischhammer et al. [
23] but in agreement with the study of Han et al. [
46].
3.3. Effect of Capacity on Thermal Runaway
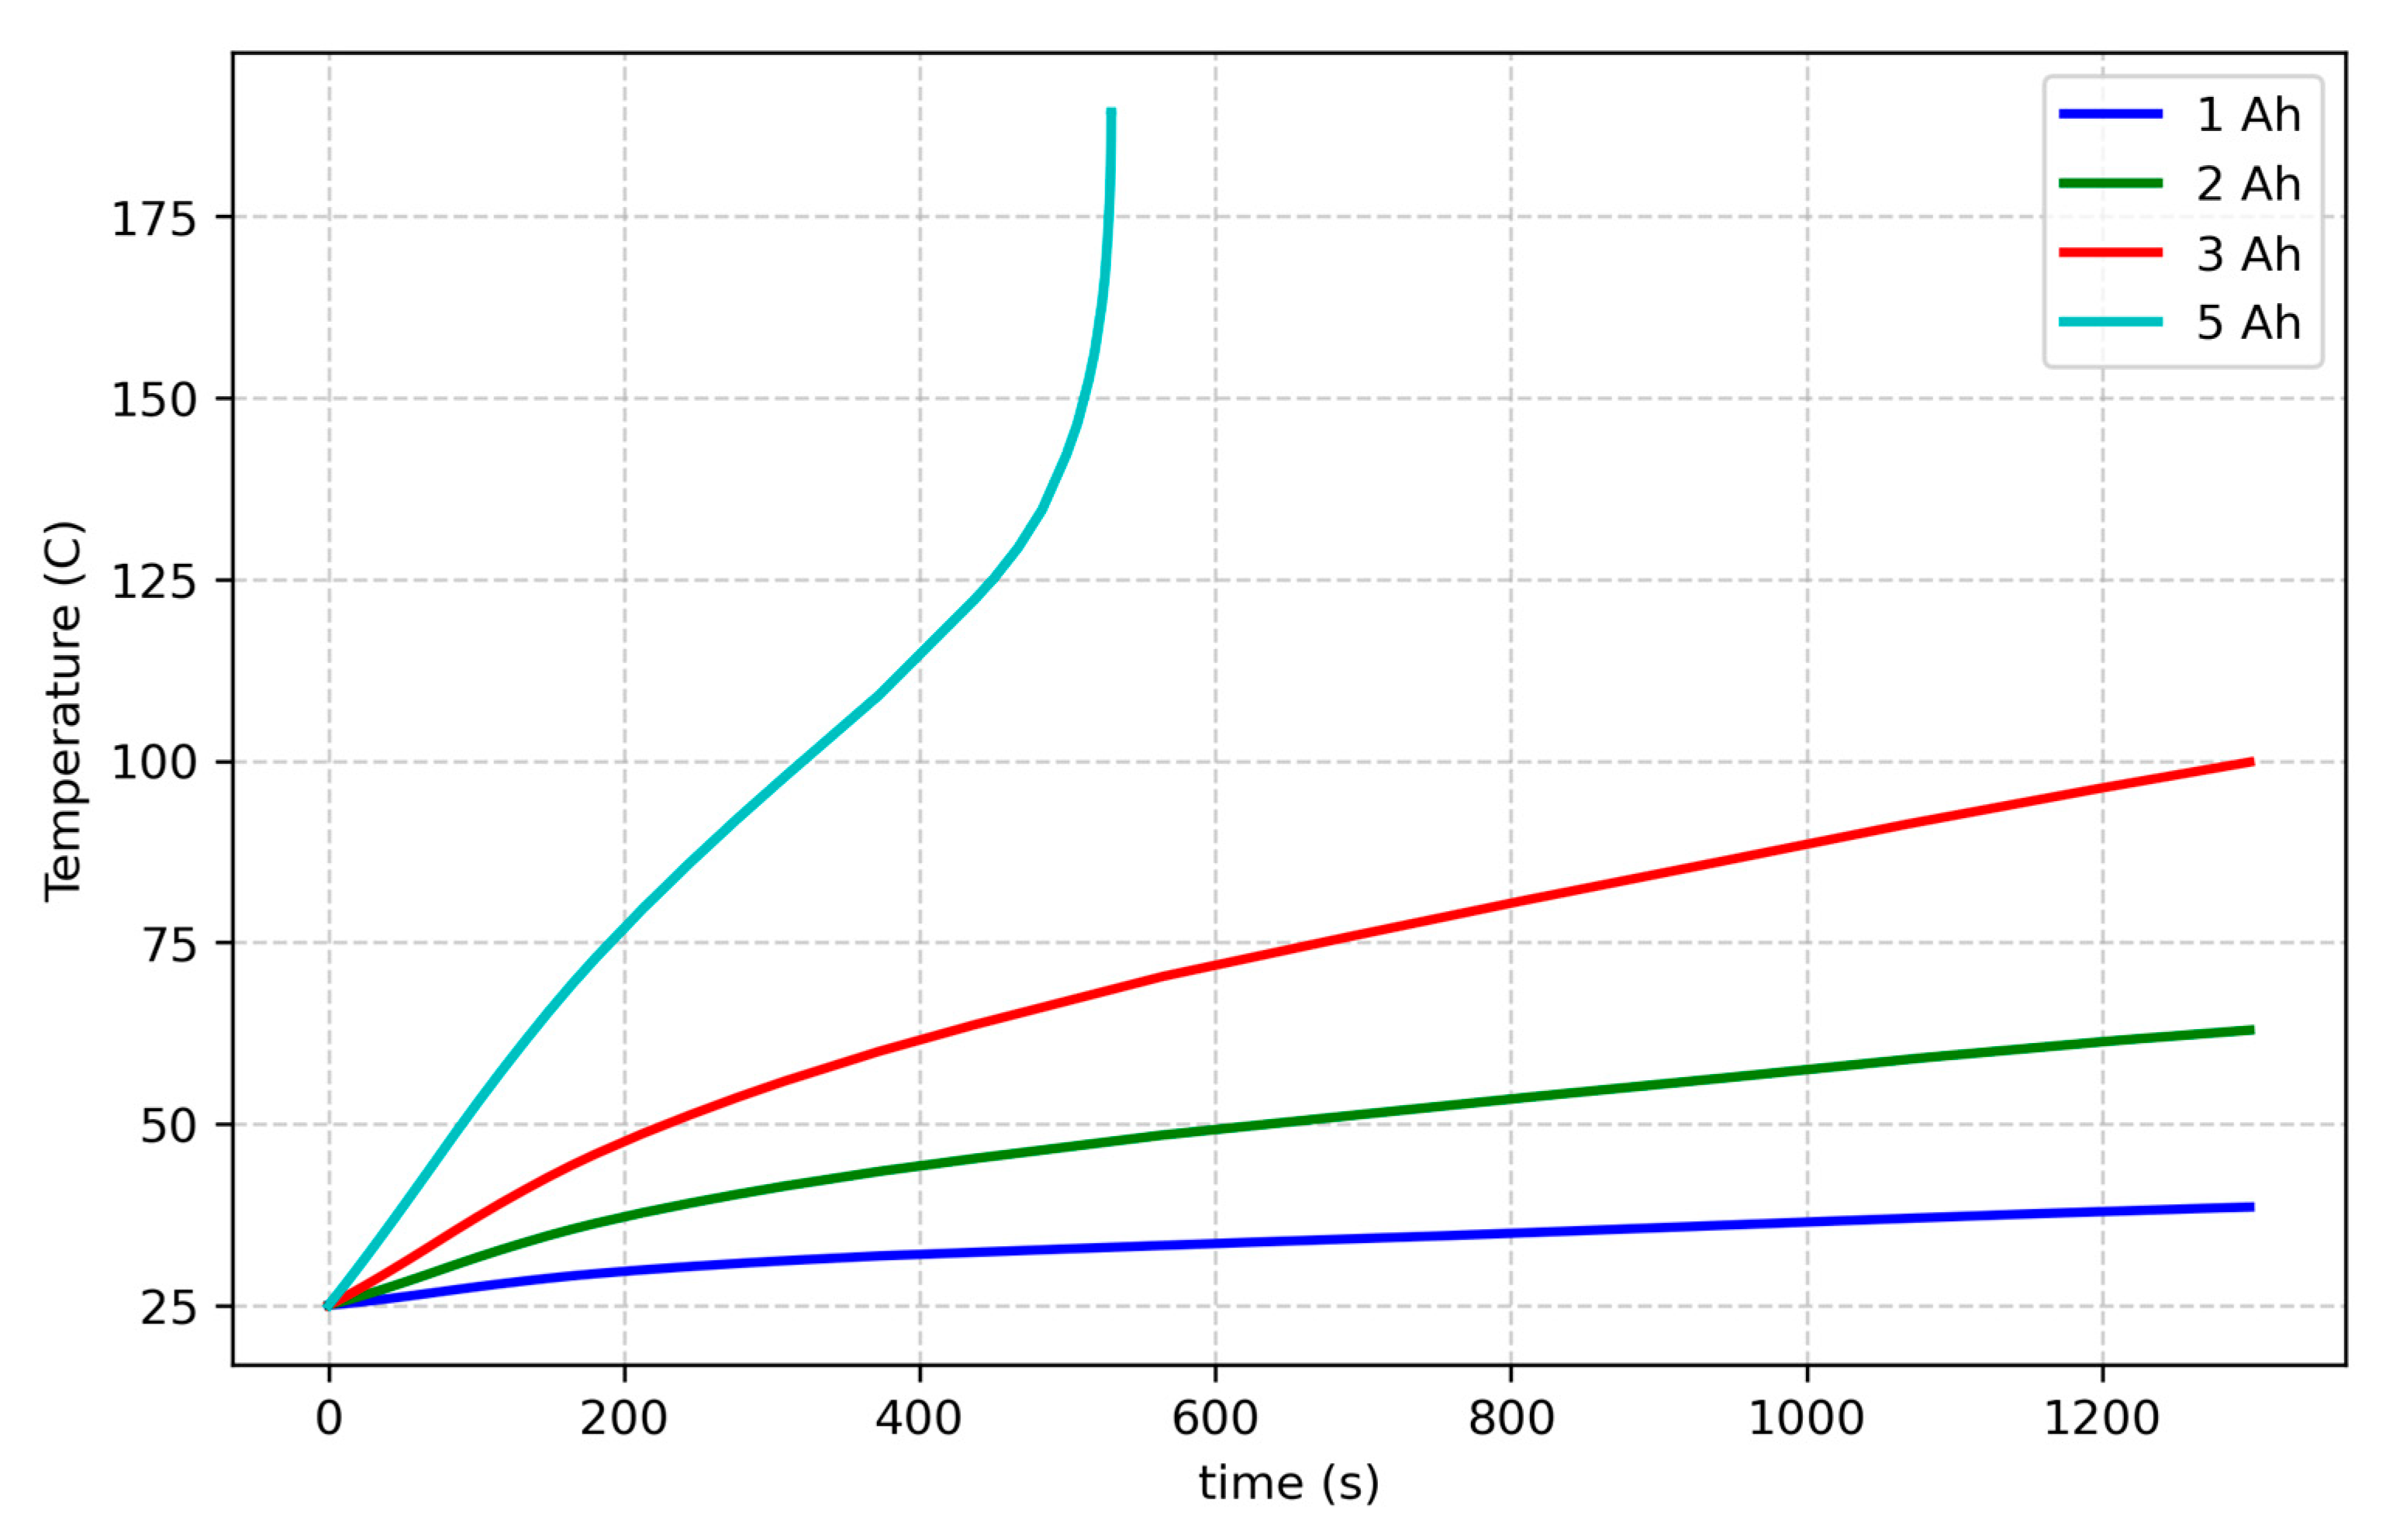
The influence of cell capacity on thermal behavior was analyzed by comparing simulations with capacities of 1, 2, 3, and 5 Ah under a fixed internal resistance (30 mΩ) and a charging rate 3C.
Figure 10 presents the temperature against time. The data indicate that higher capacity cells exhibit a more pronounced temperature rise with respect to lower capacity ones over a given SOC range, reflecting their greater energy content. Now, since a pronounced capacity fading is associated with cell aging, it derives that, from this point of view, the likelihood of a thermal runaway diminishes with age, along with reduced energy storage and associated thermal effects [
47], due to the lower temperature reached. However, this does not necessarily diminish the likelihood of thermal runaway because, as discussed in the previous section, aged cells often exhibit increased internal resistance, leading to greater heat generation during operation and, thus, to a higher risk of thermal runaway. Therefore, despite their reduced capacity, aged cells may still be more prone to thermal runaway due to increased heat generation from higher internal resistance.
3.4. Combined Aging Effects
Based on the above results, the two primary aging effects, capacity fade and increased internal resistance, have opposing impacts on thermal behavior:
To fully understand these interactions and their implications for battery safety, statistical analyses are essential for quantifying their combined influence on the thermal behavior of aged cells.
3.5. ANOVA Analysis
After performing all the simulations, the mean temperature of the cell, its SOC, and the voltage of the cell against time were recorded. The necessary results obtained from the simulation for the ANOVA are shown in
Table 4. This table presents data on battery thermal behavior across different test conditions, with a key focus on thermal runaway, temperature, and temperature change rate (dT/dt) at different states of charge (SOC). Run Order is the sequence in which the experiments were conducted, the thermal runaway column shows a binary indicator (0 = No thermal runaway, 1 = Thermal runaway occurred), and temperature and dT/dt at 10%, 50%, and 100% SOC reflect how the temperature and its rate of change evolve as the battery charges in a single charge phase. At 100% SOC, temperatures are often higher than at 50% and 10% SOC, which is expected as a fully charged battery generally has more stored energy to dissipate as heat. Starting from run 30, the first thermal runaway events are observed, where temperatures escalate drastically (e.g., Run 40: 169.5 °C at 100% SOC). In early runs (before thermal runaway events), dT/dt values remain low (mostly below 0.1 in different SOCs). However, once temperatures exceed certain thresholds, dT/dt rises steeply (e.g., Run 40: 2.374 at 100% SOC), indicating rapid heat generation and potential safety risks.
In cells that did not experience thermal runaway (TR = 0), the temperature at 10% SOC generally remained below approximately 34 °C. In contrast, cells that underwent thermal runaway (TR = 1) typically exhibited temperatures above 35 °C at 10% SOC, with some values reaching over 40 °C. This suggests that a temperature exceeding around 35 °C at 10% SOC could serve as an early warning signal. For non-runaway cases, the rate of temperature rise at 10% SOC was usually below 0.16 °C/s. However, in cells that experienced thermal runaway, this rate exceeded approximately 0.22 °C/s. Thus, a dT/dt greater than about 0.2 °C/s at low SOC may indicate an increased risk. While non-thermal runaway cells typically maintained temperatures below around 80 °C at 50% SOC, cells prone to thermal runaway showed significantly higher temperatures, often exceeding 80 °C and, in some cases, reaching 100 °C or more. This marked increase reinforces the idea that a 50% SOC temperature above 80 °C might be a critical threshold. In cells that do not experience thermal runaway (TR = 0), the temperature at 100% SOC remains very low (typically below 40 °C). By contrast, in cases where thermal runaway occurs (TR = 1), the temperature at 100% SOC is substantially higher, often exceeding 100 °C and, in some cases, reaching values well above 150 °C. This dramatic increase indicates that once the runaway process is triggered, the battery temperature can escalate rapidly. For non-runaway cells, the first derivative of temperature (dT/dt) at 100% SOC is close to zero, reflecting a stable thermal state. However, in runaway cases, this rate becomes markedly elevated (e.g., over 2 °C/s in some instances), which suggests that the temperature is rising very rapidly (another clear sign of thermal instability). Similarly, the second derivative (d2T/dt2) in non-runaway scenarios remains extremely small (on the order of 10⁻⁵ °C/s2), indicating that the rate of temperature change is not accelerating significantly. In contrast, when thermal runaway occurs, the second derivative increases substantially (for example, values around 0.4273 °C/s2), demonstrating a rapidly accelerating temperature rise. In some instances, a battery may reach 100% SOC without immediately triggering a thermal runaway. However, if charging continues beyond this point, the risk of thermal runaway becomes highly probable, particularly when the temperature and its acceleration (the second derivative, d2T/dt2) are significantly elevated. In contrast, a non-thermal runaway case such as Run 28 shows much lower values at 100% SOC (113.5 °C with dT/dt of 0.068 °C/s and d2T/dt2 of 0.0002 °C/s2), suggesting a stable thermal condition. Thus, even if a cell does not immediately experience runaway at 100% SOC, continued charging under conditions where both temperature and its acceleration are high can quickly push the battery into an unstable, runaway state.
It is important to note that these values are based on the specific dataset and experimental conditions represented in
Table 4, and further analysis across a broader range of conditions would be needed to generalize these thresholds.
Table 5 and
Table 6 present the analytical analysis and the regression model. The R
2 values provide insight into how well the model captures the variance in temperature and dT/dt at different states of charge (SOC). The highest R
2 (0.9621) for temperature at 10% SOC suggests that the model explains 96.2% of the variation in temperature at this charge level, demonstrating strong predictive accuracy. In contrast, the lowest R
2 (0.8205) for dT/dt at 50% SOC indicates that while the model still performs reasonably well, there is a greater degree of unexplained variability in the rate of temperature change at mid-range SOCs. Overall, the model effectively predicts temperature trends, though its accuracy in capturing dT/dt is comparatively lower.
The p-values for capacity are extremely low (p < 0.05, often much lower across different conditions), confirming that capacity has a strong and statistically significant impact on both temperature and dT/dt. Current also plays a significant role, with p-values < 0.05 in most cases, demonstrating its strong influence on thermal behavior. Internal resistance significantly influences temperature (p < 0.01 in most cases), and its coefficients are consistently positive, meaning that higher resistance leads to higher temperatures—a trend that aligns well with Joule heating principles. However, its effect on dT/dt is less consistent, suggesting that while internal resistance directly contributes to steady-state temperature rise, its impact on transient thermal behavior may be more complex and dependent on additional factors.
Notably, the coefficients for capacity and current are negative. However, the interaction between them is highly significant (p < 0.05 in all cases) and has a large coefficient, meaning their combined influence is critical in determining both temperature and dT/dt. This suggests that the relationship between capacity and current is not simply additive—rather, their combined influence plays a key role in determining overall thermal behavior. This highlights the importance of jointly managing capacity and current when optimizing thermal performance and ensuring battery safety rather than treating them as independent factors.
The interaction between capacity and internal resistance is also significant, though its effect size is smaller, indicating that while capacity influences resistance-driven heating, its effect is secondary compared to direct resistance contributions. Interestingly, the interaction between current and internal resistance shows no significant impact, suggesting that resistance-related heating is largely independent of current within the tested operating conditions. This finding implies that internal resistance effects may be more static and intrinsic to the cell’s electrochemical characteristics rather than dynamically varying with current load.
Overall, these findings highlight the complex interplay between capacity, current, and internal resistance in shaping battery thermal behavior. The insights gained from this analysis can aid in the development of more effective thermal management strategies, improve battery performance predictions, and enhance safety measures in high-energy applications.
3.6. Internal Resistance Threshold
Table 7 presents the computed values corresponding to Equation (21), which are essential for determining the internal resistance threshold. Additionally,
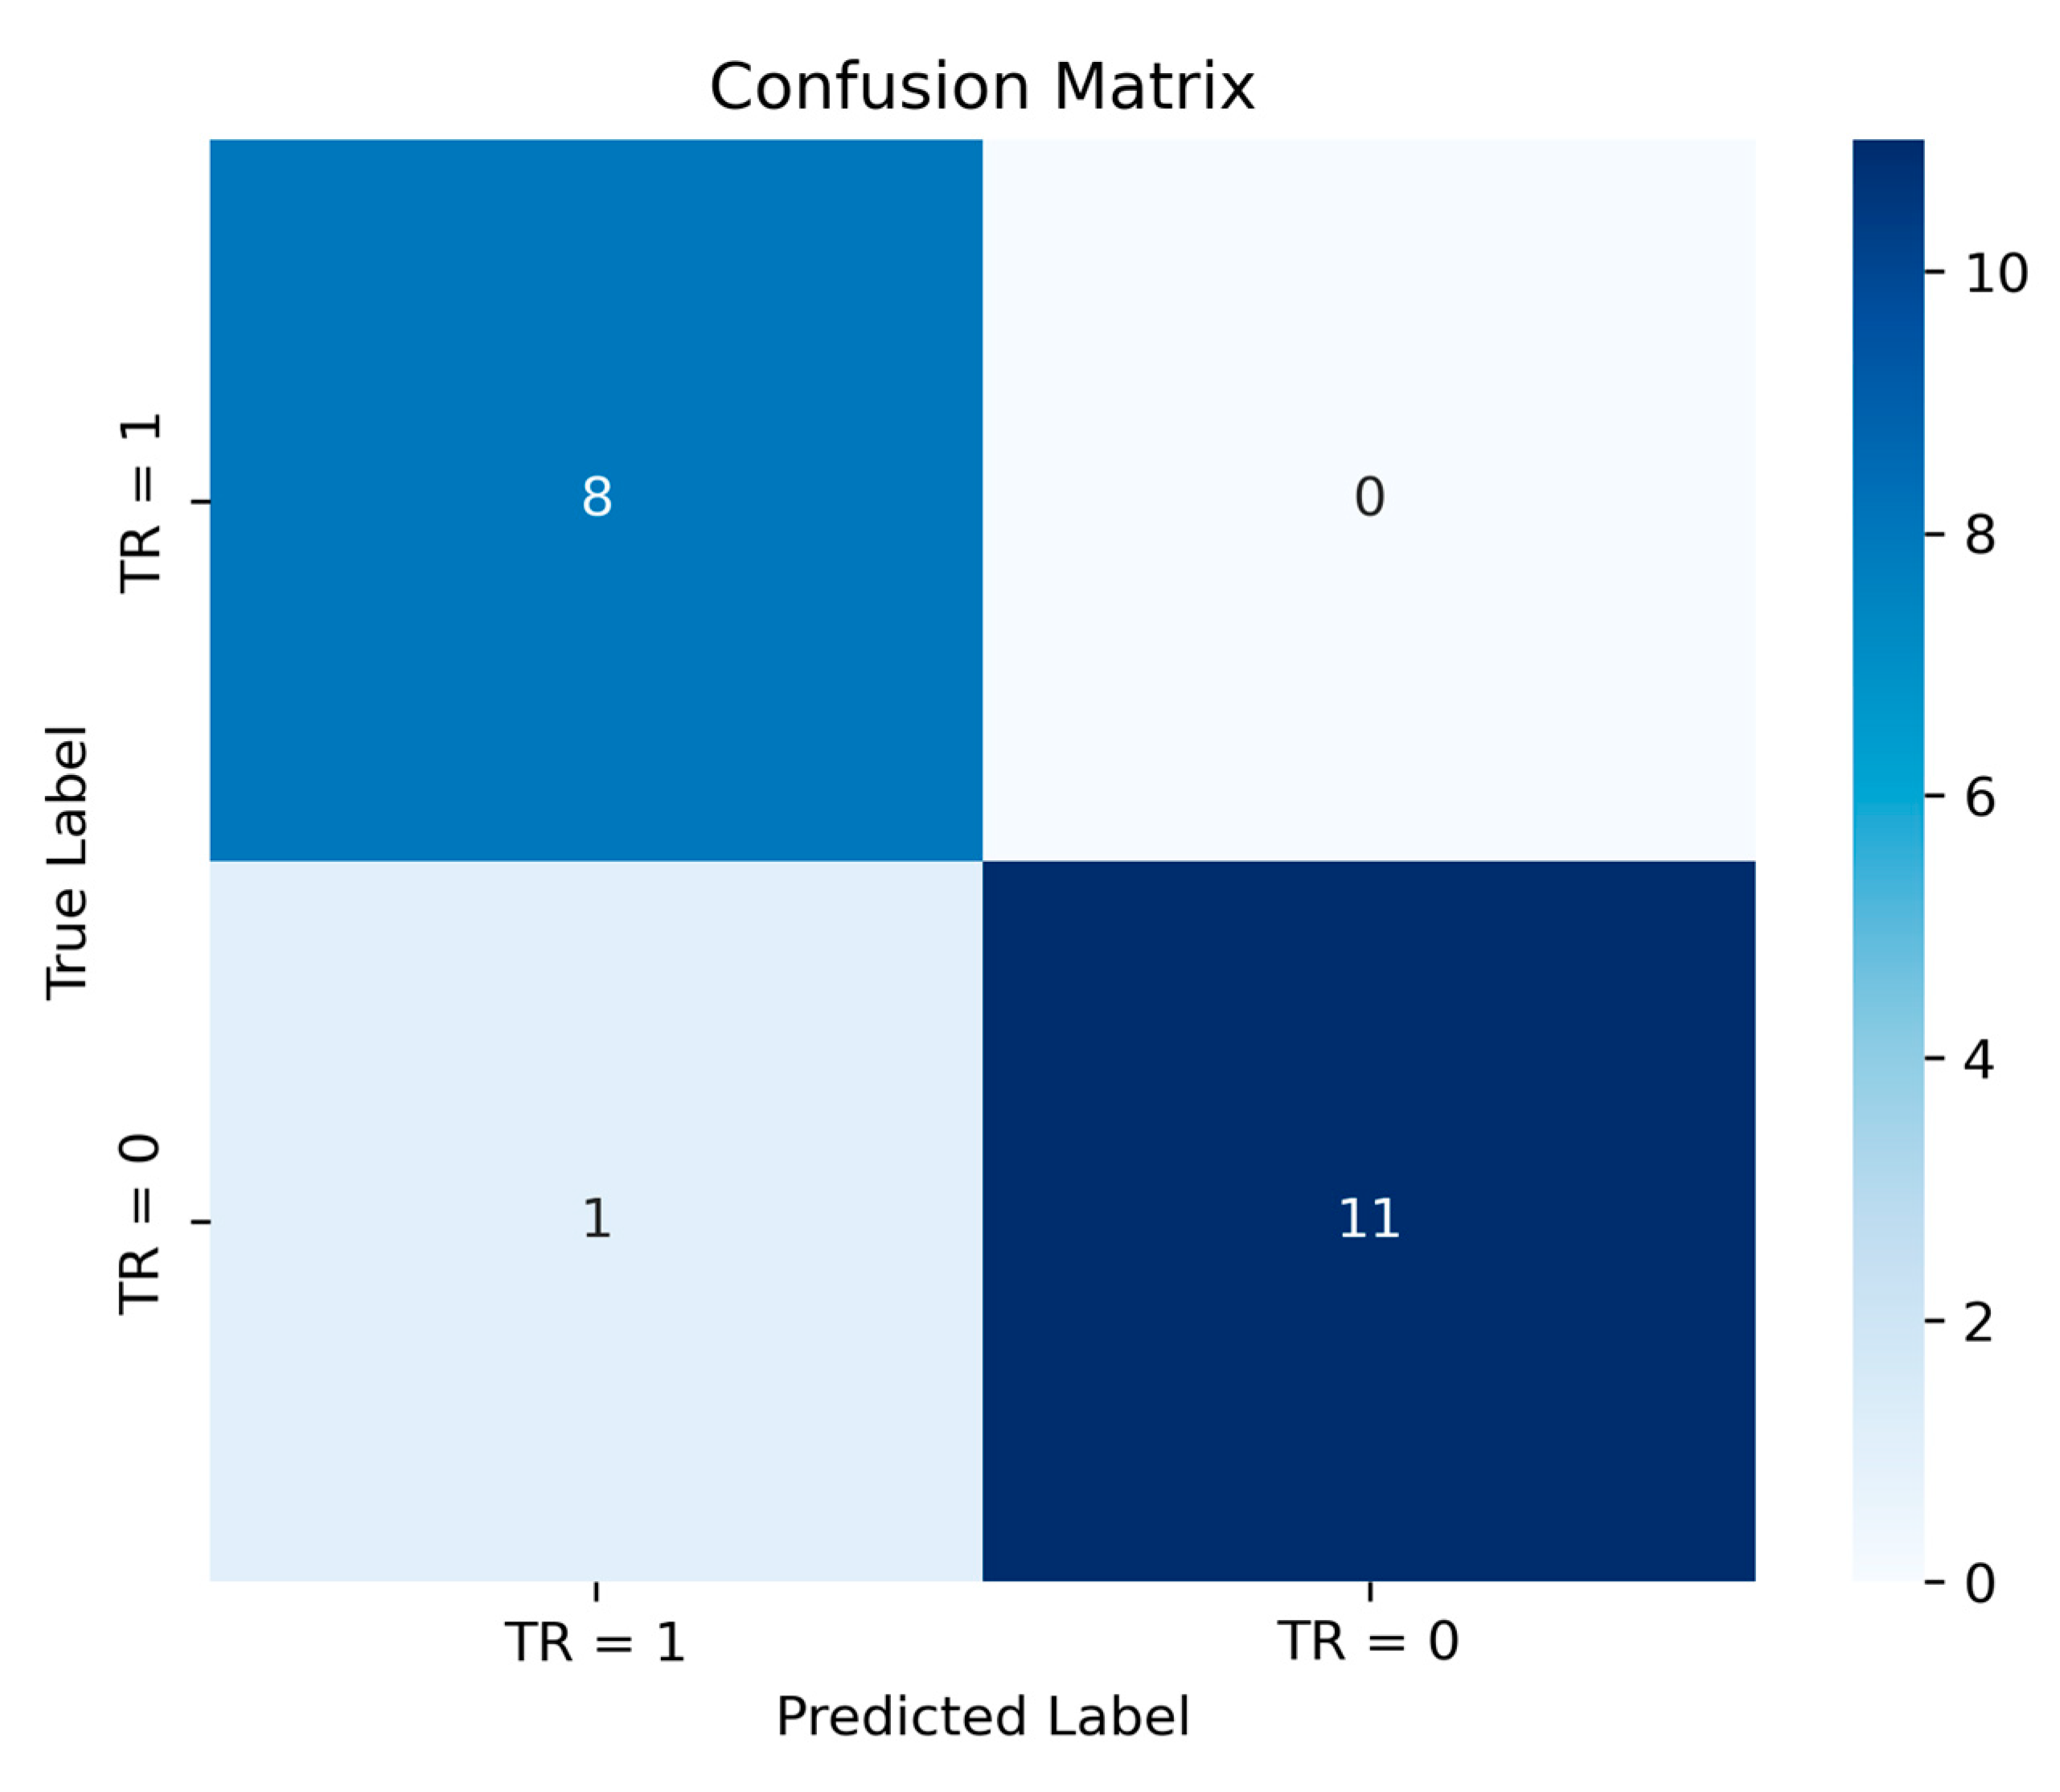
Figure 11 illustrates the confusion matrix for the classification task performed using the logistic regression model on the test set. The model demonstrates strong predictive performance, achieving an accuracy of 95%, indicating its reliability in distinguishing between thermal runaway and non-thermal runaway cases.
The confusion matrix represents the classification performance of the model, where rows indicate actual values and columns indicate predicted values. The top-left value (8) represents true positive (TP), meaning the model correctly predicted 8 cases where thermal runaway occurred. The top-right value (0) represents false positives (FP), indicating no incorrect predictions of thermal runaway when it did not actually happen. The bottom-left value (1) represents false negatives (FN), meaning one case of not thermal runaway classified as thermal runaway. Lastly, the bottom-right value (11) represents true negatives (TN), where the model correctly identified 11 instances of not thermal runaway. From the figure, it can be concluded that the model performs well in terms of avoiding risks, i.e., it never ensures a lack of a thermal runaway when it actually occurs. By leveraging the proposed logistic regression model, the internal resistance threshold can be determined by fixing the charging current, capacity of the cell, and probability of thermal runaway occurrence. This approach allows for precise identification of the critical resistance value beyond which the likelihood of thermal runaway significantly increases. The results obtained from this analysis can be instrumental in enhancing battery safety, enabling proactive measures such as real-time monitoring, thermal management, and early fault detection.
4. Conclusions
One of the most critical safety hazards connected with lithium-ion batteries is thermal runaway. While mechanical abuse is often unpredictable, other types of failures are frequently caused by system faults. Battery aging is a key contributor to such failures, as it reduces thermal stability and decreases a cell’s ability to tolerate faults.
To investigate how aging impacts the thermal sensitivity of lithium-ion cells, this study focused on three key parameters: capacity, internal resistance, and current. A thermal model was developed to incorporate internal resistance as a proxy for aging and thermal runaway side reactions.
The results demonstrate that the interaction between capacity, internal resistance, and charging rate significantly influences thermal behavior and the likelihood of thermal runaway. At low charging rates (1C), cells with higher internal resistance exhibit increased temperature rise, particularly in high-capacity cells. In contrast, low-capacity cells show minimal temperature deviations due to their lower energy density. As the charging rate increases, heat generation intensifies, with several high-capacity simulations exceeding the critical 90 °C threshold, a known precursor to thermal runaway. Notably, cells with both high capacity and high internal resistance experience the most severe temperature spikes, indicating a compounded effect of Joule heating.
A statistical analysis confirmed that capacity, current, and internal resistance are major determinants of battery thermal behavior. Capacity has a significant impact on temperature rise and dT/dt, while current plays a crucial role in heat generation. Internal resistance is strongly correlated with temperature increase due to Joule heating, though its effect on dT/dt is less predictable. A key finding is that the interaction between capacity and current is highly significant, meaning their combined influence is nonlinear. In contrast, the interaction between current and internal resistance was found to be negligible, suggesting that resistance-related heating remains relatively independent of applied current within the tested range. These insights reinforce the importance of an integrated thermal management strategy, particularly in aged batteries where resistance and capacity degrade at different rates.
A machine learning approach was also adopted to classify thermal runaway events based on battery conditions. This approach holds promise for real-time battery monitoring and early failure detection and offers potential applications in BMS algorithms for enhancing battery safety and longevity.
However, battery aging is a complex phenomenon that, besides the internal resistance, also affects other parameters like active material composition, thermal conductivity, and heat generation. Therefore, additional work is required to integrate these aging mechanisms into a more comprehensive model for a more accurate representation of aged battery behavior. Doing so will improve predictive capabilities, enhance thermal management strategies, and ultimately ensure safer battery operation in real-world applications.
