Article

Evaluation of Lithium Battery Cycle Aging Based on Temperature Increase During Charging

School of Mechanical and Automotive Engineering, Xiamen University of Technology, Xiamen 361000, China
*
Author to whom correspondence should be addressed.
Batteries 2025, 11(4), 150; https://doi.org/10.3390/batteries11040150
Submission received: 19 March 2025 / Revised: 9 April 2025 / Accepted: 10 April 2025 / Published: 10 April 2025

Abstract

:
This study investigates the temperature increase characteristics of lithium-ion batteries under various states of health (SOHs) and proposes an aging assessment method based on temperature increase. The analysis of experimental data reveals that temperature increase behavior varies across different locations on the battery, particularly at the center of its large surface area, as the battery ages. This study demonstrates that monitoring surface temperature increase can serve as an effective method for rapid SOH assessment and provides insights into performance degradation and electrode aging. Furthermore, this approach enables the preliminary diagnosis of battery health by tracking temperature changes, without requiring complex equipment, making it highly practical and suitable for widespread application. In addition, this study discusses the potential impact of lithium plating on temperature increase characteristics and its implications for battery safety.

1. Introduction

In recent years, the global new energy vehicle industry has experienced rapid growth. Lithium-ion batteries, as the primary power source for these vehicles, have become a leading technology due to their high energy density, lightweight construction, and long lifespan [1], driving significant market demand. The fundamental operating principle of lithium-ion batteries involves the intercalation and deintercalation of lithium ions to store and release energy. As a key component in new energy vehicles, power batteries have a substantial impact on vehicle driving range, charging speed, and safety. Compared to traditional lead-acid and nickel-metal hydride batteries, lithium-ion batteries offer a higher energy density and a longer service life. However, during prolonged use, these batteries experience aging, which manifests as capacity degradation, increased internal resistance, and challenges in thermal management. Over time, the performance and internal structure of batteries degrade due to factors such as the loss of active lithium, the structural degradation of electrode materials, and electrolyte decomposition [2,3].
In lithium-ion battery aging research, scholars worldwide have primarily focused on capacity degradation, internal resistance growth, and thermal effects. Recent studies have shown that the loss of active lithium during cycling is a primary cause of rapid capacity decline [4], while electrolyte decomposition and the formation of by-products exacerbates the instability of internal electrochemical reactions [5]. Additionally, lithium plating and the formation of lithium dendrites present significant safety risks during the aging process [6].
Research on the thermal effects of lithium-ion batteries has primarily concentrated on the impact of temperature on electrochemical reaction rates and material stability [7], with particular attention given to the risk of thermal runaway under conditions such as overcharging, over-discharging, and high-rate charging/discharging [8,9,10]. There also exists temperature non-uniformity within the battery under different ambient temperatures and discharge rates [11]. Both the maximum temperature and the maximum temperature difference within the battery module increase rapidly as the discharge rate rises [12,13]. Altering the medium can make the battery temperature more adaptable to the environment, but it will render the battery temperature more non-uniform [14]. The development of thermal models to predict the internal temperature distribution of batteries [15] has become a major focus of current research.
To address these issues, various thermal models have been proposed to predict internal temperature distribution and assess battery thermal behavior [16]. However, most models rely on complex numerical simulations, empirical fitting, or electrochemical impedance spectroscopy (EIS) [17,18,19]. While these studies have provided insights, most research analyzes capacity degradation, internal resistance growth, and temperature characteristics separately but rarely investigates the interactions between these factors. Furthermore, traditional battery aging assessments typically rely on a single indicator [20], such as voltage decay or impedance increase, which may not adequately reflect the complex nature of battery degradation. Therefore, investigating the surface temperature changes in ternary lithium-ion batteries during aging and analyzing the characteristics of lithium plating within the batteries are crucial for enhancing performance and extending their service life.
To address these challenges, this study proposes a temperature-based aging assessment method that correlates temperature increase behavior with lithium plating characteristics and overall battery degradation. By analyzing surface temperature variations at different locations during the charging process, this method aims to provide a more comprehensive aging diagnostic framework. Compared to traditional electrochemical techniques, surface temperature monitoring offers a non-invasive, real-time, and cost-effective diagnostic approach. This study focuses on ternary pouch lithium-ion batteries, investigating their aging characteristics and the evolution of the negative electrode interface under various states of health (SOHs). The findings of the present study offer valuable insights that can facilitate more informed and effective strategies for the selection, classification, and grouping of reused lithium-ion batteries. By providing a clearer understanding of battery performance characteristics and degradation patterns, this research contributes to the development of standardized protocols that enhance the safety, efficiency, and reliability of second-life battery applications.

2. Methodology

2.1. Experimental Subject

The experiment utilized a high-energy-density ternary pouch lithium-ion battery from a specific manufacturer. The cathode material was NCM622, the anode material was graphite, and the battery structure was laminated. The battery had a rated capacity of 2.1 Ah. The charge rates referenced throughout this paper are based on this rated capacity, with a 1 C rate corresponding to a current of 2.1 A. The detailed performance parameters of the battery are provided in Table 1.

2.2. Experimental Content and Procedures

The battery underwent charge–discharge cycles at a fixed rate to induce accelerated aging. Due to the large number of cycles and the extensive data generated during the aging process, test data from the lithium-ion battery at 100%, 90%, and 80% SOHs were selected for analysis.
To ensure the reliability of the temperature–SOH relationship, all experiments were conducted in a controlled environment with a constant ambient temperature of 25 °C. The battery was placed in a KOMEG ET-403R thermal chamber, which provided precise temperature control (±0.5 °C) and minimized the influence of external temperature fluctuations. Each test step was conducted only after the overall temperature of the battery had stabilized. The direct-current internal resistance (DCIR) of the battery was measured at 100%, 90%, and 80% SOHs. Finally, the battery was disassembled at various SOH levels to examine the surface morphology changes in the anode electrode. Throughout the experiment, temperatures at different locations on the battery were continuously monitored to accurately capture the thermal characteristics. The overall testing setup is shown in Figure 1.

2.2.1. Cycle Life Aging Test

During the experiment, a charge rate of 1.8 C was selected to cycle the battery from 0% to 100% state of charge (SOC), with the aim of aging the battery and inducing performance degradation. Although a 1.8 C rate is not considered high for ternary lithium-ion batteries, it ensured the stability of the charging process and allowed for continuous temperature data recording throughout the experiment, facilitating the smooth completion of the testing. This charge rate was chosen to strike a balance between experimental conditions and the simulation accuracy of the charging process.
The battery underwent charge–discharge testing using a Land G340A precision battery tester (Wuhan LAND Electronic Co., Ltd., Wuhan, China). A constant-current–constant-voltage charging method was applied at a 1.8 C rate, with a constant voltage of 4.35 V. The charging process was terminated when the charging current dropped to ≤0.05 C. After a resting period, the battery was discharged at a 1 C rate until the terminal voltage reached ≤2.75 V. This cycle was repeated to induce battery aging. The specific procedure and parameters are outlined in Table 2.
During the testing process, parameters such as battery voltage, current, capacity, and time were recorded. Battery aging was induced through charge–discharge cycles, which resulted in a reduction in the usable capacity of the lithium-ion battery under testing. The testing continued until the SOH of the battery reached 90% and 80%, at which point subsequent tests were conducted.

2.2.2. DCIR Test

The DCIR of the battery was measured at 100%, 90%, and 80% SOHs using the hybrid-pulse power characterization (HPPC) test method [21]. This method was employed to determine the relationship between the ohmic resistance and the polarization resistance of the battery as a function of the SOC. The SOC range for the test was set from 5% to 95%, with pulse tests conducted at 5% SOC intervals. The specific test steps are outlined in Table 3.
The DCIR at different rates was measured using pulse testing. Figure 2 illustrates the voltage and current curves for one such pulse.
The DCIR during the charge–discharge processes of the battery was calculated using Equations (1)–(3).
R 1 = U 2 U 1 I c
R 2 = U 3 U 2 I c
D C I R c = R 1 + R 2
where R1 represents the ohmic resistance during charging, R2 denotes the polarization resistance during charging, U1 is the voltage during the resting phase, U2 is the voltage at the beginning of the pulse charging, U3 is the voltage at the end of the pulse charging, and Ic represents the pulse charging current [22].

2.2.3. Temperature Distribution Test at Different Locations

Temperature data were collected using NTC temperature sensors from Huagong Gaoli (accuracy: ±1%, resolution: 0.01 °C). The sensors were attached to specific locations on the battery casing: the positive terminal, the side, the center of the surface, and the negative terminal. Temperature changes during the charging process were recorded at a sampling frequency of 1 Hz using a Ganna data acquisition device. The positions of the NTC sensors on the pouch battery, after calibration, are shown in Figure 3.
Additionally, the NTC thermistor was checked for accuracy before each experiment to ensure measurement consistency.

2.2.4. Battery Disassembly

After completing all tests, the battery was charged to 100% SOC at a relatively low rate of 0.33 C to ensure that lithium ions were fully embedded in the anode material. The disassembly process was carried out in a low-humidity glove box filled with inert gas. The aluminum casing of the battery was carefully cut open using ceramic scissors, and the internal anode and cathode electrodes were extracted and separated to prevent short circuits. The anode electrode was thoroughly washed with an electrolyte solvent to remove residual electrolyte and impurities from its surface. The integrity, flatness, and color changes in the anode electrode were observed. In the low-humidity environment, samples were cut from different locations for microscopic examination. The sample electrodes were affixed to a pin stub using double-sided carbon tape and placed into a 9-hole sample holder, as shown in Figure 4. A Zeiss GeminiSEM 300 (Carl Zeiss AG, Oberkochen, Germany) Scanning Electron Microscope (SEM) was used to capture electron images at a magnification of 20,000× [23], providing detailed surface morphology of the electrode.

3. Results and Discussion

3.1. Impact of Cycle Aging on Battery Performance

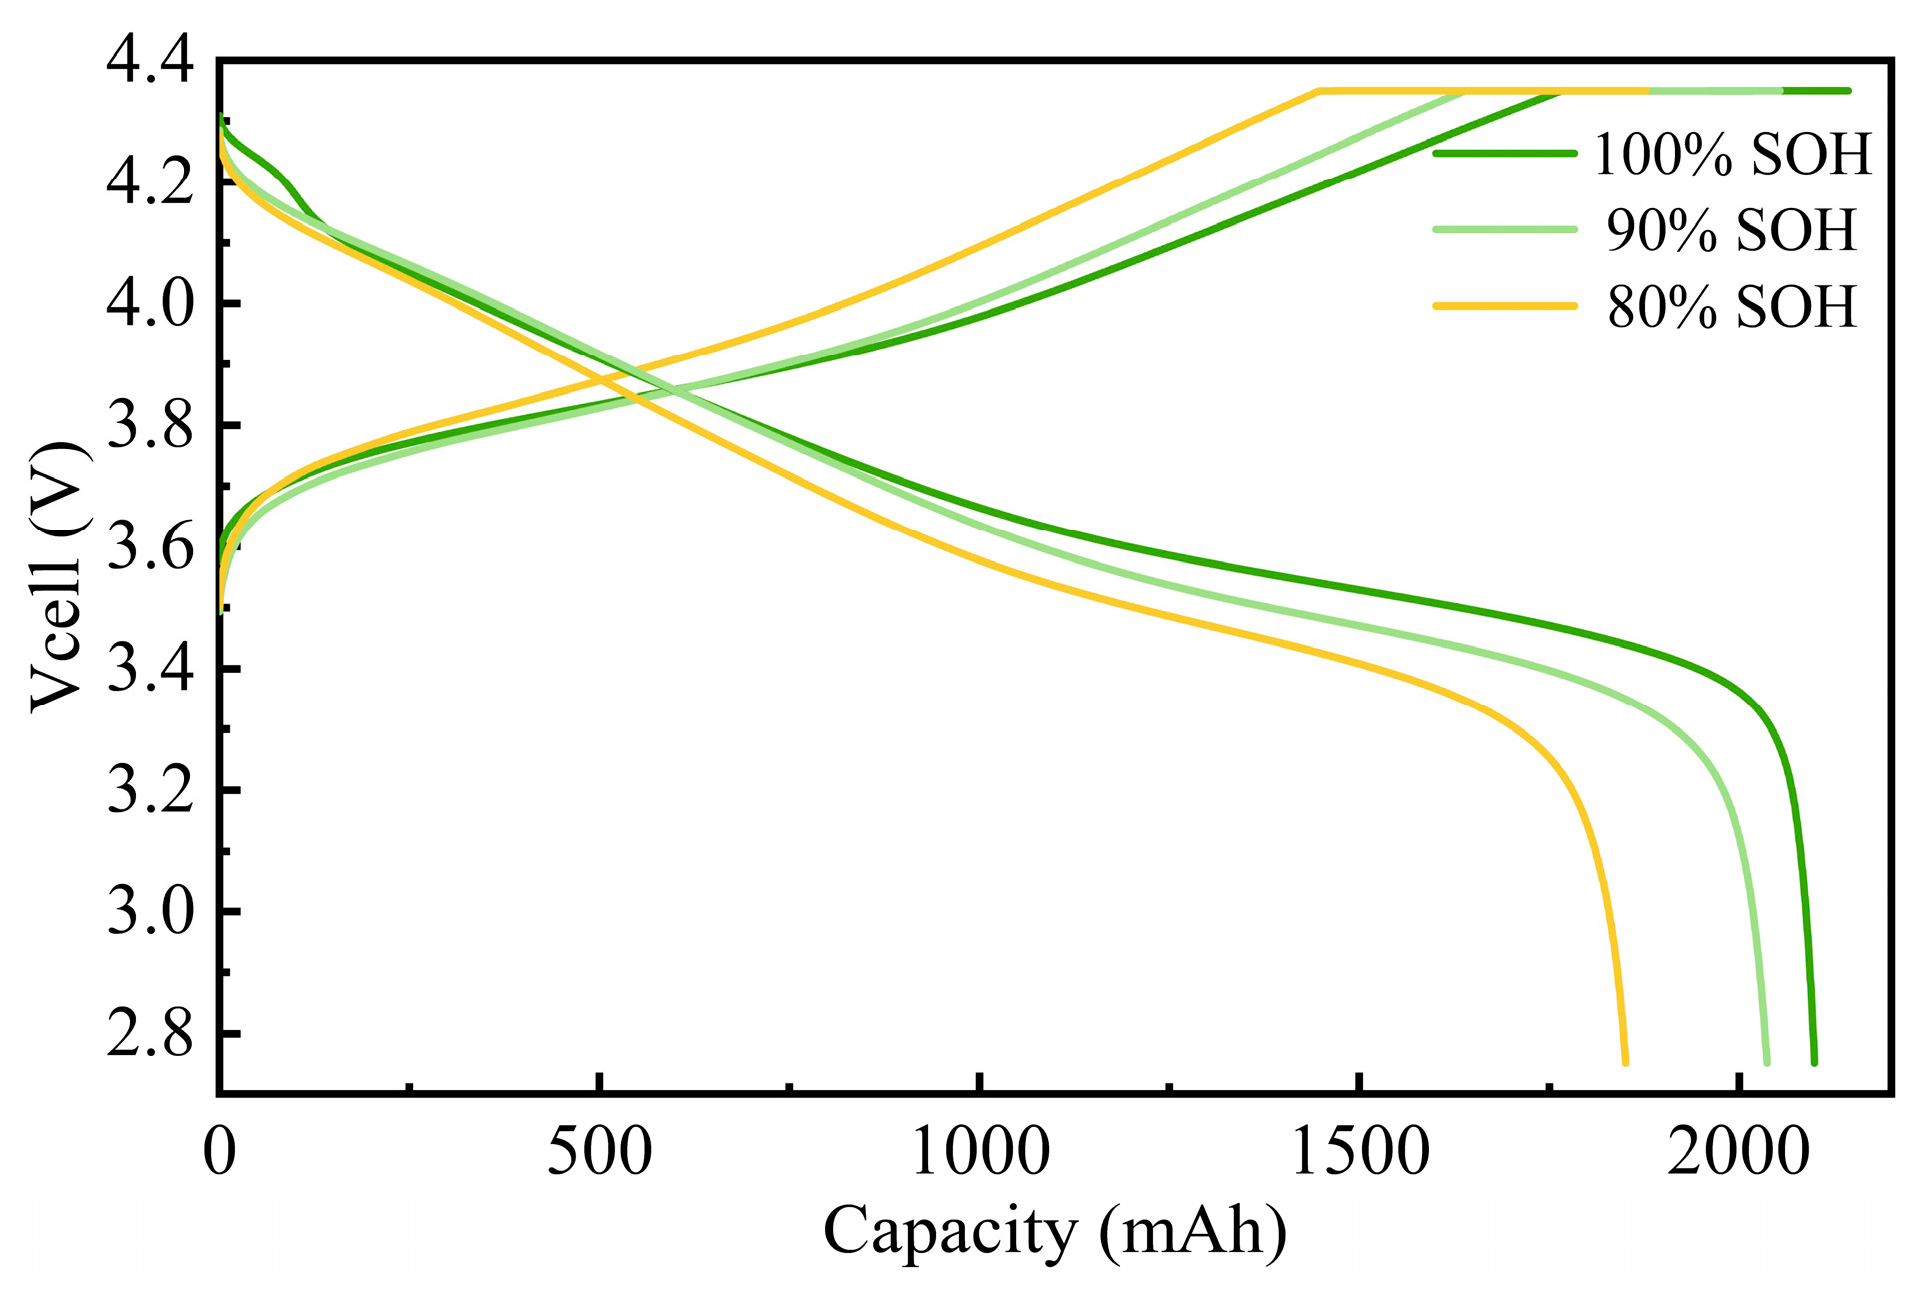
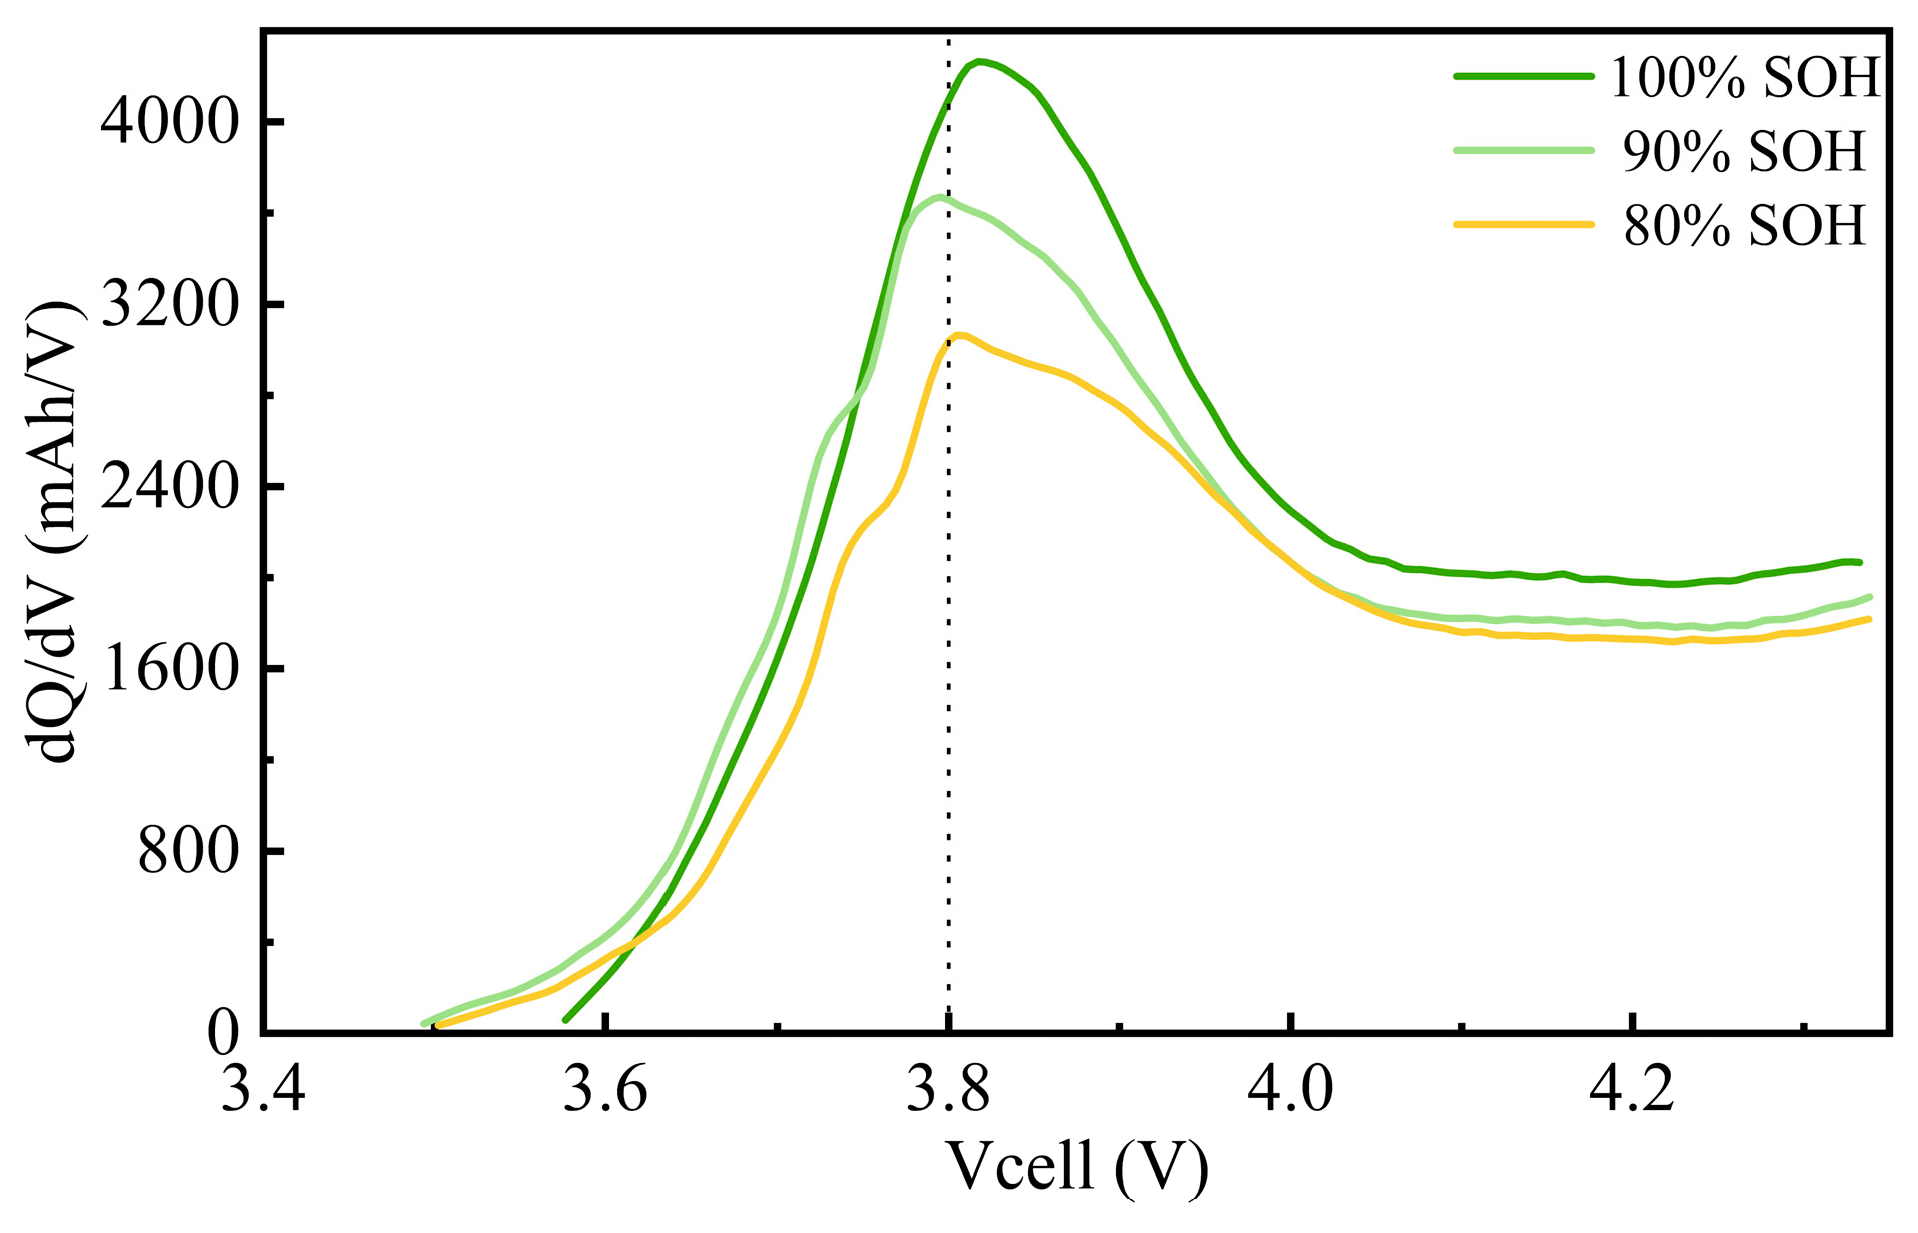
3.1.1. Changes in Charge–Discharge Performance

The maximum capacity retention rate of the test battery during the cyclic aging process at a 1.8 C charging rate is shown in Figure 5. In the initial stages of cycling, the maximum capacity retention rate remained high, with a slight increase in capacity observed after the first few cycles. In the middle phase of cycling, the retention rate gradually declined, exhibiting a smooth linear downward trend. After surpassing 40 cycles, the rate of decline in capacity retention accelerated, becoming particularly pronounced as it approached 60 cycles.
In the initial phase of cycling, the reduction in electrode interface inhomogeneity or localized high-impedance regions decreased battery polarization, thus increasing the available capacity [24,25]. This initial increase in capacity is typically temporary.
The charge–discharge voltage curves at 100%, 90%, and 80% SOHs are shown in Figure 6. These voltage curves reveal that, during the initial stage of charging, the voltage rises rapidly. In the middle section of the charging curve, the voltage increase slows, indicating that most of the capacity is charged during this phase. When the voltage quickly reaches 4.35 V, the constant-current phase ends, and the constant-voltage charging phase begins. During this phase, the charging current gradually decreases until the battery is fully charged, preventing overcharging and potential damage [26]. At 100% SOH, the battery enters the constant-voltage phase at 82.4% SOC. At 90% SOH, this transition occurs at 79.9% SOC, and at 80% SOH, it occurs at 77.2% SOC.
As the SOH decreases, the charge–discharge characteristics exhibit a reduction in capacity and a rapid decay in voltage. The voltage curves shift left and become steeper, primarily due to chemical degradation, loss of active materials, increased polarization, and rising internal resistance experienced during battery use. The reduction in active materials or structural changes in the electrodes makes the battery less capable of storing and releasing energy.
The differential capacity curves at different SOH levels (100%, 90%, and 80%) are shown in Figure 7. In lithium plating studies, a common criterion for identifying lithium plating is the observation of peaks in the voltage or current curves during the plating process [27]. However, due to the use of a 1.8 C charging rate, the electrochemical phase transition reactions within the battery were incomplete [28], and the high rate prevented the clear representation of lithium intercalation and deintercalation on the anode [29]. As a result, typical lithium plating peaks were not evident. The figure shows that, as the SOH decreases from 100% to 90% and 80%, the height of the peaks significantly decreases. This indicates a gradual reduction in the available capacity of the battery within the same voltage range. The primary causes of this include the gradual loss of active materials during long-term cycling, side reactions on the electrode surface, electrolyte decomposition, and thickening of the solid electrolyte interphase (SEI) layer, all of which reduce the effective active materials participating in electrochemical reactions. This loss of active materials leads to an overall decline in capacity, a typical manifestation of battery aging.
The incremental capacity (IC) curves are closely related to the performance of the battery. Under different SOH conditions, the peak area of the curves gradually decreases, further indicating a reduction in the effective capacity of the battery. As active materials are lost and side reactions build up, the energy storage capability of the battery progressively declines, and aging becomes more pronounced. As the SOH decreases, the shape of the curves flattens, suggesting an increase in internal resistance, which inhibits the kinetics of electrochemical reactions and impacts overall performance. Additionally, the increased impedance leads to higher heat generation during charging and discharging, accelerating the aging process [30,31,32].
The IC curves at different SOH levels can be used to monitor the health status of the battery and provide insights into capacity loss and kinetic degradation. These curves not only help predict the remaining lifespan of the battery but also serve as an important basis for battery maintenance and early warning. However, a limitation is that they cannot directly confirm the occurrence of lithium plating. Additional methods, such as SEM analysis, are needed for further confirmation.

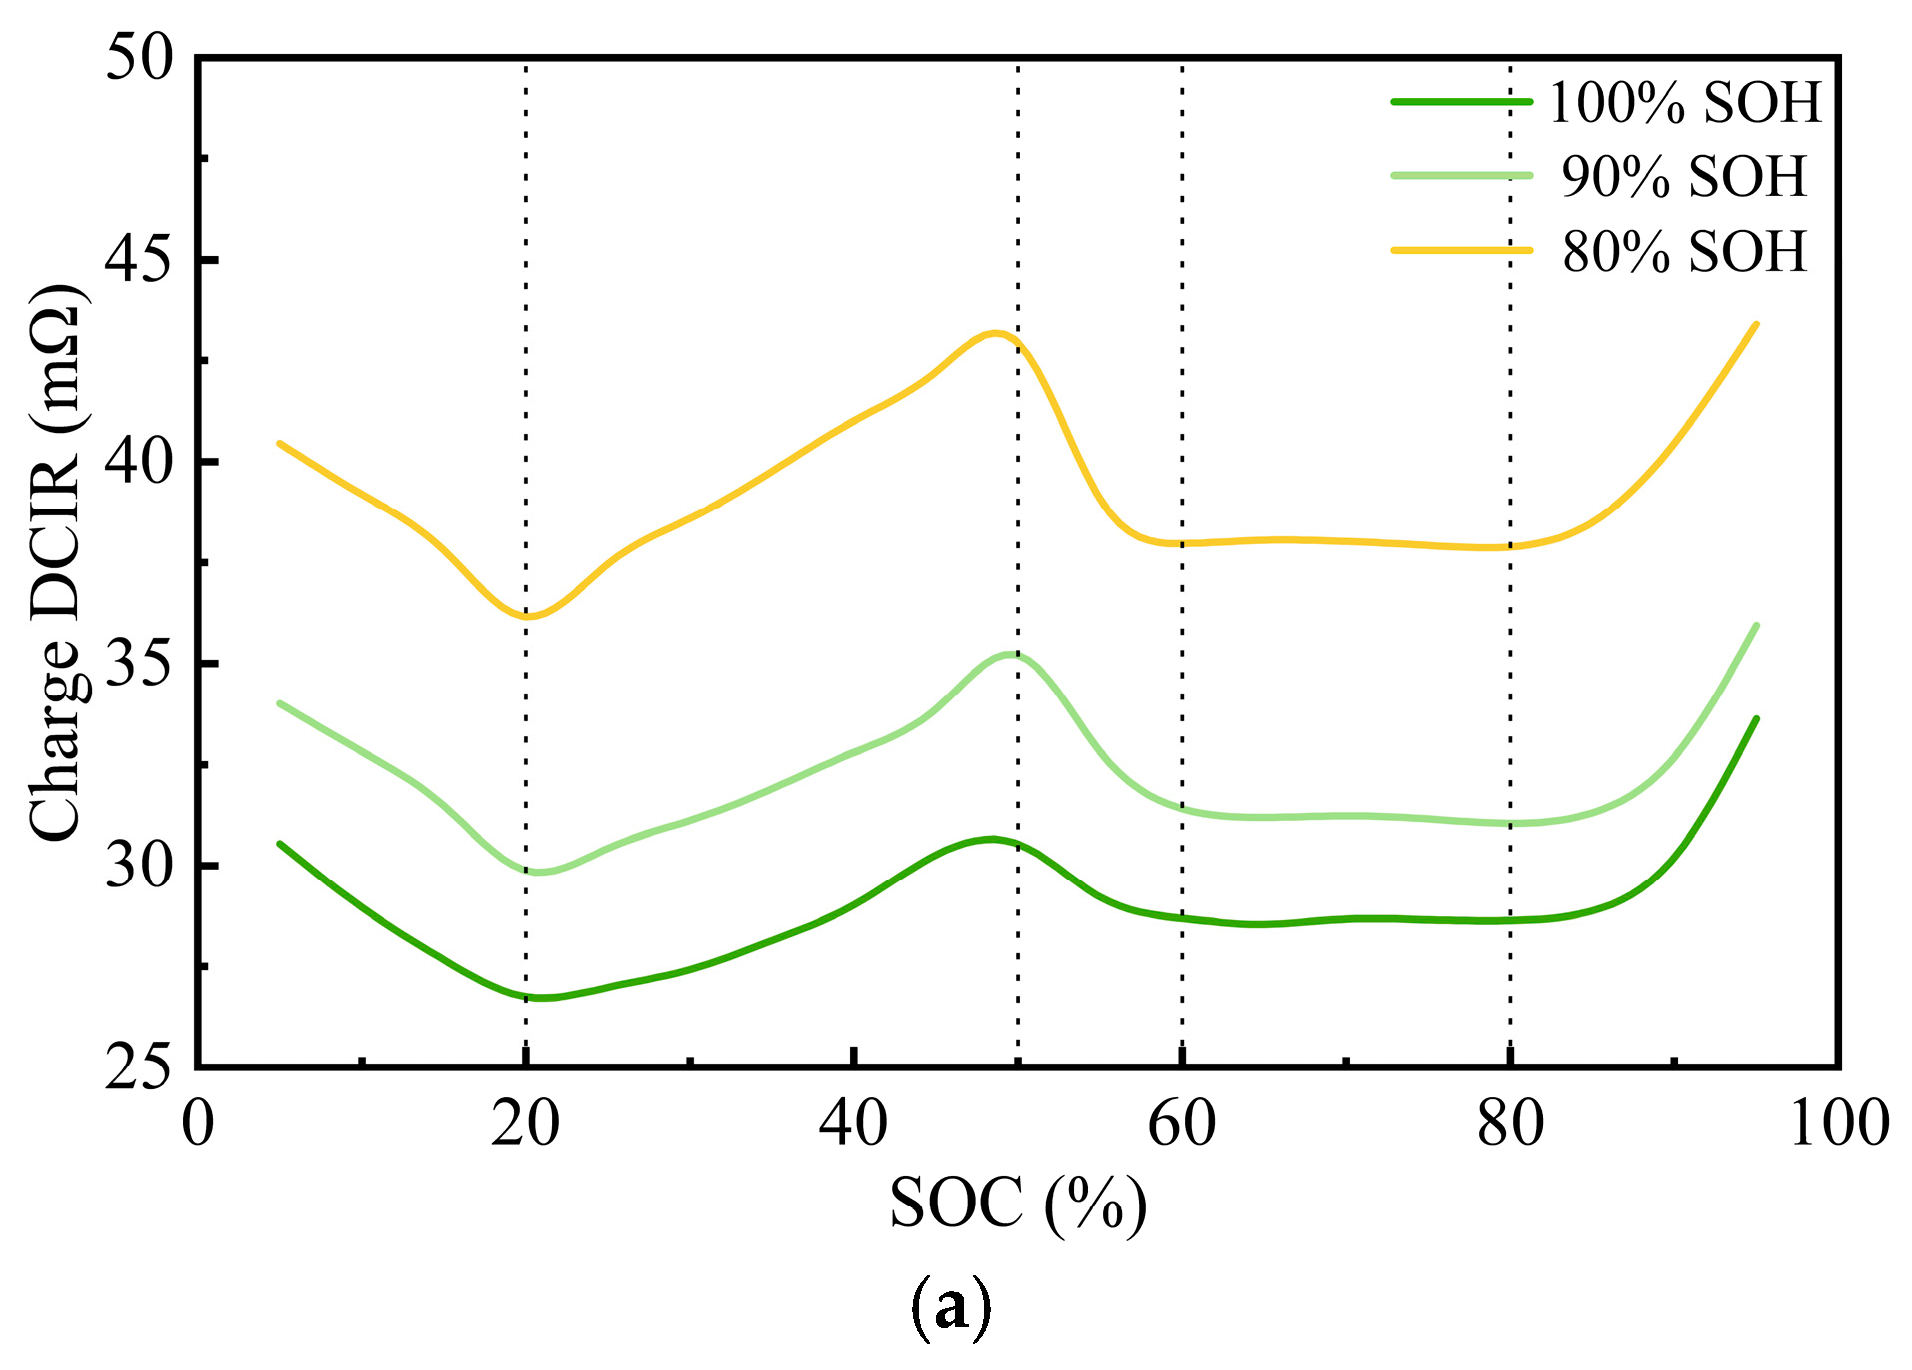
3.1.2. Variations in the DCIR

The trends and characteristic differences in the direct-current internal resistance during charging (DCIRc) from 0% to 100% SOC under different SOH conditions for the samples are shown in Figure 8.
In different SOC regions, the DCIRc exhibits varying magnitudes of change. Overall, the DCIRc gradually decreases at the beginning of charging, reaching its lowest point at 20% SOC. Subsequently, the DCIRc begins to rise, peaking at 50% SOC, then decreases again and stabilizes around 60% SOC, maintaining this state until 80% SOC. Finally, after exceeding 80% SOC, the DCIRc rises once more and continues to increase until the end of charging.
At the start of charging, the activity of the electrode materials is relatively low, resulting in higher initial impedance. As charging progresses, lithium ions gradually and uniformly intercalate and deintercalate into the electrode materials, causing the impedance to decrease. Between 20% and 80% SOC, the battery operates in a relatively stable state, with smaller variations in internal resistance. However, when the SOC exceeds 80%, the battery enters constant-voltage charging mode, where polarization effects become significantly stronger, leading to a continuous rise in the DCIRc. As the SOH decreases, this polarization effect becomes more pronounced, with the curve showing a steeper upward trend and a significant increase in the DCIRc.
As shown in Figure 8b–d, the DCIRc during charging exhibits an increasingly dispersed and SOC-dependent behavior as the SOH declines. At 100% SOH, the DCIRc remains low and stable across the SOC range, indicating minimal aging effects. At 90% SOH, a mild upward trend appears, particularly in the mid-to-high SOC range, accompanied by increased variability. At 80% SOH, the DCIRc increases significantly with the SOC, and data dispersion becomes more pronounced, suggesting aggravated degradation and heterogeneity among the samples.
At 100% SOH, the DCIRc remains relatively low, with smaller variations across the SOC. In contrast, at 90% and 80% SOHs, the DCIRc is generally higher, with notable turning points near 20%, 50%, 60%, and 80% SOC, indicating significant inhomogeneity in impedance changes.
The increase in the DCIRc enhances the thermal effects of the battery, causing more energy to dissipate as heat during charging, which directly impacts the charging efficiency and safety. A higher DCIRc also negatively affects the power performance of the battery, particularly during high-power charging and discharging, during which the battery’s voltage drops significantly, impairing overall performance.

3.2. Analysis of Temperature Increase Differences at Different Locations

The temperature changes at different locations during the battery charging process under various SOH conditions are shown in Figure 9.
Under all SOH conditions, after entering the constant-voltage charging phase, the current of the battery gradually decreased, leading to a reduction in Joule heating and a slowdown in the electrochemical reaction rate. As a result, the temperature began to decline steadily until the end of charging.
At 100% SOH, the temperatures at all four locations gradually increased with a rising SOC, peaking at approximately 70% SOC. The highest temperature was observed at the center of the surface, reaching about 27.63 °C. Throughout the charging process, the center of the surface consistently exhibited the highest temperature. The temperature at the side was slightly lower than that at the center but remained higher than at the other locations. The temperatures at the negative and positive terminals were relatively close but significantly lower than at the side, with the positive terminal being the coolest. This indicated temperature non-uniformity within the battery, particularly with higher temperatures at the center and lower temperatures at the terminals.
At 90% SOH, the temperature curves at all locations followed a similar trend, rising with an increasing SOC and peaking around 78% SOC. The peak temperature, again at the center of the surface, reached approximately 27.97 °C. In this condition, the center remained the hottest, but the temperature rise at the side increased, narrowing the difference with the center. The temperatures at the positive and negative terminals remained relatively low, with the positive terminal being slightly warmer than the negative terminal. This suggests that, despite aging, the center remains the hottest region, while the negative terminal stays cooler.
At 80% SOH, the temperature changes became more pronounced, with steeper temperature curves. The peak temperature occurred around 76% SOC, reaching approximately 27.99 °C. Before 60% SOC, the temperature increase at the center of the surface was slightly higher than at the side. However, after 60% SOC, the temperature difference between these two locations nearly disappeared, with both reaching the highest temperature. This indicates that, after aging, heat accumulation in these regions becomes similar. The temperatures at the positive and negative terminals rose similarly in the initial charging phase, but after 50% SOC, the negative terminal became warmer than the positive terminal. However, the temperature rise at these terminal positions showed a significantly larger gap compared to the center and side positions, highlighting the increased temperature non-uniformity caused by aging.
To further investigate the effect of the charging rate on the thermal behavior, temperature variations at the same locations under lower charging rates of 0.5 C and 1.2 C are presented in Figure 9. Under the 0.5 C charging condition, the overall temperature evolution exhibited a more subdued profile, characterized by a lower temperature increase and reduced fluctuation amplitude over the course of the charging process. In contrast, the temperature evolution under 1.2 C charging closely resembled the trend observed at 1.8 C, suggesting that the location-dependent thermal characteristics remained consistent across different C rates.
Figure 10 illustrates the relationship between capacity fade and the maximum temperature increase at different locations during charging. It can be observed that the maximum temperature increase at the center of the surface remained relatively high and increased as capacity fade progressed. This phenomenon underscores the strong correlation between temperature increase at the center of the surface of the battery and its health status.
As the SOH decreased, the temperature increased at the side, center of the surface, and negative terminal positions during charging. The center consistently exhibited the highest temperature increase, while the side gradually approached that of the center. In contrast, the temperature increase at the negative terminal increased less, resulting in a growing temperature difference between the center, side, and negative terminal.
Significantly, the maximum temperature increase at the positive terminal was lower at 20% capacity fade compared to 10% capacity fade. As the battery ages, changes in internal electrochemical properties may lead to reduced heat generation in certain areas. For the positive terminal, the activity of the electrode material may decrease at 20% capacity fade, altering current distribution and reducing temperature increase. Additionally, aging-induced changes in internal conductive pathways may reduce resistance at the positive terminal, decreasing heat dissipation in this region [33,34]. The reduced temperature increase at the positive terminal may reflect decreased local reaction activity or changes in conductive pathways.
These results demonstrate temperature non-uniformity within the battery during charging. The thermal behavior of different regions varies during battery aging, which is important for understanding internal thermal management and aging behavior. Therefore, when analyzing temperature changes during battery aging, it is essential to consider multiple factors, including electrochemical reactions, conductive pathways, and material degradation, to gain a comprehensive understanding of thermal characteristic changes.
Under all SOH conditions, the center of the surface exhibits the highest temperature increase due to poor heat dissipation. At the side, current concentration [35,36] can lead to localized overpotential and lithium plating [37], causing temperature increases. Elevated temperatures may destabilize or decompose the SEI film on the anode surface, promoting the direct reduction of lithium ions to metallic lithium rather than intercalation, further exacerbating lithium plating. In contrast, the temperature increase at the positive and negative terminals is relatively smaller, and their corresponding lithium plating behavior is investigated in the next section through disassembly studies. The non-uniform thermal distribution within the battery underscores the need for more effective thermal management strategies.
At different aging stages, the temperature increase in the lithium-ion battery showed significant regional variations. At 100% SOH, the surface temperature distribution was relatively uniform, but as the SOH decreased to 90% and 80%, the temperature increase at the center of the surface increased significantly. This indicates that, as aging progresses, the internal heat transfer characteristics of the battery undergo notable changes, likely due to electrolyte decomposition and SEI film growth, which reduce porosity. On the other hand, the smaller temperature increase at the negative terminal suggests an uneven redistribution of current density during aging. Analyzing the temperature increase differences at various locations can further reveal the impact of aging on the internal thermal management characteristics of the battery.

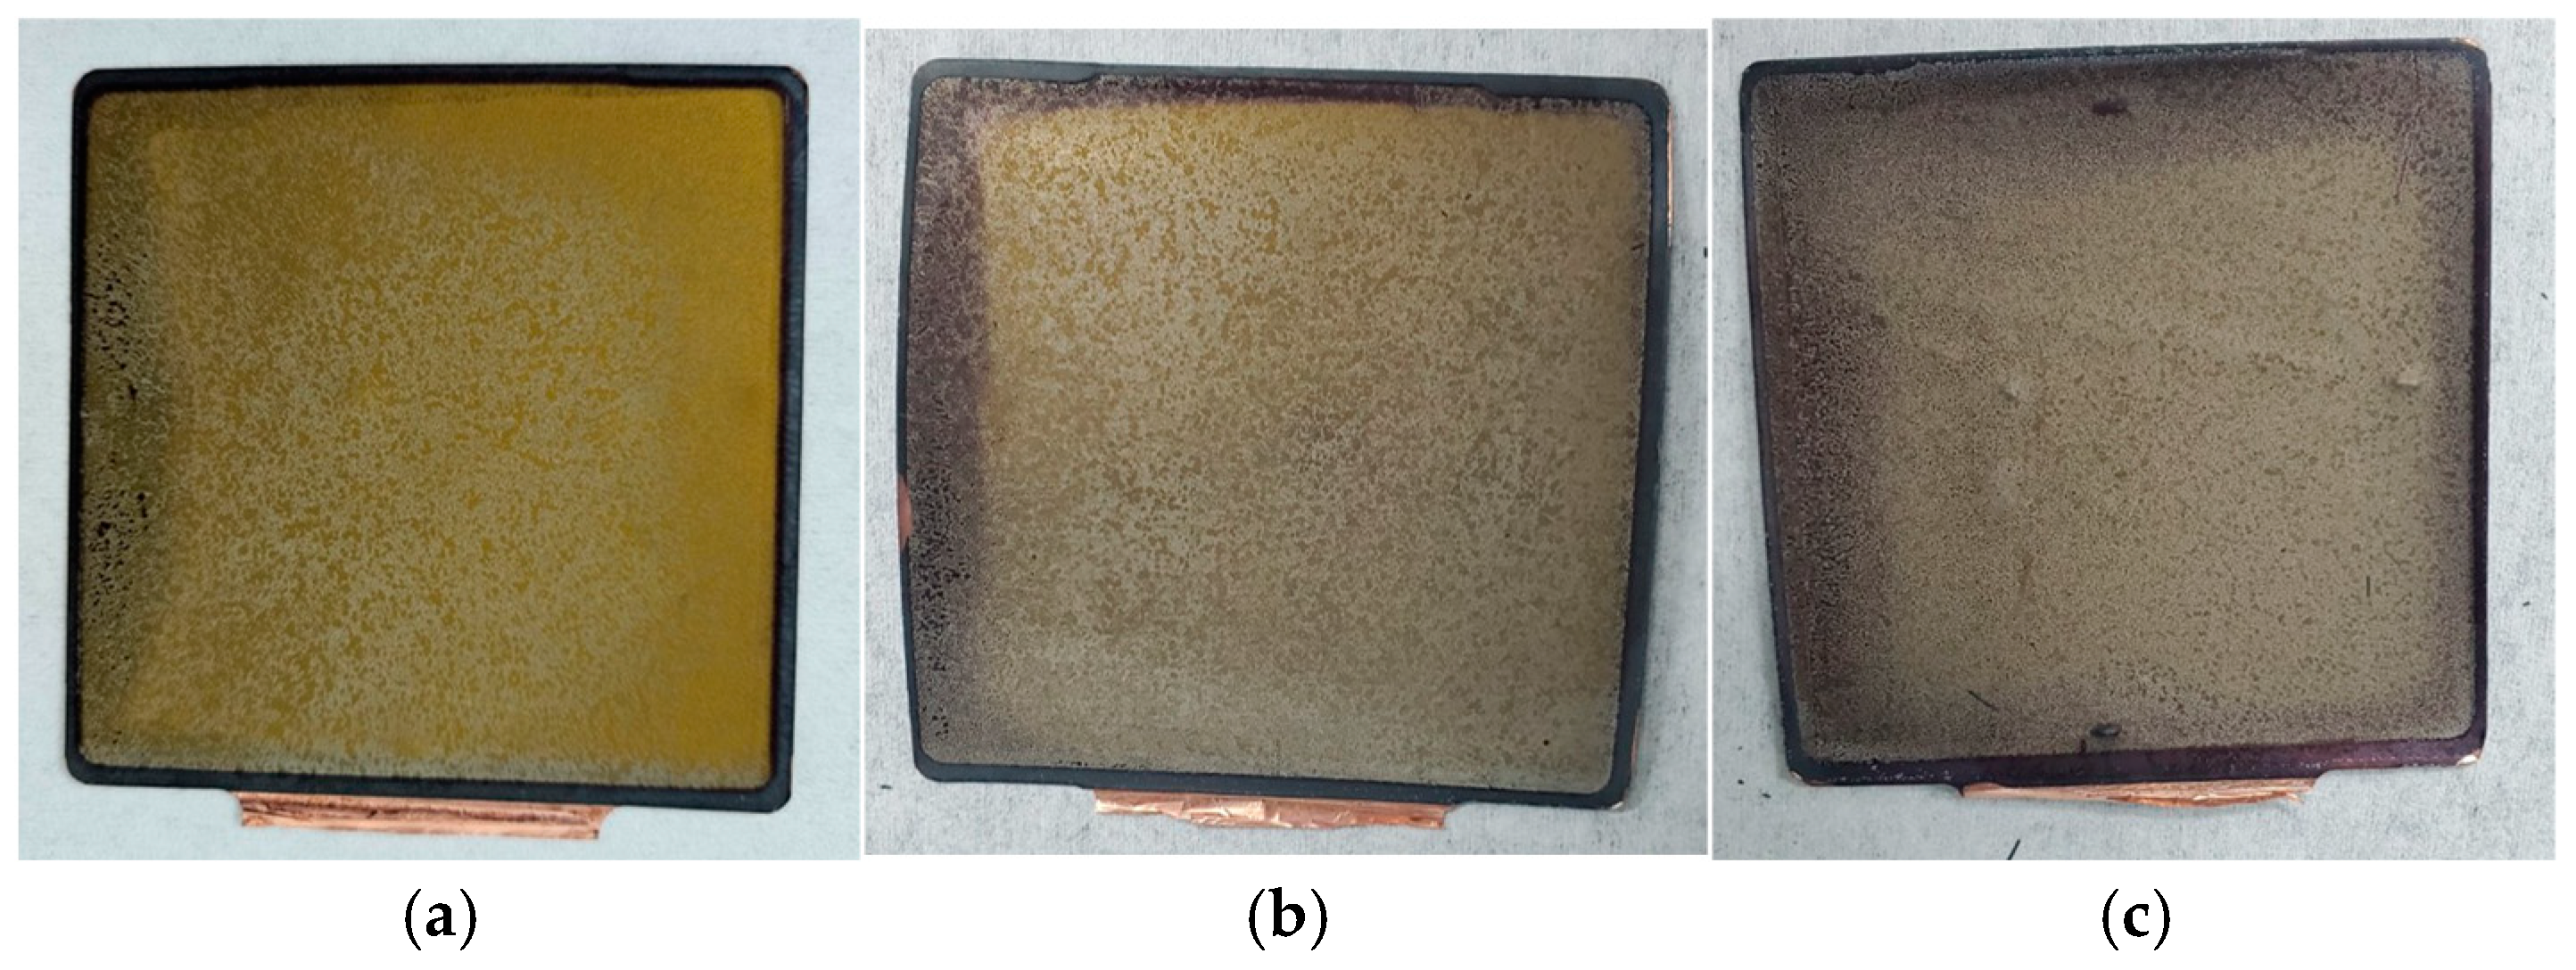
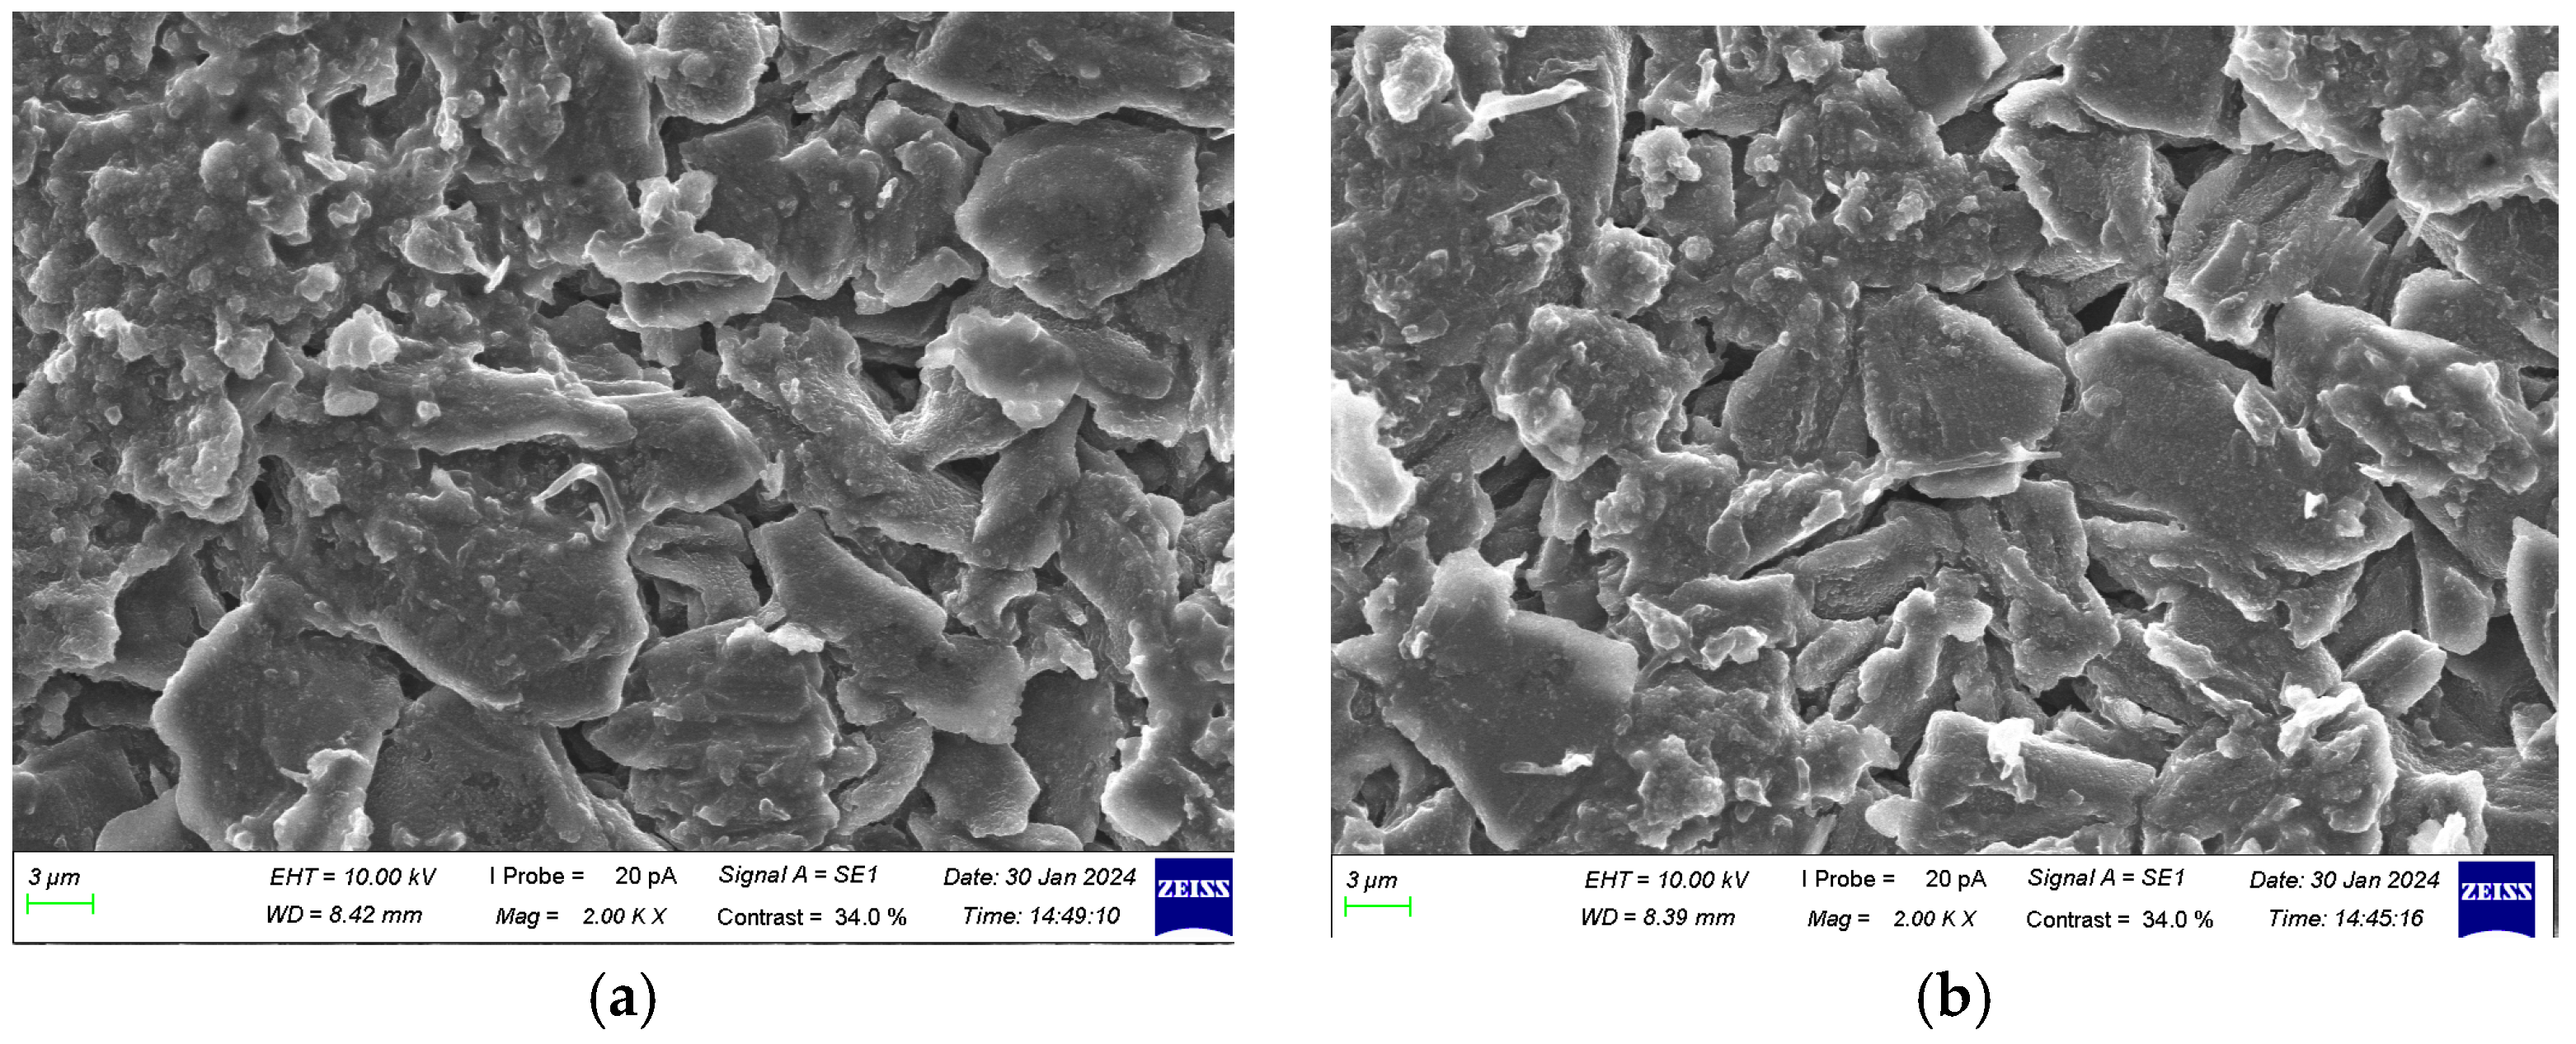
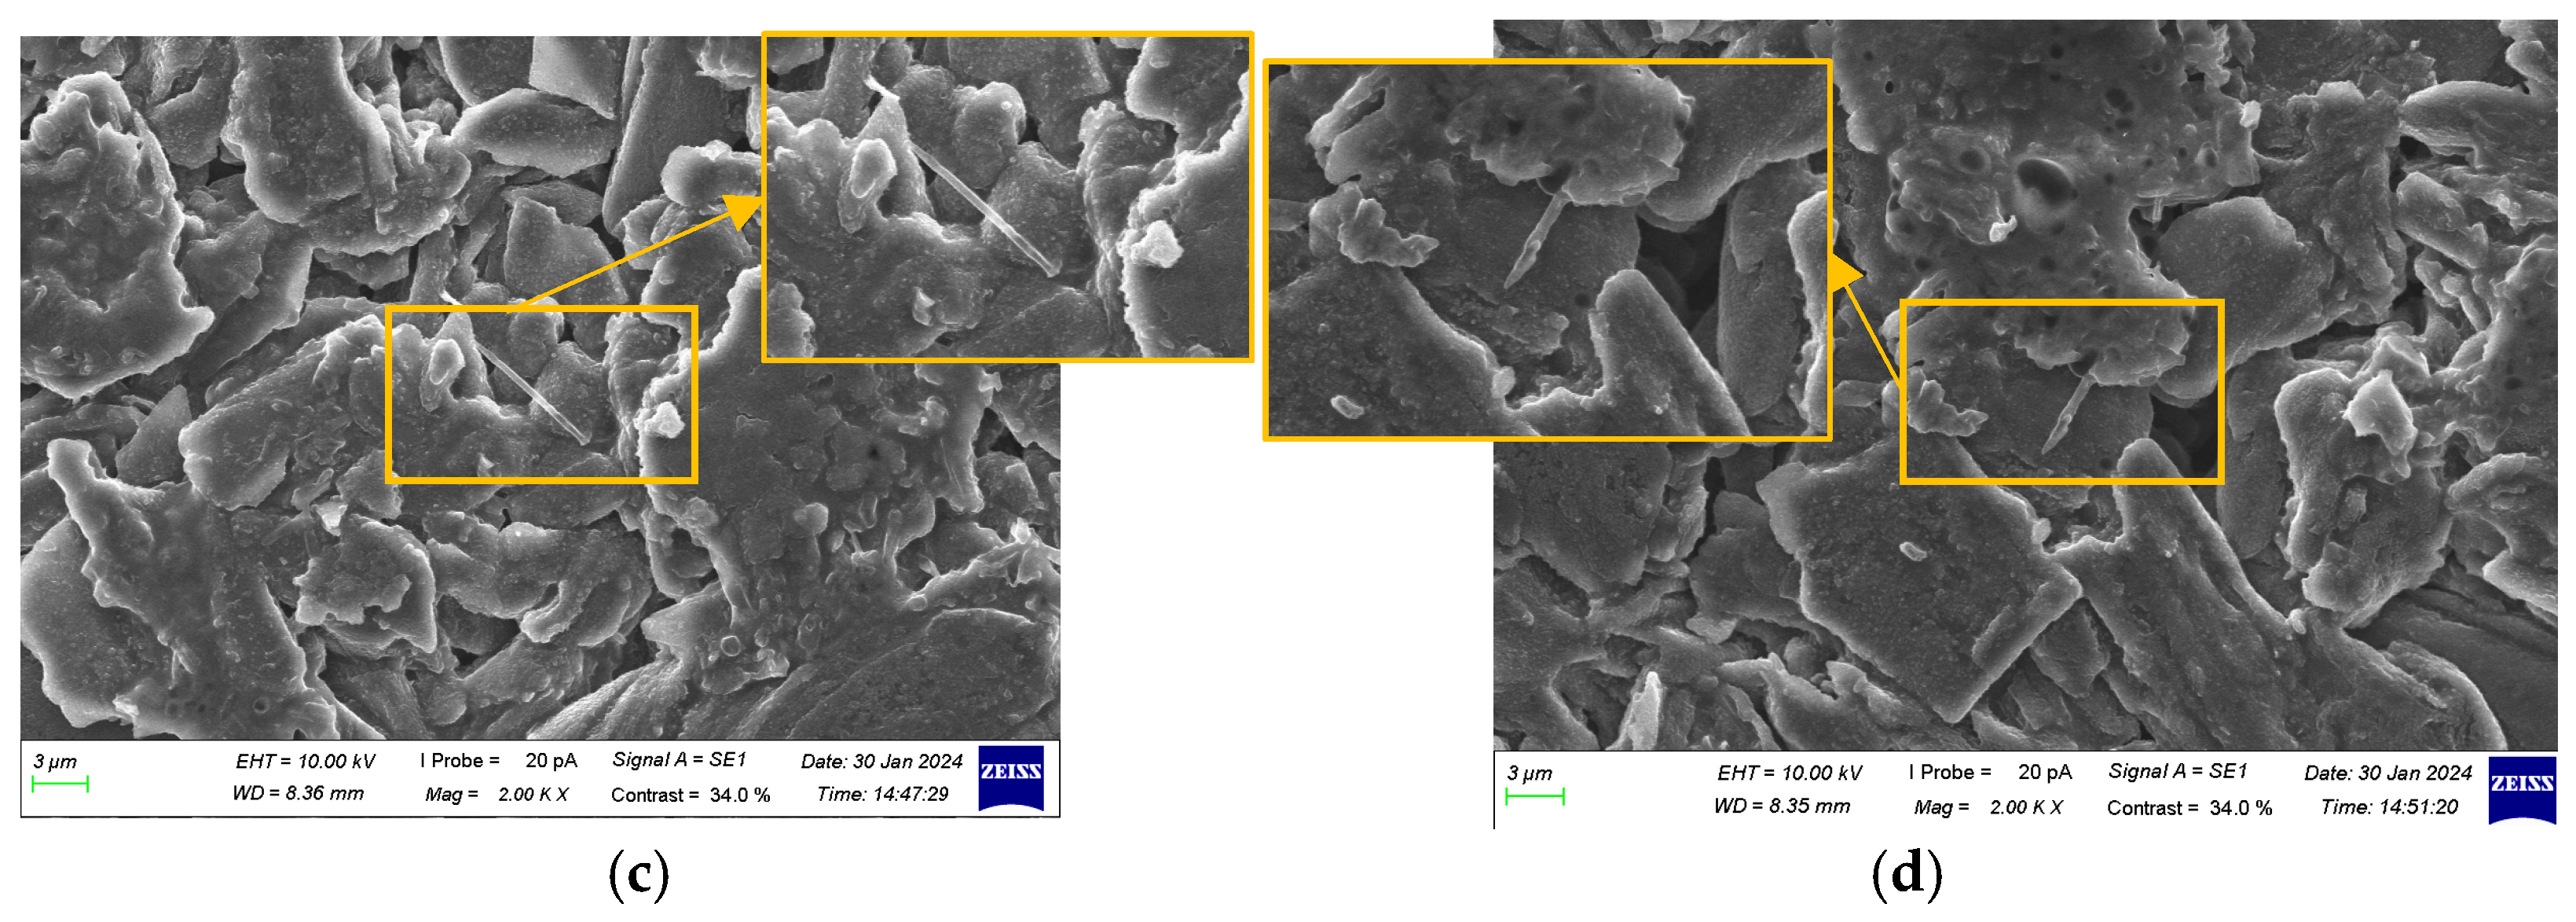
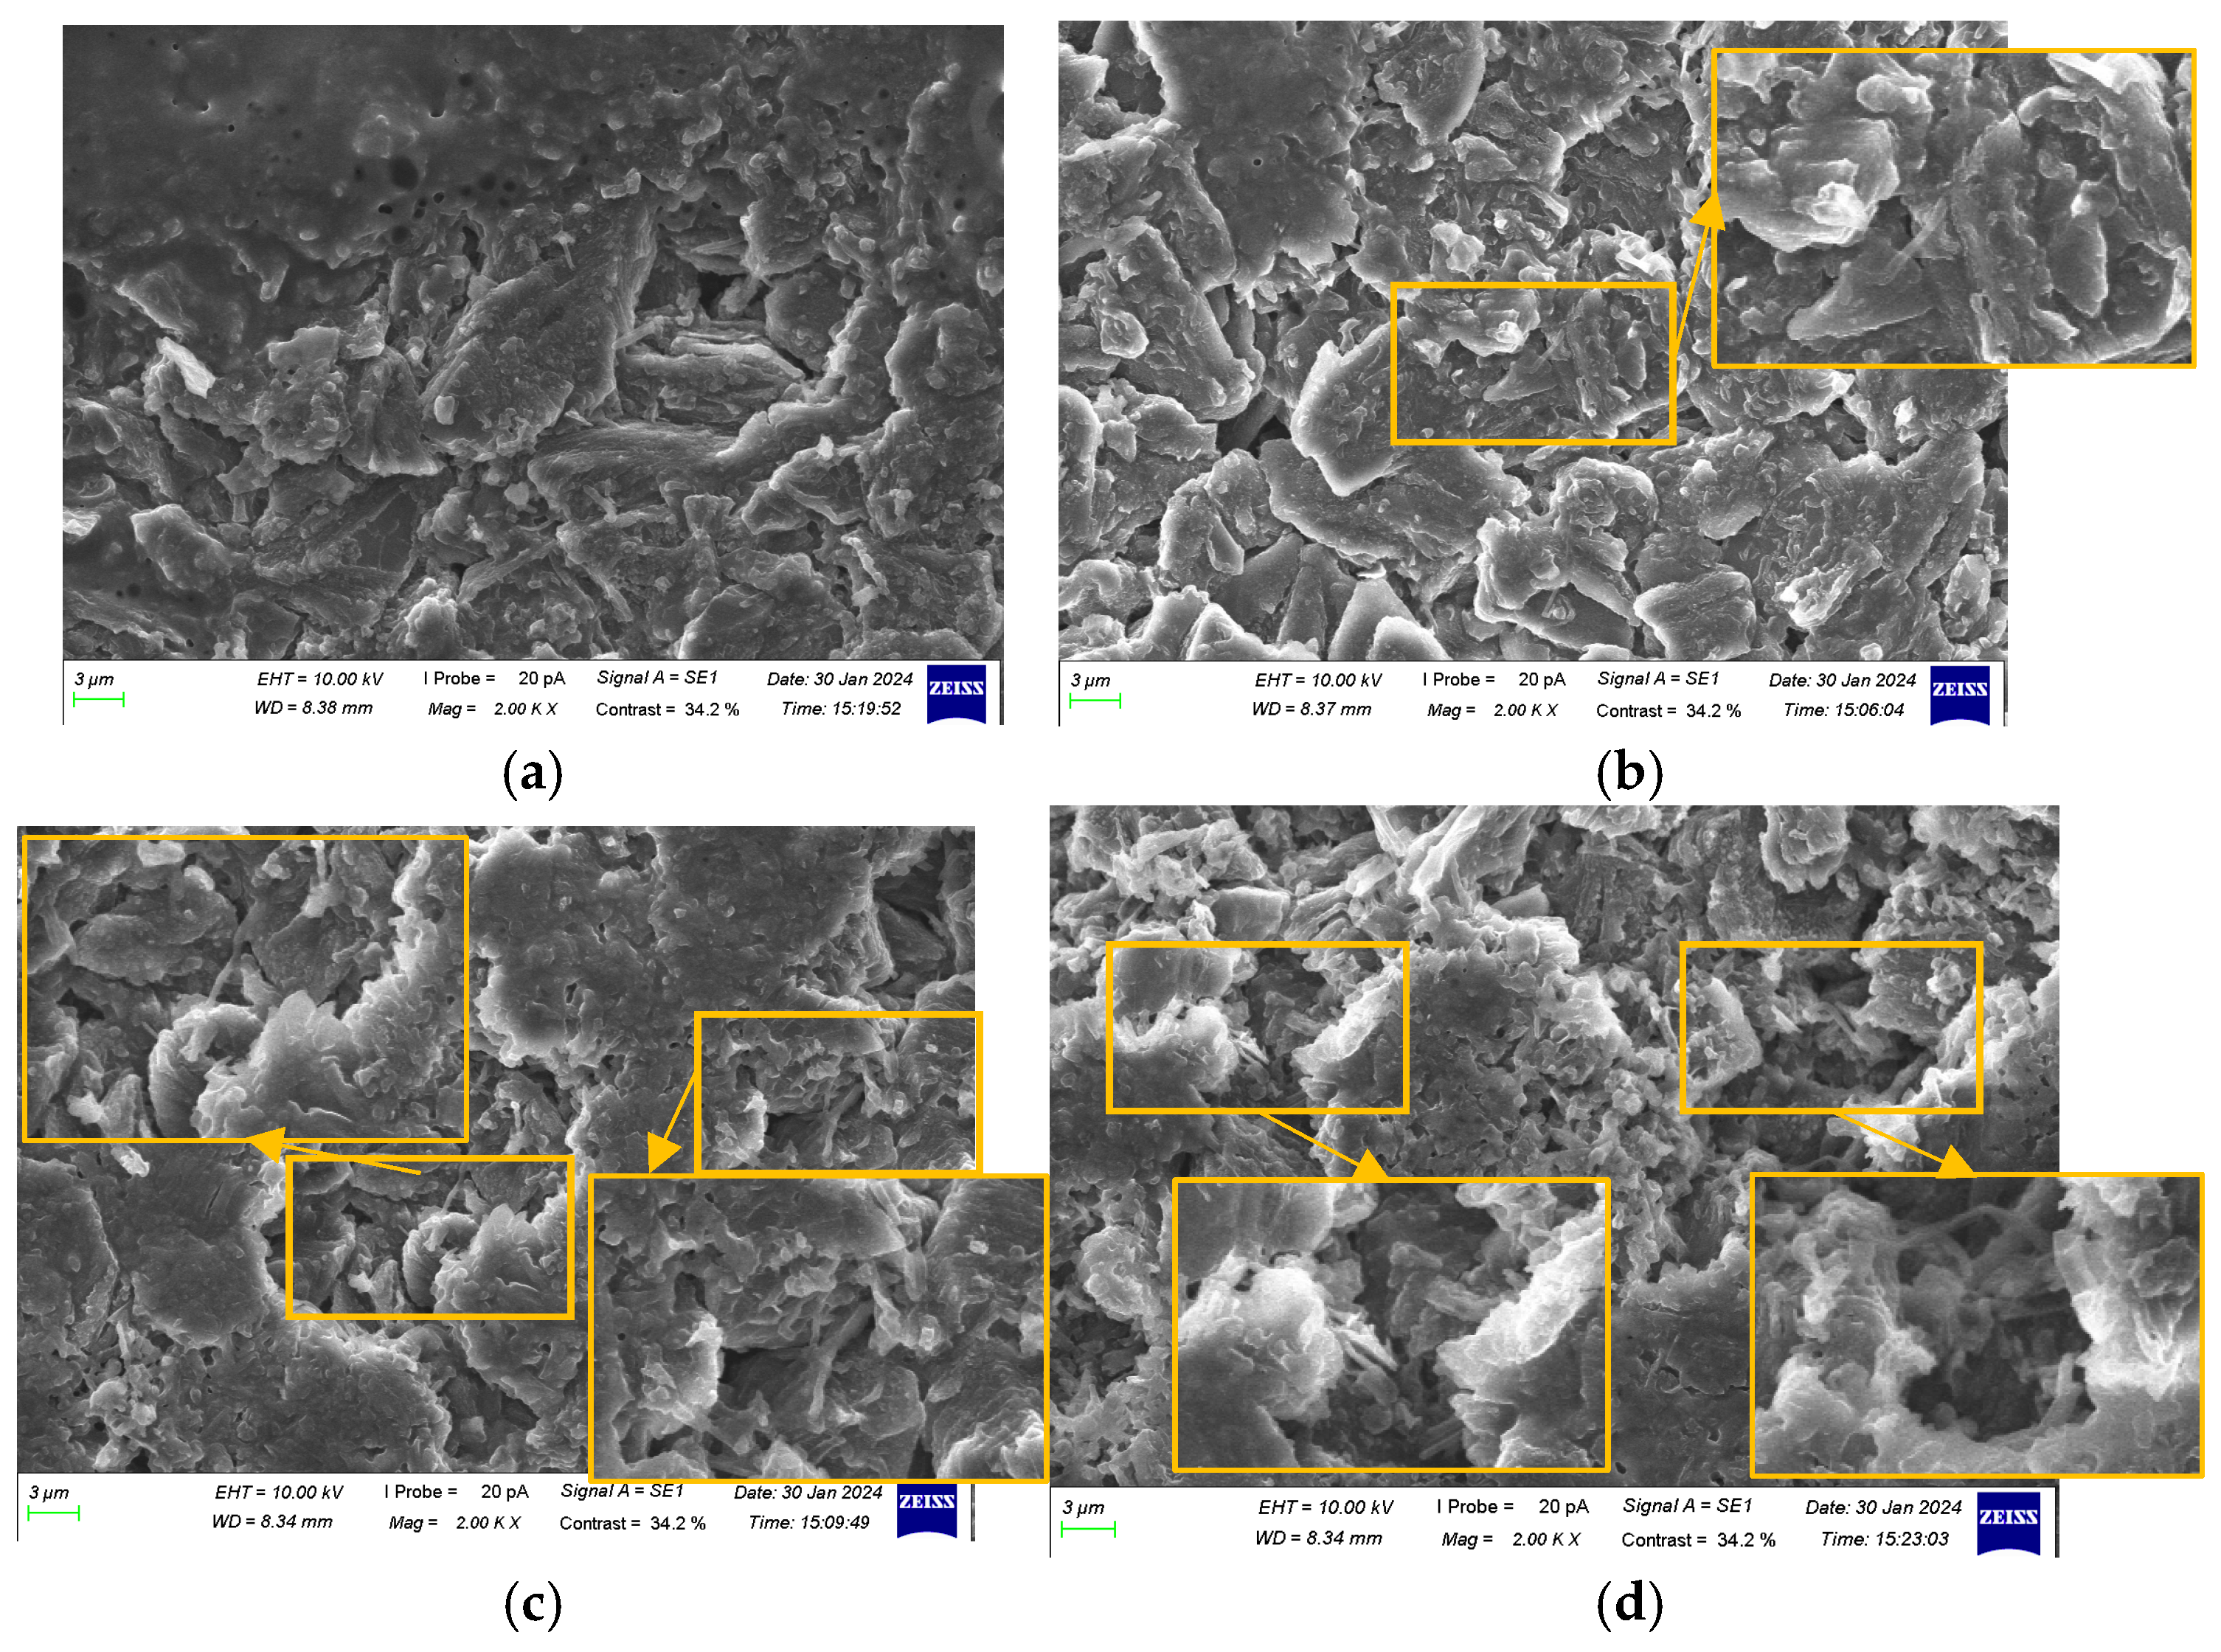
3.3. Morphological Characteristic Analysis of Anode Electrodes at Different SOH Levels

The macroscopic photographs of the disassembled anode electrodes at full charge under different SOH conditions are shown in Figure 11.
At 100% SOH, the surface of the anode electrode appeared relatively moist, predominantly golden in color, with slight browning at the edges. A light gray deposit was visible across the surface. As the SOH decreased to 90%, the surface moisture diminished, although some golden areas remained. The browning at the edges deepened and expanded, and the gray deposits became more pronounced. When the SOH dropped to 80%, the anode surface lost its moisture and became uneven, with the golden sheen completely disappearing. The browning extended into a ring around the edges, and the surface was covered with a grayish substance.
The gradual loss of surface moisture and the emergence of unevenness indicated that the surface condition of the anode was becoming increasingly non-uniform. This non-uniformity can lead to insufficient contact between the anode and the electrolyte during charge–discharge cycles, affecting lithium-ion transport efficiency and overall battery performance.
The golden color of the surface was associated with lithium-ion intercalation into the graphite anode. At full charge, a significant amount of lithium ions intercalated into the graphite layers, forming lithium-carbon compounds which exhibited a metallic or golden sheen. This indicated good lithium-ion intercalation and a clean interface between the anode material and the electrolyte. However, as the battery underwent repeated cycles and aging, lithium-ion intercalation and deintercalation became less uniform. Some lithium ions failed to fully intercalate, leading to localized lithium metal deposition or even dendrite formation, and the amount of lithium-carbon compounds on the surface decreased, causing the golden color to fade.
During the first charging cycle, irreversible reduction reactions occurred at the low potential of the anode, forming an SEI layer. This layer, composed of inorganic and organic compounds, exhibited a gray reflective appearance under light. As the battery cycled, the SEI layer thickened over time and obscured the metallic sheen of the lithium-carbon compounds. Continuous decomposition of the electrolyte and additives resulted in the deposition of by-products, contributing to the brownish appearance. The darker coloration observed near the edges and corners of the anode electrodes, particularly at a lower SOH, reflected an inhomogeneous lithiation of the graphite material. This non-uniform behavior was likely caused by uneven current distribution and localized electrolyte decomposition at the electrode boundaries. Additionally, the presence of brown surface deposits along the electrode edges suggested the formation of decomposition products or surface films during cycling [38,39,40].
The SEM images of the anode electrodes at different aging stages are shown in Figure 12, Figure 13 and Figure 14.
At 100% SOH, the anode surface was relatively smooth and uniform, displaying a flaky or layered structure without significant damage or defects. The boundaries were clear, with no signs of corrosion or oxidation, and some pores or micro-pores were visible. The graphite particles were well arranged, and the crystal structure remained intact. The SEI layer primarily enveloped the particles, with no significant deposits or by-products. A small number of lithium dendrites were observed at the center of the surface and the negative terminal.
At 90% SOH, the anode surface became slightly rougher, showing signs of unevenness, such as tiny cracks and wrinkles. The graphite particles retained their shape, but the layered structure showed slight distortion. Some pores merged and became blocked. The SEI layer became more pronounced, with localized deposits and small patches of attached material. Lithium dendrites were observed at all locations except the positive terminal, with a higher concentration at the center of the surface and near the negative terminal.
At 80% SOH, the anode surface became noticeably rougher, displaying numerous cracks, wrinkles, and defects. The graphite particles underwent significant structural changes, including twisting, fragmentation, and delamination of the layered structure. Large cracks, fractures, and peeling occurred between particles. Pores expanded and merged, and the SEI layer thickened and became uneven, obscuring the original particle structure and resulting in an irregular, blurred appearance. Irregular deposits and by-products accumulated on the anode surface, and lithium dendrites were observed at all locations.
As the battery underwent repeated charge–discharge cycles, the anode material experienced expansion and contraction. The graphite particles exhibited twisting, fragmentation, and delamination, leading to poor inter-particle contact and increased surface roughness. The SEI layer thickened and became more uneven, obscuring the original particle structure and promoting side reactions, which exacerbated lithium plating and degraded battery performance. Deposits and impurities, particularly lithium dendrites, accumulated on the anode surface with increasing cycle numbers.
Microstructural non-uniformity also led to localized increases in current density during cycling, especially in regions with temperature non-uniformity. Temperature data from the previous section indicated significant temperature non-uniformity within the battery, with higher temperatures observed at the center of the surface, particularly at 90% and 80% SOH, where lithium dendrite formation increased significantly. The side edges also experienced relatively high temperatures, particularly as the SOH decreased to 80%, where anode degradation became more pronounced. These results highlighted the varying thermal distribution characteristics across different regions of the battery during aging, underscoring the need for focused design and control strategies to mitigate localized degradation and lithium plating risks. When the anode could not intercalate lithium ions quickly enough in these regions, lithium plating was further promoted, emphasizing the importance of temperature control in reducing lithium plating.

4. Conclusions

This study focused on the performance degradation of ternary pouch lithium-ion batteries during charging at different SOH levels under a constant temperature of 25 °C, analyzing temperature increases and anode aging across various locations. The main conclusions are as follows:
  • Due to the relatively high 1.8 C charging rate, the transport rate of lithium ions between the cathode and anode was limited. Even if lithium plating occurred during charging, the reaction time was insufficient to reveal characteristic peaks, making it difficult to observe the lithium plating peak (Peak III) in the differential capacity curve. This suggests that, under the current experimental conditions, ICA analysis may not be sensitive enough to directly detect lithium plating-related degradation mechanisms.
  • During aging, the temperature at the center of the surface remained consistently high, while the side edges and the center exhibited a relatively uniform thermal distribution. The temperature increase at the negative terminal was smaller, and the temperature increase difference between the center and terminal regions became more pronounced as the battery aged.
  • Repeated cycling caused the SEI layer to repeatedly break and reform, gradually thickening. The layered structure of graphite particles underwent fragmentation, accompanied by the accumulation of by-products, leading to browning on the anode surface. The ability of the anode to intercalate lithium ions gradually declined, with lithium dendrites first appearing at the center of the surface and the negative terminal and progressively increasing across all locations of the anode.
  • Combining temperature increase data with anode aging observations and monitoring temperature increase during charging show promise for assessing battery aging. As the battery aged, the temperature increase at the center of the surface became more significant, accompanied by increased lithium dendrite formation. While the side edges also experienced temperature increases, lithium dendrite formation was less pronounced compared to the center, but severe anode degradation was observed. The negative terminal showed smaller temperature increases and fewer lithium dendrites. In contrast, the temperature increase behavior at the positive terminal was less consistent, making it less suitable for aging assessment through temperature monitoring.
  • The findings of this paper primarily pertain to large-format batteries with pouch battery architecture, where the planar dimensions significantly exceed the transverse dimension. In such batteries, the in-plane distribution of current may be equally important, or even more critical, than the electrochemical behavior in the through-plane direction (i.e., perpendicular to the current collectors). Extrapolation of these results to other battery geometries, such as cylindrical or prismatic formats, requires further investigation.
  • While the findings of this paper cannot be directly applied to determine the SOH, such as providing a real-time value within a battery management system (BMS), they can nonetheless contribute to improving the selection methods for retired batteries intended for second-life applications. In such cases, experiments can be conducted under controlled conditions (outside the vehicle and within a laboratory setting), thereby minimizing the influence of external factors such as ambient temperature, thermal management systems, and other environmental variables.
Monitoring temperature increases provides an effective means of assessing overall battery aging. By monitoring temperature changes in specific regions, the aging state of the entire battery can be inferred. Although temperature increase patterns may vary across different locations, the results of this study indicate that the temperature increase at the center of the surface reliably reflects the overall health and lithium plating status of the battery.
While this paper does not provide an explicit relationship between temperature and SOH, it explores the physical insight into the correlation between the variation in surface temperature non-uniformity and battery aging. A potential application lies in the identification of aging parameters used as physical features for the selection of decommissioned batteries for second-life applications. In battery selection for reuse, it is not necessary to determine the absolute value of the SOH; rather, the objective is to group batteries with similar aging characteristics. Current second-life battery selection and clustering algorithms are primarily based on mathematical approaches that aim to identify statistical correlations, while there is a growing need to strengthen the physical interpretation of such methods. Therefore, the relative temperature differences between batteries, tested under the same controlled conditions, can be incorporated into a more comprehensive evaluation, alongside other features, to improve the accuracy of methods addressing the reuse of decommissioned batteries.
To further improve the applicability of this method in real-world scenarios, future research will focus on the following aspects:
7.
Integration with real-world operational data: Future studies will incorporate field data from batteries operating under dynamic load conditions to refine the temperature–SOH correlation model.
8.
Validation across different battery chemistries and configurations: Additional experiments will be conducted on various battery chemistries, pack configurations, and charge–discharge current rates to assess the generalizability and robustness of the proposed method.
9.
Experimental validation under different ambient temperatures: Since the current study was conducted at a fixed ambient temperature (25 °C), future work will include tests under varying ambient conditions to better understand the influence of environmental temperature on battery temperature increase and its correlation with the SOH.

Author Contributions

H.H.: writing—original draft, conceptualization, methodology, and formal analysis; Y.Z.: writing—original draft, conceptualization, software, and validation; H.H.: writing—review and editing, data curation, and funding acquisition; L.d.: writing—review and editing, data curation, and funding acquisition; S.S.: writing—review and editing, data curation, and formal analysis. All authors have read and agreed to the published version of the manuscript.

Funding

This research was funded by the Fujian Provincial University Industry-University-Research, with Joint Innovation Project grant number 2024H6073.

Data Availability Statement

The original contributions presented in this study are included in the article. Further inquiries can be directed to the corresponding author.

Conflicts of Interest

The authors declare no conflicts of interest.

References

  1. Zeng, X.; Li, M.; El-Hady, D.A.; Alshitari, W.; Al-Bogami, A.S.; Lu, J.; Amine, K. Commercialization of Lithium Battery Technologies for Electric Vehicles. Adv. Energy Mater. 2019, 9, 1900161. [Google Scholar]
  2. Vetter, J.; Novák, P.; Wagner, M.R.; Veit, C.; Möller, K.-C.; Besenhard, J.O.; Winter, M.; Wohlfahrt-Mehrens, M.; Vogler, C.; Hammouche, A. Ageing Mechanisms in Lithium-Ion Batteries. J. Power Sources 2005, 147, 269–281. [Google Scholar] [CrossRef]
  3. Pigłowska, M.; Marcinek, M.; Marczewski, M.; Wieczorek, W. Challenges for Safe Electrolytes Applied in Lithium-Ion Cells—A Review. Materials 2021, 14, 6783. [Google Scholar] [CrossRef]
  4. Rahman, T.; Alharbi, T. Exploring Lithium-Ion Battery Degradation: A Concise Review of Critical Factors, Impacts, Data-Driven Degradation Estimation Techniques, and Sustainable Directions for Energy Storage Systems. Batteries 2024, 10, 220. [Google Scholar] [CrossRef]
  5. Xu, K. Electrolytes and Interphases in Li-Ion Batteries and Beyond. Chem. Rev. 2014, 114, 11503–11618. [Google Scholar] [CrossRef] [PubMed]
  6. Li, Z.; Huang, J.; Yann Liaw, B.; Metzler, V.; Zhang, J. A Review of Lithium Deposition in Lithium-Ion and Lithium Metal Secondary Batteries. J. Power Sources 2014, 254, 168–182. [Google Scholar] [CrossRef]
  7. Alipour, M.; Ziebert, C.; Conte, F.V.; Kizilel, R. A Review on Temperature-Dependent Electrochemical Properties, Aging, and Performance of Lithium-Ion Cells. Batteries 2020, 6, 35. [Google Scholar] [CrossRef]
  8. Mao, N. Experimental Investigation of the Thermal Runaway Mechanisms of Lithium-Ion Batteries Under Overcharge and Other Conditions. Ph.D. Thesis, University of Surrey, Guildford, UK, 2023. [Google Scholar]
  9. Yang, Y.; Wang, R.; Shen, Z.; Yu, Q.; Xiong, R.; Shen, W. Towards a Safer Lithium-Ion Batteries: A Critical Review on Cause, Characteristics, Warning and Disposal Strategy for Thermal Runaway. Adv. Appl. Energy 2023, 11, 100146. [Google Scholar] [CrossRef]
  10. Hu, X.; Gao, F.; Xiao, Y.; Wang, D.; Gao, Z.; Huang, Z.; Ren, S.; Jiang, N.; Wu, S. Advancements in the Safety of Lithium-Ion Battery: The Trigger, Consequence and Mitigation Method of Thermal Runaway. Chem. Eng. J. 2024, 481, 148450. [Google Scholar] [CrossRef]
  11. Sharma, D.; Kumar, A. Experimental and Numerical Investigation of Thermal Performance of an Air-Cooled Battery Module Under High Ambient Temperature Conditions. J. Therm. Sci. Eng. Appl. 2023, 15, 091006. [Google Scholar]
  12. Xu, X.M.; He, R. Review on the Heat Dissipation Performance of Battery Pack with Different Structures and Operation Conditions. Renew. Sustain. Energy Rev. 2014, 29, 301–315. [Google Scholar]
  13. Onda, K.; Ohshima, T.; Nakayama, M.; Fukuda, K.; Araki, T. Thermal Behavior of Small Lithium-Ion Battery During Rapid Charge and Discharge Cycles. J. Power Sources 2006, 158, 535–542. [Google Scholar] [CrossRef]
  14. Cheng, J.; Shuai, S.; Zhao, R.; Tang, Z. Numerical Analysis of Heat-Pipe-Based Battery Thermal Management System for Prismatic Lithium-Ion Batteries. J. Therm. Sci. Eng. Appl. 2022, 14, 081008. [Google Scholar] [CrossRef]
  15. Zhu, C.; Li, X.; Song, L.; Xiang, L. Development of a Theoretically Based Thermal Model for Lithium Ion Battery Pack. J. Power Sources 2013, 223, 155–164. [Google Scholar] [CrossRef]
  16. Liu, H.; Wang, Z.; He, W.; Wang, J. Thermal Issues about Li-Ion Batteries and Recent Progress in Battery Thermal Management Systems: A Review. Energy Convers. Manag. 2017, 150, 304–330. [Google Scholar]
  17. Wang, Q.K.; He, Y.J.; Shen, J.N.; Hu, X.S.; Ma, Z.F. State of Charge-Dependent Polynomial Equivalent Circuit Modeling for Electrochemical Impedance Spectroscopy of Lithium-Ion Batteries. IEEE Trans. Power Electron. 2017, 33, 8449–8460. [Google Scholar] [CrossRef]
  18. Castaings, A.; Lhomme, W.; Trigui, R.; Bouscayrol, A. Comparison of Energy Management Strategies of a Battery/Supercapacitors System for Electric Vehicle under Real-Time Constraints. Appl. Energy 2016, 163, 190–200. [Google Scholar] [CrossRef]
  19. Wang, S.; Zhang, J.; Gharbi, O.; Vivier, V.; Gao, M.; Orazem, M.E. Electrochemical Impedance Spectroscopy. Nat. Rev. Methods Primers 2021, 1, 41. [Google Scholar]
  20. Gao, Y.; Jiang, J.; Zhang, C.; Zhang, W.; Jiang, Y. Aging Mechanisms under Different State-of-Charge Ranges and the Multi-Indicators System of State-of-Health for Lithium-Ion Battery with Li(NiMnCo)O2 Cathode. J. Power Sources 2018, 400, 641–656. [Google Scholar]
  21. DOE/ID-11069; FreedomCAR Battery Test Manual for Power-Assist Hybrid Electric Vehicles. Idaho National Laboratory: Idaho Falls, ID, USA, 2003.
  22. Broussely, M.; Biensan, P.; Bonhomme, F.; Blanchard, P.; Herreyre, S.; Nechev, K.; Sta-niewicz, R.J. Main Aging Mechanisms in Li Ion Batteries. J. Power Sources 2005, 146, 90–96. [Google Scholar] [CrossRef]
  23. Rong, G.; Zhang, X.; Zhao, W.; Qiu, Y.; Liu, M.; Ye, F.; Xu, Y. Liquid-Phase Electrochemical Scanning Electron Microscopy for in Situ Investigation of Lithium Dendrite Growth and Dissolution. Adv. Mater. 2017, 29, 1606187. [Google Scholar] [CrossRef] [PubMed]
  24. Abubaker, M.; Sohn, C.-H.; Ali, H.M. Understanding Wetting Behavior in Electrode-Electrolyte Interface Formation and Its Sensitivity to Electrode-Current Collector Interaction: A Lattice Boltzmann Method Approach. J. Therm. Anal. Calorim. 2024, 149, 5443–5456. [Google Scholar] [CrossRef]
  25. Zhao, D.; Li, S. Regulating the Performance of Lithium-Ion Battery Focus on the Electrode-Electrolyte Interface. Front. Chem. 2020, 8, 821. [Google Scholar] [CrossRef]
  26. Mao, N.; Zhang, T.; Wang, Z.; Cai, Q. A Systematic Investigation of Internal Physical and Chemical Changes of Lithium-Ion Batteries During Overcharge. J. Mater. Chem. A Mater. Energy Sustain. 2022, 518, 230767. [Google Scholar] [CrossRef]
  27. Dubarry, M.; Truchot, C.; Cugnet, M.; Bor Yann Liaw, K.; Gering, S.; Sazhin, D.; Jamison, C. Evaluation of Commercial Lithium-Ion Cells Based on Composite Positive Electrode for Plug-in Hybrid Electric vehicle Applications. Part I: Initial Characterizations. J. Power Sources 2011, 196, 10328–10335. [Google Scholar] [CrossRef]
  28. Li, Y.; Abdel-Monem, M.; Gopalakrishnan, R.; Berecibar, M.; Nanini-Maury, E.; Omar, N.; van den Bossche, P.; Van Mierlo, J. A Quick On-Line State of Health Estimation Method for Li-Ion Battery with Incremental Capacity Curves Processed by Gaussian Filter. J. Power Sources 2018, 373, 40–53. [Google Scholar] [CrossRef]
  29. Waldmann, T.; Hogg, B.-I.; Wohlfahrt-Mehrens, M. Li Plating as Unwanted Side Reaction in Commercial Li-Ion Cells—A Review. J. Power Sources 2018, 384, 107–124. [Google Scholar]
  30. Doyle, M.; Newman, J.; Gozdz, A.S.; Schmutz, C.N.; Tarascon, J.-M. Comparison of Modeling Predictions with Experimental Data from Plastic Lithium Ion Cells. J. Electrochem. Soc. 1996, 143, 1890. [Google Scholar] [CrossRef]
  31. Fuller, T.F.; Doyle, M.; Newman, J. Simulation and Optimization of the Dual Lithium Ion Insertion Cell. J. Electrochem. Soc. 1994, 141, 1–10. [Google Scholar] [CrossRef]
  32. Davis, A.L.; Goel, V.; Liao, D.W.; Main, M.N.; Kazyak, E.; Lee, J.; Thornton, K.; Dasgupta, N.P. Rate Limitations in Composite Solid-State Battery Electrodes: Revealing Heterogeneity with Operando Microscopy. ACS Energy Lett. 2021, 6, 2993–3003. [Google Scholar] [CrossRef]
  33. Hu, X.; Li, S.; Peng, H. A Comparative Study of Equivalent Circuit Models for Li-Ion Batteries. J. Power Sources 2012, 198, 359–367. [Google Scholar] [CrossRef]
  34. Jaguemont, J.; Boulon, L.; Dubé, Y. A Comprehensive Review of Lithi-Um-Ion Batteries Used in Hybrid and Electric Vehicles at Cold Temperatures. Appl. Energy 2016, 164, 99–114. [Google Scholar] [CrossRef]
  35. Taheri, P.; Mansouri, A.; Mar-Yam, Y.; Bahrami, M. Theoretical Analysis of Potential and Current Distributions in Planar Electrodes of Lithi-Um-Ion Batteries. Electrochim. Acta 2014, 133, 197–208. [Google Scholar] [CrossRef]
  36. Xu, M.; Zhang, Z.; Wang, X.; Jia, L.; Yang, L. A Pseudo Three-Dimensional Electrochemical-Thermal Model of a Prismatic LiFePO4 Battery During Discharge Process. Energy 2015, 80, 303–317. [Google Scholar] [CrossRef]
  37. Xu, J.; Lin, F.; Doeff, M.M.; Tong, W. A Review of Ni-Based Layered Oxides for Re-chargeable Li-Ion Batteries. J. Mater. Chem. A Mater. Energy Sustain. 2017, 5, 874–901. [Google Scholar] [CrossRef]
  38. Deich, T.; Storch, M.; Steiner, K.; Bund, A. Effects of Module Stiffness and Initial Compression on Lithium-Ion Cell Aging. J. Power Sources 2021, 506, 230163. [Google Scholar] [CrossRef]
  39. Cannarella, J.; Arnold, C.B. Stress Evolution and Capacity Fade in Constrained Lithium-Ion Pouch Cells. J. Power Sources 2014, 245, 745–751. [Google Scholar] [CrossRef]
  40. Cannarella, J.; Arnold, C.B. State of Health and Charge Measurements in Lithium-Ion Batteries Using Mechanical Stress. J. Power Sources 2014, 269, 7–14. [Google Scholar] [CrossRef]
Figure 1. Testing equipment.
Batteries 11 00150 g001
Figure 2. A single pulse.
Batteries 11 00150 g002
Figure 3. Pouch battery and NTC sensor setup: (a) pouch battery layout and (b) NTC sensor placement on battery.
Batteries 11 00150 g003
Figure 4. Electrode sample fixed on the sample holder.
Batteries 11 00150 g004
Figure 5. Maximum capacity retention rate of cycled battery.
Batteries 11 00150 g005
Figure 6. Battery voltage curves during 1.8 C charging at different SOH levels.
Batteries 11 00150 g006
Figure 7. Differential capacity curves during 1.8 C charging at different SOH levels.
Batteries 11 00150 g007
Figure 8. DCIR during charging at different SOH levels: (a) under different SOHs; (b) box plot at 100% SOH; (c) box plot at 90% SOH; and (d) box plot at 80% SOH.
Batteries 11 00150 g008aBatteries 11 00150 g008b
Figure 9. Temperature variations at different locations during 0.5 C/1.2 C/1.8 C charging at different SOH levels: (a) 100% SOH; (b) 90% SOH; and (c) 80% SOH.
Batteries 11 00150 g009
Figure 10. Capacity fade vs. maximum temperature increase at different locations during charging.
Batteries 11 00150 g010
Figure 11. Anode electrodes at different SOH levels: (a) 100% SOH; (b) 90% SOH; and (c) 80% SOH.
Batteries 11 00150 g011
Figure 12. Characterization of anode electrodes at 100% SOH: (a) positive terminal; (b) side edge; (c) center of surface; and (d) negative terminal.
Batteries 11 00150 g012aBatteries 11 00150 g012b
Figure 13. Characterization of anode electrodes at 90% SOH: (a) positive terminal; (b) side edge; (c) center of surface; and (d) negative terminal.
Batteries 11 00150 g013
Figure 14. Characterization of anode electrodes at 80% SOH: (a) positive terminal; (b) side edge; (c) center of surface; and (d) negative terminal.
Batteries 11 00150 g014
Table 1. Battery parameters.
ParameterSpecification
Cathode Material
Anode Material
NCM622
Graphite
Rated Capacity2.1 Ah
Nominal Voltage3.8 V
Operating Voltage2.75~4.35 V
Dimensions126 mm × 96 mm
Mass43 g
Table 2. Charge–discharge cycle steps.
StepProcedureTermination
Condition
1Constant-Voltage Charging at 4.35 V with 1.8 C CurrentCharging
Current ≤ 0.05 C
2Restingt = 0.5 h
3Constant Current
Discharge at 1 C
Terminal
Voltage ≤ 2.75 V
4Restingt = 1 h
5Repeat Steps 1 to 4SOH Reduced
to 90%, 80%
Table 3. Battery pulse DCIR test procedure setup.
StepProcedureSetup Conditions
1CC-CV ChargingCharge 5% SOC
2Restingt = 1 h
3Pulse DischargeI = 1 C, t = 10 s
4Restingt = 40 s
5Pulse ChargingI = 1 C, t = 10 s
6Restingt = 1 h
7Repeat Steps 1 to 6Cycle 18 Times Until Fully Charged
Disclaimer/Publisher’s Note: The statements, opinions and data contained in all publications are solely those of the individual author(s) and contributor(s) and not of MDPI and/or the editor(s). MDPI and/or the editor(s) disclaim responsibility for any injury to people or property resulting from any ideas, methods, instructions or products referred to in the content.

